

Census data for US communities
Population, income, housing, education and commuting for every state, all 3,222 US counties, 31,748 cities, towns and other places, 935 metro and micro areas and 33,174 ZIP codes, and every town and township, school district, congressional district, state legislative district, urban area and tribal area: 113,375 profiles, each compared with its state and the nation. Free, with no account.
Largest cities
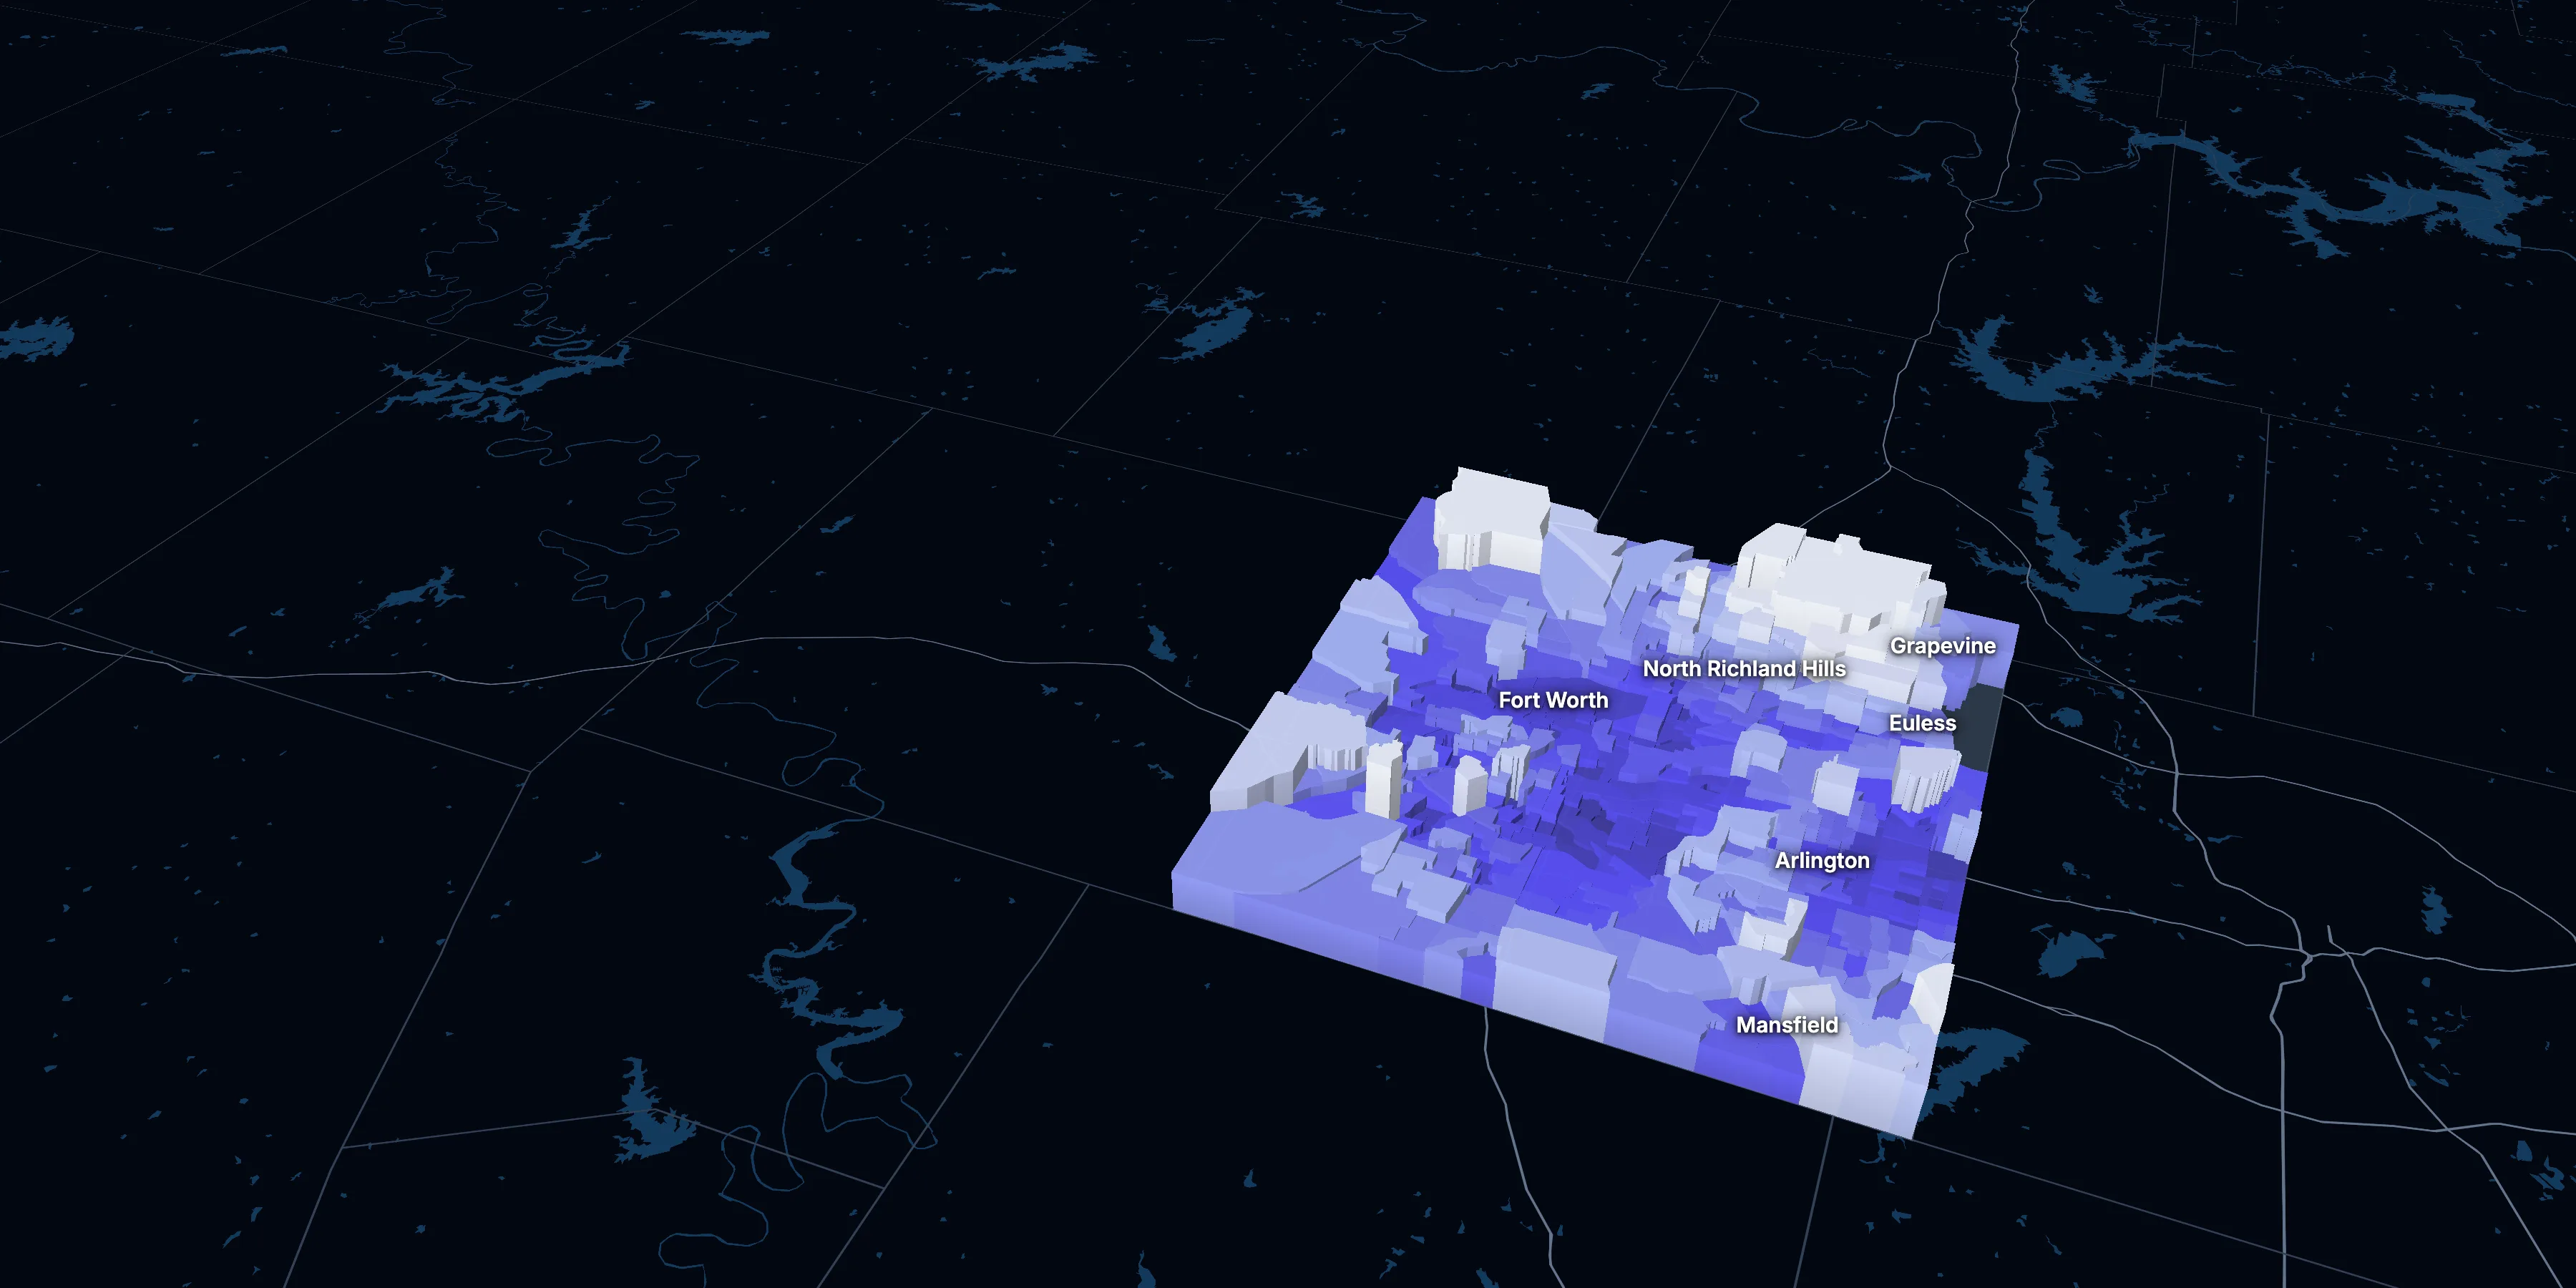
Pictured: Tarrant County, Texas. Taller, lighter tracts have higher household incomes.
Browse by state
- Alabama67
- Alaska30
- Arizona15
- Arkansas75
- California58
- Colorado64
- Connecticut9
- Delaware3
- District of Columbia1
- Florida67
- Georgia159
- Hawaii5
- Idaho44
- Illinois102
- Indiana92
- Iowa99
- Kansas105
- Kentucky120
- Louisiana64
- Maine16
- Maryland24
- Massachusetts14
- Michigan83
- Minnesota87
- Mississippi82
- Missouri115
- Montana56
- Nebraska93
- Nevada17
- New Hampshire10
- New Jersey21
- New Mexico33
- New York62
- North Carolina100
- North Dakota53
- Ohio88
- Oklahoma77
- Oregon36
- Pennsylvania67
- Puerto Rico78
- Rhode Island5
- South Carolina46
- South Dakota66
- Tennessee95
- Texas254
- Utah29
- Vermont14
- Virginia133
- Washington39
- West Virginia55
- Wisconsin72
- Wyoming23
The United StatesRegions and divisionsAll 935 metro and micro areasAll 33,174 ZIP codes, by stateUrban areasTribal areas
The number beside each state is how many counties or county equivalents it has. Each state’s page lists everything in it: its towns and townships, school districts, and congressional and legislative districts too. Population figures on these pages are ACS 2020–2024 5-year estimates. Puerto Rico is included; the island territories aren’t, as the American Community Survey doesn’t cover them.
What’s in a profile
- Every chart beside the state and the nation, so a number has something to be measured against.
- A map of every census tract, with six measures and a 3D view, and the tracts furthest from the place’s average.
- Ten years of change, year by year, with dollars adjusted for inflation.
- Tables, a CSV download, citations and embeds, with the source table named on each.
Median home value, in 2025 dollars
+66.8% in the county, +52.8% in Texas and +39.3% in the US.
Source: ACS 1-year, 2015 to 2025, table A10036.
Show data
| Tarrant County | Texas | United States | |
|---|---|---|---|
| 2015 | $209,887 | $208,243 | $266,469 |
| 2016 | $227,909 | $218,441 | $277,278 |
| 2017 | $246,547 | $228,010 | $288,124 |
| 2018 | $271,444 | $240,422 | $296,908 |
| 2019 | $289,085 | $254,425 | $305,336 |
| 2021 | $321,422 | $284,404 | $337,116 |
| 2022 | $345,511 | $305,078 | $355,481 |
| 2023 | $357,463 | $315,865 | $361,931 |
| 2024 | $363,693 | $323,696 | $372,685 |
| 2025 | $350,100 | $318,100 | $371,100 |
Embed
Turn any place into your planning report.
Social Explorer Studio builds an editable profile of any place, with tables and charts beside the county and state, and exports to Word, PDF and Excel.