

Montana: Population, demographics and census data
Home to 1,144,694 people, the 43rd largest of the 50 states and DC, anchored by Billings and Missoula. It grew 10.8% between 2015 and 2025.
- Population
- 1.14M. Census Bureau estimate · Rank 43 of the 50 states and DC
- Median household income
- $77,099 ±$2,479. US $84,780
- Median age
- 41.0 ±0.4. US 39.5
ACS 2025 1-year estimates, U.S. Census Bureau
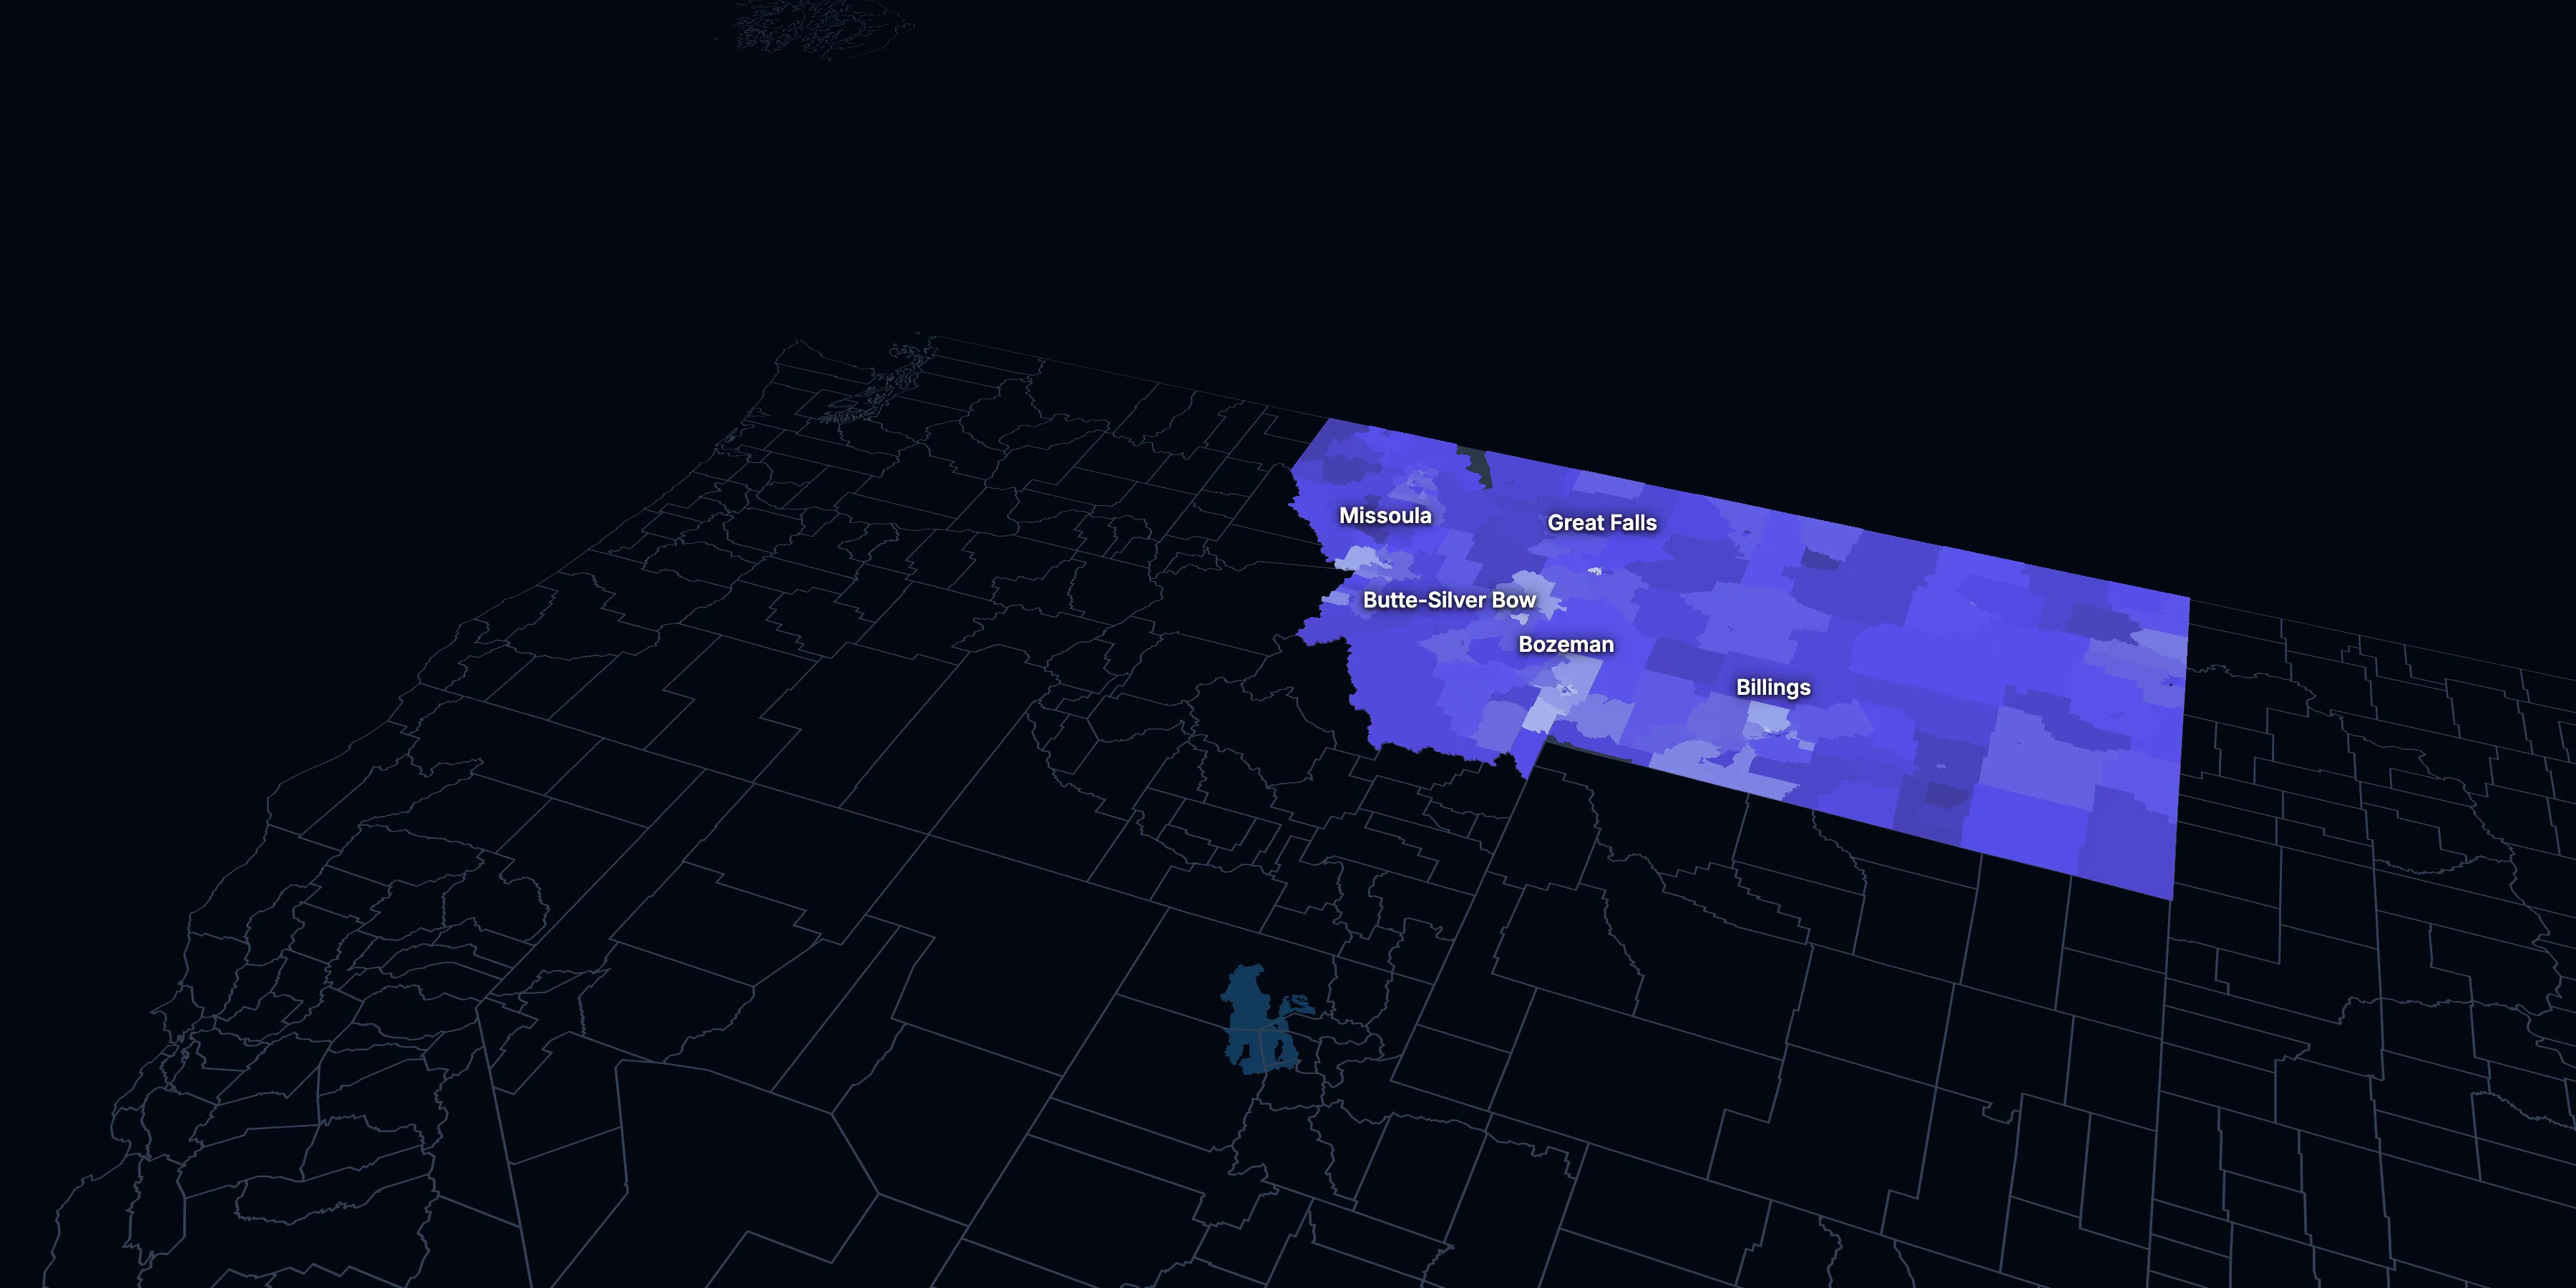
Taller, lighter tracts have higher household incomes
About Montana
Montana’s median household income is $77,099 (±$2,479), lower than the US ($84,780), and its median age is 41.0 (±0.4), according to the ACS 2025 1-year estimates. Its largest city is Billings.
± is each figure’s margin of error, at 90% confidence, and † marks one too uncertain to lean on. Under each percentage in the tables is the number it counts. How the margins are worked out.
FIPS code 30
Highlights
What stands out in Montana
The numbers where Montana sits furthest from the nation, or past a recognized policy benchmark.
Furthest from the national picture
20.1%
Lower than the USCommute 30 minutes or more
That’s lower than the US (39.2%). It’s the 5th lowest of the 50 states and DC.
4.0%
2nd lowest among statesSpeak a language other than English at home
That’s lower than the US (22.9%). It’s the 2nd lowest of the 50 states and DC.
2.8%
2nd lowest among statesBorn outside the US
That’s lower than the US (14.7%). It’s the 2nd lowest of the 50 states and DC.
8.6%
3rd among statesVeterans (adults)
That’s higher than the US (5.9%). It’s the 3rd highest of the 50 states and DC.
22.4%
Higher than the US65 and over
That’s higher than the US (19.0%).
$1,208
Lower than the USMedian gross rent
That’s lower than the US ($1,557).
2015 to 2025
How Montana changed in ten years
The state added 111,745 people. It got older, more foreign-born and better educated, and poverty fell 3.6 points.
Population, change since 2015
+10.8% in the state and +6.3% in the US.
Source: ACS 1-year, 2015 to 2025, table A00001.
Show data
| Montana | United States | |
|---|---|---|
| 2015 | 0.0% | 0.0% |
| 2016 | +0.9% | +0.5% |
| 2017 | +1.7% | +1.3% |
| 2018 | +2.8% | +1.8% |
| 2019 | +3.5% | +2.1% |
| 2021 | +6.9% | +3.3% |
| 2022 | +8.7% | +3.7% |
| 2023 | +9.7% | +4.2% |
| 2024 | +10.1% | +5.8% |
| 2025 | +10.8% | +6.3% |
Embed
Median household income, in 2025 dollars
+13.7% in the state and +10.9% in the US.
Source: ACS 1-year, 2015 to 2025, table A14006.
Show data
| Montana | United States | |
|---|---|---|
| 2015 | $67,828 | $76,413 |
| 2016 | $67,665 | $77,931 |
| 2017 | $70,688 | $79,891 |
| 2018 | $71,516 | $80,059 |
| 2019 | $72,561 | $83,427 |
| 2021 | $75,772 | $83,521 |
| 2022 | $74,919 | $82,811 |
| 2023 | $75,327 | $82,683 |
| 2024 | $77,865 | $84,339 |
| 2025 | $77,099 | $84,780 |
Embed
Living in poverty
−3.6 points in the state and −3.0 points in the US.
Source: ACS 1-year, 2015 to 2025, table A13004.
Show data
| Montana | United States | |
|---|---|---|
| 2015 | 14.6% | 14.7% |
| 2016 | 13.3% | 14.0% |
| 2017 | 12.5% | 13.4% |
| 2018 | 13.0% | 13.1% |
| 2019 | 12.6% | 12.3% |
| 2021 | 11.9% | 12.8% |
| 2022 | 12.1% | 12.6% |
| 2023 | 11.7% | 12.5% |
| 2024 | 10.2% | 12.1% |
| 2025 | 11.1% | 11.8% |
Embed
Bachelor’s degree or more
+5.6 points in the state and +6.7 points in the US.
Source: ACS 1-year, 2015 to 2025, table A12001.
Show data
| Montana | United States | |
|---|---|---|
| 2015 | 30.6% | 30.6% |
| 2016 | 31.0% | 31.3% |
| 2017 | 32.3% | 32.0% |
| 2018 | 31.7% | 32.6% |
| 2019 | 33.6% | 33.1% |
| 2021 | 34.8% | 35.0% |
| 2022 | 34.6% | 35.7% |
| 2023 | 34.6% | 36.2% |
| 2024 | 36.3% | 36.8% |
| 2025 | 36.2% | 37.4% |
Embed
Median gross rent, in 2025 dollars
+15.6% in the state and +18.5% in the US.
Source: ACS 1-year, 2015 to 2025, table A18009.
Show data
| Montana | United States | |
|---|---|---|
| 2015 | $1,045 | $1,314 |
| 2016 | $1,002 | $1,327 |
| 2017 | $1,005 | $1,340 |
| 2018 | $1,048 | $1,368 |
| 2019 | $1,055 | $1,393 |
| 2021 | $1,058 | $1,427 |
| 2022 | $1,113 | $1,440 |
| 2023 | $1,152 | $1,496 |
| 2024 | $1,216 | $1,537 |
| 2025 | $1,208 | $1,557 |
Embed
Median home value, in 2025 dollars
+48.9% in the state and +39.3% in the US.
Source: ACS 1-year, 2015 to 2025, table A10036.
Show data
| Montana | United States | |
|---|---|---|
| 2015 | $287,019 | $266,469 |
| 2016 | $293,779 | $277,278 |
| 2017 | $306,264 | $288,124 |
| 2018 | $322,114 | $296,908 |
| 2019 | $321,968 | $305,336 |
| 2021 | $386,713 | $337,116 |
| 2022 | $405,885 | $355,481 |
| 2023 | $417,359 | $361,931 |
| 2024 | $439,657 | $372,685 |
| 2025 | $427,500 | $371,100 |
Embed
ACS 1-year estimates. The dotted stretch of each line spans 2020, when the Census Bureau released no standard 1-year estimates. Dollar values are in 2025 dollars.
| Indicator | 2015 | 2025 | Change |
|---|---|---|---|
| Population | 1,032,949 | 1,144,694 | +10.8% |
| Median age | 39.9 | 41.0 | +1.1 years |
| 65 and over | 17.3% | 22.4% | +5.1 points |
| Born outside the US | 2.1% | 2.8% | +0.7 points |
| Hispanic or Latino | 3.6% | 5.2% | +1.5 points |
| Median household income | $67,828 | $77,099 | +13.7% |
| Living in poverty | 14.6% | 11.1% | −3.6 points |
| Bachelor’s degree or more | 30.6% | 36.2% | +5.6 points |
| Households that rent | 33.3% | 30.6% | −2.8 points |
| Median gross rent | $1,045 | $1,208 | +15.6% |
| Median home value | $287,019 | $427,500 | +48.9% |
319 census tracts
Montana, tract by tract
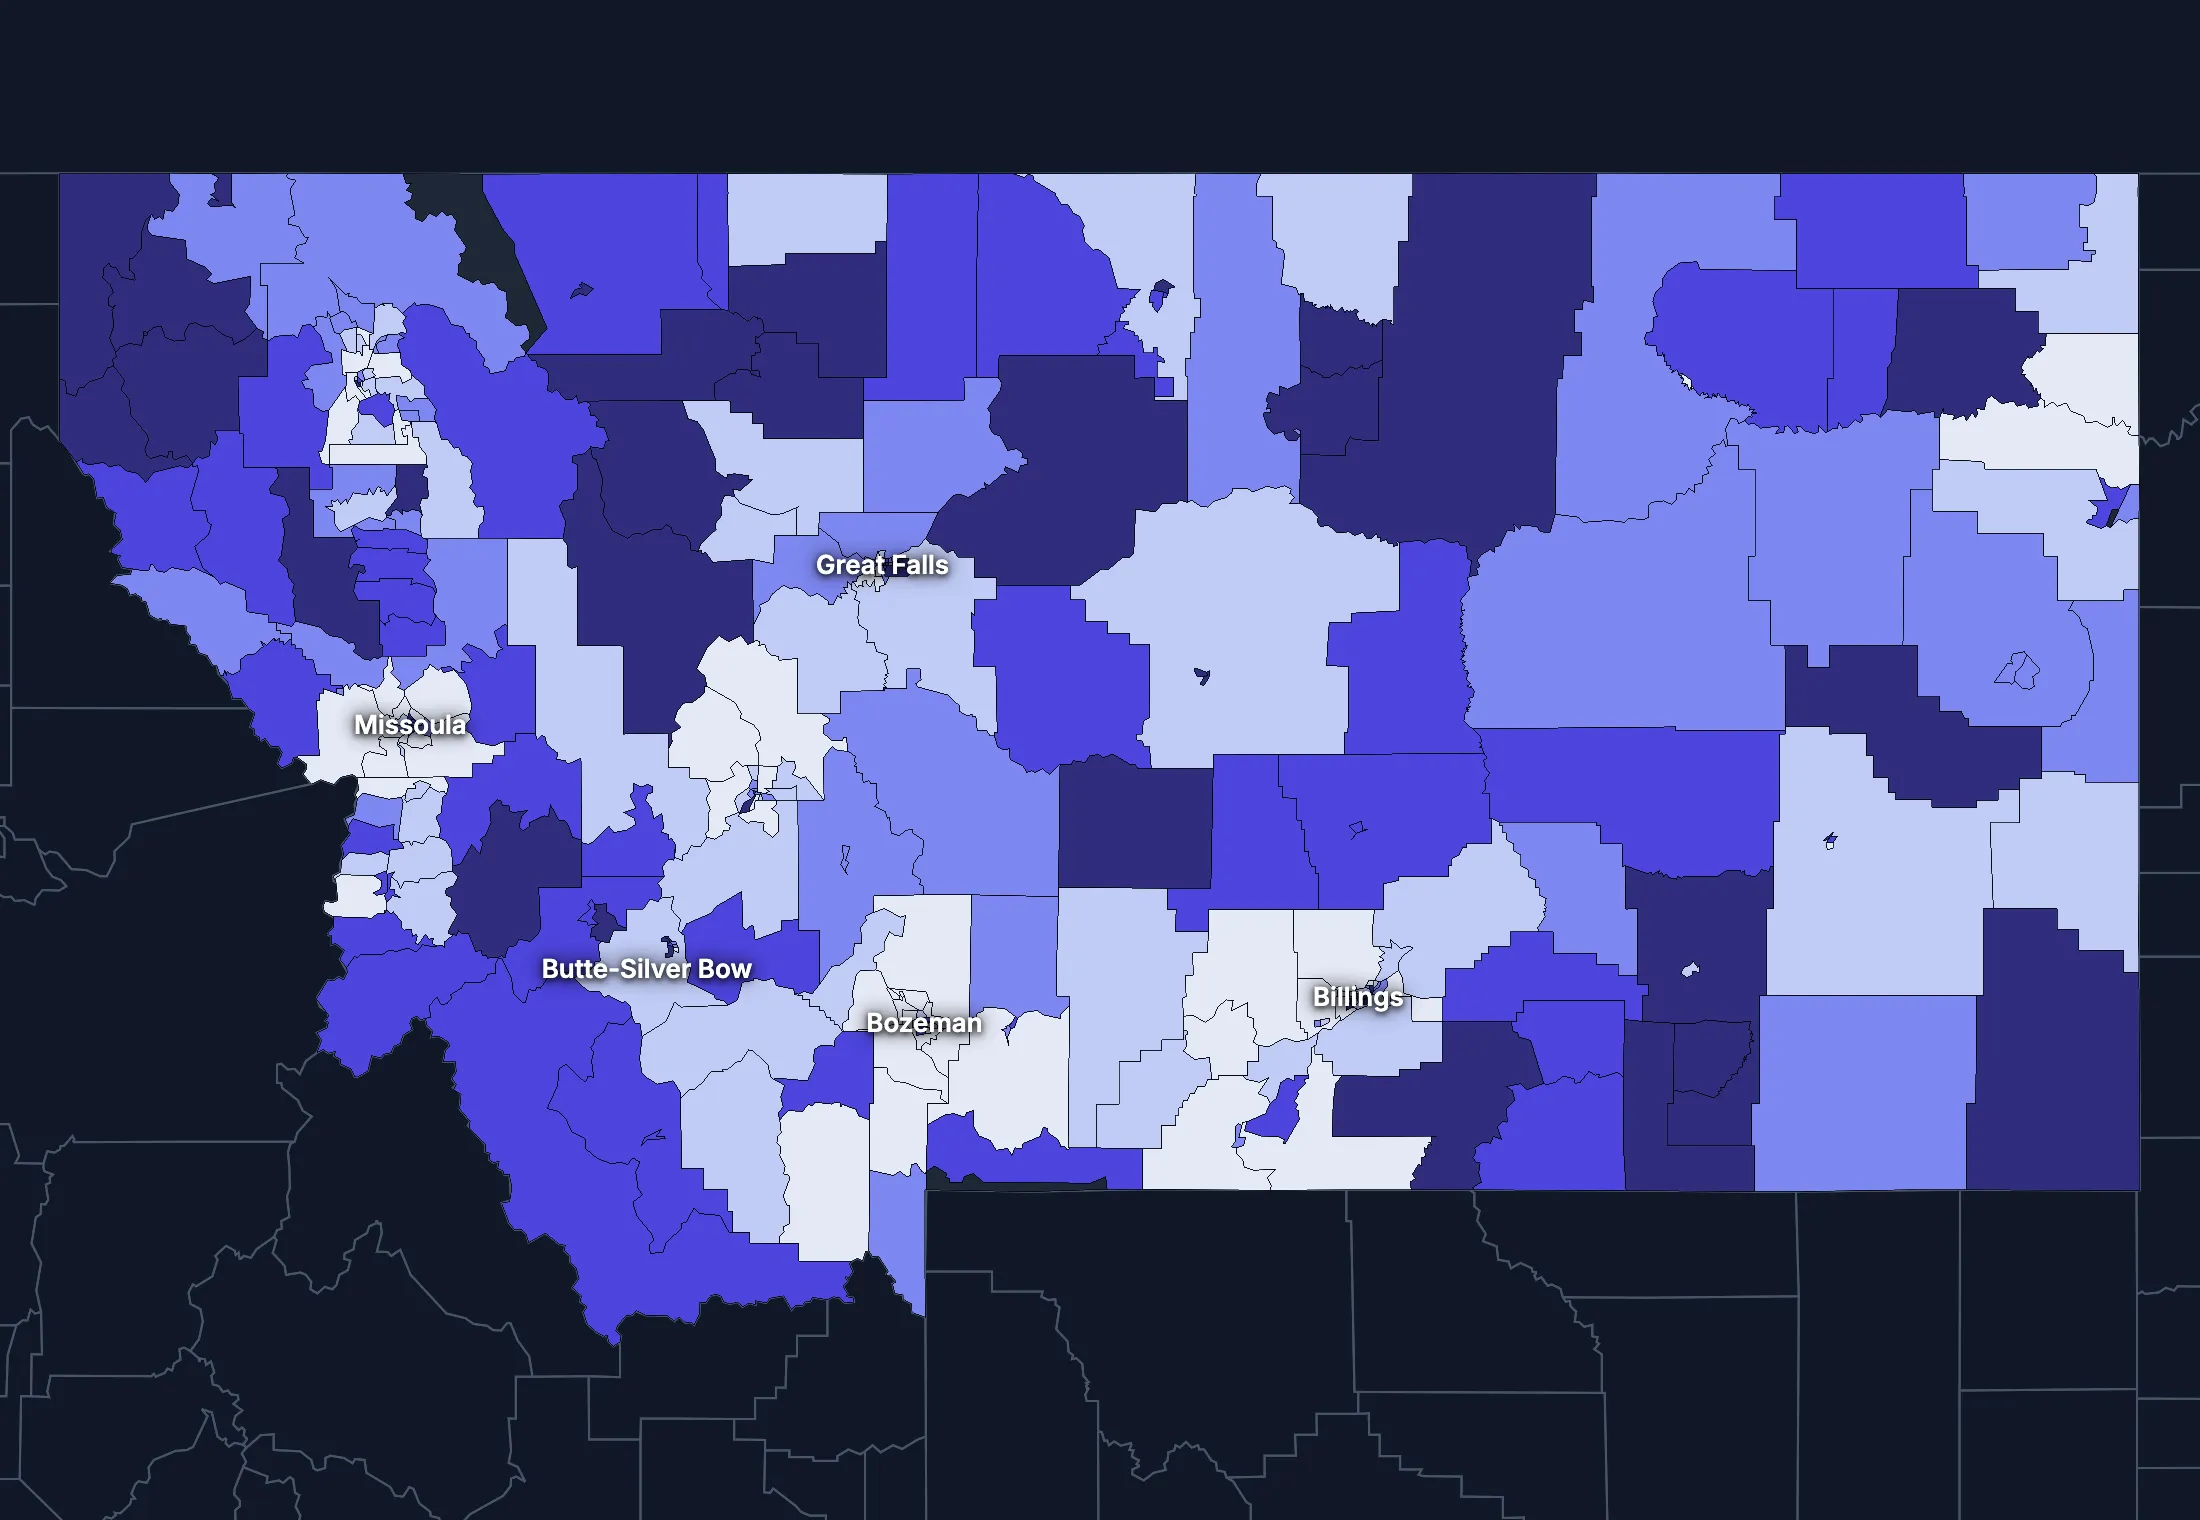
State averages hide a lot. These census tracts are the closest the census comes to neighborhoods.
Where the state’s average misleads
Each tick is one census tract, and the dark line marks the state. Hover over a tick or tap it to see the tract.
Poverty
58 of 317 tracts are at least 1.5 times the state’s overall 11.5%, and 75 are at two-thirds of it or less.
Highest: Tract 9404, 47.7%. Lowest: Tract 9622.01, 0.6%.
Renters paying 30% or more of income
25 of 308 tracts are at least 1.5 times the state’s overall 40.5%, and 92 are at two-thirds of it or less.
Highest: Tract 15.02, 83.9%. Lowest: Tract 1.01, 0.0%.
Adults with a bachelor’s degree
38 of 318 tracts are at least 1.5 times the state’s overall 35.2%, and 83 are at two-thirds of it or less.
Highest: Tract 10.01, 86.9%. Lowest: Tract 9800, 6.3%.
Median household income
20 of 315 tracts are at least 1.5 times the typical tract’s $69,583, and 21 are at two-thirds of it or less.
Highest: Tract 23.02, $160,984. Lowest: Tract 1.02, $26,339.
American Community Survey 2020–2024 5-year estimates, by census tract. Income is capped at $250,000+ by the Census Bureau.
People
Who lives in Montana
Its median age of 41.0 is higher than the US (39.5). 2.8% of residents were born outside the US, and 4.0% speak a language other than English at home.
Age
Source: ACS 2025 1-year, table A01001.
Show data
| Montana | United States | |
|---|---|---|
| Under 18 | 20.0% ±0.5% , number 229,023 ±5,644 | 21.0% ±<0.1% , number 71,689,151 ±111,800 |
| 18 to 24 | 8.7% ±0.4% , number 99,509 ±4,870 | 9.3% ±<0.1% , number 31,716,680 ±98,660 |
| 25 to 34 | 12.7% ±0.4% , number 145,300 ±4,163 | 13.6% ±<0.1% , number 46,357,354 ±55,690 |
| 35 to 44 | 13.6% ±0.6% , number 155,168 ±6,594 | 13.4% ±<0.1% , number 45,746,189 ±105,700 |
| 45 to 54 | 10.8% ±0.2% , number 123,262 ±2,273 | 11.8% ±<0.1% , number 40,257,563 ±53,540 |
| 55 to 64 | 11.9% ±0.4% , number 135,767 ±5,035 | 12.1% ±<0.1% , number 41,242,904 ±104,700 |
| 65 to 74 | 12.9% ±0.4% , number 147,528 ±5,032 | 10.8% ±<0.1% , number 36,895,650 ±91,520 |
| 75 and over | 9.5% ±0.4% , number 109,137 ±4,031 | 8.2% ±<0.1% , number 27,879,368 ±78,140 |
Embed
Race and ethnicity
Source: ACS 2025 1-year, table A04001.
Show data
| Montana | United States | |
|---|---|---|
| White, not Hispanic | 81.8% ±0.3% , number 935,788 ±3,693 | 55.0% ±<0.1% , number 187,959,031 ±58,340 |
| Hispanic or Latino | 5.2% ±<0.1% , number 58,983 ±386 | 20.5% ±<0.1% , number 69,975,516 ±13,270 |
| Black, not Hispanic | 0.6% ±0.1% , number 6,600 ±1,623 | 11.7% ±<0.1% , number 40,096,453 ±106,200 |
| Asian, not Hispanic | 1.1% ±0.2% , number 12,046 ±1,721 | 6.5% ±<0.1% , number 22,096,709 ±58,340 |
| Other or multiracial | 11.5% ±0.5% , number 131,277 ±5,912 | 6.3% ±<0.1% , number 21,657,150 ±150,100 |
Embed
Language spoken at home
Source: ACS 2025 1-year, table C16001.
Show data
| Montana | United States | |
|---|---|---|
| English only | 96.0% ±0.4% , number 1,046,824 ±5,059 | 77.1% ±0.1% , number 249,390,588 ±275,300 |
| Spanish | 1.4% ±0.2% , number 15,252 ±2,525 | 13.9% ±0.1% , number 44,921,985 ±177,800 |
| Other Indo-European | 1.1% ±0.2% , number 12,492 ±2,206 | 4.0% ±<0.1% , number 12,862,980 ±113,500 |
| Asian and Pacific Island | 0.7% ±0.2% , number 7,172 ±1,699 | 3.8% ±<0.1% , number 12,288,841 ±99,740 |
| Arabic and other | 0.8% ±0.2% , number 9,164 ±2,279 | 1.3% ±<0.1% , number 4,116,949 ±71,480 |
Embed
Marital status
Source: ACS 2025 1-year, table A11001.
Show data
| Montana | United States | |
|---|---|---|
| Now married | 50.9% ±1.0% , number 488,644 ±9,279 | 47.9% ±0.1% , number 135,567,564 ±223,300 |
| Never married | 30.1% ±0.8% , number 289,349 ±7,460 | 34.8% ±0.1% , number 98,647,238 ±152,600 |
| Divorced | 11.6% ±0.6% , number 111,675 ±5,716 | 10.2% ±<0.1% , number 28,879,967 ±112,900 |
| Widowed | 6.2% ±0.4% , number 59,866 ±3,680 | 5.5% ±<0.1% , number 15,599,094 ±69,430 |
| Separated | 1.1% ±0.2% , number 10,355 ±1,758 | 1.6% ±<0.1% , number 4,441,399 ±49,160 |
Embed
Where people lived a year ago
Source: ACS 2025 1-year, table A08001.
Show data
| Montana | United States | |
|---|---|---|
| Same home | 87.9% ±0.7% , number 996,035 ±7,814 | 88.4% ±0.1% , number 298,889,697 ±214,800 |
| Same county | 6.1% ±0.6% , number 68,981 ±6,403 | 6.0% ±<0.1% , number 20,202,671 ±166,300 |
| Another county in the state | 2.7% ±0.3% , number 30,989 ±3,695 | 3.0% ±<0.1% , number 10,168,097 ±89,190 |
| Another state | 3.1% ±0.4% , number 34,630 ±4,699 | 2.1% ±<0.1% , number 7,025,589 ±81,660 |
| Another country | 0.3% ±0.1% , number 2,839 ±1,528 | 0.6% ±<0.1% , number 1,984,943 ±47,210 |
Embed
Top countries of birth, among those born abroad
Source: ACS 2020–2024 5-year, table A07001.
Show data
| Montana | |
|---|---|
| Canada | 15.6% , number 3,996 |
| Mexico | 11.6% , number 2,981 |
| Philippines | 9.1% , number 2,333 |
| Germany | 7.4% , number 1,901 |
| China, Excluding Hong Kong and Taiwan | 4.4% , number 1,136 |
| United Kingdom, Excluding England and Scotland | 3.2% , number 814 |
Embed
All the numbers
| Indicator | Montana | US | Rank among states* | Table |
|---|---|---|---|---|
| Population | 1,144,694 | 341,784,859 | 43rd | A00001 |
| People per square mile | 8 | 97 | 49th | A00002 |
| Land area (square miles) | 145,550 | – | – | A00002 |
| Median age | 41.0 ±0.4 | 39.5 ±0.1 | 11th | A01004 |
| Under 18 | 20.0% ±0.5% , number 229,023 ±5,644 | 21.0% ±<0.1% , number 71,689,151 ±111,800 | 36th | B02002 |
| 65 and over | 22.4% ±0.6% , number 256,665 ±6,448 | 19.0% ±<0.1% , number 64,775,018 ±120,300 | 8th | B02002 |
| Born outside the US | 2.8% ±0.3% , number 32,036 ±3,765 | 14.7% ±0.1% , number 50,409,320 ±204,800 | 50th | A06001 |
| Speak a language other than English at home | 4.0% ±0.4% , number 44,080 ±4,396 | 22.9% ±0.1% , number 74,190,755 ±244,000 | 50th | C16001 |
| Veterans (adults) | 8.6% ±0.5% , number 78,530 ±4,682 | 5.9% ±<0.1% , number 15,746,228 ±85,320 | 3rd | A16002 |
| Living with a disability | 15.0% ±0.6% , number 169,037 ±6,476 | 13.7% ±<0.1% , number 46,271,455 ±126,000 | 14th | B18101 |
| Women 15–50 who had a baby in the past year | 5.2% ±0.9% , number 12,997 ±2,155 | 5.0% ±0.1% , number 4,016,759 ±44,040 | 16th | B13002 |
| Lived in the same home a year ago | 87.9% ±0.7% , number 996,035 ±7,814 | 88.4% ±0.1% , number 298,889,697 ±214,800 | 36th | A08001 |
| White, not Hispanic | 81.8% ±0.3% , number 935,788 ±3,693 | 55.0% ±<0.1% , number 187,959,031 ±58,340 | 5th | A04001 |
| Hispanic or Latino | 5.2% ±<0.1% , number 58,983 ±386 | 20.5% ±<0.1% , number 69,975,516 ±13,270 | 47th | A04001 |
| Black, not Hispanic | 0.6% ±0.1% , number 6,600 ±1,623 | 11.7% ±<0.1% , number 40,096,453 ±106,200 | 51st | A04001 |
| Asian, not Hispanic | 1.1% ±0.2% , number 12,046 ±1,721 | 6.5% ±<0.1% , number 22,096,709 ±58,340 | 49th | A04001 |
*1 is the highest. Population is ranked among all states, and the rest among those of 1,000 people or more, whose figures can be ranked. Ranks use 5-year estimates, the only ones covering every state, so they can differ slightly from the figures here.
Income and work
Lower incomes than the US
The median household income is $77,099, lower than the US ($84,780). 11.1% of people live in poverty, and 10.9% have no health insurance, higher than the US (8.4%).
Household income
Source: ACS 2025 1-year, table A14001.
Show data
| Montana | United States | |
|---|---|---|
| Under $25,000 | 14.9% ±0.9% , number 71,470 ±4,525 | 14.0% ±0.1% , number 18,727,548 ±88,990 |
| $25,000 to $49,999 | 17.2% ±1.1% , number 82,658 ±5,555 | 15.4% ±0.1% , number 20,665,585 ±101,400 |
| $50,000 to $74,999 | 16.5% ±1.1% , number 79,517 ±5,149 | 15.3% ±0.1% , number 20,513,565 ±88,500 |
| $75,000 to $99,999 | 12.6% ±0.8% , number 60,820 ±3,998 | 12.5% ±0.1% , number 16,814,245 ±87,520 |
| $100,000 to $149,999 | 18.9% ±1.0% , number 90,992 ±4,804 | 17.9% ±0.1% , number 24,018,984 ±99,670 |
| $150,000 to $199,999 | 9.8% ±0.7% , number 47,268 ±3,453 | 10.1% ±0.1% , number 13,521,827 ±70,660 |
| $200,000 or more | 10.1% ±0.8% , number 48,550 ±3,707 | 14.8% ±0.1% , number 19,801,668 ±84,120 |
Embed
What residents do for work
Source: ACS 2025 1-year, table A17004.
Show data
| Montana | United States | |
|---|---|---|
| Education and health care | 25.2% ±1.1% , number 143,070 ±6,275 | 24.4% ±0.1% , number 40,862,193 ±140,800 |
| Professional and business services | 10.2% ±0.8% , number 57,926 ±4,463 | 12.8% ±0.1% , number 21,375,231 ±87,110 |
| Arts, food and lodging | 10.0% ±0.9% , number 56,523 ±4,995 | 8.9% ±0.1% , number 14,811,502 ±87,840 |
| Retail trade | 9.9% ±0.8% , number 56,170 ±4,400 | 10.6% ±0.1% , number 17,781,181 ±96,660 |
| Construction | 9.4% ±0.8% , number 53,182 ±4,519 | 6.7% ±<0.1% , number 11,254,981 ±79,620 |
| Public administration | 6.4% ±0.5% , number 36,025 ±3,063 | 4.7% ±<0.1% , number 7,944,601 ±69,540 |
| Other services | 5.8% ±0.6% , number 32,635 ±3,273 | 4.8% ±<0.1% , number 7,958,726 ±65,120 |
| Agriculture and mining | 5.6% ±0.6% , number 31,964 ±3,346 | 1.4% ±<0.1% , number 2,287,596 ±30,080 |
Embed
Where workers come from and go
Montana has 503,051 jobs and 502,638 employed residents. 15,823 people commute in to work and 15,410 commute out, while 487,228 both live and work here. The most commuters come from Idaho.
Most commuters come from
- Idaho: 3,284
- Wyoming: 1,854
- Washington: 1,829
Most residents commute to
- North Dakota: 3,886
- Idaho: 2,487
- Wyoming: 2,250
Show data
| Montana | |
|---|---|
| Live and work here | 487,228 |
| Work here, live elsewhere | 15,823 |
| Live here, work elsewhere | 15,410 |
Embed
All the numbers
| Indicator | Montana | US | Rank among states* | Table |
|---|---|---|---|---|
| Median household income | $77,099 ±$2,479 | $84,780 ±$215 | 37th | A14006 |
| Income per person | $43,786 ±$1,246 | $47,171 ±$115 | 28th | A14024 |
| Income inequality (Gini index) | 0.457 ±0.011 | 0.482 ±0.001 | 29th | A14028 |
| Living in poverty | 11.1% ±0.8% , number 123,916 ±8,626 | 11.8% ±0.1% , number 39,264,183 ±277,400 | 28th | A13004 |
| Unemployment rate | 2.8% ±0.3% , number 16,427 ±1,896 | 4.9% ±<0.1% , number 8,574,594 ±64,350 | 43rd | A17005 |
| No health insurance | 10.9% ±0.6% , number 122,197 ±6,500 | 8.4% ±<0.1% , number 28,323,306 ±152,000 | 20th | A20001 |
*1 is the highest. Population is ranked among all states, and the rest among those of 1,000 people or more, whose figures can be ranked. Ranks use 5-year estimates, the only ones covering every state, so they can differ slightly from the figures here.
Education
College degrees close to the US
36.2% of adults 25 and over have a bachelor’s degree or more, about the same as the US (37.4%).
Highest level of education
Source: ACS 2025 1-year, table A12001.
Show data
| Montana | United States | |
|---|---|---|
| Less than high school | 5.4% ±0.5% , number 44,206 ±4,302 | 9.4% ±0.1% , number 22,321,002 ±120,500 |
| High school only | 27.0% ±0.9% , number 220,706 ±7,216 | 25.6% ±0.1% , number 61,096,726 ±203,400 |
| Some college | 31.3% ±1.0% , number 255,566 ±8,160 | 27.7% ±0.1% , number 65,920,977 ±173,500 |
| Bachelor’s degree | 23.3% ±1.0% , number 189,858 ±8,096 | 22.3% ±0.1% , number 53,224,312 ±196,700 |
| Graduate degree | 13.0% ±0.7% , number 105,826 ±5,975 | 15.0% ±0.1% , number 35,816,011 ±159,400 |
Embed
All the numbers
| Indicator | Montana | US | Rank among states* | Table |
|---|---|---|---|---|
| Bachelor’s degree or more | 36.2% ±1.2% , number 295,684 ±10,060 | 37.4% ±0.1% , number 89,040,323 ±253,200 | 24th | A12001 |
| High school graduate or more | 94.6% ±1.8% , number 771,956 ±14,830 | 90.6% ±0.2% , number 216,058,026 ±368,200 | 3rd | A12001 |
*1 is the highest. Population is ranked among all states, and the rest among those of 1,000 people or more, whose figures can be ranked. Ranks use 5-year estimates, the only ones covering every state, so they can differ slightly from the figures here.
Housing
Home values outran incomes
30.6% of households rent, lower than the US (34.7%). The median home is worth $427,500 and the median rent is $1,208. After inflation, home values rose 49% from 2015 to 2025, while household income rose 14%.
Housing costs and income, 2015 to 2025, after inflation
Source: ACS 1-year, table A10036, A18009, A14006.
Show data
| Montana | United States | |
|---|---|---|
| Median home value | +48.9% | +39.3% |
| Median rent | +15.6% | +18.5% |
| Median household income | +13.7% | +10.9% |
Embed
Types of homes
Source: ACS 2025 1-year, table A10032.
Show data
| Montana | United States | |
|---|---|---|
| Single-family, detached | 67.1% ±1.1% , number 365,362 ±5,754 | 60.9% ±0.1% , number 90,335,844 ±173,300 |
| Single-family, attached | 4.7% ±0.6% , number 25,772 ±3,077 | 6.4% ±<0.1% , number 9,527,703 ±51,230 |
| 2 to 4 units | 7.6% ±0.8% , number 41,484 ±4,103 | 7.5% ±0.1% , number 11,109,005 ±75,790 |
| 5 to 19 units | 6.2% ±0.8% , number 33,496 ±4,259 | 8.7% ±0.1% , number 12,829,882 ±97,590 |
| 20 or more units | 4.8% ±0.6% , number 26,044 ±3,244 | 11.1% ±0.1% , number 16,381,450 ±92,310 |
| Mobile homes and other | 9.6% ±0.6% , number 52,074 ±3,411 | 5.4% ±<0.1% , number 8,045,083 ±53,680 |
Embed
When homes were built
Source: ACS 2025 1-year, table A10055.
Show data
| Montana | United States | |
|---|---|---|
| 2010 or later | 17.8% ±1.0% , number 85,625 ±4,844 | 15.1% ±0.1% , number 20,257,912 ±101,300 |
| 2000 to 2009 | 14.4% ±0.9% , number 69,318 ±4,227 | 13.8% ±0.1% , number 18,535,840 ±92,260 |
| 1980 to 1999 | 21.8% ±1.1% , number 104,732 ±5,493 | 24.1% ±0.1% , number 32,332,570 ±118,900 |
| 1960 to 1979 | 22.7% ±1.2% , number 109,415 ±5,838 | 22.9% ±0.1% , number 30,726,302 ±110,000 |
| Before 1960 | 23.3% ±1.1% , number 112,185 ±5,436 | 24.0% ±0.1% , number 32,210,798 ±121,500 |
Embed
All the numbers
| Indicator | Montana | US | Rank among states* | Table |
|---|---|---|---|---|
| Housing units | 544,232 | – | – | A10001 |
| Households | 481,275 ±4,632 | – | – | A10008 |
| People per household | 2.32 ±0.02 | 2.49 ±0.01 | 42nd | A10003 |
| Households that rent | 30.6% ±1.1% , number 147,108 ±5,711 | 34.7% ±0.1% , number 46,551,688 ±193,200 | 34th | A10060 |
| Vacant homes | 11.6% ±0.9% , number 62,957 ±4,706 | 9.6% ±0.1% , number 14,165,545 ±137,100 | 14th | A10047, A10060 |
| Median gross rent | $1,208 ±$43 | $1,557 ±$4 | 34th | A18009 |
| Median home value | $427,500 ±$6,599 | $371,100 ±$646 | 18th | A10036 |
| Renters paying 30% or more of income | 44.1% ±3.1% , number 64,855 ±5,157 | 48.3% ±0.2% , number 22,486,693 ±122,100 | 44th | A18002 |
| Owners paying 30% or more of income | 24.2% ±1.6% , number 80,847 ±5,678 | 24.2% ±0.1% , number 21,201,943 ±93,050 | 19th | A10040 |
| Homes built before 1960 | 23.3% ±1.1% , number 112,185 ±5,436 | 24.0% ±0.1% , number 32,210,798 ±121,500 | 25th | A10055 |
*1 is the highest. Population is ranked among all states, and the rest among those of 1,000 people or more, whose figures can be ranked. Ranks use 5-year estimates, the only ones covering every state, so they can differ slightly from the figures here.
Getting around
A driving state with short commutes
72.7% of workers drive alone and 12.1% work from home. 20.1% of those who travel to work spend 30 minutes or more getting there, and 4.8% of households have no vehicle.
How people get to work
Source: ACS 2025 1-year, table A09005.
Show data
| Montana | United States | |
|---|---|---|
| Drive alone | 72.7% ±1.3% , number 408,362 ±8,885 | 69.8% ±0.1% , number 115,297,377 ±192,900 |
| Carpool | 8.1% ±0.8% , number 45,330 ±4,553 | 8.9% ±0.1% , number 14,712,170 ±97,240 |
| Public transit | 1.0% ±0.2% , number 5,342 ±1,383 | 4.3% ±<0.1% , number 7,100,386 ±63,330 |
| Walk | 4.4% ±0.6% , number 24,656 ±3,225 | 2.4% ±<0.1% , number 4,016,469 ±41,070 |
| Work from home | 12.1% ±0.9% , number 67,836 ±4,868 | 12.9% ±0.1% , number 21,288,393 ±105,700 |
| Other | 1.9% ±0.4% , number 10,427 ±2,011 | 1.7% ±<0.1% , number 2,799,658 ±41,510 |
Embed
Time spent getting to work
Source: ACS 2025 1-year, table B09001.
Show data
| Montana | United States | |
|---|---|---|
| Under 10 minutes | 24.1% ±1.1% , number 118,897 ±5,839 | 12.0% ±0.1% , number 17,199,225 ±93,440 |
| 10 to 19 minutes | 38.7% ±1.6% , number 190,994 ±8,563 | 27.8% ±0.1% , number 40,059,540 ±137,700 |
| 20 to 29 minutes | 17.2% ±1.1% , number 85,069 ±5,460 | 21.0% ±0.1% , number 30,221,743 ±111,100 |
| 30 to 39 minutes | 9.5% ±0.7% , number 47,067 ±3,722 | 17.1% ±0.1% , number 24,659,138 ±103,800 |
| 40 to 59 minutes | 5.1% ±0.5% , number 24,962 ±2,691 | 12.6% ±0.1% , number 18,104,709 ±97,070 |
| 60 minutes or more | 5.5% ±0.6% , number 27,128 ±3,044 | 9.5% ±0.1% , number 13,681,705 ±84,440 |
Embed
Vehicles per household
Source: ACS 2025 1-year, table A10030.
Show data
| Montana | United States | |
|---|---|---|
| None | 4.8% ±0.6% , number 23,278 ±2,722 | 8.8% ±0.1% , number 11,781,997 ±77,240 |
| One | 26.4% ±1.2% , number 126,930 ±5,788 | 33.1% ±0.1% , number 44,424,682 ±160,700 |
| Two | 36.5% ±1.3% , number 175,866 ±6,646 | 36.0% ±0.1% , number 48,200,889 ±176,800 |
| Three or more | 32.2% ±1.2% , number 155,201 ±5,996 | 22.1% ±0.1% , number 29,655,854 ±113,300 |
Embed
All the numbers
| Indicator | Montana | US | Rank among states* | Table |
|---|---|---|---|---|
| Drive to work alone | 72.7% ±1.3% , number 408,362 ±8,885 | 69.8% ±0.1% , number 115,297,377 ±192,900 | 28th | A09005 |
| Take public transit | 1.0% ±0.2% , number 5,342 ±1,383 | 4.3% ±<0.1% , number 7,100,386 ±63,330 | 36th | A09005 |
| Work from home | 12.1% ±0.9% , number 67,836 ±4,868 | 12.9% ±0.1% , number 21,288,393 ±105,700 | 32nd | A09005 |
| Commute 30 minutes or more | 20.1% ±1.1% , number 99,157 ±5,510 | 39.2% ±0.1% , number 56,445,552 ±165,300 | 47th | B09001 |
| Households with no vehicle | 4.8% ±0.6% , number 23,278 ±2,836 | 8.8% ±<0.1% , number 11,781,997 ±64,240 | 47th | A10030 |
*1 is the highest. Population is ranked among all states, and the rest among those of 1,000 people or more, whose figures can be ranked. Ranks use 5-year estimates, the only ones covering every state, so they can differ slightly from the figures here.
Places
The largest cities in Montana
Population, from the latest estimates available. Figures cover the whole of each place.
Largest places
- Billings: 121,249
- Missoula: 78,892
- Great Falls: 60,329
- Bozeman: 56,114
- Butte-Silver Bow: 35,052
- Helena: 33,639
- Kalispell: 28,504
- Belgrade: 11,872
States like this one
- Ohio: 11,810,293
- Missouri: 6,191,814
- Wisconsin: 5,914,872
- South Carolina: 5,296,225
States at least a third this size, with the closest income, education, age, housing and origins.
Every county and place in Montana
Find any county, city, town, metro area, ZIP code, school district or district in Montana.
Counties
Each of the 56 counties with its population, from ACS 2020–2024 5-year estimates.
- Beaverhead County9,713
- Big Horn County12,891
- Blaine County6,949
- Broadwater County7,668
- Carbon County11,116
- Carter County1,308
- Cascade County84,606
- Chouteau County5,906
- Custer County11,961
- Daniels County1,494
- Dawson County8,827
- Deer Lodge County9,597
- Fallon County2,760
- Fergus County11,687
- Flathead County110,695
- Gallatin County124,074
- Garfield County1,094
- Glacier County13,637
- Golden Valley County899
- Granite County3,462
- Hill County16,155
- Jefferson County12,774
- Judith Basin County2,071
- Lake County32,561
- Lewis and Clark County73,464
- Liberty County1,952
- Lincoln County21,175
- Madison County9,223
- McCone County1,670
- Meagher County2,007
- Mineral County4,959
- Missoula County120,672
- Musselshell County5,152
- Park County17,710
- Petroleum County447
- Phillips County4,221
- Pondera County6,035
- Powder River County1,815
- Powell County7,053
- Prairie County1,250
- Ravalli County46,727
- Richland County11,235
- Roosevelt County10,526
- Rosebud County8,165
- Sanders County13,285
- Sheridan County3,669
- Silver Bow County35,785
- Stillwater County9,182
- Sweet Grass County3,720
- Teton County6,353
- Toole County5,061
- Treasure County732
- Valley County7,519
- Wheatland County2,056
- Wibaux County1,193
- Yellowstone County168,957
Cities, towns and other places
Each of the 475 with its population, from ACS 2020–2024 5-year estimates. Census-designated places are communities without a local government of their own, drawn by the Census Bureau so they can be counted.
- Absarokee926
- Acton87
- Alberton573
- Alder92
- Alzada13
- Amsterdam130
- Anaconda-Deer Lodge County9,597
- Argenta94
- Arlee812
- Ashland959
- Augusta165
- Avon173
- Ayers Ranch Colony8
- Azure406
- Babb223
- Bainville334
- Baker1,489
- Ballantine262
- Basin352
- Batavia690
- Bear Dance220
- Bearcreek88
- Beaver Creek340
- Belfry231
- Belgrade11,872
- Belknap32
- Belt559
- Biddle41
- Big Arm190
- Big Sandy784
- Big Sky2,445
- Big Sky Colony66
- Big Stone Colony45
- Big Timber1,611
- Bigfork5,565
- Billings119,434
- Birch Creek Colony121
- Birney17
- Black Eagle781
- Blackfoot85
- Bloomfield9
- Boneau277
- Bonner-West Riverside1,563
- Boulder1,284
- Box Elder106
- Boyd9
- Bozeman56,114
- Brady101
- Brandon115
- Bridger CDP73
- Bridger town788
- Broadus459
- Broadview175
- Brockton439
- Browning943
- Bull Lake247
- Busby569
- Butte-Silver Bow35,052
- Bynum15
- Camas34
- Camp Three139
- Camrose Colony126
- Canyon Creek27
- Cardwell30
- Carlton682
- Carter60
- Cascade572
- Cascade Colony44
- Centerville23
- Charlo306
- Charlos Heights163
- Chester749
- Chinook1,353
- Choteau1,479
- Churchill1,167
- Circle514
- Clancy1,874
- Clinton1,040
- Clyde Park341
- Coffee Creek61
- Colstrip2,101
- Columbia Falls5,615
- Columbus2,003
- Condon320
- Conner147
- Conrad2,618
- Cooke City86
- Coram452
- Corvallis1,227
- Corwin Springs207
- Craig172
- Crane187
- Crow Agency2,192
- Culbertson567
- Custer199
- Cut Bank3,028
- Cyr108
- Danvers6
- Darby527
- Dayton88
- De Borgia40
- Deer Lodge3,021
- Deerfield Colony34
- Dell24
- Denton193
- Dewey26
- Dillon4,085
- Dixon281
- Dodson153
- Drummond277
- Dupuyer127
- Dutton268
- Eagle Creek Colony44
- East Glacier Park Village271
- East Helena1,702
- East Missoula2,099
- Edgar60
- Ekalaka276
- Elkhorn34
- Elliston182
- Elmo290
- Emigrant322
- Ennis777
- Essex82
- Eureka1,840
- Evaro466
- Evergreen9,611
- Fairfield759
- Fairview971
- Fallon142
- Finley Point479
- Fishtail89
- Flaxville77
- Florence923
- Floweree18
- Forest Hill Village315
- Forsyth1,728
- Fort Belknap Agency1,227
- Fort Benton1,474
- Fort Peck280
- Fort Shaw207
- Fort Smith78
- Fortine351
- Four Corners5,791
- Fox80
- Fox Lake149
- Frazer387
- Frenchtown1,927
- Froid324
- Fromberg438
- Gallatin Gateway933
- Gallatin River Ranch127
- Gardiner647
- Garrison106
- Geraldine317
- Geyser66
- Gibson Flats158
- Gildford217
- Gildford Colony59
- Gilman12
- Glacier Colony404
- Glasgow3,190
- Glen20
- Glendale Colony48
- Glendive4,810
- Goldcreek3
- Golden Valley Colony27
- Grant31
- Grass Range125
- Great Falls60,329
- Greycliff158
- Hall64
- Hamilton5,101
- Happys Inn229
- Hardin3,742
- Hardy64
- Harlem822
- Harlowton1,058
- Harrison95
- Hartland Colony29
- Haugan26
- Havre9,258
- Havre North890
- Hays1,009
- Heart Butte521
- Hebgen Lake Estates85
- Helena33,639
- Helena Flats857
- Helena Valley Northeast4,659
- Helena Valley Northwest5,183
- Helena Valley Southeast9,108
- Helena Valley West Central8,056
- Helena West Side1,417
- Helmville55
- Heron328
- Herron132
- Hidden Lake Colony32
- Highwood205
- Hilldale Colony20
- Hillside Colony245
- Hingham127
- Hinsdale233
- Hobson160
- Hogeland5
- Homestead27
- Hot Springs557
- Hungry Horse679
- Huntley455
- Huson136
- Hysham251
- Inverness39
- Ismay1
- Jackson61
- Jardine43
- Jeffers60
- Jefferson City533
- Jette218
- Joliet613
- Joplin265
- Jordan321
- Judith Gap140
- Kalispell28,504
- Kerr463
- Kevin108
- Kicking Horse59
- Kila373
- Kilby Butte Colony20
- King Arthur Park1,992
- King Ranch Colony38
- Kings Point274
- Kingsbury Colony5
- Klein340
- Kremlin71
- Lake Mary Ronan80
- Lakeside2,386
- Lakeview32
- Lame Deer1,872
- Landusky21
- Laurel7,215
- Lavina134
- Lewistown6,087
- Lewistown Heights488
- Libby3,042
- Lima218
- Lincoln908
- Lindisfarne533
- Lindsay9
- Little Bitterroot Lake156
- Little Browning102
- Livingston8,780
- Lockwood7,181
- Lodge Grass429
- Lodge Pole170
- Logan111
- Lolo4,314
- Loma73
- Lonepine122
- Loring Colony31
- Luther46
- Malmstrom AFB4,302
- Malta2,100
- Mammoth15
- Manhattan2,288
- Marion1,037
- Martin City342
- Martinsdale86
- Martinsdale Colony57
- Marysville160
- Maverick Mountain73
- Maxville203
- McAllister202
- Medicine Lake213
- Melstone80
- Midway Colony26
- Miles City8,407
- Milford Colony40
- Miller Colony67
- Missoula76,514
- Moccasin17
- Monarch22
- Montana City3,092
- Montaqua145
- Moore224
- Mountain View Colony55
- Muddy724
- Musselshell36
- Nashua279
- Neihart39
- New Miami Colony330
- New Rockport Colony110
- Niarada79
- Nibbe62
- Norris17
- North Browning3,144
- North Harlem Colony67
- Noxon209
- Nye85
- Old Agency129
- Olney158
- Opheim86
- Orchard Homes5,588
- Outlook51
- Ovando49
- Pablo1,632
- Paradise76
- Park City764
- Parker School307
- Pendroy13
- Philipsburg754
- Piltzville383
- Pine Creek132
- Pinesdale833
- Pinnacle48
- Pioneer Junction798
- Plains1,195
- Pleasant Valley Colony137
- Plentywood1,654
- Plevna209
- Polebridge14
- Polson5,428
- Pompeys Pillar27
- Pondera Colony42
- Ponderosa Pines950
- Pony78
- Poplar635
- Power217
- Pray1,129
- Pryor497
- Rader Creek310
- Radersburg35
- Rapelje69
- Ravalli146
- Raynesford54
- Red Lodge2,502
- Redstone4
- Reed Point147
- Reserve19
- Rexford134
- Rhodes110
- Riceville26
- Richey238
- Rimini118
- Rimrock Colony39
- Riverbend592
- Riverview Colony192
- Roberts191
- Rockport Colony66
- Rockvale350
- Rocky Boy West1,007
- Rocky Boy's Agency120
- Rocky Point151
- Rollins115
- Ronan2,001
- Roscoe5
- Rosebud45
- Roundup2,003
- Roy129
- Rudyard312
- Ryegate273
- Saco140
- Saddle Butte225
- Sage Creek Colony30
- Saltese17
- Sand Coulee134
- Sangrey339
- Santa Rita21
- Sapphire Ridge11
- Savage316
- Scobey861
- Sedan182
- Seeley Lake1,496
- Seville Colony44
- Shawmut36
- Shelby3,216
- Shepherd353
- Sheridan869
- Sidney6,171
- Silesia5
- Silver Gate114
- Silver Star89
- Simms334
- Sleeping Buffalo9
- Snowslip71
- Somers1,280
- South Browning1,538
- South Glastonbury175
- South Hills620
- Spokane Creek740
- Spring Creek Colony27
- Springdale2
- Springdale Colony17
- Springhill187
- Springwater Colony42
- Square Butte28
- St. Ignatius977
- St. Marie306
- St. Mary193
- St. Pierre394
- St. Regis406
- St. Xavier55
- Stanford268
- Starr School235
- Stevensville2,130
- Stockett155
- Sula9
- Sun Prairie1,171
- Sun River72
- Sunburst301
- Superior896
- Swan Lake211
- Sweet Grass70
- Sylvanite145
- Terry537
- The Silos579
- Thompson Falls1,500
- Three Forks1,919
- Toston368
- Townsend1,967
- Tracy133
- Trego692
- Trout Creek252
- Troy871
- Turah543
- Turner69
- Turner Colony157
- Turtle Lake55
- Twin Bridges201
- Twin Creeks361
- Twin Hills Colony48
- Twodot11
- Ulm900
- Unionville412
- Utica14
- Valier573
- Vaughn1,002
- Victor867
- Vida83
- Virginia City129
- Walkerville733
- Warm Spring Creek46
- Weeksville147
- West Glacier263
- West Glendive2,121
- West Havre143
- West Kootenai494
- West Yellowstone1,474
- Westby290
- Wheatland1,661
- White Haven978
- White Sulphur Springs957
- Whitefish8,749
- Whitehall1,156
- Whitetail23
- Whitewater105
- Whitlash8
- Wibaux672
- Willow Creek181
- Wilsall203
- Windham84
- Wineglass176
- Winifred263
- Winnett204
- Winston81
- Wisdom110
- Wise River30
- Wolf Creek12
- Wolf Point2,602
- Woods Bay835
- Worden416
- Wye1,055
- Wyola481
- Yaak293
- York182
- Zortman52
- Zurich38
Metro and micro areas
Each of the 7 that reach into Montana, with its whole population, from ACS 2020–2024 5-year estimates. Metro and micro areas are counties tied together by commuting, drawn by the Office of Management and Budget.
- Billings, MT Metro Area189,255
- Bozeman, MT Metro Area124,074
- Butte-Silver Bow, MT Micro Area35,785
- Great Falls, MT Metro Area84,606
- Helena, MT Metro Area93,906
- Kalispell, MT Micro Area110,695
- Missoula, MT Metro Area125,631
ZIP codes
Each of the 368 with people in it, by the town it's centered in, from ACS 2020–2024 5-year estimates. These are the Census Bureau's ZIP Code Tabulation Areas, which follow the Postal Service's ZIP codes as closely as census blocks allow.
- 59001Absarokee1,409
- 59002Mountain View Colony221
- 59003Ashland1,334
- 59006Ballantine586
- 59007Bearcreek96
- 59008Belfry456
- 59010220
- 59011Big Timber3,167
- 59012Birney44
- 59013Boyd199
- 590141,510
- 59015Broadview394
- 59016Busby1,044
- 59018Clyde Park669
- 59019Columbus4,438
- 59020Silver Gate93
- 590222,307
- 59024335
- 5902553
- 59026Edgar81
- 59027South Glastonbury562
- 59028496
- 59029Fromberg760
- 59030Jardine1,030
- 59031Crow Agency391
- 59032Grass Range409
- 59033Greycliff231
- 59034Hardin5,008
- 59035Fort Smith180
- 59036Harlowton1,530
- 59037Huntley2,336
- 59038Hysham750
- 5903913
- 59041Joliet2,258
- 59043Muddy2,727
- 59044Laurel12,302
- 59046Lavina577
- 59047Livingston14,092
- 59050Lodge Grass1,338
- 59052186
- 59053Martinsdale412
- 59054Melstone227
- 5905540
- 59057782
- 5905854
- 59059Musselshell159
- 59061Nye250
- 5906251
- 59063Park City2,070
- 59064Pompeys Pillar211
- 59065South Glastonbury146
- 59066Pryor539
- 59067Rapelje152
- 590683,977
- 59069Reed Point458
- 59070Roberts1,403
- 5907142
- 59072Camp Three4,690
- 59074Ryegate413
- 59075St. Xavier125
- 59076Hysham26
- 5907771
- 59078Shawmut115
- 59079Shepherd3,940
- 59081Silver Gate114
- 59082Springdale2
- 590833
- 59085Twodot83
- 59086Wilsall792
- 59087395
- 590881,265
- 59089Wyola801
- 5910142,250
- 59102Billings47,977
- 59105Lockwood35,480
- 59106Billings21,417
- 59201Wolf Point5,073
- 59211Reserve298
- 59212Bainville603
- 59213Brockton758
- 5921446
- 592151,015
- 59217Crane171
- 59218Culbertson898
- 59219144
- 59221Fairview1,951
- 59222Flaxville210
- 5922319
- 59225639
- 59226Froid644
- 59230Glasgow4,606
- 59231St. Marie306
- 59240Opheim22
- 59241Hinsdale439
- 59242Homestead55
- 59243Fox Lake446
- 5924463
- 59247Medicine Lake310
- 59248Nashua1,023
- 59250242
- 59252Outlook70
- 5925359
- 59254Plentywood1,822
- 59255Poplar3,083
- 59256Plentywood258
- 59257Redstone132
- 59258Reserve184
- 59259Richey345
- 5926076
- 59261Sleeping Buffalo525
- 59262Savage737
- 59263Scobey1,180
- 59270Crane8,571
- 59273Hinsdale15
- 59274Vida297
- 59275Westby436
- 59276Whitetail31
- 59301Miles City11,643
- 59311143
- 5931229
- 59313Baker2,111
- 59314Biddle155
- 59315Bloomfield104
- 5931615
- 59317Broadus1,108
- 59318148
- 5931940
- 59322132
- 59323Colstrip2,101
- 59324Ekalaka777
- 59326233
- 59327Forsyth2,610
- 59330West Glendive8,133
- 59332140
- 5933310
- 59336220
- 59337Jordan653
- 59338136
- 59339Lindsay208
- 5934321
- 59344Plevna406
- 5934535
- 59347323
- 59349Terry1,025
- 59351202
- 59353Wibaux1,204
- 59354258
- 59401Great Falls13,255
- 59404Black Eagle28,822
- 59405Stockett33,350
- 59410520
- 59411Babb798
- 59412Riceville1,685
- 59414Black Eagle781
- 59416425
- 59417South Browning7,470
- 59418142
- 59419Bynum44
- 59420Carter164
- 594212,069
- 594222,938
- 59424Coffee Creek103
- 59425Conrad3,717
- 59427Seville Colony5,008
- 59430448
- 59432Dupuyer170
- 59433Dutton421
- 59434St. Mary368
- 5943514
- 59436Fairfield2,039
- 59440Floweree432
- 59441126
- 59442Fort Benton1,838
- 59443Fort Shaw705
- 59444Eagle Creek Colony222
- 59446Geraldine629
- 59447Geyser297
- 59448Heart Butte638
- 59450Highwood503
- 59451123
- 59452Utica599
- 59453Judith Gap331
- 59454Kevin123
- 59456392
- 59457Warm Spring Creek9,135
- 59460Loma178
- 5946123
- 59462Moccasin122
- 59463Monarch142
- 59464597
- 59465Neihart39
- 59466Kevin94
- 59467Rockport Colony124
- 59468Power858
- 59469Raynesford160
- 59471318
- 59472Stockett507
- 59474Shelby3,525
- 59477Simms334
- 59479Windham746
- 59480Riceville328
- 59482Sunburst757
- 59483Cascade Colony247
- 5948491
- 59485Ulm772
- 59486Kingsbury Colony1,205
- 59487Vaughn1,548
- 59489Winifred424
- 59501Hilldale Colony12,243
- 595201,261
- 59521Rocky Boy West3,529
- 59522Chester1,315
- 59523Chinook2,356
- 59524643
- 59525Gildford473
- 59526Fort Belknap Agency2,319
- 59527Hays1,345
- 59528Hingham249
- 59529Hogeland144
- 59530Inverness141
- 59531351
- 59532Kremlin97
- 5953533
- 59537Loring Colony159
- 595382,737
- 59540Rudyard430
- 59542Turner442
- 59544Whitewater207
- 59545Whitlash55
- 59546Zortman191
- 59547Zurich51
- 59601Rimini31,728
- 59602Helena Valley Northeast30,754
- 59625Helena663
- 59631Basin375
- 59632Boulder2,557
- 59633Canyon Creek272
- 59634Clancy5,521
- 59635Spokane Creek8,292
- 59636Helena West Side32
- 59638Jefferson City769
- 596391,021
- 59640Marysville160
- 5964235
- 59643Radersburg867
- 59644The Silos4,187
- 596451,611
- 59647Winston358
- 59648Wolf Creek486
- 59701Butte-Silver Bow34,232
- 59710226
- 59711Anaconda-Deer Lodge County9,529
- 59713Avon253
- 59714Springhill24,282
- 59715Bozeman39,643
- 59716Big Sky1,795
- 59718Four Corners44,585
- 59720220
- 59721Cardwell423
- 59722Deer Lodge5,732
- 59724Dell87
- 597258,343
- 59727Butte-Silver Bow293
- 59728Elliston394
- 59729Jeffers3,258
- 597302,399
- 59731Garrison198
- 59732Glen195
- 59733Goldcreek196
- 59735Pony440
- 59736Jackson155
- 59739299
- 59740McAllister428
- 59741Amsterdam5,748
- 59743Glen165
- 59745Norris98
- 59746Maverick Mountain111
- 59747Mammoth122
- 59748Butte-Silver Bow354
- 59749Brandon2,029
- 59750Butte-Silver Bow500
- 59751Silver Star215
- 59752Three Forks5,404
- 59754Twin Bridges980
- 59755Virginia City170
- 59756Anaconda-Deer Lodge County313
- 59758Hebgen Lake Estates2,180
- 59759Whitehall3,631
- 59760Willow Creek221
- 59761Wisdom312
- 59762Anaconda-Deer Lodge County231
- 59801Missoula30,916
- 59802East Missoula19,864
- 59803Piltzville18,401
- 59804Wye8,123
- 59808Wye23,574
- 59812Missoula1,181
- 59820Cyr1,834
- 59821Arlee2,994
- 59823Twin Creeks1,931
- 59824Charlo1,526
- 598252,434
- 59826Condon518
- 59827Conner371
- 59828Corvallis5,827
- 598292,148
- 59830Saltese102
- 59831Old Agency544
- 59832Drummond962
- 59833Florence6,316
- 59834Frenchtown2,444
- 59837Maxville639
- 59840Charlos Heights15,679
- 59841Pinesdale833
- 59842Haugan46
- 59843Helmville251
- 59844Heron712
- 59845Lonepine1,223
- 598461,377
- 598476,015
- 59848Lonepine81
- 59851Bonner-West Riverside145
- 59853Noxon1,030
- 59854195
- 59855Pablo419
- 59856Paradise130
- 59858Philipsburg1,494
- 59859Plains4,360
- 59860Jette11,897
- 59863Ravalli146
- 59864Ronan7,301
- 59865St. Ignatius3,635
- 59866St. Regis1,161
- 59867Saltese85
- 59868Seeley Lake1,797
- 59870Stevensville12,506
- 59871Sula289
- 59872Riverbend2,501
- 59873Thompson Falls2,920
- 59874Trout Creek2,266
- 59875Pinesdale3,764
- 59901Kalispell63,161
- 59910Lindisfarne692
- 59911Swan Lake9,493
- 59912Columbia Falls15,752
- 59913Coram582
- 59914Dayton345
- 59915Elmo452
- 59916Essex232
- 59917Eureka4,920
- 59918Fortine509
- 59919Hungry Horse679
- 59920Marion1,704
- 59922Lakeside2,337
- 5992310,450
- 59925Marion1,532
- 59926Martin City268
- 59927Olney270
- 59928Polebridge86
- 59929Lake Mary Ronan230
- 59930Rexford1,220
- 59931Rollins335
- 59932Lakeside1,850
- 59933Fortine2
- 59934Trego693
- 59935Sylvanite3,381
- 59936Snowslip690
- 59937Whitefish15,114
Consolidated cities
A city and county governed as one, with the towns inside it that keep governments of their own.
- Butte-Silver Bow35,785
School districts
Each of the 398 with people in it, from ACS 2020–2024 5-year estimates. Elementary districts teach the lower grades and secondary districts the upper ones, under them; the rest are unified, teaching every grade.
- Absarokee Elementary School Districtelementary1,581
- Absarokee High School Districtsecondary2,191
- Alberton K-12 Schools1,812
- Alder Elementary School Districtelementary226
- Alzada Elementary School Districtelementary238
- Amsterdam Elementary School Districtelementary2,270
- Anaconda Elementary School Districtelementary9,304
- Anaconda High School Districtsecondary9,345
- Anderson Elementary School Districtelementary1,205
- Arlee Elementary School Districtelementary3,345
- Arlee High School Districtsecondary3,345
- Arrowhead Elementary School Districtelementary2,068
- Ashland Elementary School Districtelementary1,481
- Auchard Creek Elementary School Districtelementary40
- Augusta Elementary School Districtelementary545
- Augusta High School Districtsecondary585
- Avon Elementary School Districtelementary253
- Ayers Elementary School Districtelementary26
- Bainville K-12 Schools603
- Baker K-12 Schools2,247
- Basin Elementary School Districtelementary375
- Bear Paw Elementary School Districtelementary111
- Beaverhead County High School Districtsecondary9,291
- Belfry K-12 Schools666
- Belgrade Elementary School Districtelementary26,322
- Belgrade High School Districtsecondary26,684
- Belt Elementary School Districtelementary2,206
- Belt High School Districtsecondary1,920
- Benton Lake Elementary School Districtelementary39
- Biddle Elementary School Districtelementary158
- Big Sandy K-12 Schools1,368
- Big Sky School K-122,642
- Big Timber Elementary School Districtelementary2,771
- Bigfork Elementary School Districtelementary7,146
- Bigfork High School Districtsecondary9,480
- Billings Elementary School Districtelementary119,005
- Billings High School Districtsecondary137,348
- Birney Elementary School Districtelementary60
- Bloomfield Elementary School Districtelementary105
- Blue Creek Elementary School Districtelementary2,963
- Bonner Elementary School Districtelementary3,144
- Boulder Elementary School Districtelementary2,572
- Box Elder Elementary School Districtelementary770
- Box Elder High School Districtsecondary872
- Bozeman Elementary School Districtelementary73,149
- Bozeman High School Districtsecondary82,406
- Bridger K-12 Schools1,371
- Broadus Elementary School Districtelementary1,291
- Broadview Elementary School Districtelementary927
- Broadview High School Districtsecondary986
- Brockton Elementary School Districtelementary589
- Brockton High School Districtsecondary598
- Brorson Elementary School Districtelementary309
- Browning Elementary School Districtelementary8,621
- Browning High School Districtsecondary9,044
- Butte Elementary School Districtelementary33,396
- Butte High School Districtsecondary35,633
- Bynum Elementary School Districtelementary96
- Canyon Creek Elementary School Districtelementary2,117
- Cardwell Elementary School Districtelementary557
- Carter County High School Districtsecondary1,287
- Carter Elementary School Districtelementary308
- Cascade Elementary School Districtelementary2,149
- Cascade High School Districtsecondary2,802
- Cayuse Prairie Elementary School Districtelementary2,887
- Centerville Elementary School Districtelementary1,629
- Centerville High School Districtsecondary1,676
- Charlo Elementary School Districtelementary1,356
- Charlo High School Districtsecondary1,932
- Chester-Joplin-Inverness Elementary School Districtelementary2,052
- Chester-Joplin-Inverness High School Districtsecondary2,099
- Chinook Elementary School Districtelementary1,999
- Chinook High School Districtsecondary2,334
- Choteau Elementary School Districtelementary2,878
- Choteau High School Districtsecondary3,137
- Circle Elementary School Districtelementary1,086
- Circle High School Districtsecondary1,670
- Clancy Elementary School Districtelementary3,020
- Cleveland Elementary School Districtelementary135
- Clinton Elementary School Districtelementary2,318
- Cohagen Elementary School Districtelementary220
- Colstrip Elementary School Districtelementary2,312
- Colstrip High School Districtsecondary2,312
- Columbia Falls Elementary School Districtelementary15,269
- Columbia Falls High School Districtsecondary16,191
- Columbus Elementary School Districtelementary4,389
- Columbus High School Districtsecondary4,389
- Conrad Elementary School Districtelementary3,318
- Conrad High School Districtsecondary3,678
- Cooke City Elementary School Districtelementary207
- Corvallis K-12 Schools8,925
- Cottonwood Elementary School District (Gallatin County)elementary367
- Cottonwood Elementary School District (Hill County)elementary288
- Creston Elementary School Districtelementary1,507
- Culbertson Elementary School Districtelementary860
- Culbertson High School Districtsecondary832
- Custer County High School Districtsecondary11,961
- Custer K-12 Schools335
- Cut Bank Elementary School Districtelementary4,549
- Cut Bank High School Districtsecondary4,593
- Darby K-12 Schools3,753
- Davey Elementary School Districtelementary53
- Dawson High School Districtsecondary8,344
- Deer Creek Elementary School Districtelementary368
- Deer Lodge Elementary School Districtelementary5,818
- Deer Park Elementary School Districtelementary1,261
- Deerfield Elementary School Districtelementary57
- Denton Elementary School Districtelementary473
- Denton High School Districtsecondary530
- DeSmet Elementary School Districtelementary1,763
- Dillon Elementary School Districtelementary8,045
- Divide Elementary School Districtelementary228
- Dixon Elementary School Districtelementary576
- Dodson K-12468
- Drummond Elementary School Districtelementary1,170
- Drummond High School Districtsecondary1,539
- Dupuyer Elementary School Districtelementary330
- Dutton/Brady K-12 Schools837
- East Glacier Park Elementary School Districtelementary423
- East Helena K-1210,353
- Ekalaka Elementary School Districtelementary890
- Elder Grove Elementary School Districtelementary5,834
- Elliston Elementary School Districtelementary394
- Elysian Elementary School Districtelementary3,790
- Ennis K-12 Schools4,372
- Eureka Elementary School Districtelementary5,648
- Evergreen Elementary School Districtelementary6,792
- Fair-Mont-Egan Elementary School Districtelementary1,537
- Fairfield Elementary School Districtelementary1,319
- Fairfield High School Districtsecondary2,059
- Fairview Elementary School Districtelementary1,623
- Fairview High School Districtsecondary1,628
- Fergus High School Districtsecondary8,927
- Fishtail Elementary School Districtelementary328
- Flathead High School Districtsecondary71,767
- Florence-Carlton K-12 Schools6,175
- Forsyth Elementary School Districtelementary2,090
- Forsyth High School Districtsecondary2,108
- Fort Benton Elementary School Districtelementary1,810
- Fort Benton High School Districtsecondary2,260
- Fortine Elementary School Districtelementary995
- Frazer Elementary School Districtelementary539
- Frazer High School Districtsecondary742
- Frenchtown K-12 Schools7,107
- Froid Elementary School Districtelementary795
- Froid High School Districtsecondary795
- Fromberg K-121,029
- Frontier Elementary School Districtelementary443
- Galata Elementary School Districtelementary320
- Gallatin Gateway Elementary School Districtelementary1,809
- Gardiner Elementary School Districtelementary1,085
- Gardiner High School Districtsecondary1,292
- Garfield County High School Districtsecondary1,094
- Garrison Elementary School Districtelementary170
- Geraldine K-12808
- Geyser K-12 Schools401
- Gildford Colony Elementary School Districtelementary59
- Glasgow K-12 Schools4,906
- Glendive Elementary School Districtelementary7,622
- Gold Creek Elementary School Districtelementary224
- Golden Ridge Elementary School Districtelementary171
- Grant Elementary School Districtelementary144
- Grass Range Elementary School Districtelementary627
- Grass Range High School Districtsecondary653
- Great Falls Elementary School Districtelementary74,782
- Great Falls High School Districtsecondary75,021
- Greenfield Elementary School Districtelementary602
- Greycliff Elementary School Districtelementary423
- Hall Elementary School Districtelementary369
- Hamilton K-12 Schools12,813
- Hardin Elementary School Districtelementary9,951
- Hardin High School Districtsecondary8,514
- Harlem Elementary School Districtelementary2,289
- Harlem High School Districtsecondary2,491
- Harlowton K-12 Schools1,782
- Harrison K-12 Schools660
- Havre Elementary School Districtelementary11,878
- Havre High School Districtsecondary12,114
- Hawks Home Elementary School Districtelementary159
- Hays-Lodge Pole K-12 Schools1,600
- Heart Butte K-12 Schools671
- Helena Elementary School Districtelementary58,653
- Helena Flats Elementary School Districtelementary2,240
- Helena High School Districtsecondary61,505
- Hellgate Elementary School Districtelementary17,986
- Helmville Elementary School Districtelementary243
- Highwood K-12498
- Hinsdale Elementary School Districtelementary467
- Hinsdale High School Districtsecondary471
- Hobson K-12 Schools758
- Hot Springs K-121,489
- Huntley Project K-12 Schools4,441
- Hysham K-12 Schools732
- Independent Elementary School Districtelementary3,106
- Jackson Elementary School Districtelementary184
- Jefferson High School Districtsecondary9,347
- Joliet Elementary School Districtelementary2,437
- Joliet High School Districtsecondary2,758
- Jordan Elementary School Districtelementary512
- Judith Gap Elementary School Districtelementary345
- Judith Gap High School Districtsecondary302
- Kalispell Elementary School Districtelementary34,877
- Kester Elementary School Districtelementary90
- Kila Elementary School Districtelementary1,941
- King Colony Elementary School Districtelementary349
- Kinsey Elementary School Districtelementary507
- Kircher Elementary School Districtelementary880
- Knees Elementary School Districtelementary103
- Lambert Elementary School Districtelementary470
- Lambert High School Districtsecondary403
- Lame Deer Elementary School Districtelementary1,948
- Lame Deer High School Districtsecondary4,936
- LaMotte Elementary School Districtelementary987
- Laurel Elementary School Districtelementary12,529
- Laurel High School Districtsecondary12,208
- Lavina K-12 Schools475
- Lewistown Elementary School Districtelementary8,551
- Libby K-12 Schools10,446
- Liberty Elementary School Districtelementary47
- Lima K-12 Schools422
- Lincoln County High School Districtsecondary7,344
- Lincoln K-12 Schools1,021
- Lindsay Elementary School Districtelementary350
- Livingston Elementary School Districtelementary12,488
- Lockwood K-128,324
- Lodge Grass Elementary School Districtelementary1,537
- Lodge Grass High School Districtsecondary2,119
- Lolo Elementary School Districtelementary5,391
- Lone Rock Elementary School Districtelementary4,153
- Lustre Elementary School Districtelementary203
- Luther Elementary School Districtelementary416
- Malmborg Elementary School Districtelementary255
- Malta K-12 Schools3,007
- Manhattan High School Districtsecondary6,157
- Manhattan Schoolelementary3,876
- Marion Elementary School Districtelementary1,767
- McCormick Elementary School Districtelementary380
- McLeod Elementary School Districtelementary249
- Medicine Lake K-12 Schools656
- Melrose Elementary School Districtelementary86
- Melstone Elementary School Districtelementary402
- Melstone High School Districtsecondary225
- Melville Elementary School Districtelementary175
- Miami Elementary School Districtelementary360
- Miles City Elementary School Districtelementary10,103
- Missoula Elementary School Districtelementary72,015
- Missoula High School Districtsecondary111,121
- Molt Elementary School Districtelementary156
- Monforton Elementary School Districtelementary4,361
- Montana City Elementary School Districtelementary3,380
- Moore Elementary School Districtelementary669
- Moore High School Districtsecondary712
- Morin Elementary School Districtelementary345
- Mountain View Elementary School Districtelementary44
- Nashua K-12 Schools990
- North Harlem Colony Elementary School Districtelementary67
- North Star Elementary School Districtelementary1,166
- North Star High School Districtsecondary1,228
- Noxon Elementary School Districtelementary1,742
- Noxon High School Districtsecondary2,994
- Nye Elementary School Districtelementary309
- Olney-Bissell Elementary School Districtelementary1,352
- Opheim K-12 Schools410
- Ovando Elementary School Districtelementary203
- Park City Elementary School Districtelementary1,997
- Park City High School Districtsecondary1,997
- Park High School Districtsecondary14,975
- Pass Creek Elementary School Districtelementary167
- Pendroy Elementary School Districtelementary167
- Philipsburg K-12 Schools1,923
- Pine Creek Elementary School Districtelementary419
- Pine Grove Elementary School Districtelementary81
- Pioneer Elementary School Districtelementary1,105
- Plains K-12 Schools4,368
- Pleasant Valley Elementary School Districtelementary174
- Plenty Coups High School Districtsecondary546
- Plentywood K-12 Schools2,564
- Plevna K-12 Schools513
- Polaris Elementary School Districtelementary136
- Polson Elementary School Districtelementary11,987
- Polson High School Districtsecondary13,223
- Poplar Elementary School Districtelementary3,067
- Poplar High School Districtsecondary3,067
- Potomac Elementary School Districtelementary1,150
- Powder River County High School Districtsecondary1,836
- Powell County High School Districtsecondary7,305
- Power Elementary School Districtelementary676
- Power High School Districtsecondary713
- Pryor Elementary School Districtelementary546
- Ramsay Elementary School Districtelementary1,923
- Rapelje Elementary School Districtelementary162
- Rapelje High School Districtsecondary259
- Rau Elementary School Districtelementary319
- Red Lodge Elementary School Districtelementary3,762
- Red Lodge High School Districtsecondary4,205
- Reed Point Elementary School Districtelementary406
- Reed Point High School Districtsecondary384
- Reichle Elementary School Districtelementary241
- Richey Elementary School Districtelementary395
- Richey High School Districtsecondary483
- Roberts K-12 Schools1,087
- Rocky Boy Elementary School Districtelementary2,766
- Rocky Boy High School Districtsecondary2,766
- Ronan Elementary School Districtelementary8,810
- Ronan High School Districtsecondary8,810
- Rosebud K-12503
- Ross Elementary School Districtelementary35
- Roundup Elementary School Districtelementary4,701
- Roundup High School Districtsecondary4,860
- Roy K-12 Schools320
- Ryegate K-12 Schools424
- S Y Elementary School Districtelementary248
- Saco Elementary School Districtelementary518
- Saco High School Districtsecondary514
- Sand Springs Elementary School Districtelementary156
- Savage Elementary School Districtelementary666
- Savage High School Districtsecondary701
- Scobey K-12 Schools1,494
- Seeley Lake Elementary School Districtelementary1,775
- Shelby Elementary School Districtelementary3,648
- Shelby High School Districtsecondary3,968
- Shepherd Elementary School Districtelementary4,337
- Shepherd High School Districtsecondary5,442
- Sheridan Elementary School Districtelementary2,072
- Sheridan High School Districtsecondary2,298
- Shields Valley Elementary School Districtelementary1,767
- Shields Valley High School Districtsecondary1,443
- Sidney Elementary School Districtelementary7,816
- Sidney High School Districtsecondary8,503
- Simms High School Districtsecondary3,187
- Smith Valley Elementary School Districtelementary3,147
- Somers Elementary School Districtelementary6,591
- South Stacey Elementary School Districtelementary122
- Spring Creek Colony Elementary School Districtelementary27
- Spring Creek Elementary School Districtelementary46
- Springhill Elementary School Districtelementary155
- St. Ignatius K-12 Schools3,813
- St. Regis K-12 Schools1,293
- Stanford K-12 Schools884
- Stevensville Elementary School Districtelementary8,521
- Stevensville High School Districtsecondary12,674
- Sun River Valley Elementary School Districtelementary1,700
- Sunburst K-12 Schools1,093
- Sunset Elementary School Districtelementary307
- Superior K-12 Schools2,497
- Swan Lake-Salmon Elementary School Districtelementary392
- Swan River Elementary School Districtelementary1,922
- Swan Valley Elementary School Districtelementary540
- Sweet Grass County High School Districtsecondary3,640
- Target Range Elementary School Districtelementary4,016
- Terry K-12 Schools1,250
- Thompson Falls Elementary School Districtelementary3,767
- Thompson Falls High School Districtsecondary3,910
- Three Forks Elementary School Districtelementary5,504
- Three Forks High School Districtsecondary5,405
- Townsend K-12 Schools6,030
- Trail Creek Elementary School Districtelementary223
- Trego Elementary School Districtelementary701
- Trinity Elementary School Districtelementary2,190
- Trout Creek Elementary School Districtelementary1,395
- Troy Elementary School Districtelementary2,712
- Troy High School Districtsecondary3,385
- Turner Elementary School Districtelementary524
- Turner High School Districtsecondary524
- Twin Bridges K-12 Schools1,369
- Ulm Elementary School Districtelementary653
- Upper West Shore Elementary School Districtelementary949
- Valier Elementary School Districtelementary963
- Valier High School Districtsecondary1,293
- Valley View Elementary School Districtelementary287
- Vaughn Elementary School Districtelementary1,487
- Victor K-12 Schools3,384
- Vida Elementary School Districtelementary584
- West Glacier Elementary School Districtelementary922
- West Valley Elementary School Districtelementary6,546
- West Yellowstone K-122,180
- Westby K-12 Schools449
- White Sulphur Springs K-122,007
- Whitefish Elementary School Districtelementary15,318
- Whitefish High School Districtsecondary16,023
- Whitehall Elementary School Districtelementary3,363
- Whitehall High School Districtsecondary4,103
- Whitewater K-12 Schools232
- Wibaux K-12 Schools1,193
- Willow Creek Elementary School Districtelementary322
- Willow Creek High School Districtsecondary238
- Winifred K-12 Schools545
- Winnett K-12 Schools447
- Wisdom Elementary School Districtelementary283
- Wise River Elementary School Districtelementary299
- Wolf Creek Elementary School Districtelementary662
- Wolf Point Elementary School Districtelementary4,188
- Wolf Point High School Districtsecondary4,631
- Woodman Elementary School Districtelementary589
- Wyola Elementary School Districtelementary811
- Yaak Elementary School Districtelementary293
- Yellowstone Academy Elementary School Districtelementary188
- Zurich Elementary School Districtelementary224
Congressional districts
As drawn for the 119th Congress (2025–2027).
- Congressional District 1564,861
- Congressional District 2552,014
State senate districts
The upper chamber’s districts, as drawn in 2024.
- State Senate District 123,178
- State Senate District 221,931
- State Senate District 321,326
- State Senate District 423,923
- State Senate District 524,701
- State Senate District 622,978
- State Senate District 722,475
- State Senate District 821,634
- State Senate District 922,569
- State Senate District 1021,572
- State Senate District 1122,181
- State Senate District 1221,152
- State Senate District 1322,722
- State Senate District 1422,019
- State Senate District 1521,708
- State Senate District 1619,087
- State Senate District 1721,660
- State Senate District 1821,647
- State Senate District 1922,890
- State Senate District 2021,953
- State Senate District 2119,806
- State Senate District 2223,863
- State Senate District 2321,175
- State Senate District 2423,040
- State Senate District 2521,242
- State Senate District 2621,642
- State Senate District 2722,703
- State Senate District 2822,213
- State Senate District 2922,224
- State Senate District 3020,984
- State Senate District 3121,620
- State Senate District 3223,211
- State Senate District 3323,468
- State Senate District 3423,906
- State Senate District 3523,001
- State Senate District 3623,091
- State Senate District 3720,592
- State Senate District 3823,730
- State Senate District 3923,162
- State Senate District 4022,588
- State Senate District 4123,051
- State Senate District 4222,517
- State Senate District 4322,416
- State Senate District 4424,311
- State Senate District 4522,888
- State Senate District 4622,407
- State Senate District 4722,118
- State Senate District 4821,512
- State Senate District 4922,966
- State Senate District 5022,122
State house districts
The lower chamber’s districts, as drawn in 2024.
- State House District 111,477
- State House District 211,701
- State House District 311,349
- State House District 410,582
- State House District 510,826
- State House District 610,500
- State House District 711,553
- State House District 812,370
- State House District 911,482
- State House District 1013,219
- State House District 1111,246
- State House District 1211,732
- State House District 1311,206
- State House District 1411,269
- State House District 1510,592
- State House District 1611,042
- State House District 1710,681
- State House District 1811,888
- State House District 1910,872
- State House District 2010,700
- State House District 2111,169
- State House District 2211,012
- State House District 2310,527
- State House District 2410,625
- State House District 2510,472
- State House District 2612,250
- State House District 2710,614
- State House District 2811,405
- State House District 2911,151
- State House District 3010,557
- State House District 319,892
- State House District 329,195
- State House District 3310,708
- State House District 3410,952
- State House District 3510,642
- State House District 3611,005
- State House District 3711,066
- State House District 3811,824
- State House District 3911,347
- State House District 4010,606
- State House District 419,837
- State House District 429,969
- State House District 4310,283
- State House District 4413,580
- State House District 4510,564
- State House District 4610,611
- State House District 4710,465
- State House District 4812,575
- State House District 499,843
- State House District 5011,399
- State House District 519,753
- State House District 5211,889
- State House District 5311,447
- State House District 5411,256
- State House District 5511,116
- State House District 5611,097
- State House District 5711,431
- State House District 5810,793
- State House District 5910,593
- State House District 6010,391
- State House District 6111,711
- State House District 629,909
- State House District 6310,611
- State House District 6412,600
- State House District 6510,927
- State House District 6612,541
- State House District 6712,176
- State House District 6811,730
- State House District 6911,747
- State House District 7011,254
- State House District 7110,993
- State House District 7212,098
- State House District 739,840
- State House District 7410,752
- State House District 7511,494
- State House District 7612,236
- State House District 7712,245
- State House District 7810,917
- State House District 7911,418
- State House District 8011,170
- State House District 8111,709
- State House District 8211,342
- State House District 8310,751
- State House District 8411,766
- State House District 8510,629
- State House District 8611,787
- State House District 8711,025
- State House District 8813,286
- State House District 8911,595
- State House District 9011,293
- State House District 9112,013
- State House District 9210,394
- State House District 9311,805
- State House District 9410,313
- State House District 9510,753
- State House District 9610,759
- State House District 9710,815
- State House District 9812,151
- State House District 9910,563
- State House District 10011,559
PUMAs
Public Use Microdata Areas: areas of 100,000 people or more that the state draws from census tracts, for the Census Bureau’s microdata.
- Billings City PUMA111,603
- Central Montana–Havre & Livingston City PUMA133,969
- Eastern Montana–Sidney & Miles City PUMA150,615
- Flathead, Glacier & Lincoln Counties–Kalispell City PUMA145,507
- Gallatin County–Bozeman City PUMA124,074
- Lake, Mineral, Missoula & Sanders Counties–Missoula City PUMA171,477
- Lewis and Clark & Cascade Counties–Great Falls & Helena City PUMA158,070
- Southwest Montana–Butte-Silver Bow & Hamilton City PUMA121,560
Urban areas
Each that reaches into Montana, with its whole population. Urban areas are the densely settled land the Census Bureau draws after each census, whatever the city lines.
- Anaconda-Deer Lodge County, MT6,326
- Belgrade, MT20,168
- Billings, MT130,213
- Bozeman, MT62,585
- Butte-Silver Bow, MT30,538
- Columbia Falls, MT6,109
- Dillon, MT4,664
- Glendive, MT6,717
- Great Falls, MT66,913
- Hamilton, MT7,305
- Havre, MT9,603
- Helena, MT55,488
- Kalispell, MT40,444
- Laurel, MT9,063
- Lewistown, MT6,183
- Libby, MT4,650
- Livingston, MT9,662
- Miles City, MT9,296
- Missoula, MT91,556
- Polson, MT6,043
- Sidney, MT6,400
- Whitefish, MT8,814
Tribal areas
Each that reaches into Montana, with its whole population.
- Blackfeet Indian Reservation and Off-Reservation Trust Land, MT10,199
- Crow Reservation and Off-Reservation Trust Land, MT6,848
- Flathead Reservation, MT32,167
- Fort Belknap Reservation and Off-Reservation Trust Land, MT3,148
- Fort Peck Indian Reservation and Off-Reservation Trust Land, MT9,785
- Northern Cheyenne Indian Reservation and Off-Reservation Trust Land, MT–SD4,363
- Rocky Boy's Reservation and Off-Reservation Trust Land, MT3,369
- Turtle Mountain Reservation and Off-Reservation Trust Land, ND–MT–SD7,447
Turn Montana into your planning report.
Social Explorer Studio builds an editable profile of any place, with tables and charts beside the county and state, and exports to Word, PDF and Excel.
Questions about Montana
What is the population of Montana?
1,144,694 people, according to the ACS 2025 1-year estimates, which the Census Bureau adjusts to match its own population estimate. That’s the 43rd largest of the 50 states and DC.
What is the FIPS code for Montana?
30. Every county’s and place’s FIPS code in Montana starts with it. The Census Bureau’s full geographic identifier (GEOID) is 0400000US30.
What is the largest city in Montana?
Billings, with 121,249 people. Other large places here include Missoula, Great Falls and Bozeman.
What is the median household income in Montana?
$77,099 (±$2,479), according to the ACS 2025 1-year estimates, lower than the US ($84,780).
What is the median age in Montana?
41.0 years (±0.4), according to the ACS 2025 1-year estimates, higher than the US (39.5).
How much does housing cost in Montana?
Montana’s median home value is $427,500 (±$6,599) and its median gross rent is $1,208 (±$43) a month, according to the ACS 2025 1-year estimates. 44.1% (±3.1%) of its renters pay 30% or more of their income on rent.
Is Montana growing?
Montana’s population grew 10.8%, from 1,032,949 in 2015 to 1,144,694 in 2025, according to the ACS 1-year estimates.
Where do people who work in Montana live?
487,228 of its 503,051 jobs are held by people who live here. Of those who commute in, the most come from Idaho, Wyoming, Washington.
Where does this census data come from?
The U.S. Census Bureau’s American Community Survey, through Social Explorer’s tables: the latest 1-year estimates where they exist, for the most recent numbers, and 5-year estimates otherwise. Each table lists its code, so you can find it again.
Is this data free to use?
Yes. You can read it, cite it, download the CSV and embed the charts, with no account. To map other variables, compare your own areas or build a report, see Social Explorer’s plans in a live demo.
Sources and how to cite
American Community Survey 2025 1-year estimates, or 2020–2024 5-year estimates where noted, U.S. Census Bureau, from Social Explorer’s tables A00001, A00002, A01004, A04001, A06001, A08001, A09005, A10001, A10003, A10008, A10030, A10036, A10040, A10047, A10055, A10060, A12001, A13004, A14006, A14024, A14028, A16002, A17005, A18002, A18009, A20001, B02002, B09001, B13002, B18101, C16001. Maps by census tract use 2020–2024 5-year estimates, since the 1-year survey doesn’t cover tracts. Commuting: LEHD LODES 2023. These are estimates from a sample, each with its margin of error. Data retrieved November 14, 2026. How these profiles are made.
U.S. Census Bureau, American Community Survey 2025 1-year estimates, or 2020–2024 5-year estimates where noted, via Social Explorer. “Montana.” https://www.socialexplorer.com/places/montana. Accessed November 14, 2026.