

Georgia: Population, demographics and census data
Home to 11,302,748 people, the 8th largest of the 50 states and DC. It grew 10.7% between 2015 and 2025.
- Population
- 11.30M. Census Bureau estimate · Rank 8 of the 50 states and DC
- Median household income
- $81,847 ±$761. US $84,780
- Median age
- 38.3 ±0.2. US 39.5
ACS 2025 1-year estimates, U.S. Census Bureau
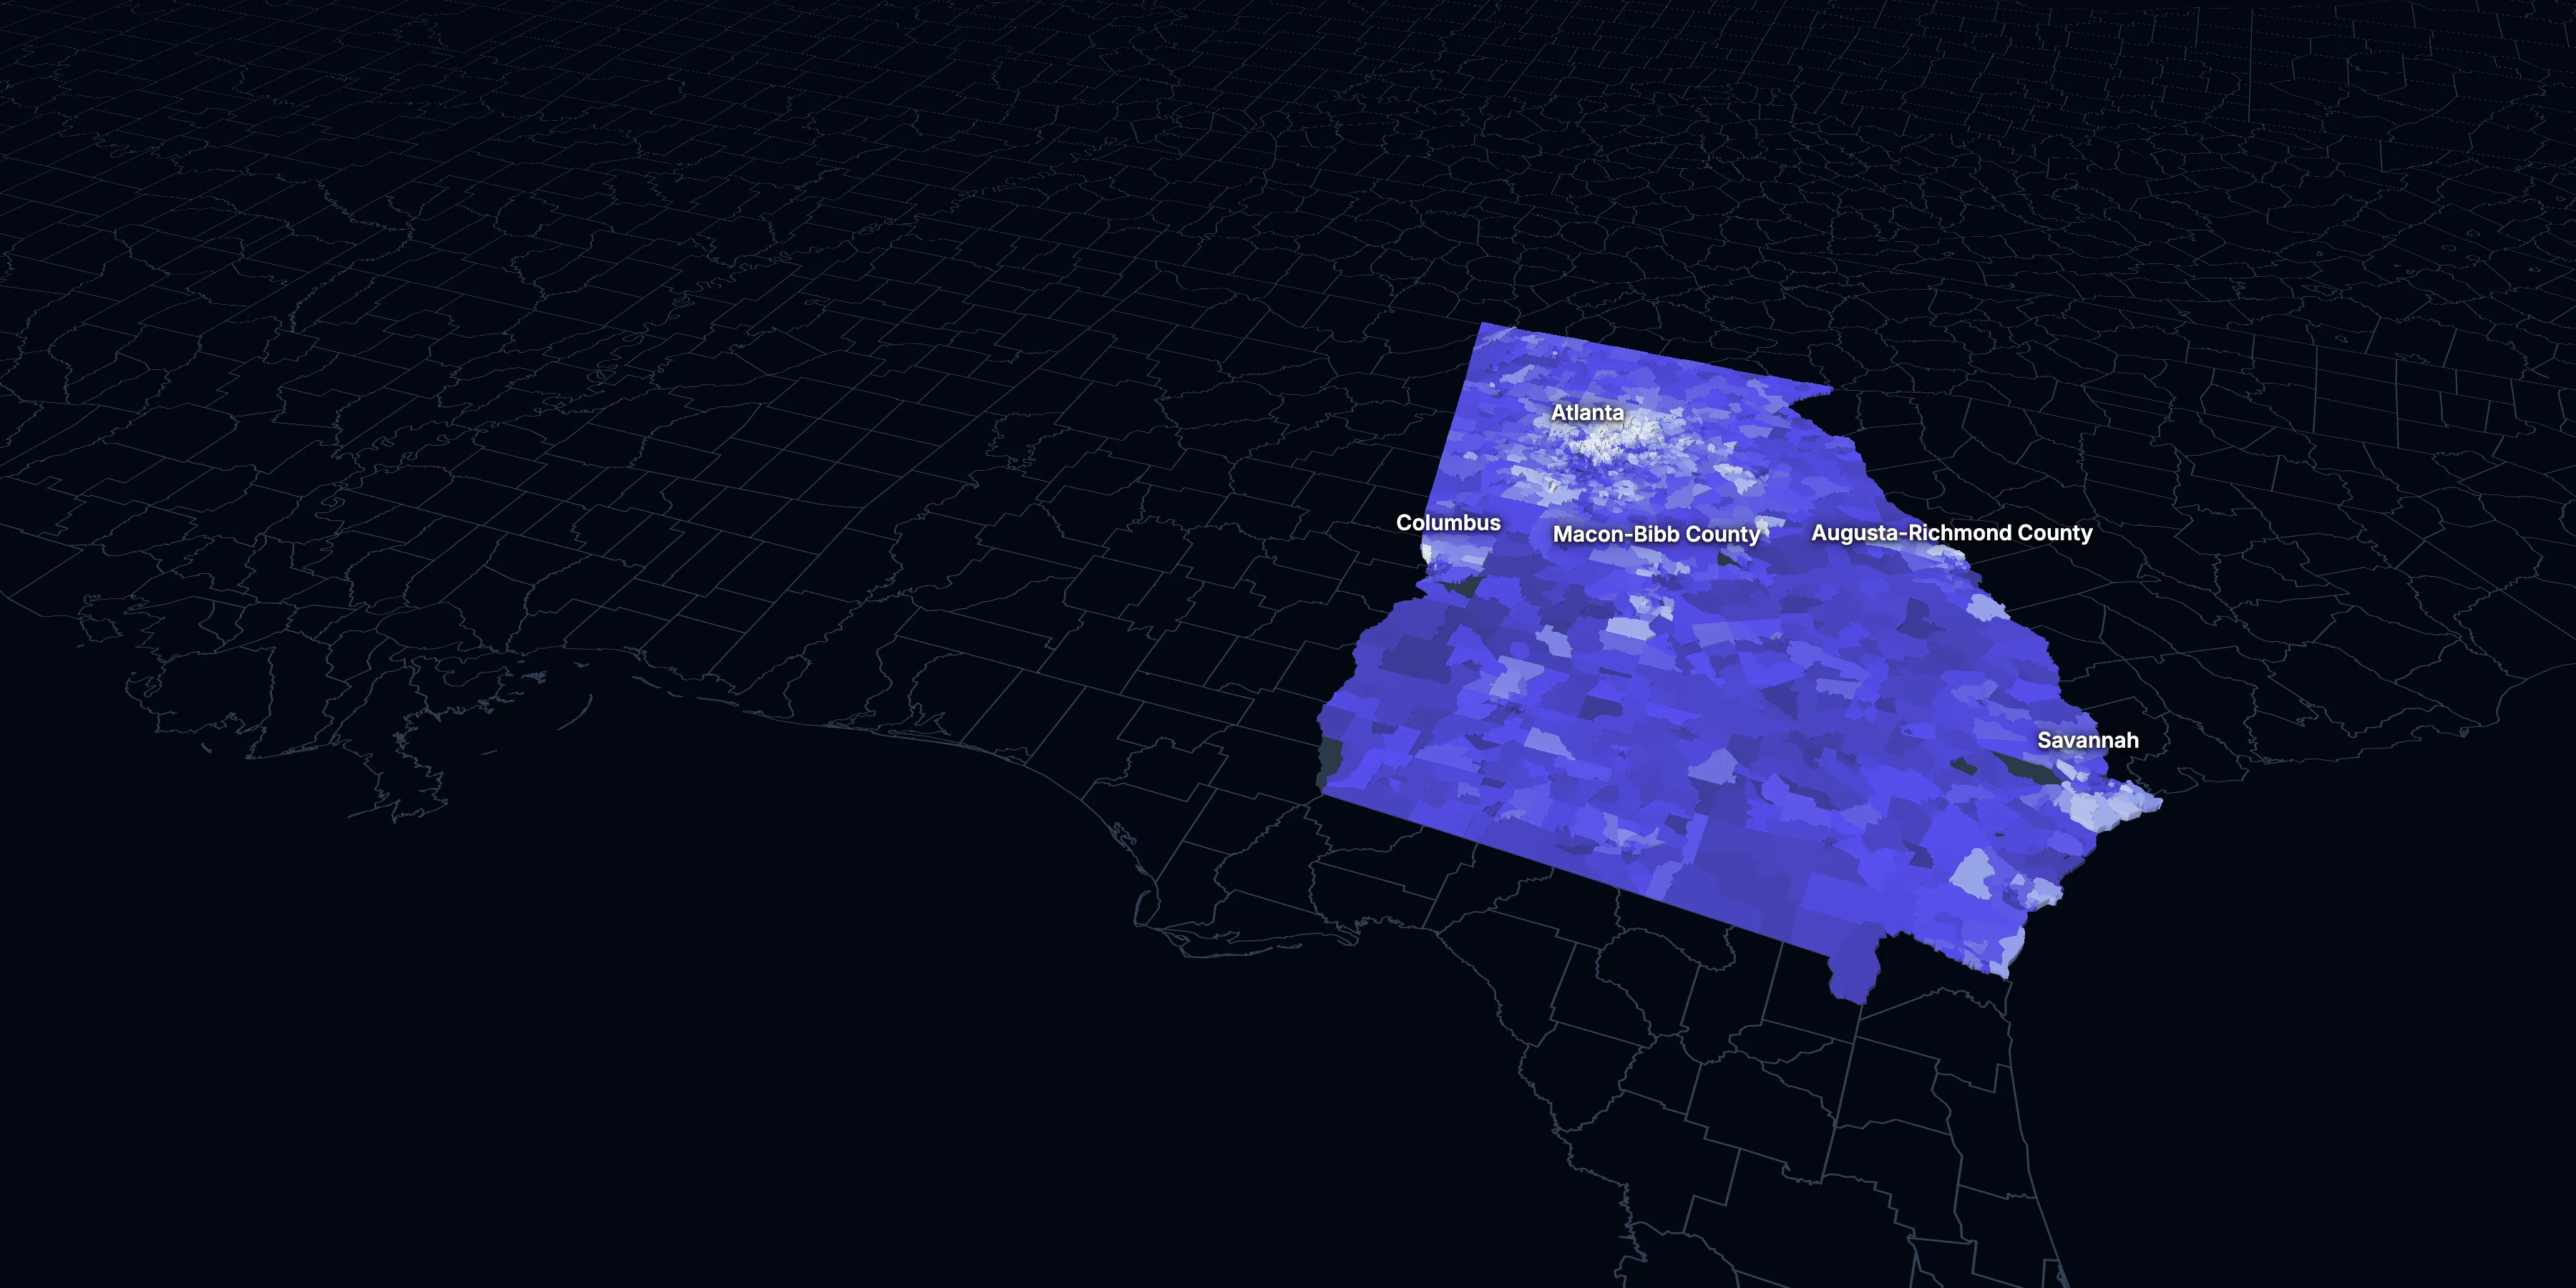
Taller, lighter tracts have higher household incomes
About Georgia
Georgia’s median household income is $81,847 (±$761), lower than the US ($84,780), and its median age is 38.3 (±0.2), according to the ACS 2025 1-year estimates. Its largest city is Atlanta.
± is each figure’s margin of error, at 90% confidence, and † marks one too uncertain to lean on. Under each percentage in the tables is the number it counts. How the margins are worked out.
FIPS code 13
Highlights
What stands out in Georgia
The numbers where Georgia sits furthest from the nation, or past a recognized policy benchmark.
Past a policy benchmark
+10 points
ElevatedRent growth ahead of income
After inflation, rent grew 27% from 2015 to 2025, and household income 17%. The dots show rent growth.
Furthest from the national picture
30.2%
3rd among statesBlack, not Hispanic
That’s higher than the US (11.7%). It’s the 3rd highest of the 50 states and DC.
11.7%
3rd among statesNo health insurance
That’s higher than the US (8.4%). It’s the 3rd highest of the 50 states and DC.
16.7%
Lower than the US65 and over
That’s lower than the US (19.0%). It’s the 5th lowest of the 50 states and DC.
16.1%
Lower than the USSpeak a language other than English at home
That’s lower than the US (22.9%).
2.59
Higher than the USPeople per household
That’s higher than the US (2.49). It’s the 6th highest of the 50 states and DC.
2015 to 2025
How Georgia changed in ten years
The state added 1,087,888 people. It got older, more foreign-born and better educated, and poverty fell 4.8 points.
Population, change since 2015
+10.7% in the state and +6.3% in the US.
Source: ACS 1-year, 2015 to 2025, table A00001.
Show data
| Georgia | United States | |
|---|---|---|
| 2015 | 0.0% | 0.0% |
| 2016 | +0.9% | +0.5% |
| 2017 | +2.1% | +1.3% |
| 2018 | +3.0% | +1.8% |
| 2019 | +3.9% | +2.1% |
| 2021 | +5.7% | +3.3% |
| 2022 | +6.8% | +3.7% |
| 2023 | +8.0% | +4.2% |
| 2024 | +9.5% | +5.8% |
| 2025 | +10.7% | +6.3% |
Embed
Median household income, in 2025 dollars
+16.6% in the state and +10.9% in the US.
Source: ACS 1-year, 2015 to 2025, table A14006.
Show data
| Georgia | United States | |
|---|---|---|
| 2015 | $70,205 | $76,413 |
| 2016 | $72,443 | $77,931 |
| 2017 | $74,392 | $79,891 |
| 2018 | $75,947 | $80,059 |
| 2019 | $78,689 | $83,427 |
| 2021 | $79,737 | $83,521 |
| 2022 | $80,686 | $82,811 |
| 2023 | $79,399 | $82,683 |
| 2024 | $82,672 | $84,339 |
| 2025 | $81,847 | $84,780 |
Embed
Living in poverty
−4.8 points in the state and −3.0 points in the US.
Source: ACS 1-year, 2015 to 2025, table A13004.
Show data
| Georgia | United States | |
|---|---|---|
| 2015 | 17.0% | 14.7% |
| 2016 | 16.0% | 14.0% |
| 2017 | 14.9% | 13.4% |
| 2018 | 14.3% | 13.1% |
| 2019 | 13.3% | 12.3% |
| 2021 | 14.0% | 12.8% |
| 2022 | 12.7% | 12.6% |
| 2023 | 13.6% | 12.5% |
| 2024 | 12.6% | 12.1% |
| 2025 | 12.3% | 11.8% |
Embed
Bachelor’s degree or more
+6.3 points in the state and +6.7 points in the US.
Source: ACS 1-year, 2015 to 2025, table A12001.
Show data
| Georgia | United States | |
|---|---|---|
| 2015 | 29.9% | 30.6% |
| 2016 | 30.5% | 31.3% |
| 2017 | 30.9% | 32.0% |
| 2018 | 31.9% | 32.6% |
| 2019 | 32.5% | 33.1% |
| 2021 | 34.6% | 35.0% |
| 2022 | 34.7% | 35.7% |
| 2023 | 35.4% | 36.2% |
| 2024 | 36.3% | 36.8% |
| 2025 | 36.3% | 37.4% |
Embed
Median gross rent, in 2025 dollars
+26.5% in the state and +18.5% in the US.
Source: ACS 1-year, 2015 to 2025, table A18009.
Show data
| Georgia | United States | |
|---|---|---|
| 2015 | $1,245 | $1,314 |
| 2016 | $1,262 | $1,327 |
| 2017 | $1,268 | $1,340 |
| 2018 | $1,303 | $1,368 |
| 2019 | $1,332 | $1,393 |
| 2021 | $1,381 | $1,427 |
| 2022 | $1,406 | $1,440 |
| 2023 | $1,489 | $1,496 |
| 2024 | $1,556 | $1,537 |
| 2025 | $1,575 | $1,557 |
Embed
Median home value, in 2025 dollars
+58.8% in the state and +39.3% in the US.
Source: ACS 1-year, 2015 to 2025, table A10036.
Show data
| Georgia | United States | |
|---|---|---|
| 2015 | $218,244 | $266,469 |
| 2016 | $225,610 | $277,278 |
| 2017 | $229,996 | $288,124 |
| 2018 | $245,463 | $296,908 |
| 2019 | $257,092 | $305,336 |
| 2021 | $299,139 | $337,116 |
| 2022 | $329,449 | $355,481 |
| 2023 | $343,632 | $361,931 |
| 2024 | $354,805 | $372,685 |
| 2025 | $346,500 | $371,100 |
Embed
ACS 1-year estimates. The dotted stretch of each line spans 2020, when the Census Bureau released no standard 1-year estimates. Dollar values are in 2025 dollars.
| Indicator | 2015 | 2025 | Change |
|---|---|---|---|
| Population | 10,214,860 | 11,302,748 | +10.7% |
| Median age | 36.4 | 38.3 | +1.9 years |
| 65 and over | 12.8% | 16.7% | +4.0 points |
| Born outside the US | 10.0% | 11.7% | +1.7 points |
| Hispanic or Latino | 9.3% | 12.0% | +2.7 points |
| Median household income | $70,205 | $81,847 | +16.6% |
| Living in poverty | 17.0% | 12.3% | −4.8 points |
| Bachelor’s degree or more | 29.9% | 36.3% | +6.3 points |
| Households that rent | 38.2% | 33.8% | −4.3 points |
| Median gross rent | $1,245 | $1,575 | +26.5% |
| Median home value | $218,244 | $346,500 | +58.8% |
2796 census tracts
Georgia, tract by tract
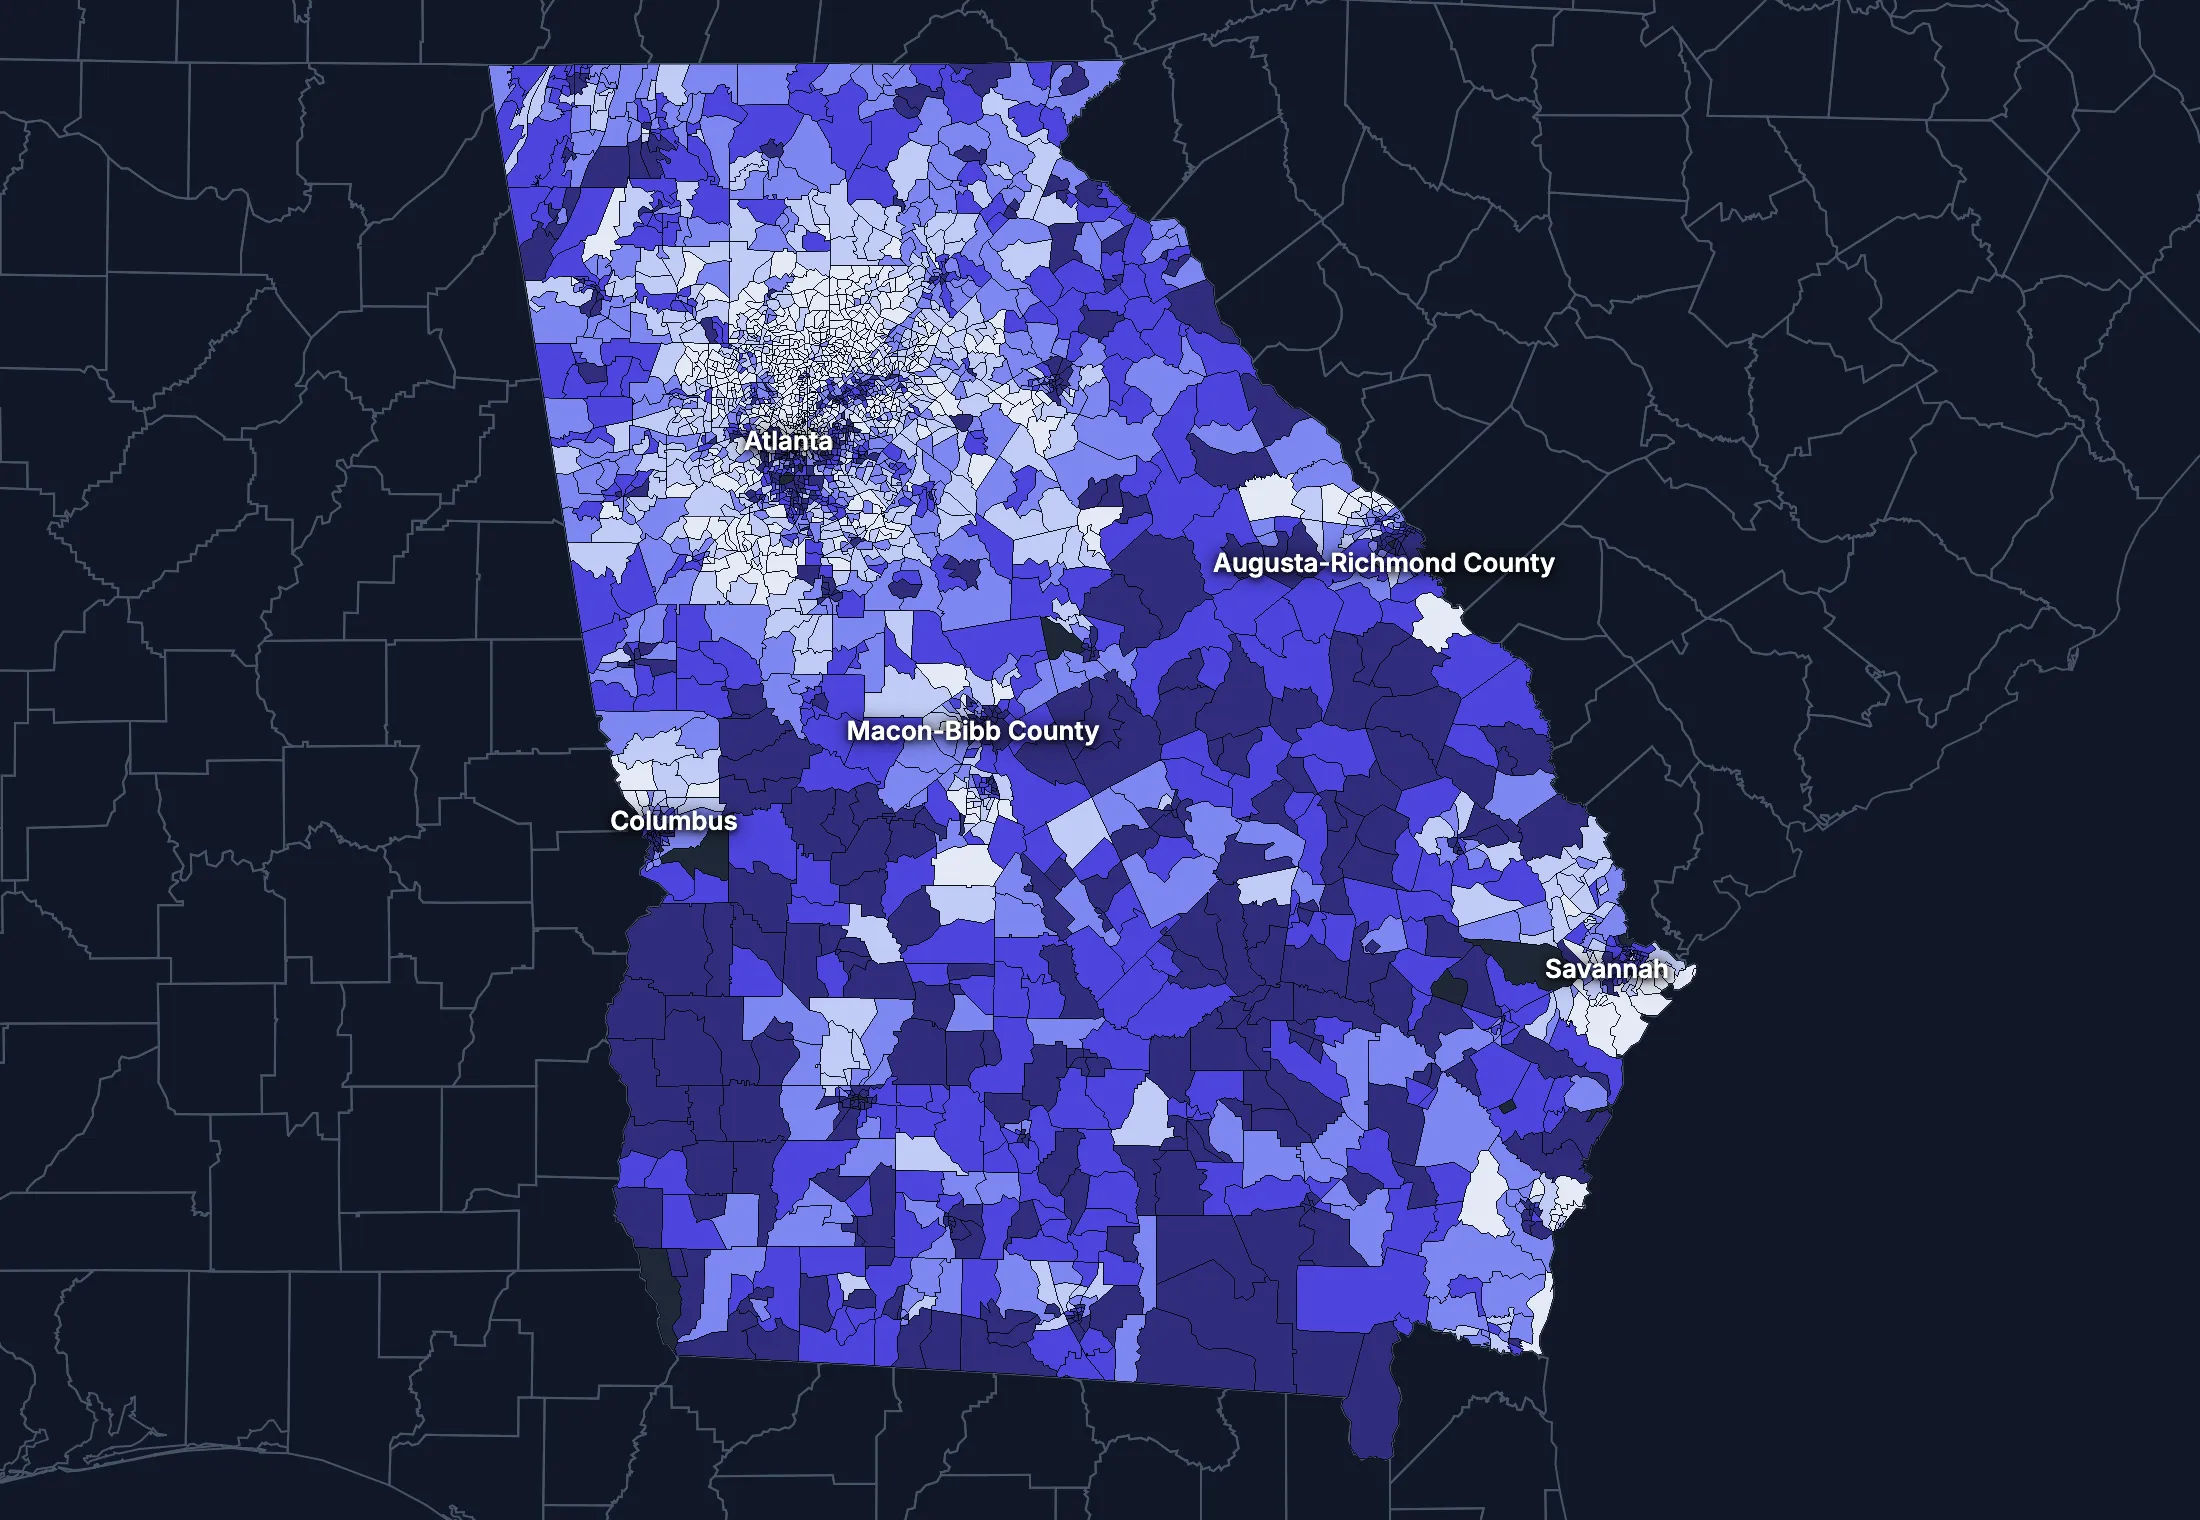
State averages hide a lot. These census tracts are the closest the census comes to neighborhoods.
Where the state’s average misleads
Each tick is one census tract, and the dark line marks the state. Hover over a tick or tap it to see the tract.
Poverty
692 of 2780 tracts are at least 1.5 times the state’s overall 13.4%, and 986 are at two-thirds of it or less.
Highest: Tract 1, 83.1%. Lowest: Tract 302.65, 0.0%.
Renters paying 30% or more of income
202 of 2671 tracts are at least 1.5 times the state’s overall 48.4%, and 718 are at two-thirds of it or less.
Highest: Tract 502.40, 100.0%. Lowest: Tract 9601, 0.0%.
Adults with a bachelor’s degree
518 of 2784 tracts are at least 1.5 times the state’s overall 34.9%, and 1037 are at two-thirds of it or less.
Highest: Tract 90.02, 96.6%. Lowest: Tract 9703.01, 1.2%.
Median household income
504 of 2764 tracts are at least 1.5 times the typical tract’s $74,056, and 490 are at two-thirds of it or less.
Highest: Tract 211.01, $250,000 or more. Lowest: Tract 1, $8,354.
American Community Survey 2020–2024 5-year estimates, by census tract. Income is capped at $250,000+ by the Census Bureau.
People
Who lives in Georgia
Its median age of 38.3 is lower than the US (39.5). 11.7% of residents were born outside the US, and 16.1% speak a language other than English at home.
Age
Source: ACS 2025 1-year, table A01001.
Show data
| Georgia | United States | |
|---|---|---|
| Under 18 | 22.1% ±0.2% , number 2,492,841 ±24,510 | 21.0% ±<0.1% , number 71,689,151 ±111,800 |
| 18 to 24 | 9.6% ±0.2% , number 1,088,134 ±19,320 | 9.3% ±<0.1% , number 31,716,680 ±98,660 |
| 25 to 34 | 13.7% ±0.1% , number 1,545,744 ±15,060 | 13.6% ±<0.1% , number 46,357,354 ±55,690 |
| 35 to 44 | 13.4% ±0.2% , number 1,512,561 ±20,320 | 13.4% ±<0.1% , number 45,746,189 ±105,700 |
| 45 to 54 | 12.5% ±0.1% , number 1,412,440 ±12,270 | 11.8% ±<0.1% , number 40,257,563 ±53,540 |
| 55 to 64 | 12.1% ±0.2% , number 1,362,710 ±18,840 | 12.1% ±<0.1% , number 41,242,904 ±104,700 |
| 65 to 74 | 9.7% ±0.2% , number 1,093,510 ±17,350 | 10.8% ±<0.1% , number 36,895,650 ±91,520 |
| 75 and over | 7.0% ±0.1% , number 794,808 ±13,910 | 8.2% ±<0.1% , number 27,879,368 ±78,140 |
Embed
Race and ethnicity
Source: ACS 2025 1-year, table A04001.
Show data
| Georgia | United States | |
|---|---|---|
| White, not Hispanic | 47.1% ±0.1% , number 5,319,449 ±9,672 | 55.0% ±<0.1% , number 187,959,031 ±58,340 |
| Hispanic or Latino | 12.0% ±<0.1% , number 1,353,367 ±3,526 | 20.5% ±<0.1% , number 69,975,516 ±13,270 |
| Black, not Hispanic | 30.2% ±0.2% , number 3,416,393 ±20,650 | 11.7% ±<0.1% , number 40,096,453 ±106,200 |
| Asian, not Hispanic | 5.1% ±0.1% , number 580,158 ±7,907 | 6.5% ±<0.1% , number 22,096,709 ±58,340 |
| Other or multiracial | 5.6% ±0.2% , number 633,381 ±24,610 | 6.3% ±<0.1% , number 21,657,150 ±150,100 |
Embed
Language spoken at home
Source: ACS 2025 1-year, table C16001.
Show data
| Georgia | United States | |
|---|---|---|
| English only | 83.9% ±0.3% , number 8,956,757 ±30,520 | 77.1% ±0.1% , number 249,390,588 ±275,300 |
| Spanish | 8.9% ±0.2% , number 951,964 ±18,810 | 13.9% ±0.1% , number 44,921,985 ±177,800 |
| Other Indo-European | 3.0% ±0.2% , number 322,264 ±18,250 | 4.0% ±<0.1% , number 12,862,980 ±113,500 |
| Asian and Pacific Island | 3.0% ±0.2% , number 320,821 ±16,340 | 3.8% ±<0.1% , number 12,288,841 ±99,740 |
| Arabic and other | 1.2% ±0.1% , number 128,004 ±12,510 | 1.3% ±<0.1% , number 4,116,949 ±71,480 |
Embed
Marital status
Source: ACS 2025 1-year, table A11001.
Show data
| Georgia | United States | |
|---|---|---|
| Now married | 46.5% ±0.4% , number 4,309,024 ±33,010 | 47.9% ±0.1% , number 135,567,564 ±223,300 |
| Never married | 35.9% ±0.3% , number 3,332,824 ±28,370 | 34.8% ±0.1% , number 98,647,238 ±152,600 |
| Divorced | 10.8% ±0.2% , number 997,784 ±21,720 | 10.2% ±<0.1% , number 28,879,967 ±112,900 |
| Widowed | 5.3% ±0.1% , number 489,572 ±12,960 | 5.5% ±<0.1% , number 15,599,094 ±69,430 |
| Separated | 1.5% ±0.1% , number 143,724 ±8,622 | 1.6% ±<0.1% , number 4,441,399 ±49,160 |
Embed
Where people lived a year ago
Source: ACS 2025 1-year, table A08001.
Show data
| Georgia | United States | |
|---|---|---|
| Same home | 88.0% ±0.3% , number 9,849,111 ±37,800 | 88.4% ±0.1% , number 298,889,697 ±214,800 |
| Same county | 4.9% ±0.2% , number 545,203 ±27,200 | 6.0% ±<0.1% , number 20,202,671 ±166,300 |
| Another county in the state | 4.3% ±0.2% , number 482,498 ±20,860 | 3.0% ±<0.1% , number 10,168,097 ±89,190 |
| Another state | 2.2% ±0.1% , number 247,832 ±14,990 | 2.1% ±<0.1% , number 7,025,589 ±81,660 |
| Another country | 0.6% ±0.1% , number 61,826 ±9,323 | 0.6% ±<0.1% , number 1,984,943 ±47,210 |
Embed
Top countries of birth, among those born abroad
Source: ACS 2025 1-year, table A07001.
Show data
| Georgia | |
|---|---|
| Mexico | 17.1% , number 226,354 |
| India | 10.5% , number 138,900 |
| Vietnam | 4.4% , number 58,538 |
| Korea | 4.4% , number 58,417 |
| Jamaica | 4.3% , number 57,361 |
| Venezuela | 3.4% , number 45,617 |
Embed
All the numbers
| Indicator | Georgia | US | Rank among states* | Table |
|---|---|---|---|---|
| Population | 11,302,748 | 341,784,859 | 8th | A00001 |
| People per square mile | 196 | 97 | 18th | A00002 |
| Land area (square miles) | 57,718 | – | – | A00002 |
| Median age | 38.3 ±0.2 | 39.5 ±0.1 | 42nd | A01004 |
| Under 18 | 22.1% ±0.2% , number 2,492,841 ±24,510 | 21.0% ±<0.1% , number 71,689,151 ±111,800 | 13th | B02002 |
| 65 and over | 16.7% ±0.2% , number 1,888,318 ±22,240 | 19.0% ±<0.1% , number 64,775,018 ±120,300 | 47th | B02002 |
| Born outside the US | 11.7% ±0.3% , number 1,326,029 ±31,010 | 14.7% ±0.1% , number 50,409,320 ±204,800 | 17th | A06001 |
| Speak a language other than English at home | 16.1% ±0.3% , number 1,723,053 ±33,320 | 22.9% ±0.1% , number 74,190,755 ±244,000 | 20th | C16001 |
| Veterans (adults) | 6.8% ±0.2% , number 596,611 ±15,410 | 5.9% ±<0.1% , number 15,746,228 ±85,320 | 26th | A16002 |
| Living with a disability | 13.5% ±0.2% , number 1,497,902 ±23,850 | 13.7% ±<0.1% , number 46,271,455 ±126,000 | 32nd | B18101 |
| Women 15–50 who had a baby in the past year | 4.8% ±0.3% , number 132,173 ±7,957 | 5.0% ±0.1% , number 4,016,759 ±44,040 | 25th | B13002 |
| Lived in the same home a year ago | 88.0% ±0.3% , number 9,849,111 ±37,800 | 88.4% ±0.1% , number 298,889,697 ±214,800 | 33rd | A08001 |
| White, not Hispanic | 47.1% ±0.1% , number 5,319,449 ±9,672 | 55.0% ±<0.1% , number 187,959,031 ±58,340 | 44th | A04001 |
| Hispanic or Latino | 12.0% ±<0.1% , number 1,353,367 ±3,526 | 20.5% ±<0.1% , number 69,975,516 ±13,270 | 26th | A04001 |
| Black, not Hispanic | 30.2% ±0.2% , number 3,416,393 ±20,650 | 11.7% ±<0.1% , number 40,096,453 ±106,200 | 3rd | A04001 |
| Asian, not Hispanic | 5.1% ±0.1% , number 580,158 ±7,907 | 6.5% ±<0.1% , number 22,096,709 ±58,340 | 15th | A04001 |
*1 is the highest. Population is ranked among all states, and the rest among those of 1,000 people or more, whose figures can be ranked. Ranks use 5-year estimates, the only ones covering every state, so they can differ slightly from the figures here.
Income and work
Lower incomes than the US
The median household income is $81,847, lower than the US ($84,780). 12.3% of people live in poverty, and 11.7% have no health insurance, higher than the US (8.4%).
Household income
Source: ACS 2025 1-year, table A14001.
Show data
| Georgia | United States | |
|---|---|---|
| Under $25,000 | 14.0% ±0.4% , number 596,510 ±16,020 | 14.0% ±0.1% , number 18,727,548 ±88,990 |
| $25,000 to $49,999 | 15.9% ±0.4% , number 677,863 ±18,230 | 15.4% ±0.1% , number 20,665,585 ±101,400 |
| $50,000 to $74,999 | 16.2% ±0.4% , number 692,194 ±18,640 | 15.3% ±0.1% , number 20,513,565 ±88,500 |
| $75,000 to $99,999 | 13.1% ±0.4% , number 560,650 ±15,870 | 12.5% ±0.1% , number 16,814,245 ±87,520 |
| $100,000 to $149,999 | 18.1% ±0.4% , number 772,107 ±18,630 | 17.9% ±0.1% , number 24,018,984 ±99,670 |
| $150,000 to $199,999 | 9.7% ±0.3% , number 413,991 ±11,750 | 10.1% ±0.1% , number 13,521,827 ±70,660 |
| $200,000 or more | 13.0% ±0.3% , number 556,542 ±11,020 | 14.8% ±0.1% , number 19,801,668 ±84,120 |
Embed
What residents do for work
Source: ACS 2025 1-year, table A17004.
Show data
| Georgia | United States | |
|---|---|---|
| Education and health care | 21.9% ±0.4% , number 1,204,399 ±21,950 | 24.4% ±0.1% , number 40,862,193 ±140,800 |
| Professional and business services | 13.8% ±0.3% , number 760,745 ±17,930 | 12.8% ±0.1% , number 21,375,231 ±87,110 |
| Retail trade | 11.4% ±0.3% , number 627,725 ±18,460 | 10.6% ±0.1% , number 17,781,181 ±96,660 |
| Manufacturing | 9.8% ±0.3% , number 538,614 ±16,020 | 9.6% ±0.1% , number 16,064,394 ±91,270 |
| Arts, food and lodging | 8.6% ±0.3% , number 472,723 ±17,440 | 8.9% ±0.1% , number 14,811,502 ±87,840 |
| Transportation and warehousing | 7.3% ±0.3% , number 401,227 ±17,100 | 5.9% ±<0.1% , number 9,832,211 ±73,020 |
| Construction | 6.5% ±0.2% , number 357,655 ±11,300 | 6.7% ±<0.1% , number 11,254,981 ±79,620 |
| Finance, insurance and real estate | 6.3% ±0.2% , number 346,265 ±11,000 | 6.6% ±<0.1% , number 11,025,569 ±68,570 |
Embed
Where workers come from and go
Georgia has 4,705,268 jobs and 4,712,276 employed residents. 188,012 people commute in to work and 195,020 commute out, while 4,517,256 both live and work here. The most commuters come from Alabama.
Most commuters come from
- Alabama: 54,185
- South Carolina: 44,359
- Florida: 28,642
Most residents commute to
- Tennessee: 46,964
- Florida: 37,174
- South Carolina: 35,480
Show data
| Georgia | |
|---|---|
| Live and work here | 4,517,256 |
| Work here, live elsewhere | 188,012 |
| Live here, work elsewhere | 195,020 |
Embed
All the numbers
| Indicator | Georgia | US | Rank among states* | Table |
|---|---|---|---|---|
| Median household income | $81,847 ±$761 | $84,780 ±$215 | 27th | A14006 |
| Income per person | $43,451 ±$397 | $47,171 ±$115 | 32nd | A14024 |
| Income inequality (Gini index) | 0.472 ±0.004 | 0.482 ±0.001 | 16th | A14028 |
| Living in poverty | 12.3% ±0.4% , number 1,355,056 ±45,890 | 11.8% ±0.1% , number 39,264,183 ±277,400 | 14th | A13004 |
| Unemployment rate | 4.9% ±0.2% , number 284,003 ±10,970 | 4.9% ±<0.1% , number 8,574,594 ±64,350 | 19th | A17005 |
| No health insurance | 11.7% ±0.3% , number 1,301,260 ±30,300 | 8.4% ±<0.1% , number 28,323,306 ±152,000 | 3rd | A20001 |
*1 is the highest. Population is ranked among all states, and the rest among those of 1,000 people or more, whose figures can be ranked. Ranks use 5-year estimates, the only ones covering every state, so they can differ slightly from the figures here.
Education
College degrees close to the US
36.3% of adults 25 and over have a bachelor’s degree or more, lower than the US (37.4%).
Highest level of education
Source: ACS 2025 1-year, table A12001.
Show data
| Georgia | United States | |
|---|---|---|
| Less than high school | 9.3% ±0.3% , number 715,707 ±19,380 | 9.4% ±0.1% , number 22,321,002 ±120,500 |
| High school only | 27.0% ±0.4% , number 2,085,106 ±31,240 | 25.6% ±0.1% , number 61,096,726 ±203,400 |
| Some college | 27.5% ±0.4% , number 2,119,901 ±30,360 | 27.7% ±0.1% , number 65,920,977 ±173,500 |
| Bachelor’s degree | 21.5% ±0.3% , number 1,658,998 ±26,260 | 22.3% ±0.1% , number 53,224,312 ±196,700 |
| Graduate degree | 14.8% ±0.3% , number 1,142,061 ±24,910 | 15.0% ±0.1% , number 35,816,011 ±159,400 |
Embed
All the numbers
| Indicator | Georgia | US | Rank among states* | Table |
|---|---|---|---|---|
| Bachelor’s degree or more | 36.3% ±0.5% , number 2,801,059 ±36,200 | 37.4% ±0.1% , number 89,040,323 ±253,200 | 25th | A12001 |
| High school graduate or more | 90.7% ±0.7% , number 7,006,066 ±56,640 | 90.6% ±0.2% , number 216,058,026 ±368,200 | 41st | A12001 |
*1 is the highest. Population is ranked among all states, and the rest among those of 1,000 people or more, whose figures can be ranked. Ranks use 5-year estimates, the only ones covering every state, so they can differ slightly from the figures here.
Housing
Home values outran incomes
33.8% of households rent, lower than the US (34.7%). The median home is worth $346,500 and the median rent is $1,575. After inflation, home values rose 59% from 2015 to 2025, while household income rose 17%.
Housing costs and income, 2015 to 2025, after inflation
Source: ACS 1-year, table A10036, A18009, A14006.
Show data
| Georgia | United States | |
|---|---|---|
| Median home value | +58.8% | +39.3% |
| Median rent | +26.5% | +18.5% |
| Median household income | +16.6% | +10.9% |
Embed
Types of homes
Source: ACS 2025 1-year, table A10032.
Show data
| Georgia | United States | |
|---|---|---|
| Single-family, detached | 66.0% ±0.5% , number 3,123,655 ±21,960 | 60.9% ±0.1% , number 90,335,844 ±173,300 |
| Single-family, attached | 4.8% ±0.2% , number 227,929 ±8,995 | 6.4% ±<0.1% , number 9,527,703 ±51,230 |
| 2 to 4 units | 5.3% ±0.3% , number 251,752 ±11,860 | 7.5% ±0.1% , number 11,109,005 ±75,790 |
| 5 to 19 units | 8.2% ±0.3% , number 386,345 ±16,110 | 8.7% ±0.1% , number 12,829,882 ±97,590 |
| 20 or more units | 8.5% ±0.3% , number 400,158 ±12,760 | 11.1% ±0.1% , number 16,381,450 ±92,310 |
| Mobile homes and other | 7.3% ±0.2% , number 343,772 ±10,660 | 5.4% ±<0.1% , number 8,045,083 ±53,680 |
Embed
When homes were built
Source: ACS 2025 1-year, table A10055.
Show data
| Georgia | United States | |
|---|---|---|
| 2010 or later | 18.7% ±0.5% , number 799,180 ±19,930 | 15.1% ±0.1% , number 20,257,912 ±101,300 |
| 2000 to 2009 | 21.5% ±0.4% , number 918,293 ±19,360 | 13.8% ±0.1% , number 18,535,840 ±92,260 |
| 1980 to 1999 | 31.4% ±0.5% , number 1,341,995 ±23,120 | 24.1% ±0.1% , number 32,332,570 ±118,900 |
| 1960 to 1979 | 17.8% ±0.4% , number 760,952 ±17,560 | 22.9% ±0.1% , number 30,726,302 ±110,000 |
| Before 1960 | 10.5% ±0.3% , number 449,437 ±14,110 | 24.0% ±0.1% , number 32,210,798 ±121,500 |
Embed
All the numbers
| Indicator | Georgia | US | Rank among states* | Table |
|---|---|---|---|---|
| Housing units | 4,733,611 | – | – | A10001 |
| Households | 4,269,857 ±14,140 | – | – | A10008 |
| People per household | 2.59 ±0.01 | 2.49 ±0.01 | 6th | A10003 |
| Households that rent | 33.8% ±0.6% , number 1,444,265 ±24,020 | 34.7% ±0.1% , number 46,551,688 ±193,200 | 13th | A10060 |
| Vacant homes | 9.8% ±0.3% , number 463,754 ±14,300 | 9.6% ±0.1% , number 14,165,545 ±137,100 | 27th | A10047, A10060 |
| Median gross rent | $1,575 ±$15 | $1,557 ±$4 | 21st | A18009 |
| Median home value | $346,500 ±$2,425 | $371,100 ±$646 | 26th | A10036 |
| Renters paying 30% or more of income | 49.0% ±1.2% , number 707,616 ±21,030 | 48.3% ±0.2% , number 22,486,693 ±122,100 | 13th | A18002 |
| Owners paying 30% or more of income | 23.7% ±0.6% , number 669,770 ±16,930 | 24.2% ±0.1% , number 21,201,943 ±93,050 | 23rd | A10040 |
| Homes built before 1960 | 10.5% ±0.3% , number 449,437 ±14,110 | 24.0% ±0.1% , number 32,210,798 ±121,500 | 47th | A10055 |
*1 is the highest. Population is ranked among all states, and the rest among those of 1,000 people or more, whose figures can be ranked. Ranks use 5-year estimates, the only ones covering every state, so they can differ slightly from the figures here.
Getting around
A driving state with long commutes
71.7% of workers drive alone and 14.5% work from home. 44.2% of those who travel to work spend 30 minutes or more getting there, and 6.3% of households have no vehicle.
How people get to work
Source: ACS 2025 1-year, table A09005.
Show data
| Georgia | United States | |
|---|---|---|
| Drive alone | 71.7% ±0.5% , number 3,891,666 ±34,550 | 69.8% ±0.1% , number 115,297,377 ±192,900 |
| Carpool | 9.2% ±0.3% , number 502,099 ±17,350 | 8.9% ±0.1% , number 14,712,170 ±97,240 |
| Public transit | 1.9% ±0.2% , number 104,521 ±8,923 | 4.3% ±<0.1% , number 7,100,386 ±63,330 |
| Walk | 1.3% ±0.1% , number 71,807 ±5,927 | 2.4% ±<0.1% , number 4,016,469 ±41,070 |
| Work from home | 14.5% ±0.4% , number 786,890 ±21,250 | 12.9% ±0.1% , number 21,288,393 ±105,700 |
| Other | 1.3% ±0.1% , number 72,707 ±7,200 | 1.7% ±<0.1% , number 2,799,658 ±41,510 |
Embed
Time spent getting to work
Source: ACS 2025 1-year, table B09001.
Show data
| Georgia | United States | |
|---|---|---|
| Under 10 minutes | 9.8% ±0.3% , number 456,378 ±16,350 | 12.0% ±0.1% , number 17,199,225 ±93,440 |
| 10 to 19 minutes | 25.5% ±0.5% , number 1,181,747 ±25,980 | 27.8% ±0.1% , number 40,059,540 ±137,700 |
| 20 to 29 minutes | 20.6% ±0.5% , number 954,349 ±23,690 | 21.0% ±0.1% , number 30,221,743 ±111,100 |
| 30 to 39 minutes | 17.3% ±0.5% , number 804,921 ±22,140 | 17.1% ±0.1% , number 24,659,138 ±103,800 |
| 40 to 59 minutes | 15.4% ±0.4% , number 713,761 ±20,030 | 12.6% ±0.1% , number 18,104,709 ±97,070 |
| 60 minutes or more | 11.5% ±0.4% , number 531,644 ±17,430 | 9.5% ±0.1% , number 13,681,705 ±84,440 |
Embed
Vehicles per household
Source: ACS 2025 1-year, table A10030.
Show data
| Georgia | United States | |
|---|---|---|
| None | 6.3% ±0.3% , number 270,468 ±12,950 | 8.8% ±0.1% , number 11,781,997 ±77,240 |
| One | 32.9% ±0.6% , number 1,406,379 ±25,850 | 33.1% ±0.1% , number 44,424,682 ±160,700 |
| Two | 36.5% ±0.6% , number 1,556,632 ±24,100 | 36.0% ±0.1% , number 48,200,889 ±176,800 |
| Three or more | 24.3% ±0.4% , number 1,036,378 ±19,190 | 22.1% ±0.1% , number 29,655,854 ±113,300 |
Embed
All the numbers
| Indicator | Georgia | US | Rank among states* | Table |
|---|---|---|---|---|
| Drive to work alone | 71.7% ±0.5% , number 3,891,666 ±34,550 | 69.8% ±0.1% , number 115,297,377 ±192,900 | 29th | A09005 |
| Take public transit | 1.9% ±0.2% , number 104,521 ±8,923 | 4.3% ±<0.1% , number 7,100,386 ±63,330 | 21st | A09005 |
| Work from home | 14.5% ±0.4% , number 786,890 ±21,250 | 12.9% ±0.1% , number 21,288,393 ±105,700 | 17th | A09005 |
| Commute 30 minutes or more | 44.2% ±0.7% , number 2,050,326 ±34,570 | 39.2% ±0.1% , number 56,445,552 ±165,300 | 7th | B09001 |
| Households with no vehicle | 6.3% ±0.3% , number 270,468 ±12,450 | 8.8% ±<0.1% , number 11,781,997 ±64,240 | 31st | A10030 |
*1 is the highest. Population is ranked among all states, and the rest among those of 1,000 people or more, whose figures can be ranked. Ranks use 5-year estimates, the only ones covering every state, so they can differ slightly from the figures here.
Places
The largest cities in Georgia
Population, from the latest estimates available. Figures cover the whole of each place.
Largest places
- Atlanta: 529,101
- Columbus: 202,171
- Augusta-Richmond County: 200,138
- Macon-Bibb County: 157,556
- Savannah: 149,432
- Athens-Clarke County: 128,164
- South Fulton: 112,812
- Sandy Springs: 105,019
States like this one
- Illinois: 12,694,798
- North Carolina: 10,730,404
- Tennessee: 7,066,383
- Oregon: 4,254,293
States at least a third this size, with the closest income, education, age, housing and origins.
Every county and place in Georgia
Find any county, city, town, metro area, ZIP code, school district or district in Georgia.
Counties
Each of the 159 counties with its population, from ACS 2020–2024 5-year estimates.
- Appling County18,493
- Atkinson County8,337
- Bacon County11,109
- Baker County2,790
- Baldwin County43,642
- Banks County19,264
- Barrow County89,886
- Bartow County113,113
- Ben Hill County17,089
- Berrien County18,352
- Bibb County156,578
- Bleckley County12,430
- Brantley County18,315
- Brooks County16,293
- Bryan County48,263
- Bulloch County82,683
- Burke County24,470
- Butts County26,496
- Calhoun County5,498
- Camden County56,970
- Candler County11,043
- Carroll County124,569
- Catoosa County68,634
- Charlton County12,818
- Chatham County300,879
- Chattahoochee County8,887
- Chattooga County25,036
- Cherokee County281,032
- Clarke County129,609
- Clay County2,850
- Clayton County298,924
- Clinch County6,759
- Cobb County775,208
- Coffee County43,347
- Colquitt County46,224
- Columbia County162,434
- Cook County17,532
- Coweta County152,852
- Crawford County12,225
- Crisp County19,790
- Dade County16,165
- Dawson County30,242
- Decatur County29,195
- DeKalb County765,351
- Dodge County19,805
- Dooly County10,984
- Dougherty County83,091
- Douglas County147,888
- Early County10,603
- Echols County3,709
- Effingham County69,143
- Elbert County19,849
- Emanuel County23,026
- Evans County10,757
- Fannin County25,742
- Fayette County122,244
- Floyd County99,693
- Forsyth County267,287
- Franklin County24,234
- Fulton County1.08M
- Gilmer County32,426
- Glascock County2,932
- Glynn County85,447
- Gordon County59,100
- Grady County26,108
- Greene County20,109
- Gwinnett County979,864
- Habersham County47,793
- Hall County212,705
- Hancock County8,650
- Haralson County31,285
- Harris County36,086
- Hart County26,939
- Heard County11,773
- Henry County249,960
- Houston County169,649
- Irwin County9,285
- Jackson County84,757
- Jasper County15,929
- Jeff Davis County14,924
- Jefferson County15,341
- Jenkins County8,711
- Johnson County9,190
- Jones County28,673
- Lamar County19,571
- Lanier County10,221
- Laurens County49,798
- Lee County33,626
- Liberty County67,397
- Lincoln County7,854
- Long County18,374
- Lowndes County119,965
- Lumpkin County34,505
- Macon County11,864
- Madison County31,528
- Marion County7,509
- McDuffie County21,718
- McIntosh County11,312
- Meriwether County20,929
- Miller County5,850
- Mitchell County21,058
- Monroe County29,664
- Montgomery County8,640
- Morgan County21,078
- Murray County40,562
- Muscogee County203,711
- Newton County118,152
- Oconee County43,551
- Oglethorpe County15,509
- Paulding County178,909
- Peach County28,560
- Pickens County34,951
- Pierce County20,202
- Pike County19,903
- Polk County43,785
- Pulaski County9,939
- Putnam County22,855
- Quitman County2,264
- Rabun County17,312
- Randolph County6,196
- Richmond County206,069
- Rockdale County95,281
- Schley County4,513
- Screven County14,130
- Seminole County9,156
- Spalding County68,892
- Stephens County27,012
- Stewart County4,869
- Sumter County29,061
- Talbot County5,742
- Taliaferro County1,558
- Tattnall County24,208
- Taylor County7,786
- Telfair County11,831
- Terrell County8,850
- Thomas County45,777
- Tift County41,438
- Toombs County27,102
- Towns County12,913
- Treutlen County6,376
- Troup County70,330
- Turner County8,939
- Twiggs County7,803
- Union County26,304
- Upson County28,029
- Walker County68,762
- Walton County103,313
- Ware County35,976
- Warren County5,170
- Washington County19,849
- Wayne County30,949
- Webster County2,381
- Wheeler County7,335
- White County28,810
- Whitfield County103,598
- Wilcox County8,798
- Wilkes County9,549
- Wilkinson County8,747
- Worth County20,451
Cities, towns and other places
Each of the 669 with its population, from ACS 2020–2024 5-year estimates. Census-designated places are communities without a local government of their own, drawn by the Census Bureau so they can be counted.
- Abbeville2,771
- Acworth22,473
- Adairsville4,999
- Adel5,641
- Adrian590
- Ailey489
- Alamo3,037
- Alapaha444
- Albany67,224
- Aldora82
- Allenhurst804
- Allentown341
- Alma3,426
- Alpharetta66,855
- Alston140
- Alto1,055
- Ambrose382
- Americus15,813
- Andersonville231
- Antioch870
- Appling702
- Arabi550
- Aragon2,536
- Arcade1,704
- Argyle573
- Arlington1,014
- Arnoldsville500
- Ashburn4,231
- Athens-Clarke County127,345
- Atlanta505,268
- Attapulgus673
- Auburn8,711
- Augusta-Richmond County201,528
- Austell8,447
- Avalon314
- Avera259
- Avondale Estates3,530
- Axson268
- Baconton790
- Bainbridge14,404
- Baldwin4,000
- Ball Ground2,856
- Barnesville6,121
- Bartow199
- Barwick369
- Baxley4,888
- Bellville171
- Belvedere Park14,181
- Bemiss9,201
- Berkeley Lake2,597
- Berlin535
- Berry College1,647
- Bethlehem707
- Between482
- Bishop427
- Blackshear3,578
- Blairsville902
- Blakely5,238
- Bloomingdale3,007
- Blue Ridge1,323
- Bluffton350
- Blythe806
- Bogart1,403
- Bolingbroke426
- Bonanza3,279
- Boston1,520
- Bostwick269
- Bowdon2,006
- Bowersville522
- Bowman804
- Box Springs228
- Boykin25
- Braselton15,178
- Braswell400
- Bremen7,488
- Brinson207
- Bristol54
- Bronwood338
- Brookhaven57,855
- Brooklet2,288
- Brooks603
- Broxton1,031
- Brunswick15,307
- Buchanan1,306
- Buckhead CDP4,702
- Buckhead town331
- Buena Vista1,717
- Buford17,997
- Butler1,935
- Byromville575
- Byron5,971
- Cadwell470
- Cairo10,055
- Calhoun18,183
- Calvary205
- Camak356
- Camilla5,124
- Candler-McAfee20,905
- Canon879
- Canoochee84
- Canton35,741
- Carl183
- Carlton245
- Carnesville852
- Carrollton27,392
- Cartersville24,074
- Cataula1,522
- Cave Spring1,080
- Cecil486
- Cedartown10,227
- Centerville8,505
- Centralhatchee662
- Chamblee30,895
- Chatsworth4,893
- Chattahoochee Hills3,782
- Chattanooga Valley4,601
- Chauncey264
- Chester1,808
- Chickamauga3,014
- Clarkesville1,959
- Clarkston14,557
- Claxton2,529
- Clayton2,018
- Clermont1,243
- Cleveland3,534
- Climax170
- Clyattville147
- Cobbtown568
- Cochran4,803
- Cohutta930
- Colbert806
- Coleman44
- College Park14,712
- Collins533
- Colquitt1,898
- Columbus203,711
- Comer2,029
- Commerce8,013
- Concord438
- Conley5,822
- Conyers18,512
- Coolidge923
- Cordele9,994
- Cornelia4,992
- Country Club Estates8,780
- Covington14,584
- Crawford1,016
- Crawfordville548
- Crescent882
- Crooked Creek798
- Culloden428
- Cumming8,469
- Cusseta-Chattahoochee County8,887
- Cuthbert2,991
- Dacula7,444
- Dahlonega7,299
- Daisy422
- Dallas14,714
- Dalton34,538
- Damascus272
- Danielsville952
- Danville111
- Darien1,452
- Dasher944
- Davisboro2,231
- Dawson4,247
- Dawsonville4,403
- De Soto99
- Dearing760
- Decatur24,518
- Deenwood2,360
- Deepstep124
- Demorest2,512
- Denton222
- Dewy Rose131
- Dexter1,054
- Dillard326
- Dixie86
- Dixie Union81
- Dock Junction8,147
- Doerun961
- Donalsonville2,831
- Dooling36
- Doraville11,134
- Douglas11,749
- Douglasville37,536
- Druid Hills8,169
- Du Pont197
- Dublin16,136
- Dudley718
- Duluth32,426
- Dunwoody51,758
- Dutch Island1,225
- Eagle Grove35
- East Dublin2,489
- East Ellijay488
- East Griffin1,174
- East Newnan956
- East Point38,335
- Eastman5,584
- Eatonton6,515
- Echols County3,709
- Edge Hill14
- Edison1,340
- Elberton4,720
- Ellaville1,668
- Ellenton267
- Ellerslie1,011
- Ellijay1,927
- Emerson1,573
- Empire306
- Enigma1,140
- Ephesus642
- Epworth1,994
- Eton735
- Euharlee4,230
- Eulonia986
- Evans36,998
- Everett67
- Experiment3,387
- Faceville142
- Fair Oaks9,014
- Fairburn16,831
- Fairfield Plantation6,172
- Fairmount1,279
- Fairplay1,881
- Fairview5,302
- Fargo512
- Fayetteville19,719
- Fitzgerald8,918
- Flemington1,571
- Flovilla1,358
- Flowery Branch10,925
- Folkston4,631
- Forest Park19,504
- Forsyth4,642
- Fort Gaines1,248
- Fort Oglethorpe10,416
- Fort Stewart9,285
- Fort Valley8,858
- Franklin958
- Franklin Springs1,108
- Funston732
- Gainesville45,032
- Garden City10,426
- Gardi14
- Garfield270
- Gay119
- Geneva101
- Georgetown11,158
- Georgetown-Quitman County2,264
- Gibson990
- Gillsville454
- Girard137
- Glennville5,179
- Glenwood745
- Godfrey27
- Good Hope582
- Gordon2,485
- Gough139
- Graham629
- Grantville3,251
- Gray3,512
- Grayson4,858
- Greensboro3,609
- Greenville1,326
- Gresham Park6,935
- Griffin23,761
- Grovetown17,014
- Gumbranch241
- Gumlog2,382
- Guyton2,740
- Hagan1,293
- Hahira3,451
- Hamilton2,043
- Hampton8,687
- Hannahs Mill3,230
- Hapeville6,630
- Haralson204
- Hardwick3,402
- Harlem3,885
- Harrison458
- Hartwell4,562
- Hawkinsville4,731
- Hazlehurst4,092
- Helen415
- Henderson1,952
- Hephzibah3,747
- Heron Bay4,595
- Hiawassee1,293
- Hickox520
- Higgston292
- Hilltop222
- Hiltonia492
- Hinesville35,679
- Hiram5,231
- Hoboken1,016
- Hogansville3,246
- Holly Springs18,627
- Homeland755
- Homer1,892
- Homerville2,432
- Hortense136
- Hoschton4,534
- Howard54
- Hull832
- Ideal718
- Ila526
- Indian Springs2,070
- Iron City371
- Irondale9,185
- Irwinton534
- Isle of Hope2,053
- Ivey964
- Jackson5,741
- Jacksonville121
- Jakin155
- Jasper4,630
- Jefferson14,990
- Jeffersonville1,008
- Jekyll Island769
- Jenkinsburg323
- Jersey148
- Jesup9,942
- Johns Creek81,988
- Jonesboro6,143
- Juliette128
- Junction City353
- Kennesaw34,605
- Kennesaw State University2,284
- Keysville297
- Kings Bay Base2,210
- Kingsland19,627
- Kingston993
- Kite188
- Knoxville36
- LaFayette6,967
- LaGrange32,078
- Lake City2,909
- Lake Park1,234
- Lakeland2,968
- Lakeview4,723
- Lakeview Estates3,596
- Lavonia2,279
- Lawrenceville30,954
- Leary264
- Leesburg3,542
- Lenox713
- Leslie510
- Lexington520
- Lilburn15,390
- Lilly150
- Lincoln Park688
- Lincolnton1,768
- Lindale4,289
- Lithia Springs16,875
- Lithonia2,622
- Locust Grove10,532
- Loganville15,527
- Lone Oak297
- Lookout Mountain1,721
- Louisville2,132
- Lovejoy11,508
- Ludowici1,897
- Lula2,964
- Lumber City1,004
- Lumpkin1,000
- Luthersville1,000
- Lyerly525
- Lyons4,219
- Mableton77,678
- Macon-Bibb County156,578
- Madison4,864
- Manassas92
- Manchester3,631
- Manor136
- Mansfield380
- Marietta62,263
- Marshallville1,046
- Martin422
- Martinez33,750
- Matthews134
- Maxeys360
- Maysville2,086
- McCaysville1,392
- McDonough30,947
- McIntyre633
- McRae-Helena6,030
- Meansville323
- Meigs924
- Mendes327
- Menlo620
- Mershon26
- Metter3,989
- Midville378
- Midway2,185
- Milan842
- Milledgeville16,748
- Millen2,956
- Millwood66
- Milner979
- Milstead689
- Milton41,546
- Mineral Bluff294
- Mitchell167
- Molena635
- Monroe15,648
- Montezuma2,966
- Montgomery4,976
- Monticello2,747
- Montrose311
- Moody AFB1,630
- Moreland685
- Morgan1,902
- Morganton241
- Morrow6,364
- Morven553
- Moultrie14,588
- Mount Airy1,622
- Mount Vernon1,913
- Mount Zion2,433
- Mountain City1,004
- Mountain Park CDP12,850
- Mountain Park city703
- Nahunta1,386
- Nashville4,928
- Naylor293
- Nelson1,166
- New England391
- Newborn653
- Newington418
- Newnan44,235
- Newton479
- Nicholls3,434
- Nicholson2,335
- Norcross18,007
- Norman Park1,116
- Norristown21
- North Decatur18,442
- North Druid Hills17,997
- North High Shoals698
- Norwood314
- Nunez124
- Oak Park428
- Oakwood5,862
- Ochlocknee628
- Ocilla3,100
- Oconee315
- Odum453
- Offerman873
- Oglethorpe869
- Ohoopee5
- Oliver214
- Omega1,194
- Orchard Hill152
- Oxford1,770
- Palmetto4,797
- Panthersville9,053
- Parrott79
- Patterson906
- Pavo901
- Peachtree City39,576
- Peachtree Corners42,373
- Pearson1,919
- Pelham3,433
- Pembroke2,693
- Pendergrass3,435
- Perkins69
- Perry23,001
- Phillipsburg193
- Pine Lake882
- Pine Mountain1,314
- Pinehurst557
- Pineview618
- Piney Grove576
- Pitts327
- Plains750
- Plainville360
- Pooler28,466
- Port Wentworth12,892
- Portal646
- Porterdale1,466
- Poulan681
- Powder Springs18,009
- Pulaski230
- Putney3,150
- Quitman4,062
- Ranger134
- Raoul2,253
- Ray City852
- Rayle174
- Rebecca284
- Redan31,017
- Reed Creek3,151
- Register195
- Reidsville2,553
- Remerton1,280
- Rentz395
- Resaca1,126
- Rest Haven44
- Reynolds995
- Rhine662
- Riceboro742
- Richland1,595
- Richmond Hill18,181
- Riddleville110
- Rincon11,332
- Ringgold3,435
- Riverdale14,792
- Roberta1,257
- Robins AFB1,193
- Rochelle1,243
- Rock Spring1,183
- Rockingham171
- Rockmart5,204
- Rocky Ford276
- Rome38,189
- Roopville467
- Rossville3,978
- Roswell92,621
- Royston2,258
- Russell1,089
- Rutledge1,271
- Sale City318
- Salem385
- Sandersville5,601
- Sandy Springs107,087
- Santa Claus169
- Sardis912
- Sasser327
- Satilla1,057
- Sautee-Nacoochee605
- Savannah147,898
- Scotland218
- Scottdale10,542
- Screven689
- Senoia5,589
- Seville61
- Shady Dale345
- Shannon2,012
- Sharon56
- Sharpsburg309
- Shellman974
- Shiloh758
- Siloam344
- Skidaway Island9,315
- Sky Valley647
- Smarr58
- Smithville285
- Smyrna56,633
- Snellville21,620
- Social Circle5,217
- Soperton2,908
- South Fulton110,471
- Sparks2,056
- Sparta1,830
- Springfield2,974
- St. Marys19,166
- St. Simons16,228
- Stapleton460
- Statesboro34,149
- Statham3,018
- Sterling2,091
- Stillmore715
- Stockbridge35,737
- Stockton185
- Stone Mountain6,623
- Stonecrest60,501
- Sugar Hill26,128
- Summertown210
- Summerville4,408
- Sumner439
- Sunny Side994
- Sunnyside1,031
- Sunset Village825
- Surrency163
- Suwanee22,349
- Swainsboro7,571
- Sycamore1,096
- Sylvania2,618
- Sylvester5,489
- Talahi Island961
- Talbotton665
- Talking Rock274
- Tallapoosa3,227
- Tallulah Falls288
- Talmo369
- Tarrytown142
- Taylorsville335
- Tazewell33
- Temple5,901
- Tennille1,650
- The Rock109
- Thomaston9,831
- Thomasville18,666
- Thomson6,821
- Thunderbolt2,533
- Tifton17,210
- Tiger362
- Tignall763
- Toccoa9,238
- Toomsboro467
- Trenton2,123
- Trion2,033
- Tucker37,123
- Tunnel Hill939
- Turin742
- Twin City2,075
- Ty Ty689
- Tybee Island3,123
- Tyrone7,896
- Unadilla3,064
- Union City27,728
- Union Point1,704
- Unionville2,000
- Uvalda540
- Valdosta55,252
- Varnell2,920
- Vernonburg133
- Vidalia10,752
- Vidette181
- Vienna2,881
- Villa Rica18,551
- Vinings14,390
- Waco779
- Wadley1,706
- Waleska808
- Walnut Grove1,685
- Walthourville3,823
- Waresboro108
- Warm Springs463
- Warner Robins82,990
- Warrenton2,000
- Warthen78
- Warwick641
- Washington3,680
- Watkinsville3,350
- Waverly106
- Waverly Hall650
- Waycross13,756
- Waynesboro5,644
- Waynesville906
- Webster County2,381
- Wenona286
- West Brow1,044
- West Point3,403
- Whigham449
- White953
- White Plains175
- Whitemarsh Island6,886
- Whitesburg525
- Wildwood368
- Willacoochee1,301
- Williamson681
- Wilmington Island13,905
- Winder19,437
- Winterville2,223
- Woodbine1,399
- Woodbury820
- Woodland272
- Woodstock37,381
- Woodville241
- Woolsey235
- Wrens2,187
- Wrightsville3,487
- Yatesville435
- Yonah543
- Young Harris1,252
- Zebulon1,698
Metro and micro areas
Each of the 39 that reach into Georgia, with its whole population, from ACS 2020–2024 5-year estimates. Metro and micro areas are counties tied together by commuting, drawn by the Office of Management and Budget.
- Albany, GA Metro Area146,018
- Americus, GA Micro Area33,574
- Athens-Clarke County, GA Metro Area220,197
- Atlanta-Sandy Springs-Roswell, GA Metro Area6.26M
- Augusta-Richmond County, GA-SC Metro Area624,181
- Bainbridge, GA Micro Area29,195
- Brunswick-St. Simons, GA Metro Area115,074
- Calhoun, GA Micro Area59,100
- Cedartown, GA Micro Area43,785
- Chattanooga, TN-GA Metro Area575,812
- Columbus, GA-AL Metro Area325,615
- Cordele, GA Micro Area19,790
- Cornelia, GA Micro Area47,793
- Dalton, GA Metro Area144,160
- Douglas, GA Micro Area51,684
- Dublin, GA Micro Area58,988
- Eufaula, AL-GA Micro Area26,907
- Fitzgerald, GA Micro Area17,089
- Gainesville, GA Metro Area212,705
- Hinesville, GA Metro Area85,771
- Jefferson, GA Micro Area84,757
- Jesup, GA Micro Area30,949
- Kingsland, GA Micro Area56,970
- LaGrange, GA-AL Micro Area104,522
- Macon-Bibb County, GA Metro Area234,943
- Milledgeville, GA Micro Area43,642
- Moultrie, GA Micro Area46,224
- Rome, GA Metro Area99,693
- Savannah, GA Metro Area418,285
- Statesboro, GA Micro Area93,440
- Summerville, GA Micro Area25,036
- Thomaston, GA Micro Area28,029
- Thomasville, GA Micro Area71,885
- Tifton, GA Micro Area50,377
- Toccoa, GA Micro Area27,012
- Valdosta, GA Metro Area150,188
- Vidalia, GA Micro Area35,742
- Warner Robins, GA Metro Area198,209
- Waycross, GA Micro Area56,178
ZIP codes
Each of the 734 with people in it, by the town it's centered in, from ACS 2020–2024 5-year estimates. These are the Census Bureau's ZIP Code Tabulation Areas, which follow the Postal Service's ZIP codes as closely as census blocks allow.
- 30002Avondale Estates5,225
- 30004Milton68,707
- 30005Alpharetta41,836
- 30008Fair Oaks35,547
- 30009Alpharetta21,095
- 30011Auburn21,624
- 30012Milstead34,506
- 30013Conyers28,297
- 30014Covington41,425
- 30016Porterdale62,968
- 30017Grayson26,620
- 30018Jersey104
- 30019Dacula51,162
- 30021Clarkston27,781
- 30022Johns Creek64,546
- 30024Suwanee88,067
- 30025Social Circle11,182
- 30028Cumming38,433
- 30030Decatur31,756
- 30032Belvedere Park42,948
- 30033North Decatur31,310
- 30034Panthersville41,847
- 30035Redan21,569
- 30038Stonecrest43,776
- 30039Snellville52,783
- 30040Cumming82,532
- 30041Cumming77,664
- 30043Lawrenceville87,929
- 30044Lilburn101,475
- 30045Dacula44,993
- 30046Lawrenceville41,850
- 30047Lilburn70,121
- 30052Loganville79,811
- 30054Oxford10,730
- 30055Mansfield3,800
- 30056Newborn2,344
- 30058Stonecrest62,614
- 30060Fair Oaks38,499
- 30062Marietta62,284
- 30064Marietta52,125
- 30066Kennesaw State University61,761
- 30067Marietta47,271
- 30068Sandy Springs33,882
- 30070Porterdale64
- 30071Norcross25,830
- 30072Pine Lake800
- 30075Roswell56,263
- 30076Roswell46,054
- 30078Snellville41,597
- 30079Scottdale4,831
- 30080Smyrna53,316
- 30082Smyrna27,296
- 30083Pine Lake62,724
- 30084Tucker38,242
- 30087Mountain Park CDP38,977
- 30088Redan29,240
- 30092Peachtree Corners36,992
- 30093Lilburn46,410
- 30094Conyers33,731
- 30096Duluth71,732
- 30097Duluth46,876
- 30101Acworth62,593
- 30102Acworth45,319
- 30103Adairsville14,612
- 30104Aragon5,484
- 30105Shannon2,187
- 30106Austell23,107
- 30107Ball Ground19,134
- 30108Bowdon6,751
- 30110Bremen14,832
- 30113Buchanan6,103
- 30114Canton62,391
- 30115Canton53,687
- 30116Whitesburg22,189
- 30117Carrollton39,804
- 30118Carrollton1,432
- 30120Cartersville44,896
- 30121White25,989
- 30122Lithia Springs27,036
- 30124Cave Spring2,588
- 30125Cedartown24,324
- 30126Mableton41,829
- 30127Powder Springs71,626
- 30132Dallas53,348
- 30134Douglasville47,580
- 30135Douglasville66,800
- 30137Emerson1,709
- 30139Fairmount4,849
- 30141Hiram27,220
- 30143Jasper26,604
- 30144Kennesaw State University59,661
- 30145Kingston8,994
- 30147Lindale4,657
- 30148Dawsonville973
- 30149Berry College1,781
- 30152Kennesaw44,977
- 30153Rockmart18,467
- 30157Dallas53,445
- 30161Rome34,705
- 30165Berry College43,001
- 30168Mableton26,612
- 30170Roopville3,732
- 30171Fairmount3,254
- 30173Lindale7,010
- 30175Talking Rock6,088
- 30176Tallapoosa7,057
- 30177Nelson784
- 30178Taylorsville4,442
- 30179Temple19,882
- 30180Villa Rica43,013
- 30182Mount Zion3,849
- 30183Waleska6,288
- 30184White7,093
- 30185Whitesburg4,602
- 30187Fairplay8,137
- 30188Holly Springs69,518
- 30189Woodstock39,928
- 30204Barnesville13,616
- 30205Brooks2,880
- 30206Concord3,312
- 30213South Fulton50,621
- 30214Fayetteville31,811
- 30215Woolsey40,476
- 30216Flovilla3,239
- 30217Franklin9,309
- 30218Gay1,597
- 30220Grantville5,366
- 30222Greenville4,797
- 30223Experiment38,262
- 30224Orchard Hill28,414
- 30228Hampton52,402
- 30229Haralson41
- 30230Hogansville8,778
- 30233Jackson24,730
- 30234Jenkinsburg2,157
- 30236Jonesboro50,089
- 30238Irondale43,191
- 30240LaGrange31,271
- 30241LaGrange25,840
- 30248Locust Grove36,038
- 30250Lovejoy607
- 30251Luthersville2,450
- 30252McDonough49,554
- 30253McDonough64,779
- 30256Meansville2,838
- 30257Milner4,588
- 30258Molena2,611
- 30259Moreland3,951
- 30260Morrow28,693
- 30263Newnan61,695
- 30265Newnan39,942
- 30268Palmetto10,874
- 30269Peachtree City40,534
- 30273Morrow17,844
- 30274Riverdale34,081
- 30275Whitesburg238
- 30276Haralson19,945
- 30277Sharpsburg21,641
- 30281Stockbridge71,603
- 30284Sunny Side6
- 30285The Rock589
- 30286Thomaston24,726
- 30288Conley8,116
- 30289Turin434
- 30290Tyrone9,318
- 30291Union City25,130
- 30292Williamson6,384
- 30293Woodbury2,129
- 30294Conley41,983
- 30295Zebulon5,567
- 30296Riverdale27,045
- 30297Forest Park29,210
- 30303Atlanta6,797
- 30305Atlanta28,110
- 30306Atlanta24,236
- 30307Atlanta21,709
- 30308Atlanta23,181
- 30309Atlanta32,479
- 30310Atlanta27,186
- 30311Atlanta34,953
- 30312Atlanta26,942
- 30313Atlanta10,913
- 30314Atlanta23,333
- 30315Atlanta34,264
- 30316Gresham Park35,107
- 30317Atlanta15,622
- 30318Atlanta59,609
- 30319Brookhaven45,985
- 30322Atlanta2,521
- 30324Atlanta29,073
- 30326Atlanta8,234
- 30327Atlanta23,673
- 30328Sandy Springs39,508
- 30329North Druid Hills27,278
- 30331Atlanta62,567
- 30332Atlanta2,567
- 30336South Fulton514
- 30337College Park10,694
- 30338Dunwoody39,465
- 30339Vinings35,372
- 30340Doraville30,062
- 30341Chamblee36,021
- 30342Sandy Springs33,349
- 30344East Point35,456
- 30345Chamblee24,492
- 30346Dunwoody4,411
- 30349South Fulton79,872
- 30350Sandy Springs35,170
- 30354Atlanta16,182
- 30360Dunwoody16,855
- 30363Atlanta3,523
- 30401Swainsboro14,032
- 30410Higgston1,535
- 30411Alamo4,650
- 30412Alston97
- 30413Bartow1,362
- 30414Bellville50
- 30415Brooklet6,343
- 30417Claxton11,154
- 30420Cobbtown1,890
- 30421Collins3,280
- 30423Daisy56
- 30425Garfield1,408
- 30426Girard703
- 30427Glennville12,531
- 30428Glenwood2,659
- 30429Hagan102
- 30434Louisville4,883
- 30436Santa Claus11,704
- 30439Metter10,240
- 30441Midville1,910
- 30442Millen8,550
- 30445Ailey3,389
- 30446Newington2,162
- 30448Nunez21
- 30449Oliver18
- 30450Portal2,632
- 30451Pulaski35
- 30452Register1,161
- 30453Reidsville8,506
- 30454Soperton348
- 30455Rocky Ford835
- 30456Sardis1,745
- 30457Soperton5,580
- 30458Register49,717
- 30461Statesboro17,447
- 30464Stillmore152
- 30467Sylvania11,474
- 30470Tarrytown640
- 30471Twin City4,718
- 30473Uvalda2,415
- 30474Vidalia17,315
- 30477Wadley2,697
- 30501Gainesville32,258
- 30504Oakwood29,422
- 30506Gainesville45,612
- 30507Gainesville33,009
- 30510Alto8,558
- 30511Baldwin3,151
- 30512Blairsville24,929
- 30513Blue Ridge11,791
- 30516Bowersville1,837
- 30517Braselton18,994
- 30518Buford57,912
- 30519Buford59,997
- 30520Canon4,974
- 30521Carnesville6,773
- 30522Blue Ridge713
- 30523Clarkesville14,050
- 30525Mountain City7,059
- 30527Clermont3,995
- 30528Cleveland24,081
- 30529Commerce12,874
- 30530Commerce7,260
- 30531Baldwin11,819
- 30533Dahlonega28,049
- 30534Dawsonville34,365
- 30535Demorest8,674
- 30536East Ellijay9,398
- 30537Sky Valley1,406
- 30538Avalon3,081
- 30539East Ellijay115
- 30540Ellijay20,582
- 30541Epworth2,393
- 30542Flowery Branch38,605
- 30543Gillsville6,238
- 30545Helen683
- 30546Hiawassee8,096
- 30547Homer3,767
- 30548Hoschton26,232
- 30549Jefferson32,075
- 30552Tiger1,882
- 30553Lavonia8,557
- 30554Lula8,980
- 30555Epworth2,607
- 30557Martin4,756
- 30558Maysville5,524
- 30559Mineral Bluff5,024
- 30560Morganton4,295
- 30562Mountain City866
- 30563Mount Airy6,310
- 30564Clermont5,001
- 30565Nicholson4,830
- 30566Oakwood9,447
- 30567Pendergrass5,487
- 30568Dillard2,133
- 30571Sautee-Nacoochee4,088
- 30572912
- 30573Tallulah Falls162
- 30575Talmo1,589
- 30576Tiger3,380
- 30577Toccoa22,964
- 30581Tiger17
- 30582Young Harris5,284
- 30597Dahlonega1,278
- 30598Toccoa66
- 30601Athens-Clarke County25,899
- 30602Athens-Clarke County1,467
- 30605Athens-Clarke County41,544
- 30606Athens-Clarke County47,865
- 30607Arcade10,700
- 30609Athens-Clarke County3,310
- 30619Arnoldsville1,737
- 30620Bethlehem18,139
- 30621Bishop6,148
- 30622Bogart11,280
- 30623Bostwick74
- 30624Bowman3,280
- 30625Buckhead town2,617
- 30627Carlton2,470
- 30628Colbert6,624
- 30629Comer5,335
- 30630Crawford2,607
- 30631Crawfordville1,820
- 30633Ila9,033
- 30634Dewy Rose1,982
- 30635Elberton15,640
- 30639Franklin Springs36
- 30641Good Hope1,685
- 30642Greensboro15,343
- 30643Hartwell17,215
- 30646Hull8,460
- 30648Lexington3,543
- 30650Madison14,056
- 30655Monroe29,785
- 30656Monroe18,650
- 30660Rayle1,040
- 30662Franklin Springs7,950
- 30663Rutledge3,697
- 30664Sharon2
- 30665Siloam117
- 30666Statham10,585
- 30667Maxeys834
- 30668Tignall2,275
- 30669Woodville3,285
- 30673Washington6,394
- 30677Bishop22,616
- 30678White Plains1,271
- 30680Winder48,388
- 30683Winterville7,298
- 30701Calhoun44,691
- 30705Chatsworth33,726
- 30707LaFayette16,686
- 30708285
- 30710Cohutta7,360
- 30711Eton3,235
- 30720Dalton27,249
- 30721Dalton53,060
- 30724Eton18
- 30725Chattanooga Valley5,304
- 30728LaFayette18,790
- 30730Lyerly2,381
- 30731Menlo2,479
- 30733Plainville2,509
- 30734Ranger2,803
- 30735Resaca6,175
- 30736Ringgold44,499
- 30738Trenton3,424
- 30739Rock Spring6,746
- 30740Dalton8,556
- 30741Fairview30,041
- 30742Fort Oglethorpe7,745
- 30746Resaca1,483
- 30747Trion14,435
- 30750West Brow4,130
- 30751335
- 30752New England9,527
- 30753Trion8,177
- 30755Tunnel Hill9,813
- 30757West Brow1,589
- 30802Appling6,582
- 30803Avera980
- 30805Blythe2,585
- 30807Camak186
- 30808Dearing4,127
- 30809Evans54,743
- 30810Gibson2,198
- 30812Augusta-Richmond County136
- 30813Grovetown52,466
- 30814Harlem10,682
- 30815Hephzibah44,109
- 30816Keysville2,208
- 30817Lincolnton7,560
- 30818Matthews274
- 30820Mitchell1,104
- 30821Norwood1,096
- 30823Stapleton1,675
- 30824Thomson17,327
- 30828Warrenton3,426
- 30830Waynesboro15,313
- 30833Wrens3,955
- 30901Augusta-Richmond County16,484
- 30904Augusta-Richmond County23,400
- 30905Augusta-Richmond County7,033
- 30906Augusta-Richmond County60,423
- 30907Martinez46,975
- 30909Augusta-Richmond County46,501
- 31001Abbeville4,471
- 31002Adrian2,967
- 31003Allentown174
- 31005Robins AFB22,063
- 31006Butler3,984
- 31007Byromville887
- 31008Byron22,602
- 31009Cadwell1,276
- 31011Chauncey497
- 31012Chester2,802
- 31014Cochran12,769
- 31015Cordele18,714
- 31016Culloden1,885
- 31017Danville1,382
- 31018Davisboro2,827
- 31019Dexter3,154
- 31020Robins AFB1,617
- 31021Dublin28,190
- 31022Dudley1,817
- 31023Eastman13,964
- 31024Eatonton21,601
- 31025Unadilla1,387
- 31027East Dublin10,684
- 31028Centerville6,645
- 31029Forsyth19,403
- 31030Fort Valley17,473
- 31031Gordon6,948
- 31032Gray14,173
- 31033Gray2,755
- 31034Milledgeville10
- 31035Harrison1,258
- 31036Hawkinsville10,960
- 31037McRae-Helena3,828
- 31038660
- 31039Howard54
- 31041Ideal967
- 31042Irwinton1,600
- 31044Jeffersonville3,082
- 31045Mitchell42
- 31046Juliette3,637
- 31047Perry20,203
- 31049Kite1,557
- 31050Knoxville1,305
- 31051Lilly122
- 31052Macon-Bibb County9,001
- 31054McIntyre1,188
- 31055McRae-Helena4,468
- 31057Marshallville1,757
- 31058Tazewell1,929
- 31060Milan1,988
- 31061Hardwick41,764
- 31062Milledgeville27
- 31063Montezuma4,266
- 31064Monticello10,259
- 31065Montrose1,481
- 31066Knoxville803
- 31067Oconee300
- 31068Oglethorpe4,377
- 31069Perry22,953
- 31070Pinehurst897
- 31071Pineview1,042
- 31072Seville1,049
- 31075Rentz2,384
- 31076Reynolds2,968
- 31077Rhine1,811
- 31078Roberta3,199
- 31079Rochelle2,520
- 31081Ideal203
- 31082Deepstep10,236
- 31083Scotland187
- 31085Shady Dale1,734
- 31087Sparta8,846
- 31088Warner Robins58,585
- 31089Oconee4,239
- 31090Toomsboro715
- 31091Unadilla4,204
- 31092Vienna5,014
- 31093Warner Robins26,872
- 31094Warthen817
- 31096Wrightsville7,145
- 31097Yatesville1,372
- 31098Robins AFB3,140
- 31201Macon-Bibb County7,891
- 31204Macon-Bibb County32,421
- 31206Macon-Bibb County24,310
- 31207Macon-Bibb County1,479
- 31210Macon-Bibb County33,288
- 31211Gray15,868
- 31216Macon-Bibb County16,328
- 3121717,732
- 31220Macon-Bibb County16,494
- 31301Walthourville4,933
- 31302Bloomingdale8,899
- 313032,604
- 31305Darien5,108
- 31307Bloomingdale1,752
- 31308Pembroke8,416
- 31309Midway480
- 31312Guyton25,991
- 31313Hinesville42,838
- 31314Fort Stewart2,122
- 31315Fort Stewart7,580
- 31316Ludowici13,812
- 31318Bloomingdale451
- 31320Midway10,794
- 31321Pembroke7,305
- 31322Pooler30,145
- 31323Riceboro1,364
- 31324Buckhead CDP37,406
- 31326Rincon23,940
- 31328Tybee Island3,353
- 31329Springfield9,609
- 31331Eulonia6,101
- 31333Walthourville110
- 31401Savannah20,445
- 31404Savannah30,062
- 31405Savannah40,764
- 31406Vernonburg34,904
- 31407Port Wentworth24,893
- 31408Garden City11,621
- 31409Savannah444
- 31410Wilmington Island22,214
- 31411Skidaway Island9,390
- 31415Savannah11,082
- 31419Savannah57,077
- 31421Savannah16
- 31501Waycross13,511
- 31503Waycross22,468
- 31510Rockingham9,685
- 31512Ambrose2,032
- 31513Baxley16,371
- 31516Blackshear15,623
- 31518Bristol793
- 31519Broxton3,126
- 31520Brunswick22,313
- 31522St. Simons17,780
- 31523Sterling15,402
- 31525Sterling28,926
- 31527Jekyll Island769
- 31532Denton802
- 31533Douglas17,032
- 31535Douglas13,463
- 315379,349
- 31539Satilla14,201
- 31542Hoboken2,635
- 31543Hortense4,935
- 31544Jacksonville426
- 31545Jesup16,568
- 31546Gardi7,097
- 31547Kings Bay Base1,419
- 31548Kingsland24,070
- 31549Lumber City1,803
- 31550Manor880
- 31551Mershon1,010
- 31552Millwood707
- 31553Hickox5,386
- 31554Nicholls7,393
- 31555Odum2,926
- 31556Offerman20
- 31557Patterson3,687
- 31558Kings Bay Base22,591
- 31560Screven2,852
- 31561St. Simons96
- 315623,620
- 31563Surrency1,196
- 31565Waverly2,409
- 31566Waynesville3,987
- 31567Denton1,042
- 31568Woodbine719
- 31569Woodbine5,506
- 31599Jesup1,058
- 31601Remerton31,302
- 31602Remerton35,728
- 31605Bemiss24,829
- 31606Dasher3,734
- 31620Adel10,969
- 31622Willacoochee1,844
- 31623Argyle553
- 31624Axson1,913
- 31625Morven915
- 31626Boston3,020
- 31627Cecil287
- 31629Dixie1,267
- 31630Du Pont840
- 31631Echols County575
- 31632Hahira15,942
- 31634Homerville5,133
- 31635Lakeland6,787
- 31636Echols County10,619
- 31637Lenox3,217
- 31638Morven985
- 31639Nashville11,059
- 31641Naylor1,741
- 31642Pearson4,617
- 31643Quitman9,693
- 31645Ray City4,988
- 31647Sparks3,071
- 31648Echols County1,052
- 31649Stockton1,051
- 31650Willacoochee2,676
- 31698Valdosta1,096
- 31699Moody AFB620
- 31701Albany16,135
- 31704Putney187
- 31705Putney30,791
- 31707Albany22,679
- 31709Americus15,529
- 31711Andersonville871
- 31712Arabi1,295
- 31714Ashburn5,975
- 31716Baconton2,481
- 31719Americus8,533
- 31720Barwick398
- 31721Albany19,435
- 31722Berlin493
- 31730Camilla8,717
- 31733Tifton1,373
- 31735De Soto543
- 31738Coolidge2,798
- 31743De Soto419
- 31744Doerun2,849
- 31747Ellenton258
- 31749Enigma2,557
- 31750Fitzgerald18,552
- 31753Funston35
- 31756Funston1,565
- 31757Thomasville11,340
- 31763Leesburg29,271
- 31764Leslie1,827
- 31765Meigs2,751
- 31768Funston21,903
- 31771Norman Park7,059
- 31772Warwick431
- 31773Ochlocknee3,981
- 31774Ocilla5,896
- 31775Omega2,894
- 31778Pavo2,895
- 31779Pelham8,599
- 31780Plains1,767
- 31781Sylvester2,174
- 31783Rebecca1,707
- 31784Sale City451
- 31787Smithville1,122
- 31788Berlin11,301
- 31789Sumner1,470
- 31790Sycamore2,643
- 31791Sylvester11,255
- 31792Thomasville22,962
- 31793Tifton10,585
- 31794Unionville26,178
- 31795Ty Ty1,591
- 31796Warwick1,048
- 31798Ambrose647
- 31801Box Springs3,015
- 31803Buena Vista4,499
- 31804Cataula6,318
- 31805Cusseta-Chattahoochee County1,833
- 31806Ellaville4,135
- 31807Ellerslie2,704
- 31808Piney Grove8,893
- 31810Geneva175
- 31811Hamilton6,052
- 31812Junction City484
- 3181410
- 31815Lumpkin2,792
- 31816Manchester4,824
- 31820Columbus14,005
- 31821112
- 31822Pine Mountain5,403
- 31823Hamilton519
- 31824Webster County1,066
- 31825Richland2,986
- 31826Shiloh2,552
- 31827Talbotton1,590
- 31829Columbus1,699
- 31830Warm Springs2,176
- 31831Waverly Hall4,446
- 31832Webster County67
- 31833West Point6,815
- 31836Woodland1,009
- 31901Columbus5,841
- 31903Columbus20,644
- 31904Columbus35,405
- 31905Cusseta-Chattahoochee County15,157
- 31906Columbus20,400
- 31907Columbus59,110
- 31909Columbus39,364
- 39813Arlington1,758
- 39815Attapulgus1,637
- 39817Bainbridge11,158
- 39819Faceville12,140
- 39823Blakely9,012
- 39824Bluffton480
- 39825Brinson1,766
- 39826Bronwood500
- 39827Cairo4,730
- 39828Cairo15,423
- 39834Climax2,251
- 39836Coleman368
- 39837Boykin5,549
- 39840Cuthbert4,469
- 39841Damascus682
- 39842Dawson7,831
- 39845Donalsonville8,535
- 39846Edison1,828
- 39851Fort Gaines2,080
- 39854Georgetown-Quitman County2,436
- 39859Iron City980
- 39861Jakin873
- 39862Leary875
- 39866Morgan2,048
- 39867Georgetown-Quitman County127
- 39870Newton1,794
- 39877Parrott393
- 39885Sasser25
- 39886Shellman1,386
- 39897Whigham3,507
Consolidated cities
A city and county governed as one, with the towns inside it that keep governments of their own.
School districts
Each of the 184 with people in it, from ACS 2020–2024 5-year estimates. Elementary districts teach the lower grades and secondary districts the upper ones, under them; the rest are unified, teaching every grade.
- Appling County School District18,493
- Atkinson County School District8,337
- Atlanta City School District505,162
- Bacon County School District11,109
- Baker County School District2,790
- Baldwin County School District43,642
- Banks County School District19,264
- Barrow County School District89,751
- Bartow County School District89,080
- Ben Hill County School District17,089
- Berrien County School District18,352
- Bibb County School District156,578
- Bleckley County School District12,430
- Brantley County School District18,315
- Bremen City School District7,488
- Brooks County School District16,293
- Bryan County School District48,263
- Buford City School District18,052
- Bulloch County School District82,683
- Burke County School District24,470
- Butts County School District26,496
- Calhoun City School District17,906
- Calhoun County School District5,498
- Camden County School District56,970
- Candler County School District11,043
- Carroll County School District97,186
- Carrollton City School District27,383
- Cartersville City School District24,074
- Catoosa County School District68,634
- Charlton County School District12,818
- Chatham County School District300,879
- Chattahoochee County for Fort Benningsecondary7,132
- Chattahoochee County School District1,755
- Chattooga County School District23,003
- Cherokee County School District280,991
- Chickamauga City School District3,014
- Clarke County School District129,609
- Clay County School District2,850
- Clayton County School District298,924
- Clinch County School District6,759
- Cobb County School District712,945
- Coffee County School District43,347
- Colquitt County School District46,224
- Columbia County School District162,434
- Commerce City School District8,013
- Cook County School District17,532
- Coweta County School District152,852
- Crawford County School District12,225
- Crisp County School District19,790
- Dade County School District16,165
- Dalton City School District34,538
- Dawson County School District30,242
- Decatur City School District24,518
- Decatur County School District29,195
- DeKalb County School District700,163
- Dodge County School District19,805
- Dooly County School District10,984
- Dougherty School District83,091
- Douglas County School District147,888
- Dublin City School District15,988
- Early County School District10,603
- Echols County School District3,709
- Effingham County School District69,143
- Elbert County School District19,849
- Emanuel County School District23,026
- Evans County School District10,757
- Fannin County School District25,742
- Fayette County School District122,244
- Floyd County School District61,504
- Forsyth County School District267,287
- Fort Benning Schoolselementary15,104
- Fort Stewart School District9,702
- Franklin County School District24,234
- Fulton County School District612,069
- Gainesville City School District44,997
- Gilmer County School District32,426
- Glascock County School District2,932
- Glynn County School District85,447
- Gordon County School District41,194
- Grady County School District26,108
- Greene County School District20,109
- Gwinnett County School District964,548
- Habersham County School District47,793
- Hall County School District164,999
- Hancock County School District8,650
- Haralson County School District23,797
- Harris County School District36,086
- Hart County School District26,939
- Heard County School District11,773
- Henry County School District249,960
- Houston County School District169,649
- Irwin County School District9,285
- Jackson County School District61,754
- Jasper County School District15,929
- Jeff Davis County School District14,924
- Jefferson City School District14,990
- Jefferson County School District15,341
- Jenkins County School District8,711
- Johnson County School District9,190
- Jones County School District28,673
- Lamar County School District19,571
- Lanier County School District10,221
- Laurens County School District33,810
- Lee County School District33,626
- Liberty County School District57,695
- Lincoln County School District7,854
- Long County School District18,374
- Lowndes County School District64,713
- Lumpkin County School District34,505
- Macon County School District11,864
- Madison County School District31,528
- Marietta City School District62,263
- Marion County School District7,509
- McDuffie County School District21,718
- McIntosh County School District11,312
- Meriwether County School District20,929
- Miller County School District5,850
- Mitchell County School District17,625
- Monroe County School District29,664
- Montgomery County School District8,437
- Morgan County School District21,078
- Murray County School District40,562
- Muscogee County for Fort Benningsecondary7,972
- Muscogee County School District195,739
- Newton County School District118,152
- Oconee County School District43,551
- Oglethorpe County School District15,509
- Paulding County School District178,909
- Peach County School District28,560
- Pelham City School District3,433
- Pickens County School District34,951
- Pierce County School District20,202
- Pike County School District19,903
- Polk County School District43,785
- Pulaski County School District9,939
- Putnam County School District22,855
- Quitman County School District2,264
- Rabun County School District17,312
- Randolph County School District6,196
- Richmond County School District206,069
- Rockdale County School District95,277
- Rome City School District38,189
- Schley County School District4,513
- Screven County School District14,130
- Seminole County School District9,156
- Social Circle City School District5,217
- Spalding County School District68,892
- Stephens County School District27,012
- Stewart County School District5,253
- Sumter County School District29,061
- Talbot County School District5,742
- Taliaferro County School District1,558
- Tattnall County School District24,208
- Taylor County School District7,786
- Telfair County School District11,831
- Terrell County School District8,850
- Thomas County School District27,111
- Thomasville City School District18,666
- Tift County School District41,438
- Toombs County School District16,553
- Towns County School District12,913
- Treutlen County School District6,376
- Trion City School District2,033
- Troup County School District70,330
- Turner County School District8,939
- Twiggs County School District7,803
- Union County School District26,304
- Upson County School District28,029
- Valdosta City School District55,252
- Vidalia City School District10,752
- Walker County School District65,748
- Walton County School District98,208
- Ware County School District35,976
- Warren County School District5,170
- Washington County School District19,849
- Wayne County School District30,949
- Webster County School District1,997
- Wheeler County School District7,335
- White County School District28,810
- Whitfield County School District69,060
- Wilcox County School District8,798
- Wilkes County School District9,549
- Wilkinson County School District8,747
- Worth County School District20,451
Congressional districts
As drawn for the 119th Congress (2025–2027).
- Congressional District 1787,122
- Congressional District 2754,620
- Congressional District 3785,402
- Congressional District 4765,448
- Congressional District 5764,559
- Congressional District 6778,880
- Congressional District 7790,971
- Congressional District 8774,685
- Congressional District 9800,737
- Congressional District 10801,805
- Congressional District 11784,112
- Congressional District 12774,597
- Congressional District 13794,711
- Congressional District 14782,758
State senate districts
The upper chamber’s districts, as drawn in 2024.
- State Senate District 1199,310
- State Senate District 2191,894
- State Senate District 3195,534
- State Senate District 4198,961
- State Senate District 5187,767
- State Senate District 6198,122
- State Senate District 7191,924
- State Senate District 8194,497
- State Senate District 9199,351
- State Senate District 10188,842
- State Senate District 11190,285
- State Senate District 12185,361
- State Senate District 13187,816
- State Senate District 14193,339
- State Senate District 15183,496
- State Senate District 16200,383
- State Senate District 17200,321
- State Senate District 18195,573
- State Senate District 19197,466
- State Senate District 20199,240
- State Senate District 21202,412
- State Senate District 22191,089
- State Senate District 23196,243
- State Senate District 24198,036
- State Senate District 25193,349
- State Senate District 26188,392
- State Senate District 27204,971
- State Senate District 28201,035
- State Senate District 29193,861
- State Senate District 30197,845
- State Senate District 31203,609
- State Senate District 32195,910
- State Senate District 33196,019
- State Senate District 34186,335
- State Senate District 35194,759
- State Senate District 36193,613
- State Senate District 37197,288
- State Senate District 38196,128
- State Senate District 39194,718
- State Senate District 40194,609
- State Senate District 41191,320
- State Senate District 42202,891
- State Senate District 43197,922
- State Senate District 44189,439
- State Senate District 45201,719
- State Senate District 46199,059
- State Senate District 47199,665
- State Senate District 48191,262
- State Senate District 49199,063
- State Senate District 50195,753
- State Senate District 51199,580
- State Senate District 52196,141
- State Senate District 53192,690
- State Senate District 54194,235
- State Senate District 55200,383
- State Senate District 56189,582
State house districts
The lower chamber’s districts, as drawn in 2024.
- State House District 158,028
- State House District 264,378
- State House District 360,342
- State House District 458,427
- State House District 561,664
- State House District 659,210
- State House District 761,079
- State House District 862,024
- State House District 962,830
- State House District 1061,531
- State House District 1166,762
- State House District 1260,164
- State House District 1359,337
- State House District 1461,914
- State House District 1561,436
- State House District 1661,744
- State House District 1764,162
- State House District 1861,996
- State House District 1963,777
- State House District 2061,895
- State House District 2162,412
- State House District 2261,688
- State House District 2361,903
- State House District 2460,697
- State House District 2558,946
- State House District 2663,371
- State House District 2760,827
- State House District 2862,324
- State House District 2963,806
- State House District 3063,292
- State House District 3167,921
- State House District 3261,863
- State House District 3361,629
- State House District 3461,580
- State House District 3559,537
- State House District 3659,628
- State House District 3760,948
- State House District 3861,479
- State House District 3960,826
- State House District 4059,612
- State House District 4160,557
- State House District 4259,395
- State House District 4357,693
- State House District 4464,972
- State House District 4556,541
- State House District 4659,256
- State House District 4759,400
- State House District 4866,367
- State House District 4957,606
- State House District 5057,508
- State House District 5156,162
- State House District 5260,914
- State House District 5359,509
- State House District 5460,667
- State House District 5558,768
- State House District 5662,246
- State House District 5759,864
- State House District 5858,199
- State House District 5961,974
- State House District 6061,802
- State House District 6160,075
- State House District 6261,544
- State House District 6355,696
- State House District 6461,114
- State House District 6562,286
- State House District 6663,305
- State House District 6761,622
- State House District 6863,791
- State House District 6957,804
- State House District 7059,761
- State House District 7162,040
- State House District 7261,720
- State House District 7363,442
- State House District 7459,498
- State House District 7562,031
- State House District 7658,505
- State House District 7758,173
- State House District 7862,066
- State House District 7958,085
- State House District 8061,211
- State House District 8160,432
- State House District 8258,873
- State House District 8359,478
- State House District 8455,991
- State House District 8563,302
- State House District 8657,275
- State House District 8761,099
- State House District 8859,467
- State House District 8959,667
- State House District 9056,016
- State House District 9160,206
- State House District 9258,547
- State House District 9365,274
- State House District 9461,909
- State House District 9564,305
- State House District 9658,257
- State House District 9761,451
- State House District 9851,126
- State House District 9958,187
- State House District 10063,363
- State House District 10156,213
- State House District 10261,191
- State House District 10364,353
- State House District 10463,849
- State House District 10561,706
- State House District 10663,625
- State House District 10760,453
- State House District 10860,266
- State House District 10967,374
- State House District 11063,317
- State House District 11163,536
- State House District 11263,922
- State House District 11361,534
- State House District 11461,739
- State House District 11559,248
- State House District 11659,367
- State House District 11766,366
- State House District 11864,700
- State House District 11963,084
- State House District 12058,511
- State House District 12160,247
- State House District 12261,706
- State House District 12360,740
- State House District 12461,033
- State House District 12563,440
- State House District 12661,881
- State House District 12756,193
- State House District 12858,854
- State House District 12954,857
- State House District 13064,188
- State House District 13161,758
- State House District 13257,000
- State House District 13357,809
- State House District 13460,962
- State House District 13564,771
- State House District 13660,085
- State House District 13763,893
- State House District 13858,107
- State House District 13960,826
- State House District 14055,801
- State House District 14157,304
- State House District 14260,911
- State House District 14355,841
- State House District 14460,768
- State House District 14558,207
- State House District 14664,133
- State House District 14763,880
- State House District 14859,760
- State House District 14961,138
- State House District 15059,096
- State House District 15157,080
- State House District 15260,419
- State House District 15358,322
- State House District 15457,922
- State House District 15558,988
- State House District 15659,622
- State House District 15761,498
- State House District 15859,386
- State House District 15960,976
- State House District 16061,557
- State House District 16168,027
- State House District 16261,511
- State House District 16361,369
- State House District 16465,944
- State House District 16556,322
- State House District 16660,451
- State House District 16762,779
- State House District 16861,952
- State House District 16957,495
- State House District 17061,060
- State House District 17158,345
- State House District 17262,441
- State House District 17358,035
- State House District 17460,250
- State House District 17562,262
- State House District 17660,527
- State House District 17759,233
- State House District 17859,663
- State House District 17960,248
- State House District 18062,797
PUMAs
Public Use Microdata Areas: areas of 100,000 people or more that the state draws from census tracts, for the Census Bureau’s microdata.
- Atlanta & Northeast Georgia Regional Commissions–Newton & Rockdale Counties PUMA213,433
- Atlanta Regional Commision (Northeast)–Forsyth County (South)–Cumming City PUMA153,072
- Atlanta Regional Commission (Central)–DeKalb County (Central) PUMA125,475
- Atlanta Regional Commission (Central)–DeKalb County (East)–Tucker, Clarkston Cities PUMA131,973
- Atlanta Regional Commission (Central)–DeKalb County (Southeast)–Stonecrest City PUMA134,291
- Atlanta Regional Commission (Central)–DeKalb County (Southwest) PUMA111,608
- Atlanta Regional Commission (Central)–DeKalb County (West)–Atlanta & Decatur Cities PUMA107,443
- Atlanta Regional Commission (Central)–Fulton County (Central)–Sandy Springs City PUMA107,075
- Atlanta Regional Commission (Central)–Fulton County (East)–Atlanta City (South) PUMA145,645
- Atlanta Regional Commission (Central)–Fulton County (Northwest)–Roswell & Milton PUMA144,623
- Atlanta Regional Commission (Central)–Fulton County (South)–East Point & Union City PUMA106,990
- Atlanta Regional Commission (Central)–Fulton County (South)–South Fulton & Fairburn PUMA115,813
- Atlanta Regional Commission (Northeast)–Forsyth County (North) PUMA114,215
- Atlanta Regional Commission (Northeast)–Gwinnett County (Central) PUMA142,981
- Atlanta Regional Commission (Northeast)–Gwinnett County (Central)–Lawrenceville PUMA127,144
- Atlanta Regional Commission (Northeast)–Gwinnett County (East)–Dacula, Grayson PUMA142,813
- Atlanta Regional Commission (Northeast)–Gwinnett County (North)–Sugar Hill City PUMA146,789
- Atlanta Regional Commission (Northeast)–Gwinnett County (South)–Snellville City PUMA140,894
- Atlanta Regional Commission (Northeast)–Gwinnett County (West Central)–Duluth City PUMA157,122
- Atlanta Regional Commission (Northeast)–Gwinnett County (West Central)–Lilburn City PUMA121,668
- Atlanta Regional Commission (Northwest)–Cherokee County–Ball Ground City PUMA115,602
- Atlanta Regional Commission (Northwest)–Cherokee County–Woodstock & Canton Cities PUMA165,430
- Atlanta Regional Commission (Northwest)–Cobb County (Central)–Marietta City PUMA154,958
- Atlanta Regional Commission (Northwest)–Cobb County (Northeast) PUMA156,315
- Atlanta Regional Commission (Northwest)–Cobb County (Southeast)–Smyrna City PUMA178,661
- Atlanta Regional Commission (Northwest)–Cobb County (Southwest)–Powder Springs City PUMA143,374
- Atlanta Regional Commission (South Central)–Clayton County (Northwest)–Forest Park PUMA155,166
- Atlanta Regional Commission (South Central)–Clayton County (South, East)–Jonesboro PUMA143,758
- Atlanta Regional Commission (South Central)–Fayette County PUMA122,244
- Atlanta Regional Commission (Southeast)–Henry County (North)–Stockbridge City PUMA118,701
- Atlanta Regional Commission (Southeast)–Henry County (South)–McDonough City PUMA131,259
- Atlanta Regional Commission (Southwest)–Douglas County PUMA147,888
- Atlanta Regional Commission–Cobb County (Northwest)–Kennesaw & Acworth Cities PUMA141,900
- Atlanta Regional Commission–DeKalb County (North)–Brookhaven & Dunwoody Cities PUMA154,500
- Atlanta Regional Commission–Fulton County (Central)–Atlanta City (North) PUMA161,348
- Atlanta Regional Commission–Fulton County (Central)–Atlanta City (Southwest) PUMA156,049
- Atlanta Regional Commission–Fulton County (Northeast)–Johns Creek & Alpharetta PUMA139,079
- Central Savannah River Area Regional Commission (East Central)–Columbia County PUMA162,434
- Central Savannah River Area Regional Commission (West & Outside Richmond & Columbia) PUMA125,802
- Central Savannah River Area Regional Commission–Richmond County (Northeast)–Augusta PUMA95,786
- Central Savannah River Area Regional Commission–Richmond County (Southwest)–Augusta PUMA110,283
- Coastal Regional Commission (East)–Chatham County (East & Outside Savannah City) PUMA128,966
- Coastal Regional Commission (East)–Chatham County (West Central)–Savannah City PUMA171,913
- Coastal Regional Commission (North)–Bulloch, Effingham & Screven Counties PUMA165,956
- Coastal Regional Commission (South)–Glynn Camden & McIntosh Counties PUMA153,729
- Coastal Regional Commission (West)–Liberty, Bryan & Long Counties PUMA134,034
- Georgia Mountains Regional Commission (North & Northwest) PUMA150,086
- Georgia Mountains Regional Commission (Southeast) PUMA145,166
- Georgia Mountains Regional Commission–Hall County (East)–Gainesville City PUMA107,317
- Georgia Mountains Regional Commission–Hall County (West)–Flowery Branch City PUMA105,917
- Heart of Georgia Altamaha Regional Commission (North & West) PUMA140,466
- Heart of Georgia Altamaha Regional Commission (Southeast) PUMA154,239
- Middle Georgia Regional Commission (Central)–Bibb County–Macon City PUMA156,578
- Middle Georgia Regional Commission (North & Outside Bibb County) PUMA182,169
- Middle Georgia Regional Commission (South)–Houston & Pulaski Counties PUMA179,588
- Northeast Georgia Regional Commission (Central)–Clarke County–Athens City PUMA129,609
- Northeast Georgia Regional Commission (East) PUMA130,546
- Northeast Georgia Regional Commission (Northwest)–Barrow & Jackson Counties PUMA174,643
- Northeast Georgia Regional Commission (Southwest)–Walton, Morgan & Jasper Counties PUMA140,320
- Northwest Georgia Regional Commission (East Central)–Bartow County PUMA113,113
- Northwest Georgia Regional Commission (North Central)–Whitfield County PUMA103,598
- Northwest Georgia Regional Commission (Northeast) PUMA192,781
- Northwest Georgia Regional Commission (Southeast)–Paulding County PUMA178,909
- Northwest Georgia Regional Commission (Southwest)–Floyd, Polk & Haralson Counties PUMA174,763
- Northwest Georgia Regional Commission–Walker, Catoosa, Chattooga & Dade Counties PUMA178,597
- River Valley Regional Commission (Outside Muscogee & Chattahoochee Counties) PUMA151,895
- River Valley Regional Commission (West Central)–Muscogee & Chattahoochee Counties PUMA212,598
- Southern Georgia Regional Commission (East & Central) PUMA170,793
- Southern Georgia Regional Commission (South Central)–Lowndes County–Valdosta City PUMA119,965
- Southern Georgia Regional Commission (West) PUMA128,928
- Southwest Georgia Regional Commission (East)–Colquitt, Thomas & Worth Counties PUMA112,452
- Southwest Georgia Regional Commission (North Central)–Dougherty & Lee Counties PUMA116,717
- Southwest Georgia Regional Commission (West & Central) PUMA119,108
- Three Rivers Regional Commission (East) PUMA162,891
- Three Rivers Regional Commission (North Central)–Coweta County PUMA152,852
- Three Rivers Regional Commission (Northwest)–Carroll County PUMA124,569
- Three Rivers Regional Commission (Southwest)–Troup, Meriwether & Heard Counties PUMA103,032
Urban areas
Each that reaches into Georgia, with its whole population. Urban areas are the densely settled land the Census Bureau draws after each census, whatever the city lines.
- Adairsville, GA5,757
- Adel, GA6,956
- Albany, GA83,401
- Americus, GA17,372
- Ashburn, GA4,862
- Athens-Clarke County, GA144,673
- Atlanta, GA5.20M
- Augusta-Richmond County, GA–SC433,178
- Bainbridge, GA12,844
- Barnesville, GA6,576
- Baxley, GA5,227
- Bremen, GA7,805
- Brunswick–St. Simons, GA72,293
- Cairo, GA10,395
- Calhoun, GA24,062
- Camilla, GA5,425
- Carrollton, GA38,466
- Cartersville, GA53,501
- Cedartown, GA12,338
- Chatsworth, GA12,803
- Chattanooga, TN–GA405,365
- Cochran, GA6,278
- Columbus, GA–AL262,075
- Commerce, GA8,670
- Cordele, GA10,859
- Cornelia–Baldwin, GA19,999
- Dahlonega, GA6,165
- Dalton, GA66,276
- Douglas, GA13,500
- Dublin, GA19,736
- Eastman, GA6,219
- Elberton, GA5,848
- Ellijay, GA5,381
- Eufaula, AL–GA8,492
- Fitzgerald, GA11,026
- Forsyth, GA4,809
- Fort Valley, GA9,999
- Gainesville, GA174,095
- Griffin, GA39,267
- Hartwell, GA5,907
- Hazlehurst, GA4,654
- Hinesville, GA55,162
- Jackson, GA5,880
- Jasper, GA5,810
- Jefferson, GA13,696
- Jesup, GA12,555
- Kingsland–St. Marys, GA40,736
- LaFayette, GA6,762
- LaGrange, GA35,833
- Macon-Bibb County, GA138,683
- Madison, GA4,753
- Milledgeville, GA22,542
- Monroe, GA17,175
- Moultrie, GA19,535
- Nashville, GA4,753
- Perry, GA15,386
- Rincon, GA15,598
- Rockmart, GA7,891
- Rome, GA61,045
- Sandersville, GA7,074
- Savannah, GA316,052
- Statesboro, GA45,489
- Summerville, GA10,366
- Swainsboro, GA7,158
- Sylvester, GA5,689
- Thomaston, GA14,932
- Thomasville, GA25,029
- Thomson, GA9,137
- Tifton, GA24,684
- Toccoa, GA12,265
- Tybee Island, GA3,309
- Valdosta, GA77,253
- Valley–Lanett, AL–GA19,687
- Vidalia, GA13,555
- Villa Rica, GA25,217
- Warner Robins, GA146,420
- Waycross, GA24,654
- Waynesboro, GA6,188
- Winder, GA53,209
- Woodmont, GA5,600
Tribal areas
Each that reaches into Georgia, with its whole population.
Turn Georgia into your planning report.
Social Explorer Studio builds an editable profile of any place, with tables and charts beside the county and state, and exports to Word, PDF and Excel.
Questions about Georgia
What is the population of Georgia?
11,302,748 people, according to the ACS 2025 1-year estimates, which the Census Bureau adjusts to match its own population estimate. That’s the 8th largest of the 50 states and DC.
What is the FIPS code for Georgia?
13. Every county’s and place’s FIPS code in Georgia starts with it. The Census Bureau’s full geographic identifier (GEOID) is 0400000US13.
What is the largest city in Georgia?
Atlanta, with 529,101 people. Other large places here include Columbus, Augusta-Richmond County and Macon-Bibb County.
What is the median household income in Georgia?
$81,847 (±$761), according to the ACS 2025 1-year estimates, lower than the US ($84,780).
What is the median age in Georgia?
38.3 years (±0.2), according to the ACS 2025 1-year estimates, lower than the US (39.5).
How much does housing cost in Georgia?
Georgia’s median home value is $346,500 (±$2,425) and its median gross rent is $1,575 (±$15) a month, according to the ACS 2025 1-year estimates. 49.0% (±1.2%) of its renters pay 30% or more of their income on rent.
Is Georgia growing?
Georgia’s population grew 10.7%, from 10,214,860 in 2015 to 11,302,748 in 2025, according to the ACS 1-year estimates.
Where do people who work in Georgia live?
4,517,256 of its 4,705,268 jobs are held by people who live here. Of those who commute in, the most come from Alabama, South Carolina, Florida.
Where does this census data come from?
The U.S. Census Bureau’s American Community Survey, through Social Explorer’s tables: the latest 1-year estimates where they exist, for the most recent numbers, and 5-year estimates otherwise. Each table lists its code, so you can find it again.
Is this data free to use?
Yes. You can read it, cite it, download the CSV and embed the charts, with no account. To map other variables, compare your own areas or build a report, see Social Explorer’s plans in a live demo.
Sources and how to cite
American Community Survey 2025 1-year estimates, or 2020–2024 5-year estimates where noted, U.S. Census Bureau, from Social Explorer’s tables A00001, A00002, A01004, A04001, A06001, A08001, A09005, A10001, A10003, A10008, A10030, A10036, A10040, A10047, A10055, A10060, A12001, A13004, A14006, A14024, A14028, A16002, A17005, A18002, A18009, A20001, B02002, B09001, B13002, B18101, C16001. Maps by census tract use 2020–2024 5-year estimates, since the 1-year survey doesn’t cover tracts. Commuting: LEHD LODES 2023. These are estimates from a sample, each with its margin of error. Data retrieved November 14, 2026. How these profiles are made.
U.S. Census Bureau, American Community Survey 2025 1-year estimates, or 2020–2024 5-year estimates where noted, via Social Explorer. “Georgia.” https://www.socialexplorer.com/places/georgia. Accessed November 14, 2026.