

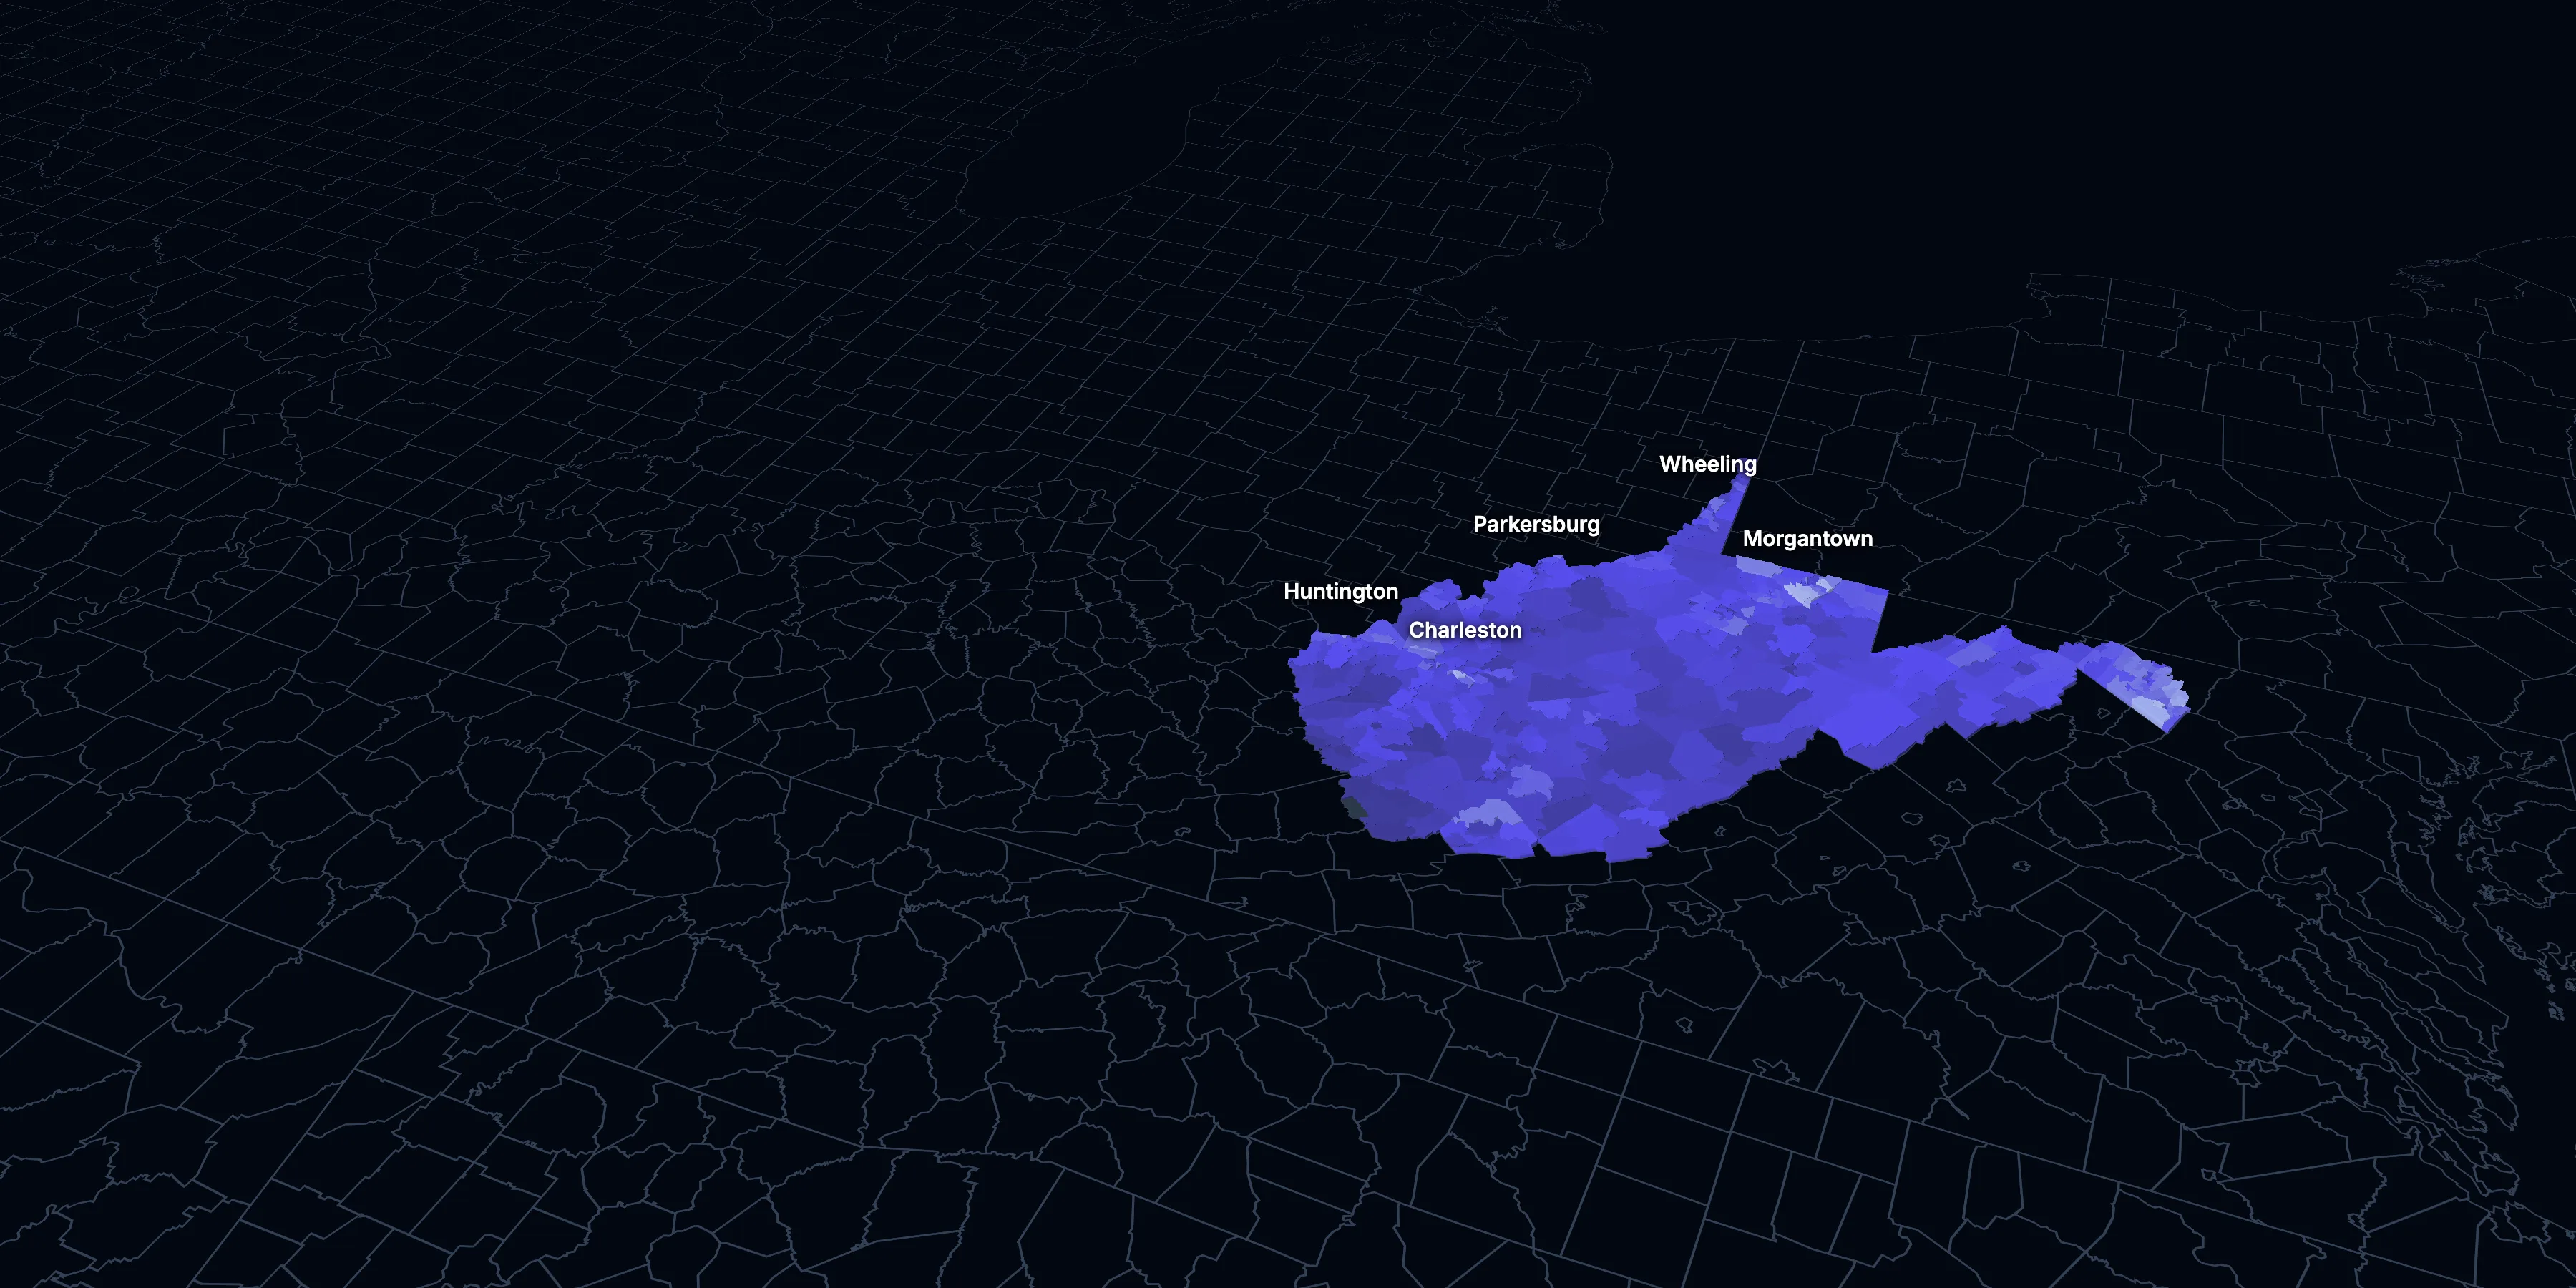
West Virginia: Population, demographics and census data
Home to 1,766,147 people, the 39th largest of the 50 states and DC. It fell 4.2% between 2015 and 2025.
- Population
- 1.77M. Census Bureau estimate · Rank 39 of the 50 states and DC
- Median household income
- $61,340 ±$1,301. US $84,780
- Median age
- 43.5 ±0.3. US 39.5
ACS 2025 1-year estimates, U.S. Census Bureau
Taller, lighter tracts have higher household incomes
About West Virginia
West Virginia’s median household income is $61,340 (±$1,301), lower than the US ($84,780), and its median age is 43.5 (±0.3), according to the ACS 2025 1-year estimates. Its largest city is Charleston.
± is each figure’s margin of error, at 90% confidence, and † marks one too uncertain to lean on. Under each percentage in the tables is the number it counts. How the margins are worked out.
FIPS code 54
Highlights
What stands out in West Virginia
The numbers where West Virginia sits furthest from the nation, or past a recognized policy benchmark.
Past a policy benchmark
16.0%
ElevatedLiving in poverty
That’s higher than the US (11.8%). HUD and the New Markets Tax Credit use 20% poverty to mark low-income areas. It’s the 4th highest of the 50 states and DC.
28.7%
ElevatedHomes built before 1960
That’s higher than the US (24.0%). Older homes carry more lead-paint risk: the EPA found lead paint in 69% of homes built from 1940 to 1959.
Furthest from the national picture
19.0%
Highest among statesLiving with a disability
That’s higher than the US (13.7%). It’s the highest of the 50 states and DC.
2.8%
Lowest among statesSpeak a language other than English at home
That’s lower than the US (22.9%). It’s the lowest of the 50 states and DC.
$921
Lowest among statesMedian gross rent
That’s lower than the US ($1,557). It’s the lowest of the 50 states and DC.
2.3%
Lowest among statesBorn outside the US
That’s lower than the US (14.7%). It’s the lowest of the 50 states and DC.
2015 to 2025
How West Virginia changed in ten years
The state lost 77,981 people. It got older, more foreign-born and better educated, and poverty fell 1.9 points.
Population, change since 2015
−4.2% in the state and +6.3% in the US.
Source: ACS 1-year, 2015 to 2025, table A00001.
Show data
| West Virginia | United States | |
|---|---|---|
| 2015 | 0.0% | 0.0% |
| 2016 | −0.7% | +0.5% |
| 2017 | −1.5% | +1.3% |
| 2018 | −2.1% | +1.8% |
| 2019 | −2.8% | +2.1% |
| 2021 | −3.3% | +3.3% |
| 2022 | −3.7% | +3.7% |
| 2023 | −4.0% | +4.2% |
| 2024 | −4.0% | +5.8% |
| 2025 | −4.2% | +6.3% |
Embed
Median household income, in 2025 dollars
+6.6% in the state and +10.9% in the US.
Source: ACS 1-year, 2015 to 2025, table A14006.
Show data
| West Virginia | United States | |
|---|---|---|
| 2015 | $57,567 | $76,413 |
| 2016 | $58,681 | $77,931 |
| 2017 | $57,557 | $79,891 |
| 2018 | $56,999 | $80,059 |
| 2019 | $62,019 | $83,427 |
| 2021 | $61,395 | $83,521 |
| 2022 | $60,184 | $82,811 |
| 2023 | $59,522 | $82,683 |
| 2024 | $62,836 | $84,339 |
| 2025 | $61,340 | $84,780 |
Embed
Living in poverty
−1.9 points in the state and −3.0 points in the US.
Source: ACS 1-year, 2015 to 2025, table A13004.
Show data
| West Virginia | United States | |
|---|---|---|
| 2015 | 17.9% | 14.7% |
| 2016 | 17.9% | 14.0% |
| 2017 | 19.1% | 13.4% |
| 2018 | 17.8% | 13.1% |
| 2019 | 16.0% | 12.3% |
| 2021 | 16.8% | 12.8% |
| 2022 | 17.9% | 12.6% |
| 2023 | 16.7% | 12.5% |
| 2024 | 16.7% | 12.1% |
| 2025 | 16.0% | 11.8% |
Embed
Bachelor’s degree or more
+5.1 points in the state and +6.7 points in the US.
Source: ACS 1-year, 2015 to 2025, table A12001.
Show data
| West Virginia | United States | |
|---|---|---|
| 2015 | 19.6% | 30.6% |
| 2016 | 20.8% | 31.3% |
| 2017 | 20.2% | 32.0% |
| 2018 | 21.3% | 32.6% |
| 2019 | 21.1% | 33.1% |
| 2021 | 24.1% | 35.0% |
| 2022 | 24.8% | 35.7% |
| 2023 | 24.0% | 36.2% |
| 2024 | 24.4% | 36.8% |
| 2025 | 24.7% | 37.4% |
Embed
Median gross rent, in 2025 dollars
−0.4% in the state and +18.5% in the US.
Source: ACS 1-year, 2015 to 2025, table A18009.
Show data
| West Virginia | United States | |
|---|---|---|
| 2015 | $925 | $1,314 |
| 2016 | $922 | $1,327 |
| 2017 | $914 | $1,340 |
| 2018 | $950 | $1,368 |
| 2019 | $923 | $1,393 |
| 2021 | $919 | $1,427 |
| 2022 | $881 | $1,440 |
| 2023 | $904 | $1,496 |
| 2024 | $913 | $1,537 |
| 2025 | $921 | $1,557 |
Embed
Median home value, in 2025 dollars
+14.8% in the state and +39.3% in the US.
Source: ACS 1-year, 2015 to 2025, table A10036.
Show data
| West Virginia | United States | |
|---|---|---|
| 2015 | $153,579 | $266,469 |
| 2016 | $159,469 | $277,278 |
| 2017 | $158,627 | $288,124 |
| 2018 | $156,791 | $296,908 |
| 2019 | $158,191 | $305,336 |
| 2021 | $171,553 | $337,116 |
| 2022 | $171,814 | $355,481 |
| 2023 | $174,157 | $361,931 |
| 2024 | $176,524 | $372,685 |
| 2025 | $176,300 | $371,100 |
Embed
ACS 1-year estimates. The dotted stretch of each line spans 2020, when the Census Bureau released no standard 1-year estimates. Dollar values are in 2025 dollars.
| Indicator | 2015 | 2025 | Change |
|---|---|---|---|
| Population | 1,844,128 | 1,766,147 | −4.2% |
| Median age | 42.2 | 43.5 | +1.3 years |
| 65 and over | 18.2% | 22.6% | +4.3 points |
| Born outside the US | 1.6% | 2.3% | +0.7 points |
| Hispanic or Latino | 1.4% | 2.5% | +1.1 points |
| Median household income | $57,567 | $61,340 | +6.6% |
| Living in poverty | 17.9% | 16.0% | −1.9 points |
| Bachelor’s degree or more | 19.6% | 24.7% | +5.1 points |
| Households that rent | 27.7% | 25.3% | −2.4 points |
| Median gross rent | $925 | $921 | −0.4% |
| Median home value | $153,579 | $176,300 | +14.8% |
546 census tracts
West Virginia, tract by tract
State averages hide a lot. These census tracts are the closest the census comes to neighborhoods.
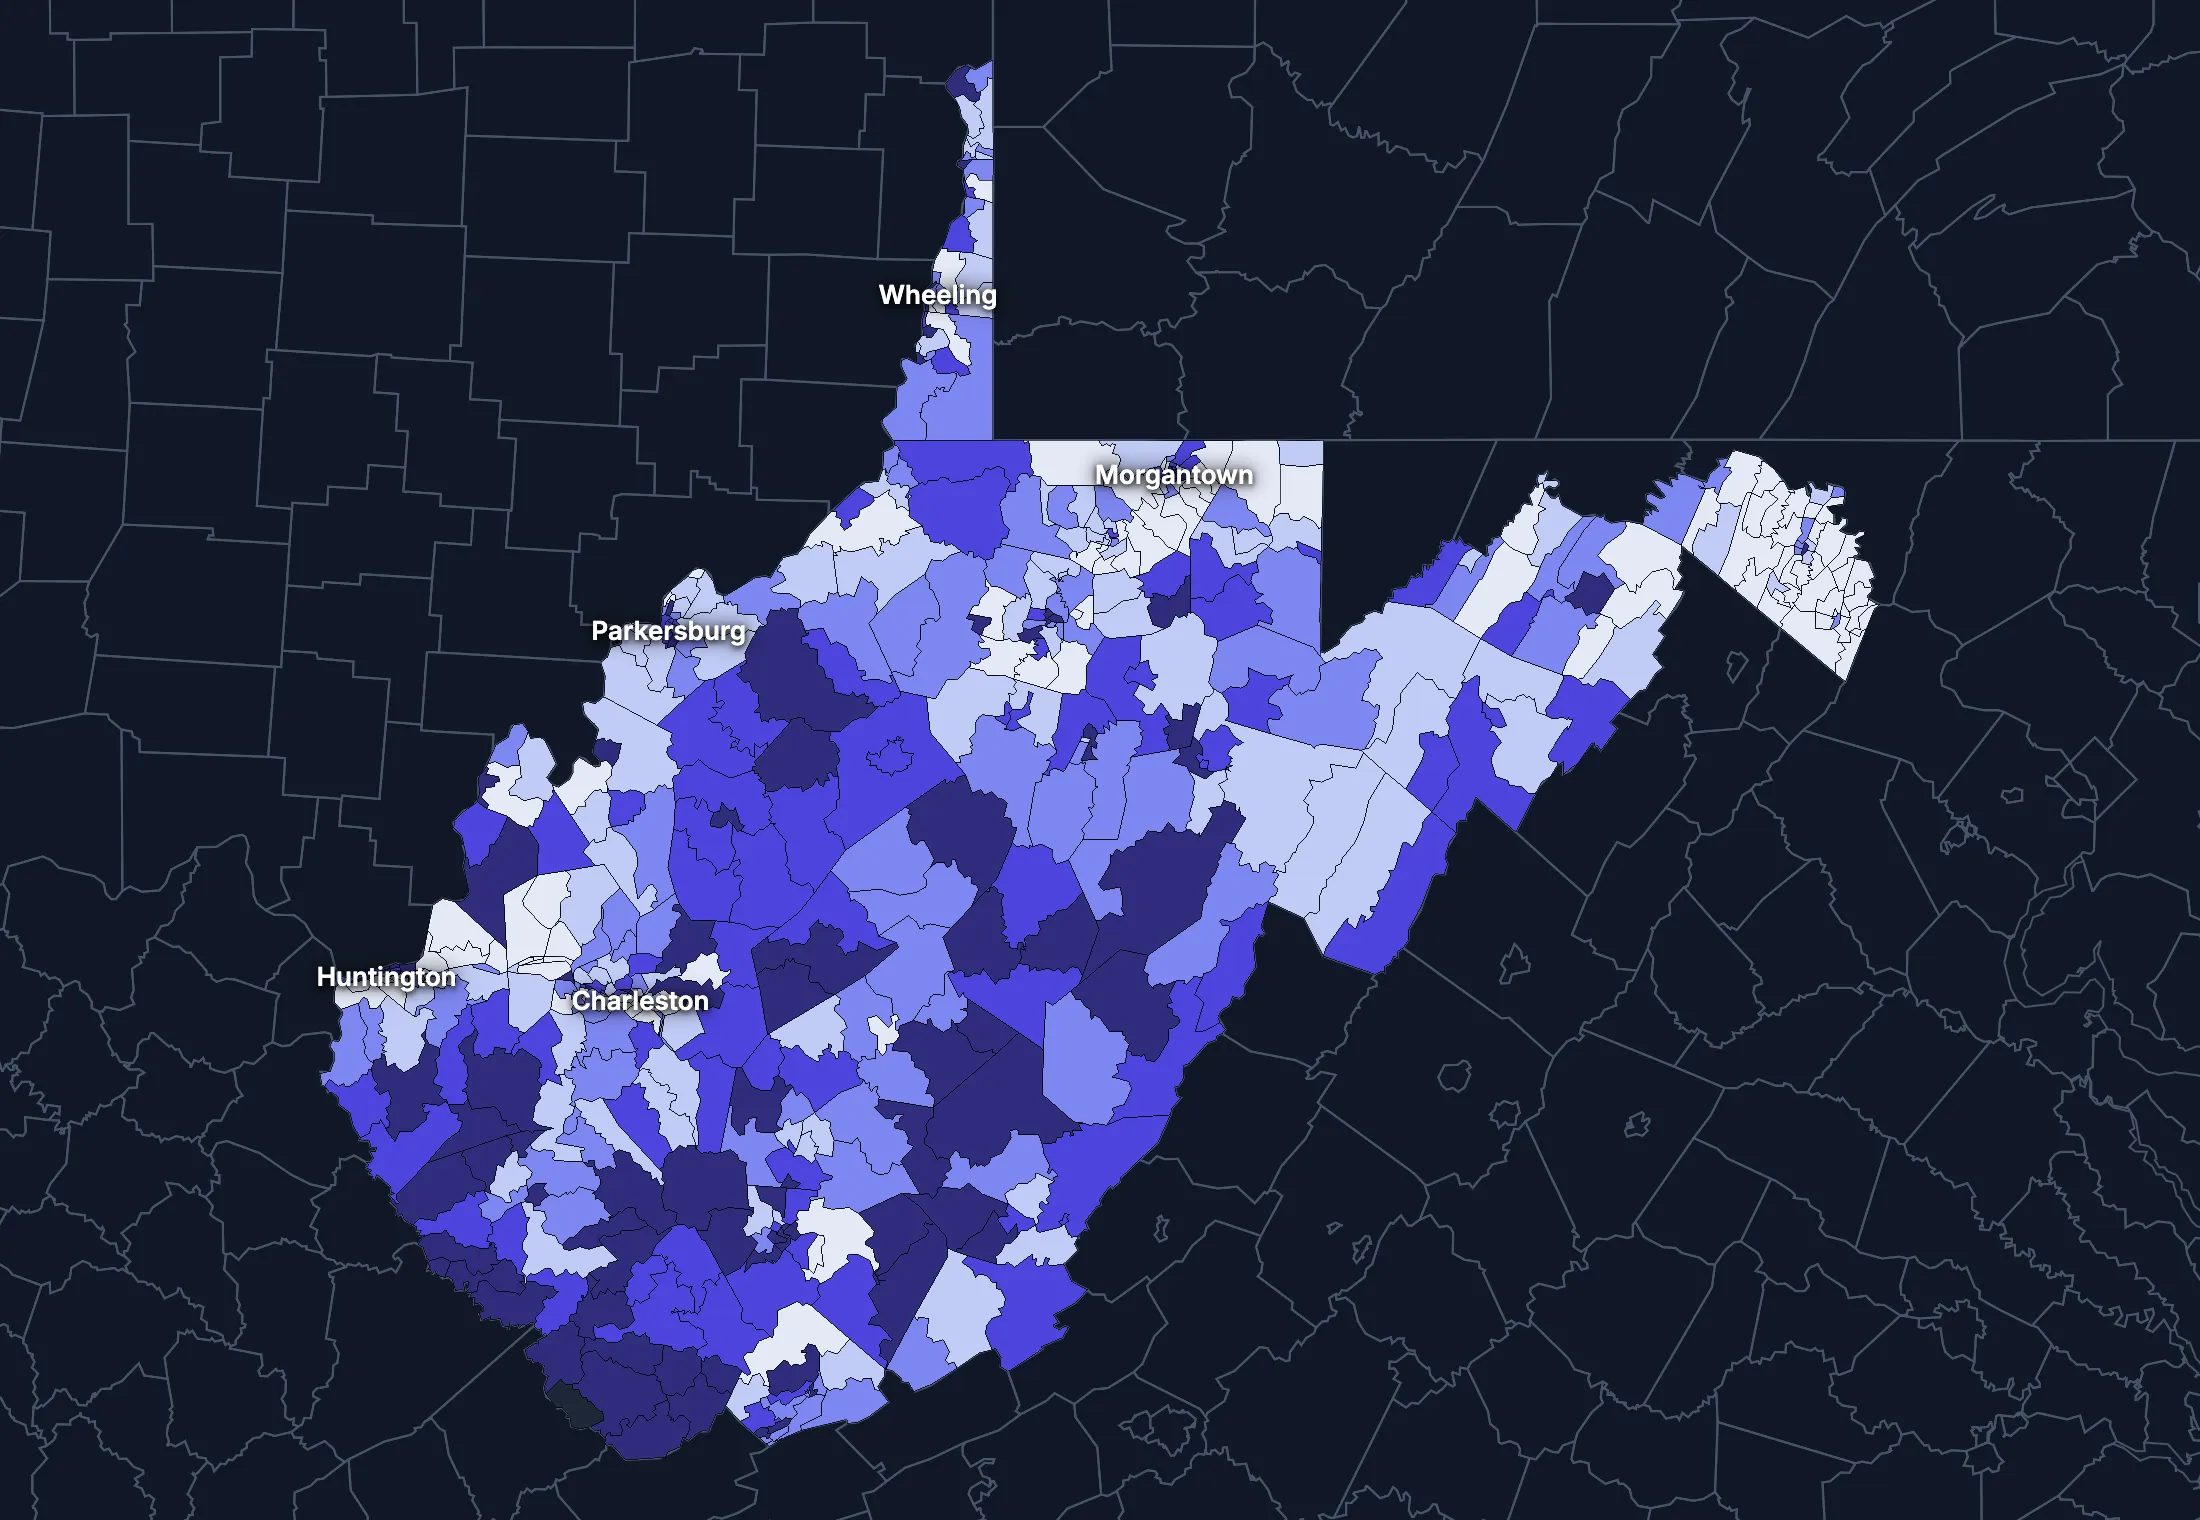
Where the state’s average misleads
Each tick is one census tract, and the dark line marks the state. Hover over a tick or tap it to see the tract.
Poverty
113 of 545 tracts are at least 1.5 times the state’s overall 16.7%, and 159 are at two-thirds of it or less.
Highest: Tract 5, 67.5%. Lowest: Tract 19.02, 1.4%.
Renters paying 30% or more of income
59 of 531 tracts are at least 1.5 times the state’s overall 40.4%, and 169 are at two-thirds of it or less.
Highest: Tract 201.02, 100.0%. Lowest: Tract 9650, 0.0%.
Adults with a bachelor’s degree
79 of 546 tracts are at least 1.5 times the state’s overall 24.1%, and 186 are at two-thirds of it or less.
Highest: Tract 19.02, 77.2%. Lowest: Tract 9539, 0.1%.
Median household income
55 of 543 tracts are at least 1.5 times the typical tract’s $56,923, and 54 are at two-thirds of it or less.
Highest: Tract 9725.01, $135,729. Lowest: Tract 5, $14,943.
American Community Survey 2020–2024 5-year estimates, by census tract. Income is capped at $250,000+ by the Census Bureau.
People
Who lives in West Virginia
Its median age of 43.5 is higher than the US (39.5). 2.3% of residents were born outside the US, and 2.8% speak a language other than English at home.
Age
Source: ACS 2025 1-year, table A01001.
Show data
| West Virginia | United States | |
|---|---|---|
| Under 18 | 19.2% ±0.4% , number 338,511 ±7,431 | 21.0% ±<0.1% , number 71,689,151 ±111,800 |
| 18 to 24 | 9.0% ±0.4% , number 158,961 ±6,783 | 9.3% ±<0.1% , number 31,716,680 ±98,660 |
| 25 to 34 | 11.6% ±0.2% , number 204,055 ±4,242 | 13.6% ±<0.1% , number 46,357,354 ±55,690 |
| 35 to 44 | 12.3% ±0.4% , number 216,553 ±7,662 | 13.4% ±<0.1% , number 45,746,189 ±105,700 |
| 45 to 54 | 12.3% ±0.2% , number 217,811 ±4,248 | 11.8% ±<0.1% , number 40,257,563 ±53,540 |
| 55 to 64 | 13.1% ±0.4% , number 231,468 ±7,243 | 12.1% ±<0.1% , number 41,242,904 ±104,700 |
| 65 to 74 | 12.9% ±0.4% , number 227,367 ±6,646 | 10.8% ±<0.1% , number 36,895,650 ±91,520 |
| 75 and over | 9.7% ±0.3% , number 171,421 ±5,571 | 8.2% ±<0.1% , number 27,879,368 ±78,140 |
Embed
Race and ethnicity
Source: ACS 2025 1-year, table A04001.
Show data
| West Virginia | United States | |
|---|---|---|
| White, not Hispanic | 88.0% ±0.2% , number 1,553,769 ±2,682 | 55.0% ±<0.1% , number 187,959,031 ±58,340 |
| Hispanic or Latino | 2.5% ±0.2% , number 44,098 ±2,829 | 20.5% ±<0.1% , number 69,975,516 ±13,270 |
| Black, not Hispanic | 4.0% ±0.3% , number 70,026 ±4,579 | 11.7% ±<0.1% , number 40,096,453 ±106,200 |
| Asian, not Hispanic | 0.9% ±0.1% , number 16,656 ±1,987 | 6.5% ±<0.1% , number 22,096,709 ±58,340 |
| Other or multiracial | 4.6% ±0.3% , number 81,598 ±6,085 | 6.3% ±<0.1% , number 21,657,150 ±150,100 |
Embed
Language spoken at home
Source: ACS 2025 1-year, table C16001.
Show data
| West Virginia | United States | |
|---|---|---|
| English only | 97.2% ±0.3% , number 1,638,071 ±4,784 | 77.1% ±0.1% , number 249,390,588 ±275,300 |
| Spanish | 1.4% ±0.2% , number 22,778 ±3,263 | 13.9% ±0.1% , number 44,921,985 ±177,800 |
| Other Indo-European | 0.7% ±0.1% , number 11,705 ±2,380 | 4.0% ±<0.1% , number 12,862,980 ±113,500 |
| Asian and Pacific Island | 0.5% ±0.1% , number 8,488 ±1,698 | 3.8% ±<0.1% , number 12,288,841 ±99,740 |
| Arabic and other | 0.3% ±0.1% , number 4,592 ±2,219 | 1.3% ±<0.1% , number 4,116,949 ±71,480 |
Embed
Marital status
Source: ACS 2025 1-year, table A11001.
Show data
| West Virginia | United States | |
|---|---|---|
| Now married | 48.4% ±0.8% , number 721,421 ±11,840 | 47.9% ±0.1% , number 135,567,564 ±223,300 |
| Never married | 29.9% ±0.6% , number 446,697 ±8,607 | 34.8% ±0.1% , number 98,647,238 ±152,600 |
| Divorced | 12.8% ±0.5% , number 191,336 ±7,175 | 10.2% ±<0.1% , number 28,879,967 ±112,900 |
| Widowed | 7.5% ±0.3% , number 112,450 ±4,775 | 5.5% ±<0.1% , number 15,599,094 ±69,430 |
| Separated | 1.3% ±0.2% , number 19,886 ±2,380 | 1.6% ±<0.1% , number 4,441,399 ±49,160 |
Embed
Where people lived a year ago
Source: ACS 2025 1-year, table A08001.
Show data
| West Virginia | United States | |
|---|---|---|
| Same home | 90.0% ±0.6% , number 1,575,232 ±10,800 | 88.4% ±0.1% , number 298,889,697 ±214,800 |
| Same county | 4.5% ±0.5% , number 79,418 ±8,159 | 6.0% ±<0.1% , number 20,202,671 ±166,300 |
| Another county in the state | 2.4% ±0.3% , number 41,392 ±4,936 | 3.0% ±<0.1% , number 10,168,097 ±89,190 |
| Another state | 3.0% ±0.3% , number 52,413 ±5,709 | 2.1% ±<0.1% , number 7,025,589 ±81,660 |
| Another country | 0.1% ±0.1% , number 2,326 ±910 | 0.6% ±<0.1% , number 1,984,943 ±47,210 |
Embed
Top countries of birth, among those born abroad
Source: ACS 2020–2024 5-year, table A07001.
Show data
| West Virginia | |
|---|---|
| Mexico | 8.5% , number 2,757 |
| India | 7.1% , number 2,296 |
| Philippines | 6.8% , number 2,200 |
| Germany | 4.9% , number 1,591 |
| China, Excluding Hong Kong and Taiwan | 4.6% , number 1,490 |
| Canada | 4.1% , number 1,321 |
Embed
All the numbers
| Indicator | West Virginia | US | Rank among states* | Table |
|---|---|---|---|---|
| Population | 1,766,147 | 341,784,859 | 39th | A00001 |
| People per square mile | 73 | 97 | 30th | A00002 |
| Land area (square miles) | 24,041 | – | – | A00002 |
| Median age | 43.5 ±0.3 | 39.5 ±0.1 | 4th | A01004 |
| Under 18 | 19.2% ±0.4% , number 338,511 ±7,431 | 21.0% ±<0.1% , number 71,689,151 ±111,800 | 43rd | B02002 |
| 65 and over | 22.6% ±0.5% , number 398,788 ±8,672 | 19.0% ±<0.1% , number 64,775,018 ±120,300 | 4th | B02002 |
| Born outside the US | 2.3% ±0.2% , number 40,133 ±3,992 | 14.7% ±0.1% , number 50,409,320 ±204,800 | 51st | A06001 |
| Speak a language other than English at home | 2.8% ±0.3% , number 47,563 ±4,911 | 22.9% ±0.1% , number 74,190,755 ±244,000 | 51st | C16001 |
| Veterans (adults) | 7.5% ±0.4% , number 107,341 ±5,722 | 5.9% ±<0.1% , number 15,746,228 ±85,320 | 21st | A16002 |
| Living with a disability | 19.0% ±0.5% , number 330,116 ±9,283 | 13.7% ±<0.1% , number 46,271,455 ±126,000 | 1st | B18101 |
| Women 15–50 who had a baby in the past year | 5.6% ±0.7% , number 21,054 ±2,553 | 5.0% ±0.1% , number 4,016,759 ±44,040 | 38th | B13002 |
| Lived in the same home a year ago | 90.0% ±0.6% , number 1,575,232 ±10,800 | 88.4% ±0.1% , number 298,889,697 ±214,800 | 3rd | A08001 |
| White, not Hispanic | 88.0% ±0.2% , number 1,553,769 ±2,682 | 55.0% ±<0.1% , number 187,959,031 ±58,340 | 3rd | A04001 |
| Hispanic or Latino | 2.5% ±0.2% , number 44,098 ±2,829 | 20.5% ±<0.1% , number 69,975,516 ±13,270 | 51st | A04001 |
| Black, not Hispanic | 4.0% ±0.3% , number 70,026 ±4,579 | 11.7% ±<0.1% , number 40,096,453 ±106,200 | 39th | A04001 |
| Asian, not Hispanic | 0.9% ±0.1% , number 16,656 ±1,987 | 6.5% ±<0.1% , number 22,096,709 ±58,340 | 51st | A04001 |
*1 is the highest. Population is ranked among all states, and the rest among those of 1,000 people or more, whose figures can be ranked. Ranks use 5-year estimates, the only ones covering every state, so they can differ slightly from the figures here.
Income and work
Lower incomes than the US
The median household income is $61,340, lower than the US ($84,780). 16.0% of people live in poverty, and 6.9% have no health insurance, lower than the US (8.4%).
Household income
Source: ACS 2025 1-year, table A14001.
Show data
| West Virginia | United States | |
|---|---|---|
| Under $25,000 | 20.8% ±1.0% , number 155,697 ±7,358 | 14.0% ±0.1% , number 18,727,548 ±88,990 |
| $25,000 to $49,999 | 20.2% ±0.9% , number 151,050 ±6,595 | 15.4% ±0.1% , number 20,665,585 ±101,400 |
| $50,000 to $74,999 | 18.5% ±0.8% , number 138,094 ±6,147 | 15.3% ±0.1% , number 20,513,565 ±88,500 |
| $75,000 to $99,999 | 12.7% ±0.8% , number 95,238 ±5,744 | 12.5% ±0.1% , number 16,814,245 ±87,520 |
| $100,000 to $149,999 | 14.5% ±0.8% , number 108,530 ±5,759 | 17.9% ±0.1% , number 24,018,984 ±99,670 |
| $150,000 to $199,999 | 6.9% ±0.5% , number 51,830 ±3,809 | 10.1% ±0.1% , number 13,521,827 ±70,660 |
| $200,000 or more | 6.3% ±0.5% , number 47,362 ±3,484 | 14.8% ±0.1% , number 19,801,668 ±84,120 |
Embed
What residents do for work
Source: ACS 2025 1-year, table A17004.
Show data
| West Virginia | United States | |
|---|---|---|
| Education and health care | 28.0% ±1.0% , number 209,726 ±8,289 | 24.4% ±0.1% , number 40,862,193 ±140,800 |
| Retail trade | 11.4% ±0.7% , number 85,333 ±5,727 | 10.6% ±0.1% , number 17,781,181 ±96,660 |
| Professional and business services | 9.1% ±0.8% , number 68,339 ±5,843 | 12.8% ±0.1% , number 21,375,231 ±87,110 |
| Arts, food and lodging | 8.5% ±0.6% , number 63,841 ±4,831 | 8.9% ±0.1% , number 14,811,502 ±87,840 |
| Manufacturing | 7.5% ±0.6% , number 56,427 ±4,261 | 9.6% ±0.1% , number 16,064,394 ±91,270 |
| Public administration | 7.5% ±0.7% , number 56,362 ±5,124 | 4.7% ±<0.1% , number 7,944,601 ±69,540 |
| Construction | 7.0% ±0.6% , number 52,330 ±4,835 | 6.7% ±<0.1% , number 11,254,981 ±79,620 |
| Transportation and warehousing | 5.9% ±0.6% , number 44,497 ±4,191 | 5.9% ±<0.1% , number 9,832,211 ±73,020 |
Embed
Where workers come from and go
West Virginia has 679,557 jobs and 720,581 employed residents. 90,477 people commute in to work and 131,501 commute out, while 589,080 both live and work here. The most commuters come from Ohio.
Most commuters come from
- Ohio: 39,384
- Pennsylvania: 15,365
- Virginia: 12,193
Most residents commute to
- Virginia: 46,698
- Maryland: 27,882
- Ohio: 22,638
Show data
| West Virginia | |
|---|---|
| Live and work here | 589,080 |
| Work here, live elsewhere | 90,477 |
| Live here, work elsewhere | 131,501 |
Embed
All the numbers
| Indicator | West Virginia | US | Rank among states* | Table |
|---|---|---|---|---|
| Median household income | $61,340 ±$1,301 | $84,780 ±$215 | 50th | A14006 |
| Income per person | $35,709 ±$663 | $47,171 ±$115 | 50th | A14024 |
| Income inequality (Gini index) | 0.474 ±0.007 | 0.482 ±0.001 | 22nd | A14028 |
| Living in poverty | 16.0% ±0.8% , number 274,202 ±14,290 | 11.8% ±0.1% , number 39,264,183 ±277,400 | 4th | A13004 |
| Unemployment rate | 5.1% ±0.5% , number 40,266 ±3,903 | 4.9% ±<0.1% , number 8,574,594 ±64,350 | 14th | A17005 |
| No health insurance | 6.9% ±0.4% , number 119,707 ±7,250 | 8.4% ±<0.1% , number 28,323,306 ±152,000 | 36th | A20001 |
*1 is the highest. Population is ranked among all states, and the rest among those of 1,000 people or more, whose figures can be ranked. Ranks use 5-year estimates, the only ones covering every state, so they can differ slightly from the figures here.
Education
Fewer college degrees than the US
24.7% of adults 25 and over have a bachelor’s degree or more, lower than the US (37.4%).
Highest level of education
Source: ACS 2025 1-year, table A12001.
Show data
| West Virginia | United States | |
|---|---|---|
| Less than high school | 9.7% ±0.5% , number 122,832 ±6,830 | 9.4% ±0.1% , number 22,321,002 ±120,500 |
| High school only | 40.0% ±0.9% , number 507,959 ±11,970 | 25.6% ±0.1% , number 61,096,726 ±203,400 |
| Some college | 25.6% ±0.8% , number 324,642 ±10,190 | 27.7% ±0.1% , number 65,920,977 ±173,500 |
| Bachelor’s degree | 14.8% ±0.6% , number 187,160 ±8,077 | 22.3% ±0.1% , number 53,224,312 ±196,700 |
| Graduate degree | 9.9% ±0.5% , number 126,082 ±5,864 | 15.0% ±0.1% , number 35,816,011 ±159,400 |
Embed
All the numbers
| Indicator | West Virginia | US | Rank among states* | Table |
|---|---|---|---|---|
| Bachelor’s degree or more | 24.7% ±0.8% , number 313,242 ±9,981 | 37.4% ±0.1% , number 89,040,323 ±253,200 | 51st | A12001 |
| High school graduate or more | 90.3% ±1.4% , number 1,145,843 ±18,620 | 90.6% ±0.2% , number 216,058,026 ±368,200 | 40th | A12001 |
*1 is the highest. Population is ranked among all states, and the rest among those of 1,000 people or more, whose figures can be ranked. Ranks use 5-year estimates, the only ones covering every state, so they can differ slightly from the figures here.
Housing
Home values kept pace with incomes
25.3% of households rent, lower than the US (34.7%). The median home is worth $176,300 and the median rent is $921. After inflation, home values rose 15% from 2015 to 2025, while household income rose 7%.
Housing costs and income, 2015 to 2025, after inflation
Source: ACS 1-year, table A10036, A18009, A14006.
Show data
| West Virginia | United States | |
|---|---|---|
| Median home value | +14.8% | +39.3% |
| Median rent | −0.4% | +18.5% |
| Median household income | +6.6% | +10.9% |
Embed
Types of homes
Source: ACS 2025 1-year, table A10032.
Show data
| West Virginia | United States | |
|---|---|---|
| Single-family, detached | 70.2% ±1.0% , number 612,015 ±8,776 | 60.9% ±0.1% , number 90,335,844 ±173,300 |
| Single-family, attached | 3.0% ±0.3% , number 26,077 ±2,851 | 6.4% ±<0.1% , number 9,527,703 ±51,230 |
| 2 to 4 units | 5.1% ±0.6% , number 44,709 ±4,819 | 7.5% ±0.1% , number 11,109,005 ±75,790 |
| 5 to 19 units | 4.7% ±0.5% , number 40,736 ±3,970 | 8.7% ±0.1% , number 12,829,882 ±97,590 |
| 20 or more units | 3.3% ±0.4% , number 28,453 ±3,542 | 11.1% ±0.1% , number 16,381,450 ±92,310 |
| Mobile homes and other | 13.8% ±0.8% , number 119,897 ±6,770 | 5.4% ±<0.1% , number 8,045,083 ±53,680 |
Embed
When homes were built
Source: ACS 2025 1-year, table A10055.
Show data
| West Virginia | United States | |
|---|---|---|
| 2010 or later | 10.7% ±0.8% , number 80,369 ±5,693 | 15.1% ±0.1% , number 20,257,912 ±101,300 |
| 2000 to 2009 | 12.0% ±0.7% , number 89,466 ±5,586 | 13.8% ±0.1% , number 18,535,840 ±92,260 |
| 1980 to 1999 | 24.4% ±1.0% , number 182,379 ±7,980 | 24.1% ±0.1% , number 32,332,570 ±118,900 |
| 1960 to 1979 | 24.2% ±1.0% , number 180,830 ±7,464 | 22.9% ±0.1% , number 30,726,302 ±110,000 |
| Before 1960 | 28.7% ±1.1% , number 214,757 ±8,178 | 24.0% ±0.1% , number 32,210,798 ±121,500 |
Embed
All the numbers
| Indicator | West Virginia | US | Rank among states* | Table |
|---|---|---|---|---|
| Housing units | 871,887 | – | – | A10001 |
| Households | 747,801 ±6,569 | – | – | A10008 |
| People per household | 2.29 ±0.02 | 2.49 ±0.01 | 42nd | A10003 |
| Households that rent | 25.3% ±1.0% , number 188,868 ±7,991 | 34.7% ±0.1% , number 46,551,688 ±193,200 | 51st | A10060 |
| Vacant homes | 14.2% ±0.8% , number 124,086 ±6,593 | 9.6% ±0.1% , number 14,165,545 ±137,100 | 4th | A10047, A10060 |
| Median gross rent | $921 ±$22 | $1,557 ±$4 | 51st | A18009 |
| Median home value | $176,300 ±$4,940 | $371,100 ±$646 | 51st | A10036 |
| Renters paying 30% or more of income | 40.9% ±2.4% , number 77,292 ±5,576 | 48.3% ±0.2% , number 22,486,693 ±122,100 | 46th | A18002 |
| Owners paying 30% or more of income | 16.5% ±0.9% , number 92,077 ±5,412 | 24.2% ±0.1% , number 21,201,943 ±93,050 | 51st | A10040 |
| Homes built before 1960 | 28.7% ±1.1% , number 214,757 ±8,178 | 24.0% ±0.1% , number 32,210,798 ±121,500 | 18th | A10055 |
*1 is the highest. Population is ranked among all states, and the rest among those of 1,000 people or more, whose figures can be ranked. Ranks use 5-year estimates, the only ones covering every state, so they can differ slightly from the figures here.
Getting around
A driving state with short commutes
78.2% of workers drive alone and 8.2% work from home. 35.7% of those who travel to work spend 30 minutes or more getting there, and 8.3% of households have no vehicle.
How people get to work
Source: ACS 2025 1-year, table A09005.
Show data
| West Virginia | United States | |
|---|---|---|
| Drive alone | 78.2% ±0.8% , number 576,666 ±10,260 | 69.8% ±0.1% , number 115,297,377 ±192,900 |
| Carpool | 9.1% ±0.8% , number 67,280 ±5,747 | 8.9% ±0.1% , number 14,712,170 ±97,240 |
| Public transit | 1.1% ±0.3% , number 7,854 ±1,894 | 4.3% ±<0.1% , number 7,100,386 ±63,330 |
| Walk | 2.2% ±0.3% , number 15,929 ±2,069 | 2.4% ±<0.1% , number 4,016,469 ±41,070 |
| Work from home | 8.2% ±0.6% , number 60,696 ±4,156 | 12.9% ±0.1% , number 21,288,393 ±105,700 |
| Other | 1.2% ±0.3% , number 8,613 ±1,883 | 1.7% ±<0.1% , number 2,799,658 ±41,510 |
Embed
Time spent getting to work
Source: ACS 2025 1-year, table B09001.
Show data
| West Virginia | United States | |
|---|---|---|
| Under 10 minutes | 14.8% ±0.9% , number 99,764 ±6,555 | 12.0% ±0.1% , number 17,199,225 ±93,440 |
| 10 to 19 minutes | 29.7% ±1.1% , number 200,593 ±8,343 | 27.8% ±0.1% , number 40,059,540 ±137,700 |
| 20 to 29 minutes | 19.9% ±1.2% , number 134,501 ±8,277 | 21.0% ±0.1% , number 30,221,743 ±111,100 |
| 30 to 39 minutes | 14.6% ±0.9% , number 98,503 ±6,180 | 17.1% ±0.1% , number 24,659,138 ±103,800 |
| 40 to 59 minutes | 10.3% ±0.7% , number 69,907 ±4,775 | 12.6% ±0.1% , number 18,104,709 ±97,070 |
| 60 minutes or more | 10.8% ±0.8% , number 73,074 ±5,386 | 9.5% ±0.1% , number 13,681,705 ±84,440 |
Embed
Vehicles per household
Source: ACS 2025 1-year, table A10030.
Show data
| West Virginia | United States | |
|---|---|---|
| None | 8.3% ±0.7% , number 62,178 ±4,902 | 8.8% ±0.1% , number 11,781,997 ±77,240 |
| One | 34.1% ±1.1% , number 254,862 ±8,811 | 33.1% ±0.1% , number 44,424,682 ±160,700 |
| Two | 36.3% ±1.0% , number 271,420 ±7,512 | 36.0% ±0.1% , number 48,200,889 ±176,800 |
| Three or more | 21.3% ±0.8% , number 159,341 ±6,358 | 22.1% ±0.1% , number 29,655,854 ±113,300 |
Embed
All the numbers
| Indicator | West Virginia | US | Rank among states* | Table |
|---|---|---|---|---|
| Drive to work alone | 78.2% ±0.8% , number 576,666 ±10,260 | 69.8% ±0.1% , number 115,297,377 ±192,900 | 5th | A09005 |
| Take public transit | 1.1% ±0.3% , number 7,854 ±1,894 | 4.3% ±<0.1% , number 7,100,386 ±63,330 | 42nd | A09005 |
| Work from home | 8.2% ±0.6% , number 60,696 ±4,156 | 12.9% ±0.1% , number 21,288,393 ±105,700 | 46th | A09005 |
| Commute 30 minutes or more | 35.7% ±1.3% , number 241,484 ±9,486 | 39.2% ±0.1% , number 56,445,552 ±165,300 | 22nd | B09001 |
| Households with no vehicle | 8.3% ±0.6% , number 62,178 ±4,797 | 8.8% ±<0.1% , number 11,781,997 ±64,240 | 13th | A10030 |
*1 is the highest. Population is ranked among all states, and the rest among those of 1,000 people or more, whose figures can be ranked. Ranks use 5-year estimates, the only ones covering every state, so they can differ slightly from the figures here.
Places
The largest cities in West Virginia
Population, from the latest estimates available. Figures cover the whole of each place.
Largest cities
- Charleston: 47,421
- Huntington: 45,787
- Morgantown: 30,236
- Parkersburg: 29,240
- Wheeling: 26,350
- Martinsburg: 18,904
- Weirton: 18,647
- Fairmont: 18,221
States like this one
- South Carolina: 5,296,225
- Alabama: 5,086,768
- Kentucky: 4,534,824
- Mississippi: 2,946,779
States at least a third this size, with the closest income, education, age, housing and origins.
Every county and place in West Virginia
Find any county, city, town, metro area, ZIP code, school district or district in West Virginia.
Counties
Each of the 55 counties with its population, from ACS 2020–2024 5-year estimates.
- Barbour County15,424
- Berkeley County129,514
- Boone County21,026
- Braxton County12,208
- Brooke County21,805
- Cabell County92,739
- Calhoun County6,048
- Clay County7,835
- Doddridge County7,711
- Fayette County39,519
- Gilmer County7,288
- Grant County10,983
- Greenbrier County32,386
- Hampshire County23,465
- Hancock County28,431
- Hardy County14,243
- Harrison County64,984
- Jackson County27,705
- Jefferson County59,260
- Kanawha County176,537
- Lewis County16,740
- Lincoln County19,902
- Logan County31,418
- Marion County55,909
- Marshall County29,865
- Mason County25,043
- McDowell County17,943
- Mercer County58,563
- Mineral County26,854
- Mingo County22,542
- Monongalia County107,163
- Monroe County12,386
- Morgan County17,426
- Nicholas County24,277
- Ohio County41,582
- Pendleton County6,043
- Pleasants County7,521
- Pocahontas County7,784
- Preston County34,160
- Putnam County57,177
- Raleigh County73,195
- Randolph County27,576
- Ritchie County8,286
- Roane County13,786
- Summers County11,729
- Taylor County16,487
- Tucker County6,654
- Tyler County8,064
- Upshur County23,712
- Wayne County38,164
- Webster County8,144
- Wetzel County14,078
- Wirt County5,053
- Wood County83,407
- Wyoming County20,629
Cities, towns and other places
Each of the 429 with its population, from ACS 2020–2024 5-year estimates. Census-designated places are communities without a local government of their own, drawn by the Census Bureau so they can be counted.
- Accoville916
- Addison (Webster Springs)1,038
- Adrian183
- Albright254
- Alderson1,383
- Alum Creek1,749
- Amherstdale256
- Anawalt109
- Anmoore522
- Ansted1,140
- Apple Grove202
- Arbovale20
- Arthurdale982
- Athens1,494
- Auburn91
- Aurora284
- Bancroft475
- Barboursville4,376
- Barrackville1,430
- Bartley327
- Bartow47
- Bath (Berkeley Springs)975
- Baxter153
- Bayard299
- Beards Fork46
- Beaver695
- Beckley16,818
- Beech Bottom443
- Belington1,781
- Belle1,611
- Belmont983
- Belva17
- Benwood1,230
- Bergoo20
- Berwind127
- Bethany1,039
- Bethlehem2,592
- Beverly629
- Big Chimney610
- Big Creek210
- Big Sandy113
- Birch River7
- Blacksville55
- Blennerhassett3,282
- Bluefield9,387
- Bluewell1,992
- Boaz1,400
- Bolivar1,215
- Bolt195
- Boomer250
- Booth129
- Bradley1,424
- Bradshaw327
- Bramwell135
- Brandonville166
- Brandywine267
- Brenton71
- Bridgeport9,252
- Brookhaven6,212
- Bruceton Mills71
- Bruno638
- Brush Fork1,096
- Buckhannon5,116
- Bud644
- Buffalo1,150
- Burlington94
- Burnsville547
- Cairo273
- Camden-on-Gauley182
- Cameron609
- Capon Bridge497
- Carolina261
- Carpendale1,035
- Cassville1,149
- Cedar Grove489
- Century110
- Ceredo1,528
- Chapmanville928
- Charles Town7,337
- Charleston47,421
- Charlton Heights276
- Chattaroy467
- Chauncey198
- Cheat Lake10,902
- Chelyan564
- Chesapeake1,702
- Chester2,179
- Clarksburg15,549
- Clay378
- Clearview500
- Clendenin903
- Clifton211
- Coal City724
- Coal Fork1,423
- Colcord201
- Colliers117
- Comfort220
- Corinne809
- Cottageville310
- Covel90
- Cowen485
- Crab Orchard1,139
- Craigsville2,190
- Crooked Creek517
- Cross Lanes9,671
- Crum187
- Crumpler351
- Cucumber87
- Culloden3,040
- Cunard165
- Dailey23
- Daniels1,489
- Danville549
- Davis663
- Davy186
- Deep Water104
- Delbarton333
- Despard972
- Dixie56
- Dorothy115
- Dunbar7,254
- Dupont City501
- Durbin220
- Earling180
- East Bank850
- East Dailey292
- East View604
- Eccles64
- Eleanor1,726
- Elizabeth564
- Elk Garden212
- Elkins6,811
- Elkview671
- Ellenboro209
- Enterprise1,087
- Eskdale326
- Fairlea1,312
- Fairmont18,221
- Fairview267
- Falling Spring182
- Falling Waters2,183
- Falls View372
- Farmington390
- Fayetteville2,817
- Fenwick16
- Flatwoods319
- Flemington240
- Follansbee2,757
- Fort Ashby1,283
- Fort Gay437
- Frank188
- Franklin435
- Friendly123
- Gallipolis Ferry731
- Galloway71
- Garten107
- Gary861
- Gassaway688
- Gatewood605
- Gauley Bridge413
- Ghent290
- Gilbert308
- Gilbert Creek1,061
- Glasgow878
- Glen Dale1,461
- Glen Ferris41
- Glen Fork411
- Glen Jean34
- Glen White193
- Glenville1,037
- Grafton4,618
- Grant Town506
- Grantsville401
- Granville1,257
- Great Cacapon587
- Green Bank84
- Green Spring84
- Greenview254
- Greenville317
- Gypsy119
- Hambleton203
- Hamlin1,068
- Handley418
- Hansford77
- Harman119
- Harpers Ferry350
- Harrisville1,574
- Hartford City557
- Harts747
- Hedgesville379
- Henderson174
- Hendricks375
- Henlawson324
- Hepzibah134
- Hico16
- Hillsboro194
- Hilltop397
- Hinkleville291
- Hinton2,086
- Holden670
- Hollygrove74
- Hometown756
- Hooverson Heights2,090
- Hundred371
- Huntersville95
- Huntington45,787
- Hurricane6,855
- Huttonsville225
- Iaeger253
- Idamay575
- Institute521
- Inwood2,794
- Itmann80
- Jacksonburg181
- Jane Lew480
- Jefferson534
- Junior281
- Justice186
- Justice Addition118
- Kanawha192
- Kenova2,944
- Kermit153
- Keyser4,857
- Keystone39
- Kimball231
- Kimberly357
- Kincaid285
- Kingwood2,973
- Kistler318
- Kopperston706
- Lashmeet655
- Lavalette1,005
- Leon252
- Lesage1,329
- Lester377
- Lewisburg3,835
- Littleton89
- Logan1,294
- Lost Creek302
- Lubeck1,495
- Lumberport703
- Mabscott1,396
- MacArthur1,493
- Madison2,788
- Malden320
- Mallory1,417
- Man1,049
- Mannington1,829
- Marlinton1,201
- Marmet1,524
- Martinsburg18,904
- Mason787
- Masontown518
- Matewan505
- Matheny586
- Matoaka30
- Maybeury88
- McConnell818
- McMechen1,826
- Meadow Bridge504
- Middlebourne796
- Middleway479
- Mill Creek659
- Milton2,817
- Mineralwells2,389
- Mitchell Heights385
- Monaville502
- Monongah837
- Montcalm484
- Montgomery1,516
- Montrose295
- Moorefield2,525
- Morgantown30,236
- Moundsville7,869
- Mount Carbon347
- Mount Gay-Shamrock1,166
- Mount Hope1,504
- Mullens2,034
- Neibert219
- Nettie183
- New Cumberland943
- New Haven1,493
- New Martinsville5,133
- New Richmond23
- Newark495
- Newburg226
- Newell1,246
- Nitro6,853
- North Hills926
- Northfork169
- Norton196
- Nutter Fort2,075
- Oak Hill7,937
- Oakvale254
- Oceana1,203
- Omar188
- Paden City2,415
- Page90
- Parcoal12
- Parkersburg29,240
- Parsons1,448
- Paw Paw459
- Pax83
- Pea Ridge6,988
- Peach Creek14
- Pennsboro1,334
- Petersburg2,384
- Peterstown594
- Philippi2,861
- Piedmont735
- Pinch4,037
- Pine Grove367
- Pineville468
- Piney View986
- Pleasant Valley3,482
- Poca872
- Point Pleasant3,961
- Powellton479
- Pratt438
- Prichard389
- Prince52
- Princeton5,736
- Prosperity1,389
- Pullman286
- Quinwood221
- Rachel52
- Racine331
- Rainelle1,458
- Raleigh325
- Rand1,064
- Ranson5,729
- Ravenswood3,830
- Raymond City28
- Raysal162
- Reader193
- Red Jacket482
- Reedsville504
- Reedy292
- Reynoldsville111
- Rhodell137
- Richwood2,403
- Ridgeley239
- Ripley3,071
- Rivesville627
- Robinette706
- Rock Cave276
- Romney1,922
- Ronceverte1,419
- Rossmore152
- Rowlesburg773
- Rupert909
- Salem1,629
- Salt Rock274
- Sand Fork96
- Sarah Ann473
- Scarbro176
- Shady Spring3,381
- Shannondale3,465
- Shenandoah Junction1,141
- Shepherdstown1,460
- Shinnston2,352
- Shrewsbury310
- Sissonville3,593
- Sistersville1,409
- Smithers712
- Smithfield113
- Sophia1,528
- South Charleston13,457
- Spelter87
- Spencer2,291
- Sprague952
- Springfield502
- St. Albans10,522
- St. George142
- St. Marys2,174
- Stanaford1,449
- Star City1,960
- Stollings505
- Stonewood2,212
- Summersville3,373
- Sutton797
- Switzer140
- Sylvester131
- Teays Valley14,151
- Terra Alta1,841
- Thomas599
- Thurmond5
- Tioga577
- Tornado1,114
- Triadelphia825
- Tunnelton404
- Twilight97
- Union476
- Valley Bend661
- Valley Grove363
- Valley Head462
- Van214
- Verdunville396
- Vienna10,518
- Vivian79
- Wallace277
- War628
- Wardensville378
- Washington1,139
- Waverly361
- Wayne1,675
- Weirton18,647
- Welch3,507
- Wellsburg2,203
- West Dunbar425
- West Hamlin567
- West Liberty1,481
- West Logan365
- West Milford591
- West Union1,039
- Weston3,840
- Westover4,026
- Wheeling26,350
- White Hall946
- White Sulphur Springs2,549
- Whitesville266
- Wiley Ford630
- Williamson2,919
- Williamstown2,980
- Windsor Heights491
- Winfield2,918
- Wolf Summit213
- Womelsdorf (Coalton)280
- Worthington102
Metro and micro areas
Each of the 15 that reach into West Virginia, with its whole population, from ACS 2020–2024 5-year estimates. Metro and micro areas are counties tied together by commuting, drawn by the Office of Management and Budget.
- Beckley, WV Metro Area112,714
- Bluefield, WV-VA Micro Area98,187
- Charleston, WV Metro Area205,398
- Clarksburg, WV Micro Area89,182
- Cumberland, MD-WV Micro Area94,306
- Elkins, WV Micro Area27,576
- Fairmont, WV Micro Area55,909
- Hagerstown-Martinsburg, MD-WV Metro Area302,649
- Huntington-Ashland, WV-KY-OH Metro Area370,729
- Morgantown, WV Metro Area141,323
- Parkersburg-Vienna, WV Metro Area88,460
- Washington-Arlington-Alexandria, DC-VA-MD-WV Metro Area6.32M
- Weirton-Steubenville, WV-OH Metro Area114,754
- Wheeling, WV-OH Metro Area136,920
- Winchester, VA-WV Metro Area146,386
ZIP codes
Each of the 723 with people in it, by the town it's centered in, from ACS 2020–2024 5-year estimates. These are the Census Bureau's ZIP Code Tabulation Areas, which follow the Postal Service's ZIP codes as closely as census blocks allow.
- 24701Brush Fork17,117
- 24712Athens2,913
- 24714Lashmeet203
- 24715Bramwell275
- 24716Bud544
- 24719Covel123
- 24724Bramwell68
- 24726Covel275
- 24729Matoaka38
- 24731Lashmeet175
- 24733Lashmeet122
- 24736Matoaka426
- 24737Montcalm1,186
- 24739Athens13,981
- 24740Princeton16,498
- 24747Lashmeet3,125
- 24801Welch4,745
- 24808Anawalt501
- 24811Raysal295
- 24813Bartley400
- 24815Berwind176
- 24816Big Sandy113
- 24817Bradshaw1,931
- 24818Brenton1,481
- 24822Brenton890
- 24823Mallory413
- 24826Cucumber87
- 24827Kopperston755
- 24828Davy429
- 24830Gary125
- 24831Keystone393
- 24834Davy996
- 24836Gary914
- 24839Justice495
- 24844Iaeger1,049
- 24845Iaeger322
- 24846Gilbert Creek266
- 24847Itmann80
- 24848Anawalt112
- 24849Matheny110
- 24850Bradshaw29
- 24851Justice186
- 24853Kimball458
- 24854Kopperston820
- 24855Northfork39
- 24857Oceana770
- 24860Matheny628
- 24861Maybeury90
- 24862Gilbert Creek749
- 24866Cucumber729
- 24867New Richmond74
- 24868Northfork999
- 24869Justice425
- 24870Glen Fork1,639
- 24871Gary667
- 24872Iaeger477
- 24873Bradshaw247
- 24874Pineville1,851
- 24878Welch279
- 24879Raysal180
- 24880Glen Fork189
- 24881Big Sandy82
- 24882Justice974
- 24884Cucumber54
- 24888Anawalt90
- 24892War1,193
- 24894Berwind409
- 24895Gary4
- 24898Pineville311
- 24901Lewisburg9,093
- 24910Alderson4,664
- 24915Arbovale505
- 24916Alderson322
- 24918Peterstown1,420
- 24920Bartow356
- 24924Marlinton685
- 24925Fairlea577
- 24927Marlinton476
- 24931Rupert1,173
- 24934Green Bank362
- 24935Hinton797
- 24938Falling Spring1,233
- 249411,243
- 24943Meadow Bridge156
- 24944Arbovale448
- 24945303
- 24946Hillsboro1,075
- 24951Union1,416
- 24954Marlinton3,019
- 24957Lewisburg689
- 24962Alderson7
- 24963Peterstown3,560
- 24966Falling Spring1,332
- 24970Ronceverte3,647
- 24974Union223
- 24976Union1,095
- 24977Rupert465
- 24981Alderson463
- 24983Union1,474
- 24984265
- 24985161
- 249865,014
- 24991Falling Spring277
- 24993Alderson37
- 25003Alum Creek1,975
- 25005281
- 25007Bolt687
- 25008Pax113
- 25009Racine870
- 25011Bancroft647
- 25015Belle3,888
- 25019Clay666
- 25021Twilight258
- 25022Robinette36
- 25024Racine452
- 25025Cedar Grove83
- 25028Van440
- 25030Clendenin537
- 25031Boomer424
- 25033Buffalo2,284
- 25035Chelyan719
- 25036Smithers159
- 25039Pratt629
- 25040Falls View648
- 25043Clay1,165
- 25044Pax324
- 25045Clendenin4,234
- 25047Van146
- 25048Colcord351
- 25049Comfort548
- 25051Racine117
- 25053Danville3,801
- 25054Eskdale238
- 25057Charlton Heights138
- 25059Dixie324
- 25060Dorothy36
- 25061Hollygrove363
- 25062Colcord233
- 250631,309
- 25064West Dunbar9,090
- 25067East Bank850
- 25070Eleanor1,875
- 25071Elkview11,107
- 25075Eskdale660
- 25076Crooked Creek81
- 25081Madison1,084
- 25082Buffalo1,830
- 25083Powellton439
- 25085Gauley Bridge557
- 25086Glasgow907
- 25088Clay151
- 25090Glen Ferris91
- 25093Twilight107
- 25102Montgomery418
- 25103Handley151
- 25106Henderson346
- 25107Marmet306
- 25108Greenview557
- 25109Hometown756
- 25110Handley366
- 25111Dixie227
- 25112Institute206
- 25113Clay655
- 25114Greenview278
- 25115Charlton Heights39
- 25118Powellton409
- 25119Kincaid397
- 25121Crooked Creek948
- 25123Leon2,440
- 25124Hometown1,514
- 25125Dixie990
- 25126Handley76
- 25130Madison3,456
- 25132Pratt501
- 25133Clay441
- 25134Chelyan548
- 25136Smithers1,543
- 25139Deep Water498
- 25140Bolt1,321
- 25141305
- 25142Racine130
- 25143Nitro8,714
- 25148Sylvester587
- 25149Van231
- 25152Beards Fork384
- 25154Racine1,085
- 25156Pinch119
- 25159Bancroft3,656
- 25160Dixie510
- 25161Kincaid514
- 25162Pratt438
- 25164Clay571
- 25165Racine616
- 25168Winfield2,330
- 25169Madison415
- 25173Beards Fork67
- 25174Colcord204
- 25177St. Albans22,665
- 25180Bolt182
- 25181Sylvester1,457
- 25183Van80
- 25185Belva729
- 25186Smithers725
- 25187Leon497
- 25193Sylvester230
- 25201Coal Fork64
- 25202Tornado1,451
- 25203Greenview228
- 25204Twilight161
- 25205Greenview229
- 25206Van264
- 25208Twilight852
- 25209Whitesville539
- 25211Birch River100
- 25213Eleanor6,224
- 25214Chesapeake994
- 25231Sissonville6
- 25234Grantsville566
- 25235945
- 25239Cottageville1,787
- 25241Ripley2,154
- 25243740
- 25244850
- 25245Ripley684
- 25247Hartford City499
- 252483,222
- 25251377
- 25252Reedy1,195
- 25253New Haven2,219
- 25259880
- 25260Mason1,298
- 25261Grantsville325
- 25262Cottageville1,233
- 25264Cottageville482
- 25265Hartford City1,285
- 25266680
- 25267Glenville731
- 25268498
- 25270Reedy1,127
- 25271Ripley7,376
- 25275Ravenswood2,181
- 25276Spencer7,127
- 25285Clay825
- 252861,652
- 25287Clifton1,302
- 25301Charleston2,498
- 25302Charleston13,204
- 25303South Charleston7,396
- 25304Malden8,655
- 25306Coal Fork6,040
- 25309South Charleston12,154
- 25311Coal Fork9,825
- 25312Sissonville10,047
- 25313Institute11,760
- 25314South Charleston14,794
- 25315Marmet3,286
- 25320Sissonville4,595
- 25387Charleston4,708
- 25401Martinsburg14,979
- 25403Martinsburg16,470
- 25404Martinsburg23,990
- 25405Martinsburg14,266
- 25411Bath12,367
- 25413Inwood9,618
- 25414Charles Town21,073
- 25419Falling Waters13,201
- 25420Inwood4,945
- 25422Paw Paw1,463
- 25425Bolivar13,332
- 25427Hedgesville16,595
- 25428Inwood14,825
- 25430Middleway8,954
- 25431Green Spring413
- 25432Bolivar120
- 25434Paw Paw3,272
- 25437Springfield143
- 25438Ranson7,330
- 25442Shenandoah Junction2,772
- 25443Shepherdstown7,496
- 25444Paw Paw717
- 25446Charles Town1,374
- 25501Danville1,268
- 25502Apple Grove376
- 25503Apple Grove837
- 25504Barboursville12,251
- 25505Big Creek380
- 25506West Hamlin5,299
- 25507Ceredo1,168
- 25508Chapmanville8,028
- 25510Culloden5,098
- 25511855
- 25512Wayne932
- 25514Fort Gay3,520
- 25515Gallipolis Ferry2,386
- 25517Fort Gay1,512
- 25520Lesage1,129
- 25521Hamlin897
- 25523Hamlin2,753
- 25524Harts2,533
- 25526Hurricane22,514
- 25529Danville1,027
- 25530Kenova6,856
- 25534Harts65
- 25535Lavalette2,461
- 25537Lesage1,855
- 25540Harts192
- 25541Milton9,318
- 25544Hamlin16
- 25545Lesage5,670
- 25547Mitchell Heights583
- 25550Point Pleasant8,963
- 25555Prichard2,008
- 25557Harts1,251
- 25559Salt Rock1,899
- 25560Teays Valley9,303
- 25564Alum Creek1,335
- 25565Danville774
- 25567Alum Creek823
- 25570Wayne6,445
- 25571West Hamlin1,365
- 25573Alum Creek600
- 25601Mount Gay-Shamrock4,380
- 25606Accoville1,341
- 25607Robinette847
- 25608Gilbert Creek1,051
- 25611Bruno1,211
- 25612Chauncey198
- 25617Mallory163
- 25621Gilbert1,739
- 25624Henlawson388
- 25625Holden1,445
- 25628Kistler440
- 25630Robinette279
- 25632Chauncey663
- 25634Mallory1,358
- 25635Greenville1,408
- 25637Mount Gay-Shamrock1,004
- 25638Omar249
- 25639Crooked Creek544
- 25644Sarah Ann761
- 25646Stollings1,204
- 25647Switzer140
- 25649Verdunville1,722
- 25650Mallory86
- 25651Gilbert Creek533
- 25652Holden1,524
- 25653Monaville74
- 25654Kistler346
- 25661Chattaroy4,277
- 25666Kermit145
- 25667Chattaroy467
- 25669Crum633
- 25670Delbarton3,203
- 25671Verdunville1,898
- 25672Matewan377
- 25674Kermit1,999
- 25676Holden1,239
- 25678Matewan1,336
- 25685Kermit763
- 25688Matewan361
- 25690Delbarton742
- 25692Red Jacket1,395
- 25696Red Jacket1,241
- 25699Crum30
- 25701Huntington21,197
- 25702Pea Ridge7,188
- 25703Huntington4,598
- 25704Lavalette14,351
- 25705Pea Ridge20,922
- 25755Huntington1,644
- 25801Bradley31,128
- 25810Corinne109
- 25811Rhodell37
- 25812Ansted1,339
- 25813Stanaford6,958
- 25817Bolt195
- 25818Bradley163
- 25820Lashmeet583
- 25823Coal City423
- 25825Ghent2,659
- 25826Corinne700
- 25827Crab Orchard1,380
- 25831Cunard1,389
- 25832Daniels4,818
- 25836Eccles1,333
- 25837Garten314
- 25839Bolt390
- 25840Fayetteville7,746
- 25841Ghent526
- 25843Ghent986
- 25844Bolt607
- 25845Glen Fork596
- 25846Glen Jean34
- 25848Bolt131
- 25849Glen White193
- 25853Rhodell106
- 25854Hico704
- 25855Hilltop339
- 25862Hico216
- 25864Prince299
- 25865Lester1,573
- 25866Oak Hill308
- 25868Hico610
- 25870Mullens19
- 25871Mabscott778
- 25873MacArthur926
- 25875Glen Fork779
- 25876New Richmond90
- 25878Sophia1,094
- 25879Oak Hill273
- 25880Bradley6,163
- 25882Mullens2,268
- 25901Thurmond10,012
- 25902Rhodell260
- 25904Pax559
- 25907Prince283
- 25908Coal City130
- 25909Prosperity836
- 25911Raleigh160
- 25913Glen Fork137
- 25915Rhodell252
- 25916Glen Fork200
- 25917Kincaid1,255
- 25918Shady Spring4,844
- 25920Lester330
- 25921Sophia1,989
- 25922Athens63
- 25928Corinne803
- 25932Lester167
- 25936Thurmond5
- 25938Hico1,739
- 25942Cunard32
- 25951Hinton4,904
- 25958Rainelle483
- 25962Rainelle3,302
- 25966Meadow Bridge95
- 25969Ghent1,826
- 25971Athens1,438
- 25972Quinwood352
- 25976Meadow Bridge2,469
- 25977Meadow Bridge50
- 25978Hinton534
- 25979Athens541
- 25981Quinwood842
- 25984Rupert2,014
- 25985Hinton366
- 25986Meadow Bridge257
- 25989Shady Spring471
- 26003Wheeling39,982
- 26030Beech Bottom443
- 26031Benwood1,770
- 26032Bethany1,061
- 26033Cameron1,801
- 26034Chester4,664
- 26035Colliers2,491
- 26036Triadelphia712
- 26037Follansbee5,714
- 26038McMechen2,752
- 26039Cameron493
- 26040McMechen1,899
- 26041Moundsville15,254
- 26047New Cumberland5,357
- 26050Newell1,357
- 26055New Martinsville1,139
- 26056New Cumberland233
- 26058Windsor Heights17
- 26059Triadelphia2,888
- 26060Valley Grove1,655
- 26062Weirton20,578
- 26070Wellsburg7,741
- 26074West Liberty1,391
- 26075Windsor Heights519
- 26101Lubeck28,005
- 26104North Hills16,805
- 26105Vienna12,107
- 26133Lubeck1,210
- 26134Belmont902
- 26136Grantsville307
- 26137Grantsville818
- 26138Grantsville58
- 26141Grantsville356
- 26142Kanawha2,262
- 26143Elizabeth3,363
- 26146Friendly1,215
- 26147Grantsville2,089
- 26148164
- 26149Middlebourne2,314
- 26150Mineralwells5,869
- 26151Grantsville572
- 26155Reader8,003
- 26159Paden City2,446
- 26160Elizabeth1,163
- 26161Cairo415
- 26164Ravenswood7,435
- 26167Reader474
- 26169Mineralwells726
- 26170St. Marys5,701
- 26175Sistersville2,991
- 26178Auburn184
- 26180Kanawha2,106
- 26181Washington6,167
- 26184Waverly2,352
- 26187Boaz6,060
- 26201Buckhannon18,689
- 26202Fenwick457
- 26203312
- 26205Craigsville2,957
- 262062,807
- 26208Camden-on-Gauley893
- 2620963
- 26210Adrian124
- 26215Rock Cave166
- 26217283
- 26218Rock Cave2,883
- 26222309
- 26224311
- 26228Rock Cave42
- 2623037
- 26234Rock Cave1,045
- 2623619
- 26237Adrian579
- 26238Century1,107
- 26241Elkins14,102
- 26250Belington5,322
- 26253Dailey2,589
- 26254Harman137
- 26257Norton820
- 26259Dailey113
- 26260Davis1,194
- 26261Richwood2,760
- 26263Harman206
- 26264Durbin618
- 26266Cowen217
- 26267Norton650
- 26268East Dailey34
- 26269Parsons843
- 26270Harman934
- 26271Harman299
- 26273Huttonsville1,964
- 26275Junior520
- 26276Parsons797
- 26278Womelsdorf622
- 26280Huttonsville1,390
- 26282Valley Head205
- 26283Montrose1,410
- 26285Womelsdorf261
- 26287St. George3,034
- 26288Bergoo3,148
- 26289Harman11
- 26291Valley Head12
- 26292Thomas789
- 26293Valley Bend661
- 26294Valley Head744
- 26298Bergoo20
- 26301Clarksburg28,716
- 26320West Union723
- 26321Auburn344
- 26323Anmoore382
- 26325Auburn221
- 26327Pullman51
- 26330Bridgeport15,600
- 26335Burnsville1,149
- 26337Cairo806
- 26338518
- 26339Smithfield223
- 26342Auburn483
- 26343Rock Cave419
- 26346Ellenboro675
- 26347Flemington2,807
- 26348Smithfield184
- 26349Galloway157
- 26351Glenville4,440
- 26354Grafton9,558
- 26361Gypsy102
- 26362Harrisville3,270
- 26366Lumberport13
- 26369Hepzibah387
- 26372Hinkleville635
- 26374Arthurdale1,676
- 26376Rock Cave487
- 26377Jacksonburg654
- 26378Jane Lew4,778
- 26384Sand Fork201
- 26385Lost Creek2,870
- 26386Lumberport2,243
- 26404Spelter113
- 26405803
- 26408Lost Creek2,043
- 26410Newburg577
- 26411West Union554
- 26412Burnsville767
- 26415Pennsboro3,308
- 26416Philippi7,693
- 26419Pine Grove758
- 26421Pullman198
- 26422Reynoldsville94
- 26424Flemington290
- 26425Rowlesburg999
- 26426Salem7,575
- 26430Sand Fork216
- 26431Shinnston6,271
- 26435Flemington87
- 26436West Union310
- 26437Smithfield502
- 26438Spelter87
- 26440Grafton1,046
- 26443Auburn450
- 26444Tunnelton3,490
- 26447Weston1,174
- 26448Wallace1,005
- 26451West Milford591
- 26452Weston9,220
- 26456West Union2,998
- 26463Enterprise246
- 26501Granville19,529
- 26505Morgantown37,492
- 26506Morgantown1,476
- 26508Brookhaven40,231
- 26519Albright2,363
- 26520Arthurdale483
- 26521Blacksville113
- 26524Masontown77
- 26525Bruceton Mills8,630
- 26534Granville792
- 26537Kingwood5,276
- 26541Cassville3,254
- 26542Masontown2,067
- 26546Granville341
- 26547Reedsville2,828
- 26554Fairmont42,118
- 26559Barrackville1,619
- 26560Baxter153
- 26562Hundred721
- 26563Carolina261
- 26568Enterprise650
- 26570Fairview3,350
- 26571Farmington1,788
- 26572Carolina114
- 26574Grant Town506
- 26575Hundred523
- 26576Idamay634
- 26581Littleton870
- 26582Mannington3,743
- 26585Hundred977
- 26586Rivesville58
- 26587Rachel98
- 26588Grant Town2,635
- 26590Blacksville550
- 26591Worthington1,568
- 26601Sutton4,121
- 26610Birch River723
- 26611Sand Fork69
- 26615Burnsville115
- 26617Birch River763
- 26619Flatwoods695
- 26621Flatwoods744
- 26623Gassaway1,425
- 26624Gassaway2,219
- 26627Flatwoods357
- 26629Birch River257
- 26631Burnsville214
- 26636288
- 2663889
- 26651Summersville9,067
- 26656Dixie414
- 26660Craigsville449
- 26662Summersville743
- 26667Hico136
- 26671Summersville459
- 26676Nettie126
- 26678Hico1,427
- 26679Nettie1,628
- 26680Hico307
- 26681Nettie871
- 26684Hico275
- 26690Ansted824
- 26691Tioga741
- 26704Capon Bridge5,148
- 26705Aurora716
- 26707Bayard299
- 26710Burlington1,912
- 26711Capon Bridge2,724
- 26714Wardensville441
- 26716Aurora944
- 26717Elk Garden1,593
- 26719Fort Ashby2,082
- 26720Bayard54
- 26722Green Spring496
- 26726Keyser12,629
- 26731Moorefield276
- 26739Bayard702
- 26743Elk Garden2,216
- 26750Piedmont759
- 26753Wiley Ford5,960
- 26755607
- 26757Romney7,029
- 26761Romney425
- 26763Springfield1,253
- 26764Terra Alta4,175
- 26767Wiley Ford393
- 26801Moorefield1,517
- 26802Brandywine893
- 26804530
- 26807Franklin2,228
- 26808Wardensville903
- 26810319
- 268121,525
- 26814440
- 26815539
- 26817Capon Bridge425
- 26818Moorefield1,616
- 26823Wardensville109
- 26833Petersburg2,890
- 26836Moorefield5,625
- 26845Moorefield1,015
- 26847Petersburg5,305
- 26851Wardensville1,870
- 26852Burlington1,029
- 26855Petersburg633
- 26865Capon Bridge218
- 26866989
- 26884Harman204
- 26886Harman158
School districts
Each of the 55 with people in it, from ACS 2020–2024 5-year estimates.
- Barbour County School District15,424
- Berkeley County School District129,514
- Boone County School District21,026
- Braxton County School District12,208
- Brooke County School District21,805
- Cabell County School District92,739
- Calhoun County School District6,048
- Clay County School District7,835
- Doddridge County School District7,711
- Fayette County School District39,519
- Gilmer County School District7,288
- Grant County School District10,983
- Greenbrier County School District32,386
- Hampshire County School District23,465
- Hancock County School District28,431
- Hardy County School District14,243
- Harrison County School District64,984
- Jackson County School District27,705
- Jefferson County School District59,260
- Kanawha County School District176,537
- Lewis County School District16,740
- Lincoln County School District19,902
- Logan County School District31,418
- Marion County School District55,909
- Marshall County School District29,865
- Mason County School District25,043
- McDowell County School District17,943
- Mercer County School District58,563
- Mineral County School District26,854
- Mingo County School District22,542
- Monongalia School District107,163
- Monroe County School District12,386
- Morgan County School District17,426
- Nicholas County School District24,277
- Ohio County School District41,582
- Pendleton County School District6,043
- Pleasants County School District7,521
- Pocahontas County School District7,784
- Preston County School District34,160
- Putnam County School District57,177
- Raleigh County School District73,195
- Randolph County School District27,576
- Ritchie County School District8,286
- Roane County School District13,786
- Summers County School District11,729
- Taylor County School District16,487
- Tucker County School District6,654
- Tyler County School District8,064
- Upshur County School District23,712
- Wayne County School District38,164
- Webster County School District8,144
- Wetzel County School District14,078
- Wirt County School District5,053
- Wood County School District83,407
- Wyoming County School District20,629
Congressional districts
As drawn for the 119th Congress (2025–2027).
- Congressional District 1877,069
- Congressional District 2901,304
State senate districts
The upper chamber’s districts, as drawn in 2024.
- State Senate District 1100,252
- State Senate District 2102,774
- State Senate District 3104,267
- State Senate District 4103,635
- State Senate District 5105,629
- State Senate District 6106,746
- State Senate District 797,984
- State Senate District 897,274
- State Senate District 9107,630
- State Senate District 10106,491
- State Senate District 11100,891
- State Senate District 12103,697
- State Senate District 13111,582
- State Senate District 14100,744
- State Senate District 15114,430
- State Senate District 16115,235
- State Senate District 1799,112
Delegate districts
The lower chamber’s districts, as drawn in 2024.
- Delegate District 119,027
- Delegate District 217,819
- Delegate District 318,069
- Delegate District 418,817
- Delegate District 518,086
- Delegate District 619,079
- Delegate District 717,054
- Delegate District 818,329
- Delegate District 918,051
- Delegate District 1016,996
- Delegate District 1116,367
- Delegate District 1217,768
- Delegate District 1317,123
- Delegate District 1416,706
- Delegate District 1517,286
- Delegate District 1618,603
- Delegate District 1717,997
- Delegate District 1817,205
- Delegate District 1918,285
- Delegate District 2017,619
- Delegate District 2120,216
- Delegate District 2215,887
- Delegate District 2316,481
- Delegate District 2416,125
- Delegate District 2518,970
- Delegate District 2618,295
- Delegate District 2717,620
- Delegate District 2817,470
- Delegate District 2915,782
- Delegate District 3018,623
- Delegate District 3118,344
- Delegate District 3217,531
- Delegate District 3317,848
- Delegate District 3416,857
- Delegate District 3517,447
- Delegate District 3617,901
- Delegate District 3717,273
- Delegate District 3819,795
- Delegate District 3917,446
- Delegate District 4017,950
- Delegate District 4120,651
- Delegate District 4217,003
- Delegate District 4317,515
- Delegate District 4418,287
- Delegate District 4517,831
- Delegate District 4617,746
- Delegate District 4717,456
- Delegate District 4816,403
- Delegate District 4917,491
- Delegate District 5016,429
- Delegate District 5117,187
- Delegate District 5218,059
- Delegate District 5317,991
- Delegate District 5416,628
- Delegate District 5518,459
- Delegate District 5618,107
- Delegate District 5718,197
- Delegate District 5817,615
- Delegate District 5916,321
- Delegate District 6017,998
- Delegate District 6118,105
- Delegate District 6216,913
- Delegate District 6316,466
- Delegate District 6417,958
- Delegate District 6517,707
- Delegate District 6617,172
- Delegate District 6717,758
- Delegate District 6818,952
- Delegate District 6916,164
- Delegate District 7017,826
- Delegate District 7117,316
- Delegate District 7217,883
- Delegate District 7317,951
- Delegate District 7418,484
- Delegate District 7516,969
- Delegate District 7618,992
- Delegate District 7716,158
- Delegate District 7819,719
- Delegate District 7918,529
- Delegate District 8017,445
- Delegate District 8115,807
- Delegate District 8219,571
- Delegate District 8317,625
- Delegate District 8416,535
- Delegate District 8517,637
- Delegate District 8616,691
- Delegate District 8717,035
- Delegate District 8817,517
- Delegate District 8919,047
- Delegate District 9019,561
- Delegate District 9118,334
- Delegate District 9218,682
- Delegate District 9317,771
- Delegate District 9418,669
- Delegate District 9518,478
- Delegate District 9619,355
- Delegate District 9718,938
- Delegate District 9817,499
- Delegate District 9918,832
- Delegate District 10016,801
PUMAs
Public Use Microdata Areas: areas of 100,000 people or more that the state draws from census tracts, for the Census Bureau’s microdata.
- Berkeley, Jefferson Counties PUMA188,774
- Cabell, Putnam, Mason Counties PUMA174,959
- Harrison, Randolph, Upshur, Lewis, Taylor, Barbour Counties PUMA164,923
- Jackson, Nicholas, Roane, Braxton, Clay, Gilmer, Calhoun Counties PUMA99,147
- Kanawha County PUMA176,537
- Mercer, Greenbrier, Monroe, Summers, Webster, Pocahontas Counties PUMA130,992
- Mineral, Hampshire, Morgan, Hardy, Grant, Tucker, Pendleton Counties PUMA105,668
- Monongalia, Marion, Preston Counties PUMA197,232
- Ohio, Marshall, Hancock, Brooke Counties PUMA121,683
- Raleigh, Fayette Counties PUMA112,714
- Wayne, Logan, Mingo, Boone, Wyoming, Lincoln, McDowell Counties PUMA171,624
- Wood, Wetzel, Ritchie, Tyler, Doddridge, Pleasants, Wirt Counties PUMA134,120
Urban areas
Each that reaches into West Virginia, with its whole population. Urban areas are the densely settled land the Census Bureau draws after each census, whatever the city lines.
- Beckley, WV55,081
- Bluefield, WV–VA41,767
- Buckhannon, WV8,141
- Charleston, WV137,679
- Clarksburg, WV32,878
- Cumberland, MD–WV–PA45,480
- East Liverpool, OH–WV–PA21,457
- Elkins, WV10,652
- Fairmont, WV32,802
- Grafton, WV4,618
- Hagerstown, MD–WV–PA–VA201,864
- Huntington, WV–KY–OH198,914
- Keyser, WV–MD5,661
- Lewisburg, WV7,414
- Logan, WV9,425
- Louisa, KY–WV4,646
- Marietta, OH–WV20,925
- Middleport, OH–WV5,586
- Morgantown, WV79,854
- Moundsville, WV11,517
- New Martinsville, WV–OH5,465
- Parkersburg, WV–OH62,663
- Point Pleasant–Gallipolis, WV–OH10,004
- Ranson–Charles Town, WV23,519
- Shinnston, WV4,552
- Steubenville–Weirton, OH–WV–PA63,495
- Weston, WV4,085
- Wheeling, WV–OH56,697
Turn West Virginia into your planning report.
Social Explorer Studio builds an editable profile of any place, with tables and charts beside the county and state, and exports to Word, PDF and Excel.
Questions about West Virginia
What is the population of West Virginia?
1,766,147 people, according to the ACS 2025 1-year estimates, which the Census Bureau adjusts to match its own population estimate. That’s the 39th largest of the 50 states and DC.
What is the FIPS code for West Virginia?
54. Every county’s and place’s FIPS code in West Virginia starts with it. The Census Bureau’s full geographic identifier (GEOID) is 0400000US54.
What is the largest city in West Virginia?
Charleston, with 47,421 people. Other large cities here include Huntington, Morgantown and Parkersburg.
What is the median household income in West Virginia?
$61,340 (±$1,301), according to the ACS 2025 1-year estimates, lower than the US ($84,780).
What is the median age in West Virginia?
43.5 years (±0.3), according to the ACS 2025 1-year estimates, higher than the US (39.5).
How much does housing cost in West Virginia?
West Virginia’s median home value is $176,300 (±$4,940) and its median gross rent is $921 (±$22) a month, according to the ACS 2025 1-year estimates. 40.9% (±2.4%) of its renters pay 30% or more of their income on rent.
Is West Virginia growing?
West Virginia’s population fell 4.2%, from 1,844,128 in 2015 to 1,766,147 in 2025, according to the ACS 1-year estimates.
Where do people who work in West Virginia live?
589,080 of its 679,557 jobs are held by people who live here. Of those who commute in, the most come from Ohio, Pennsylvania, Virginia.
Where does this census data come from?
The U.S. Census Bureau’s American Community Survey, through Social Explorer’s tables: the latest 1-year estimates where they exist, for the most recent numbers, and 5-year estimates otherwise. Each table lists its code, so you can find it again.
Is this data free to use?
Yes. You can read it, cite it, download the CSV and embed the charts, with no account. To map other variables, compare your own areas or build a report, see Social Explorer’s plans in a live demo.
Sources and how to cite
American Community Survey 2025 1-year estimates, or 2020–2024 5-year estimates where noted, U.S. Census Bureau, from Social Explorer’s tables A00001, A00002, A01004, A04001, A06001, A08001, A09005, A10001, A10003, A10008, A10030, A10036, A10040, A10047, A10055, A10060, A12001, A13004, A14006, A14024, A14028, A16002, A17005, A18002, A18009, A20001, B02002, B09001, B13002, B18101, C16001. Maps by census tract use 2020–2024 5-year estimates, since the 1-year survey doesn’t cover tracts. Commuting: LEHD LODES 2023. These are estimates from a sample, each with its margin of error. Data retrieved November 14, 2026. How these profiles are made.
U.S. Census Bureau, American Community Survey 2025 1-year estimates, or 2020–2024 5-year estimates where noted, via Social Explorer. “West Virginia.” https://www.socialexplorer.com/places/west-virginia. Accessed November 14, 2026.