

Show how a place has changed with historical census data
Historical census data shows how a place’s population, income, housing and more have changed over the decades. Social Explorer makes the years comparable, so the change you present is real and not an artifact of shifting boundaries.
How do you show how a place has changed?
-
1
Pick a place and a question
Choose any geography down to the census tract, and an indicator such as income, race and ethnicity, housing costs, education or age.
-
2
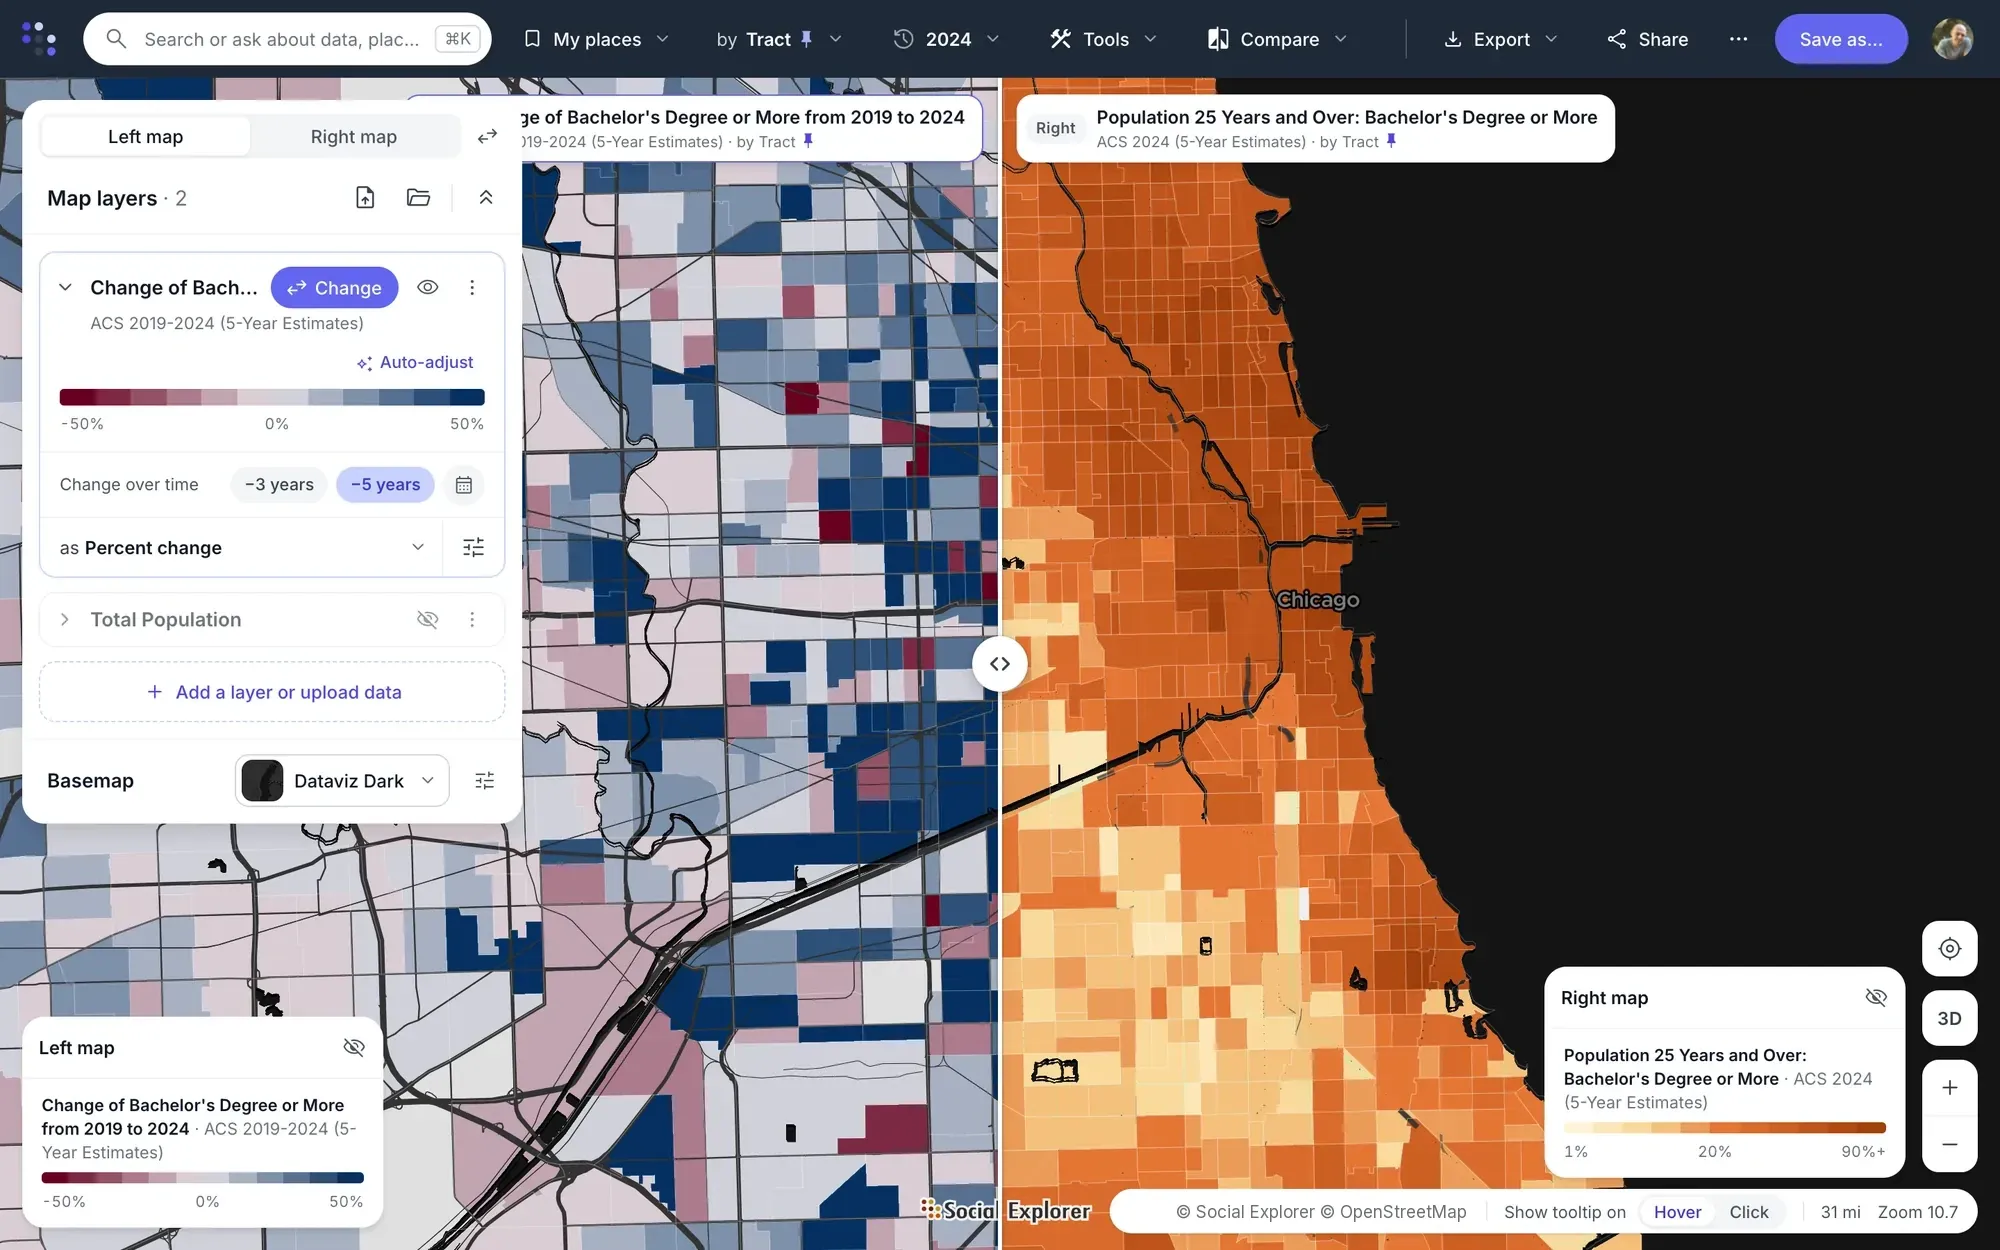
Swipe map
Put two years of the same variable on one screen and drag the divider between them.
-
3
Change over time map
Shade areas by percent change, or show the actual difference with bubbles colored by direction, between two supported years.
-
4
Change over time in reports
Compare up to three years in one report, with dollar values adjusted for inflation.
-
5
The long view
Go back to 1790 with decennial data, use change-over-time data from 1970 to the present, and use compatibility sets for historical small-area analysis.
-
6
Stories and embeds
Share the comparison as an interactive story or embed it on your site.
The data behind it
Part of a library of 610,000+ variables, each one with its source.
- Decennial Census 1790 to 2020, with historical compatibility sets
-
Change-over-time data 1970 to the present
- American Community Survey, 5-year estimates 2010 to 2020, for change by tract
- EASI Market Profile data Commercial estimates for 2010 and 2020–2025, with projections to 2030
Good to know
- Comparisons are two years side by side or as a swipe, or up to three years in a report. There are no animations or time sliders.
- Social Explorer shows how a community changed, not what caused it, so it doesn’t measure a program’s impact. You can pair your service areas with before-and-after data about the community.


Questions about historical census data
What is historical census data?
Historical census data is what earlier censuses recorded about a place: its population, households, housing and work, decade by decade back to 1790. Comparing it over time is harder than it looks, because boundaries and questions change, so Social Explorer also has earlier censuses reallocated to fixed boundaries for comparing tracts.
Can I compare the same census tracts across decades?
Yes. Censuses from 1970 to 2000 are also available on 2010 tract boundaries, and change-over-time data runs from 1970 to the present, so you can compare the same tracts across decades. For earlier years, compatibility sets for 1940 and 1950 support county and tract analysis.
Can I find my ancestors in historical census data?
Not in Social Explorer: it has statistics about places, not records about people. Census records that name individuals stay private for 72 years, then the National Archives releases them, and genealogy sites index them. Social Explorer can show what the places your family lived in were like at the time.
Can Social Explorer show whether a program caused a change?
No. Social Explorer shows how a community changed, not what caused it, so it doesn’t measure a program’s impact. You can pair your service areas with before-and-after data about the community, and present the change as a swipe map, a change-over-time map or a report of up to three years.
Other solutions
- Site selection Compare candidate areas on the demographics that drive your business.
- Market analysis Trade area analysis: size a market and track how it is changing.
- Community needs & grants Build citable evidence of need for a grant or program.
- Data storytelling Turn a question into an interactive map or story.
- Equity analysis See which communities carry the heaviest burdens.
- Planning & policy Understand who lives where and how that is changing.
- Census data Every census since 1790 and the latest American Community Survey, ready to map and analyze.
Try it on a place you know
In a live demo, we’ll show you how it fits your team or campus.