

Plans that match the people they serve
Planning and policy analysis starts with who lives where and how that is changing. Social Explorer shows it at the geography your plan works in, whether you are planning housing, schools, transit or services.
How do you analyze a population for a plan?
-
1
Change geography level
Lock the map to tracts, block groups or blocks across a whole jurisdiction at any zoom, or work by school district, place, county subdivision, PUMA, metro area or congressional district.
-
2
Change over time
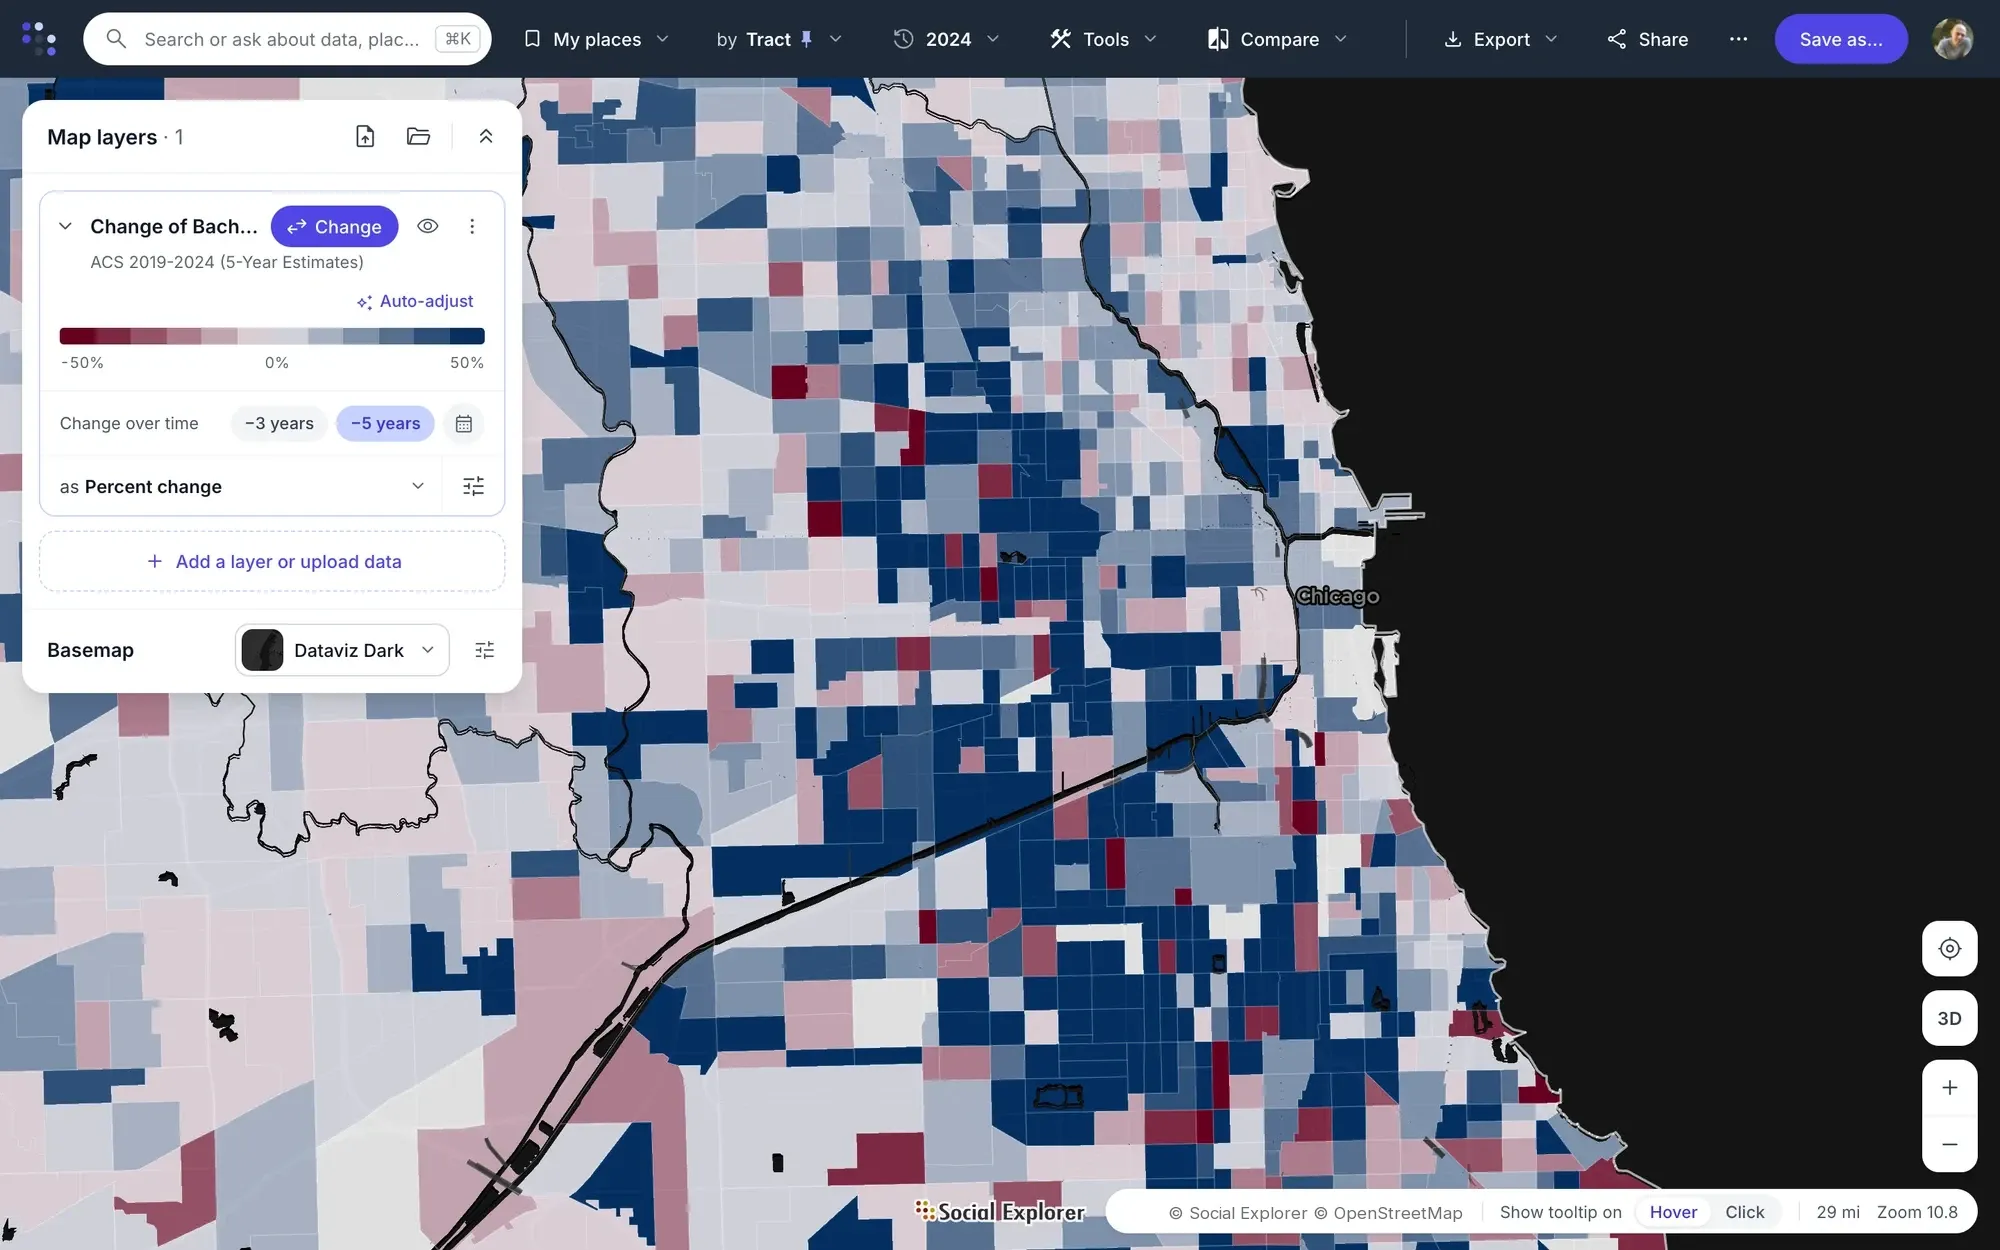
Compare up to three years in a report, or map percent or actual change.
-
3
Historical data
Use census data back to 1790, with 1940 and 1950 compatibility sets for county and tract analysis.
-
4
Filters and selections
Filter areas by criteria to apply policy thresholds. Use the selection toolbox for precise selections, such as the tracts inside a city, by touching, enclosed or centroid.
-
5
Exports and Geodata Library
Export with program files for SAS, SPSS and Stata, or download shapefiles of US boundaries from 1790 to 2019, based on TIGER/Line and clipped to the coastline.
-
6
Stories
Publish your findings as an interactive story residents can open without an account.
The data behind it
Part of a library of 610,000+ variables, each one with its source.
- Decennial Census 1790 to 2020
- American Community Survey, 5-year estimates At every published geography
-
School districts Unified, secondary and elementary
- County Health Rankings Health outcomes and factors by county
-
Geodata Library Historical boundary files
Good to know
- Social Explorer helps you understand and document a population. It doesn’t model growth, run scenarios or forecast.
Tools for this work



Questions about planning and policy analysis
Which geographies can I analyze?
Social Explorer locks the map to census tracts, block groups or blocks across a whole jurisdiction, or works by school district, place, county subdivision, PUMA, metro area or congressional district. Reports can mix levels, such as a county, its places and specific tracts, so each geography a plan uses sits side by side.
Can I compare a place across decades?
Yes. Social Explorer has census data back to 1790, with 1940 and 1950 compatibility sets for county and tract analysis, and reports compare up to three years at a time. Maps show percent or actual change between two years, so a plan can show how its population got where it is.
Can I take the data into SAS, SPSS, Stata or GIS?
Yes. Reports export with program files for SAS, SPSS and Stata, as well as to Excel and CSV. For GIS work, the Geodata Library has shapefiles of US boundaries from 1790 to 2019, based on TIGER/Line and clipped to the coastline, so historical data can be mapped on the boundaries it was published for.
Does Social Explorer forecast population growth?
No. Social Explorer helps you understand and document a population: who lives where, how that has changed and how it compares. It doesn’t model growth, run scenarios or forecast. For a look ahead, EASI’s commercial projections to 2030 are in the data library, labeled as modeled projections rather than counts.
Other solutions
- Site selection Compare candidate areas on the demographics that drive your business.
- Market analysis Trade area analysis: size a market and track how it is changing.
- Community needs & grants Build citable evidence of need for a grant or program.
- Data storytelling Turn a question into an interactive map or story.
- Equity analysis See which communities carry the heaviest burdens.
- Community change Show how a place has changed, with comparable data across decades.
- Census data Every census since 1790 and the latest American Community Survey, ready to map and analyze.
Try it on a place you know
In a live demo, we’ll show you how it fits your team or campus.