

Pennsylvania: Population, demographics and census data
Home to 13,059,432 people, the 5th largest of the 50 states and DC, anchored by Philadelphia. It grew 2.0% between 2015 and 2025.
- Population
- 13.06M. Census Bureau estimate · Rank 5 of the 50 states and DC
- Median household income
- $81,473 ±$603. US $84,780
- Median age
- 41.4 ±0.1. US 39.5
ACS 2025 1-year estimates, U.S. Census Bureau
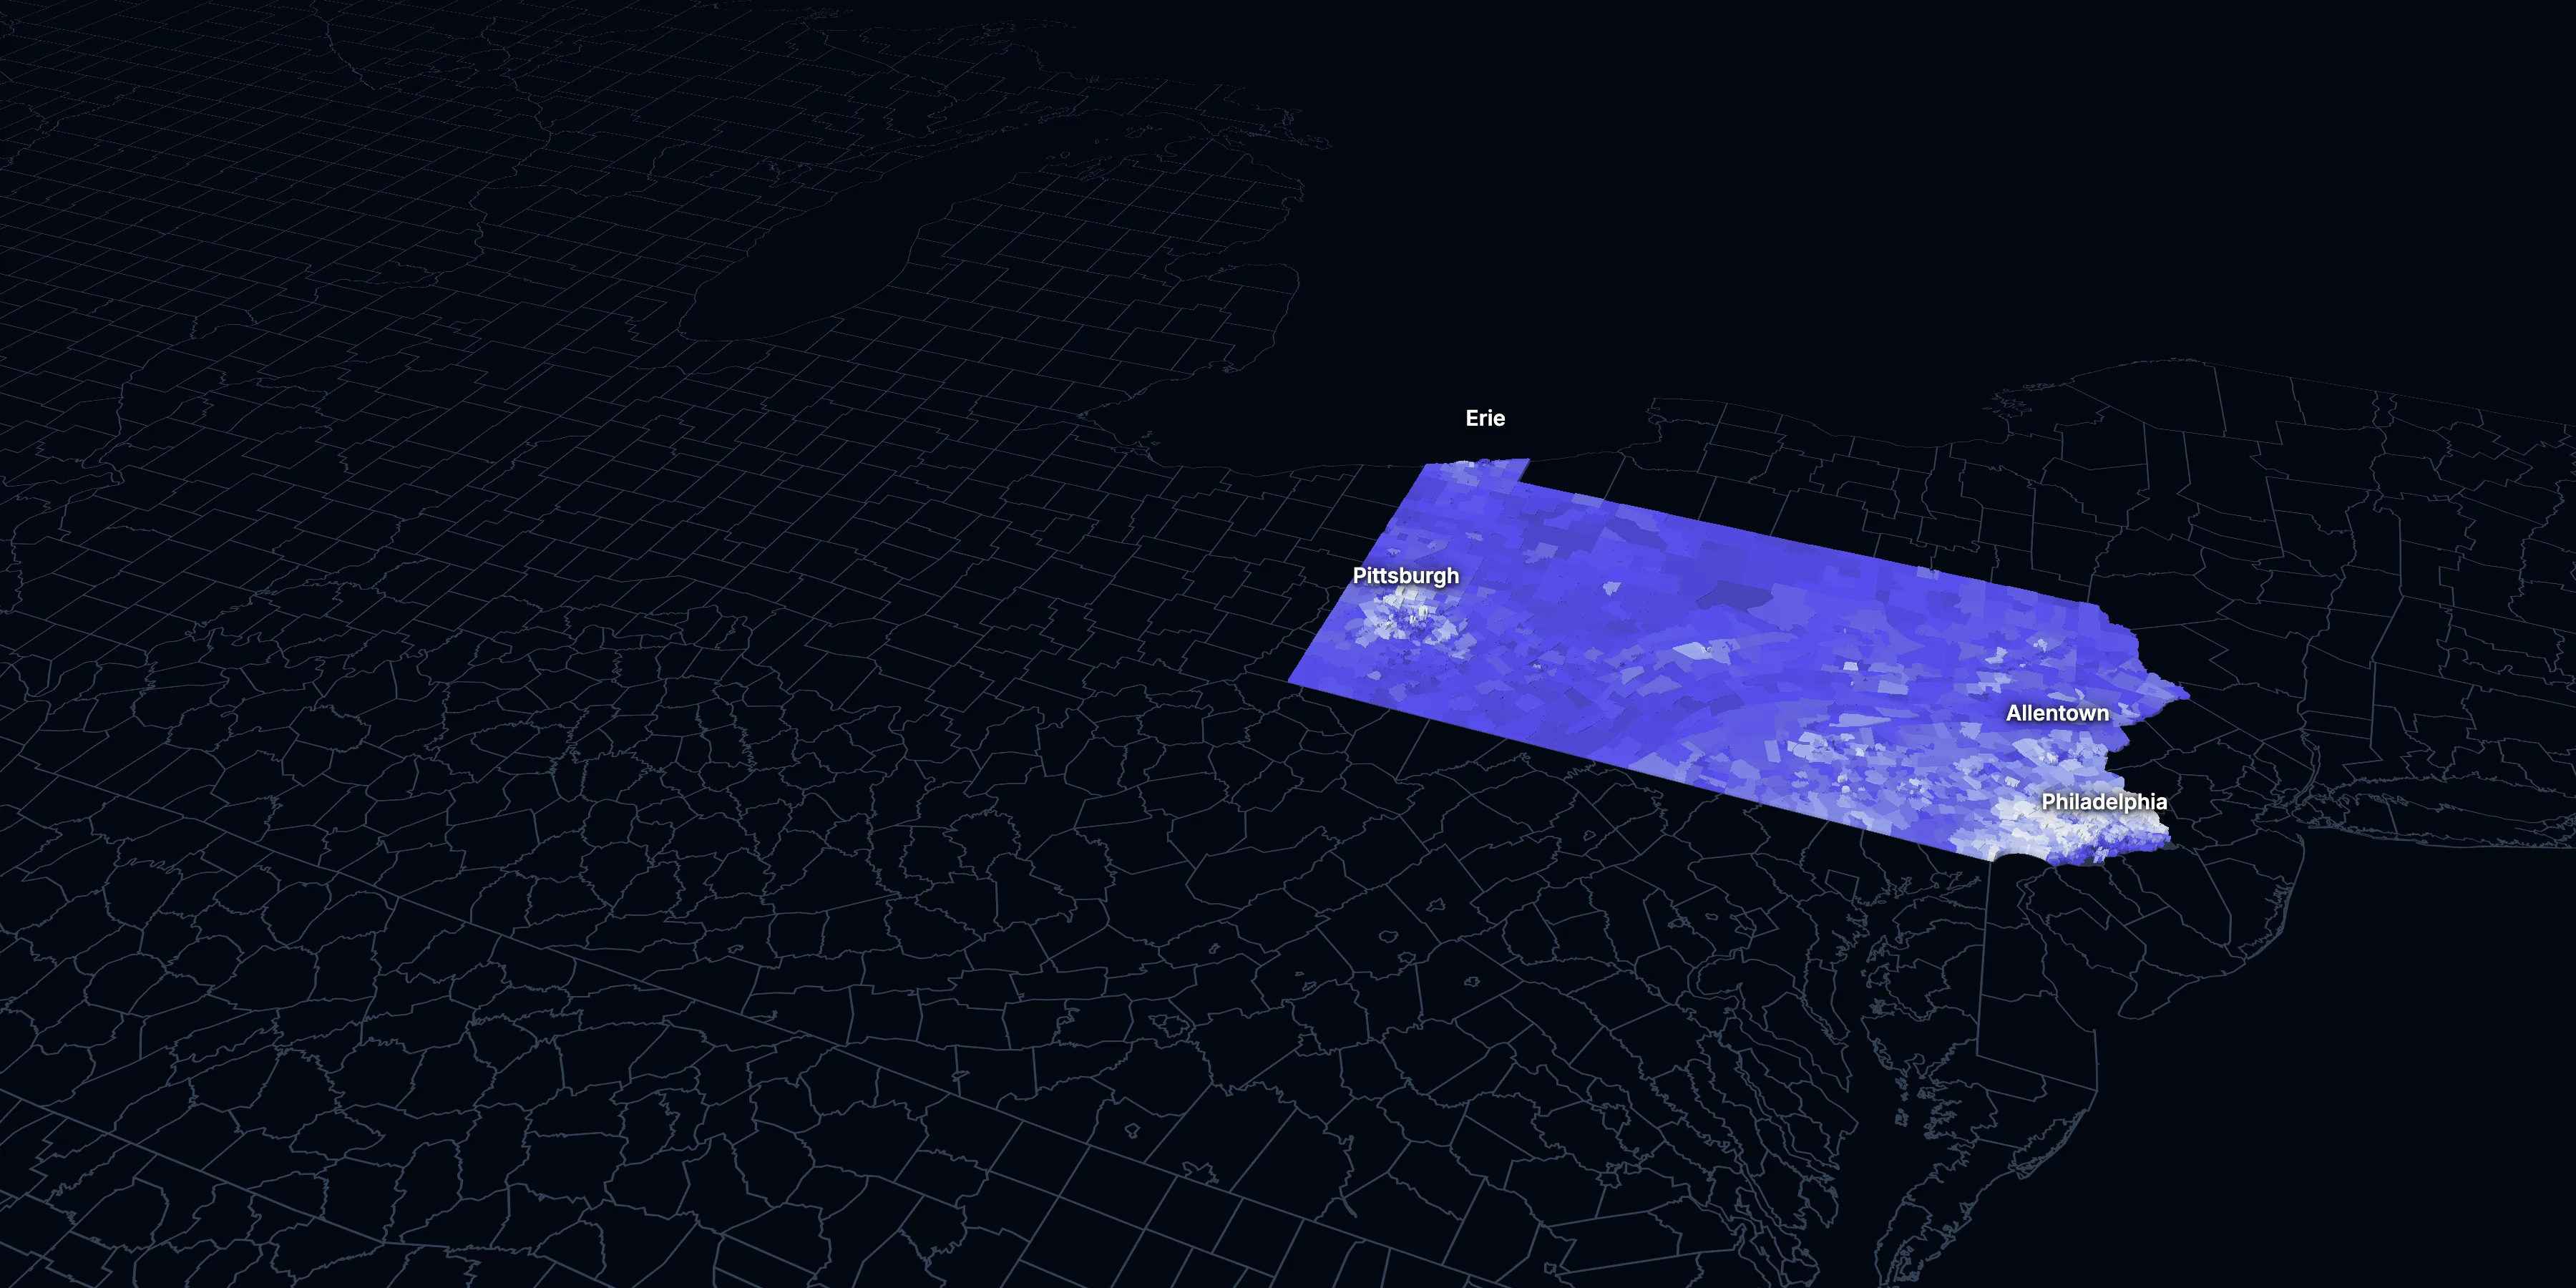
Taller, lighter tracts have higher household incomes
About Pennsylvania
Pennsylvania’s median household income is $81,473 (±$603), lower than the US ($84,780), and its median age is 41.4 (±0.1), according to the ACS 2025 1-year estimates. Its largest city is Philadelphia.
± is each figure’s margin of error, at 90% confidence, and † marks one too uncertain to lean on. Under each percentage in the tables is the number it counts. How the margins are worked out.
FIPS code 42
Highlights
What stands out in Pennsylvania
The numbers where Pennsylvania sits furthest from the nation, or past a recognized policy benchmark.
Past a policy benchmark
43.2%
Very highHomes built before 1960
That’s higher than the US (24.0%). Older homes carry more lead-paint risk: the EPA found lead paint in 69% of homes built from 1940 to 1959. It’s the 5th highest of the 50 states and DC.
+5 points
ElevatedRent growth ahead of income
After inflation, rent grew 12% from 2015 to 2025, and household income 7%. The dots show rent growth.
Furthest from the national picture
21.5%
Higher than the US65 and over
That’s higher than the US (19.0%).
2.33
Lower than the USPeople per household
That’s lower than the US (2.49).
8.4%
Lower than the USBorn outside the US
That’s lower than the US (14.7%).
13.3%
Lower than the USSpeak a language other than English at home
That’s lower than the US (22.9%).
2015 to 2025
How Pennsylvania changed in ten years
The state added 256,929 people. It got older, more foreign-born and better educated, and poverty fell 1.9 points.
Population, change since 2015
+2.0% in the state and +6.3% in the US.
Source: ACS 1-year, 2015 to 2025, table A00001.
Show data
| Pennsylvania | United States | |
|---|---|---|
| 2015 | 0.0% | 0.0% |
| 2016 | −0.1% | +0.5% |
| 2017 | +0.0% | +1.3% |
| 2018 | +0.0% | +1.8% |
| 2019 | −0.0% | +2.1% |
| 2021 | +1.3% | +3.3% |
| 2022 | +1.3% | +3.7% |
| 2023 | +1.2% | +4.2% |
| 2024 | +2.2% | +5.8% |
| 2025 | +2.0% | +6.3% |
Embed
Median household income, in 2025 dollars
+6.8% in the state and +10.9% in the US.
Source: ACS 1-year, 2015 to 2025, table A14006.
Show data
| Pennsylvania | United States | |
|---|---|---|
| 2015 | $76,313 | $76,413 |
| 2016 | $76,971 | $77,931 |
| 2017 | $78,380 | $79,891 |
| 2018 | $78,725 | $80,059 |
| 2019 | $80,572 | $83,427 |
| 2021 | $82,610 | $83,521 |
| 2022 | $79,535 | $82,811 |
| 2023 | $78,540 | $82,683 |
| 2024 | $80,144 | $84,339 |
| 2025 | $81,473 | $84,780 |
Embed
Living in poverty
−1.9 points in the state and −3.0 points in the US.
Source: ACS 1-year, 2015 to 2025, table A13004.
Show data
| Pennsylvania | United States | |
|---|---|---|
| 2015 | 13.2% | 14.7% |
| 2016 | 12.9% | 14.0% |
| 2017 | 12.5% | 13.4% |
| 2018 | 12.2% | 13.1% |
| 2019 | 12.0% | 12.3% |
| 2021 | 12.1% | 12.8% |
| 2022 | 11.8% | 12.6% |
| 2023 | 12.0% | 12.5% |
| 2024 | 11.6% | 12.1% |
| 2025 | 11.2% | 11.8% |
Embed
Bachelor’s degree or more
+7.4 points in the state and +6.7 points in the US.
Source: ACS 1-year, 2015 to 2025, table A12001.
Show data
| Pennsylvania | United States | |
|---|---|---|
| 2015 | 29.7% | 30.6% |
| 2016 | 30.8% | 31.3% |
| 2017 | 31.4% | 32.0% |
| 2018 | 31.8% | 32.6% |
| 2019 | 32.3% | 33.1% |
| 2021 | 34.5% | 35.0% |
| 2022 | 35.1% | 35.7% |
| 2023 | 35.3% | 36.2% |
| 2024 | 36.4% | 36.8% |
| 2025 | 37.1% | 37.4% |
Embed
Median gross rent, in 2025 dollars
+11.8% in the state and +18.5% in the US.
Source: ACS 1-year, 2015 to 2025, table A18009.
Show data
| Pennsylvania | United States | |
|---|---|---|
| 2015 | $1,189 | $1,314 |
| 2016 | $1,192 | $1,327 |
| 2017 | $1,182 | $1,340 |
| 2018 | $1,198 | $1,368 |
| 2019 | $1,207 | $1,393 |
| 2021 | $1,241 | $1,427 |
| 2022 | $1,236 | $1,440 |
| 2023 | $1,273 | $1,496 |
| 2024 | $1,294 | $1,537 |
| 2025 | $1,329 | $1,557 |
Embed
Median home value, in 2025 dollars
+25.1% in the state and +39.3% in the US.
Source: ACS 1-year, 2015 to 2025, table A10036.
Show data
| Pennsylvania | United States | |
|---|---|---|
| 2015 | $233,725 | $266,469 |
| 2016 | $235,483 | $277,278 |
| 2017 | $239,927 | $288,124 |
| 2018 | $240,422 | $296,908 |
| 2019 | $244,523 | $305,336 |
| 2021 | $266,314 | $337,116 |
| 2022 | $271,956 | $355,481 |
| 2023 | $276,502 | $361,931 |
| 2024 | $286,903 | $372,685 |
| 2025 | $292,400 | $371,100 |
Embed
ACS 1-year estimates. The dotted stretch of each line spans 2020, when the Census Bureau released no standard 1-year estimates. Dollar values are in 2025 dollars.
| Indicator | 2015 | 2025 | Change |
|---|---|---|---|
| Population | 12,802,503 | 13,059,432 | +2.0% |
| Median age | 40.7 | 41.4 | +0.7 years |
| 65 and over | 17.0% | 21.5% | +4.4 points |
| Born outside the US | 6.5% | 8.4% | +1.9 points |
| Hispanic or Latino | 6.8% | 9.9% | +3.1 points |
| Median household income | $76,313 | $81,473 | +6.8% |
| Living in poverty | 13.2% | 11.2% | −1.9 points |
| Bachelor’s degree or more | 29.7% | 37.1% | +7.4 points |
| Households that rent | 31.3% | 30.8% | −0.4 points |
| Median gross rent | $1,189 | $1,329 | +11.8% |
| Median home value | $233,725 | $292,400 | +25.1% |
3446 census tracts
Pennsylvania, tract by tract
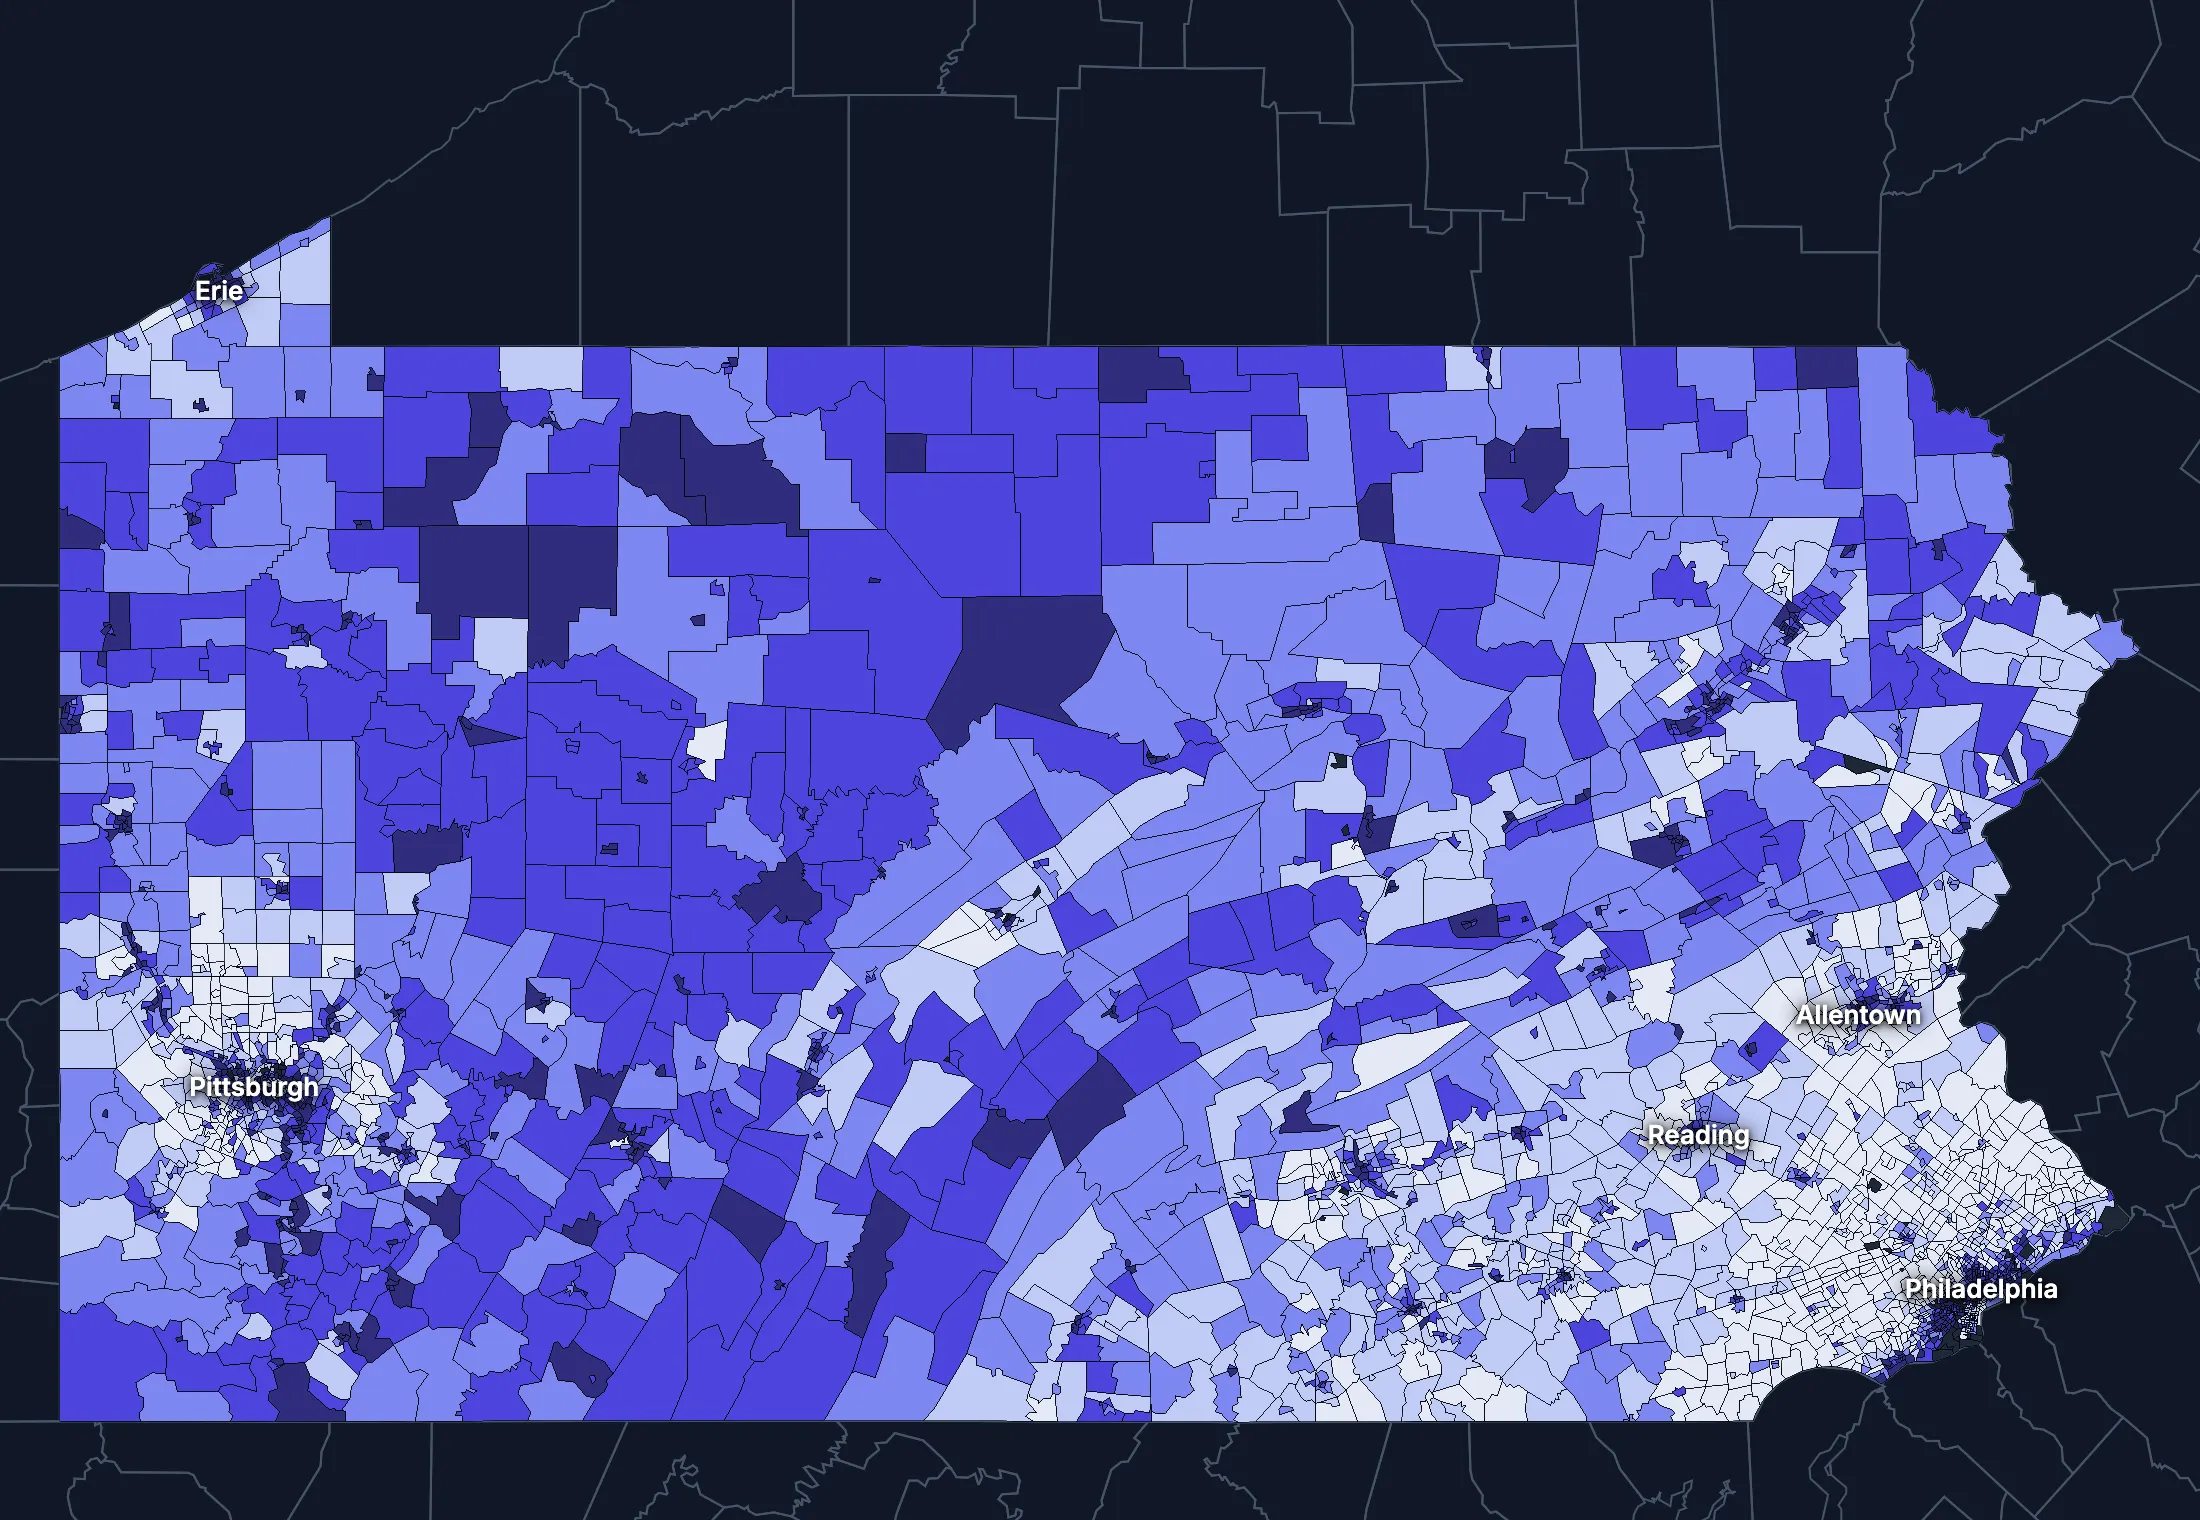
State averages hide a lot. These census tracts are the closest the census comes to neighborhoods.
Where the state’s average misleads
Each tick is one census tract, and the dark line marks the state. Hover over a tick or tap it to see the tract.
Poverty
727 of 3392 tracts are at least 1.5 times the state’s overall 11.7%, and 1123 are at two-thirds of it or less.
Highest: Tract 9801, 100.0%. Lowest: Tract 122, 0.0%.
Renters paying 30% or more of income
233 of 3281 tracts are at least 1.5 times the state’s overall 44.6%, and 808 are at two-thirds of it or less.
Highest: Tract 4069.02, 100.0%. Lowest: Tract 4050, 0.0%.
Adults with a bachelor’s degree
621 of 3401 tracts are at least 1.5 times the state’s overall 35.2%, and 1249 are at two-thirds of it or less.
Highest: Tract 122, 100.0%. Lowest: Tract 9801.01, 2.1%.
Median household income
581 of 3377 tracts are at least 1.5 times the typical tract’s $74,844, and 485 are at two-thirds of it or less.
Highest: Tract 1055.08, $250,000 or more. Lowest: Tract 511, $8,889.
American Community Survey 2020–2024 5-year estimates, by census tract. Income is capped at $250,000+ by the Census Bureau.
People
Who lives in Pennsylvania
Its median age of 41.4 is higher than the US (39.5). 8.4% of residents were born outside the US, and 13.3% speak a language other than English at home.
Age
Source: ACS 2025 1-year, table A01001.
Show data
| Pennsylvania | United States | |
|---|---|---|
| Under 18 | 19.6% ±0.2% , number 2,561,937 ±20,510 | 21.0% ±<0.1% , number 71,689,151 ±111,800 |
| 18 to 24 | 9.0% ±0.1% , number 1,176,127 ±18,220 | 9.3% ±<0.1% , number 31,716,680 ±98,660 |
| 25 to 34 | 12.9% ±0.1% , number 1,679,863 ±8,045 | 13.6% ±<0.1% , number 46,357,354 ±55,690 |
| 35 to 44 | 12.9% ±0.2% , number 1,680,882 ±19,670 | 13.4% ±<0.1% , number 45,746,189 ±105,700 |
| 45 to 54 | 11.4% ±0.1% , number 1,484,196 ±9,024 | 11.8% ±<0.1% , number 40,257,563 ±53,540 |
| 55 to 64 | 12.8% ±0.2% , number 1,671,857 ±20,750 | 12.1% ±<0.1% , number 41,242,904 ±104,700 |
| 65 to 74 | 12.2% ±0.1% , number 1,586,912 ±16,750 | 10.8% ±<0.1% , number 36,895,650 ±91,520 |
| 75 and over | 9.3% ±0.1% , number 1,217,658 ±14,690 | 8.2% ±<0.1% , number 27,879,368 ±78,140 |
Embed
Race and ethnicity
Source: ACS 2025 1-year, table A04001.
Show data
| Pennsylvania | United States | |
|---|---|---|
| White, not Hispanic | 70.6% ±0.1% , number 9,224,783 ±10,130 | 55.0% ±<0.1% , number 187,959,031 ±58,340 |
| Hispanic or Latino | 9.9% ±<0.1% , number 1,294,276 ±1,096 | 20.5% ±<0.1% , number 69,975,516 ±13,270 |
| Black, not Hispanic | 10.1% ±0.1% , number 1,313,785 ±17,240 | 11.7% ±<0.1% , number 40,096,453 ±106,200 |
| Asian, not Hispanic | 4.4% ±0.1% , number 573,030 ±7,971 | 6.5% ±<0.1% , number 22,096,709 ±58,340 |
| Other or multiracial | 5.0% ±0.1% , number 653,558 ±19,540 | 6.3% ±<0.1% , number 21,657,150 ±150,100 |
Embed
Language spoken at home
Source: ACS 2025 1-year, table C16001.
Show data
| Pennsylvania | United States | |
|---|---|---|
| English only | 86.7% ±0.3% , number 10,759,593 ±31,640 | 77.1% ±0.1% , number 249,390,588 ±275,300 |
| Spanish | 5.9% ±0.2% , number 730,452 ±19,170 | 13.9% ±0.1% , number 44,921,985 ±177,800 |
| Other Indo-European | 4.1% ±0.2% , number 509,069 ±22,310 | 4.0% ±<0.1% , number 12,862,980 ±113,500 |
| Asian and Pacific Island | 2.4% ±0.1% , number 297,188 ±16,360 | 3.8% ±<0.1% , number 12,288,841 ±99,740 |
| Arabic and other | 0.9% ±0.1% , number 116,593 ±13,700 | 1.3% ±<0.1% , number 4,116,949 ±71,480 |
Embed
Marital status
Source: ACS 2025 1-year, table A11001.
Show data
| Pennsylvania | United States | |
|---|---|---|
| Now married | 48.0% ±0.3% , number 5,259,581 ±32,950 | 47.9% ±0.1% , number 135,567,564 ±223,300 |
| Never married | 34.7% ±0.2% , number 3,808,479 ±23,540 | 34.8% ±0.1% , number 98,647,238 ±152,600 |
| Divorced | 9.4% ±0.2% , number 1,026,838 ±18,760 | 10.2% ±<0.1% , number 28,879,967 ±112,900 |
| Widowed | 6.3% ±0.1% , number 686,407 ±14,060 | 5.5% ±<0.1% , number 15,599,094 ±69,430 |
| Separated | 1.6% ±0.1% , number 180,826 ±9,790 | 1.6% ±<0.1% , number 4,441,399 ±49,160 |
Embed
Where people lived a year ago
Source: ACS 2025 1-year, table A08001.
Show data
| Pennsylvania | United States | |
|---|---|---|
| Same home | 89.7% ±0.2% , number 11,607,460 ±31,960 | 88.4% ±0.1% , number 298,889,697 ±214,800 |
| Same county | 5.5% ±0.2% , number 710,481 ±28,140 | 6.0% ±<0.1% , number 20,202,671 ±166,300 |
| Another county in the state | 2.6% ±0.1% , number 337,151 ±15,790 | 3.0% ±<0.1% , number 10,168,097 ±89,190 |
| Another state | 1.7% ±0.1% , number 226,055 ±11,570 | 2.1% ±<0.1% , number 7,025,589 ±81,660 |
| Another country | 0.4% ±0.1% , number 53,888 ±8,377 | 0.6% ±<0.1% , number 1,984,943 ±47,210 |
Embed
Top countries of birth, among those born abroad
Source: ACS 2025 1-year, table A07001.
Show data
| Pennsylvania | |
|---|---|
| Dominican Republic | 11.6% , number 127,893 |
| India | 10.9% , number 119,451 |
| China, Excluding Hong Kong and Taiwan | 6.8% , number 74,320 |
| Mexico | 5.6% , number 61,247 |
| Vietnam | 3.9% , number 43,265 |
| Korea | 2.5% , number 27,819 |
Embed
All the numbers
| Indicator | Pennsylvania | US | Rank among states* | Table |
|---|---|---|---|---|
| Population | 13,059,432 | 341,784,859 | 5th | A00001 |
| People per square mile | 292 | 97 | 10th | A00002 |
| Land area (square miles) | 44,742 | – | – | A00002 |
| Median age | 41.4 ±0.1 | 39.5 ±0.1 | 8th | A01004 |
| Under 18 | 19.6% ±0.2% , number 2,561,937 ±20,510 | 21.0% ±<0.1% , number 71,689,151 ±111,800 | 41st | B02002 |
| 65 and over | 21.5% ±0.2% , number 2,804,570 ±22,280 | 19.0% ±<0.1% , number 64,775,018 ±120,300 | 9th | B02002 |
| Born outside the US | 8.4% ±0.2% , number 1,099,599 ±24,510 | 14.7% ±0.1% , number 50,409,320 ±204,800 | 26th | A06001 |
| Speak a language other than English at home | 13.3% ±0.3% , number 1,653,302 ±36,340 | 22.9% ±0.1% , number 74,190,755 ±244,000 | 27th | C16001 |
| Veterans (adults) | 5.6% ±0.1% , number 588,783 ±12,600 | 5.9% ±<0.1% , number 15,746,228 ±85,320 | 39th | A16002 |
| Living with a disability | 14.6% ±0.2% , number 1,875,466 ±24,550 | 13.7% ±<0.1% , number 46,271,455 ±126,000 | 17th | B18101 |
| Women 15–50 who had a baby in the past year | 4.9% ±0.3% , number 144,283 ±8,063 | 5.0% ±0.1% , number 4,016,759 ±44,040 | 36th | B13002 |
| Lived in the same home a year ago | 89.7% ±0.2% , number 11,607,460 ±31,960 | 88.4% ±0.1% , number 298,889,697 ±214,800 | 5th | A08001 |
| White, not Hispanic | 70.6% ±0.1% , number 9,224,783 ±10,130 | 55.0% ±<0.1% , number 187,959,031 ±58,340 | 19th | A04001 |
| Hispanic or Latino | 9.9% ±<0.1% , number 1,294,276 ±1,096 | 20.5% ±<0.1% , number 69,975,516 ±13,270 | 30th | A04001 |
| Black, not Hispanic | 10.1% ±0.1% , number 1,313,785 ±17,240 | 11.7% ±<0.1% , number 40,096,453 ±106,200 | 21st | A04001 |
| Asian, not Hispanic | 4.4% ±0.1% , number 573,030 ±7,971 | 6.5% ±<0.1% , number 22,096,709 ±58,340 | 19th | A04001 |
*1 is the highest. Population is ranked among all states, and the rest among those of 1,000 people or more, whose figures can be ranked. Ranks use 5-year estimates, the only ones covering every state, so they can differ slightly from the figures here.
Income and work
Lower incomes than the US
The median household income is $81,473, lower than the US ($84,780). 11.2% of people live in poverty, and 6.2% have no health insurance, lower than the US (8.4%).
Household income
Source: ACS 2025 1-year, table A14001.
Show data
| Pennsylvania | United States | |
|---|---|---|
| Under $25,000 | 14.5% ±0.4% , number 786,181 ±19,250 | 14.0% ±0.1% , number 18,727,548 ±88,990 |
| $25,000 to $49,999 | 15.9% ±0.3% , number 860,689 ±18,700 | 15.4% ±0.1% , number 20,665,585 ±101,400 |
| $50,000 to $74,999 | 16.0% ±0.3% , number 862,512 ±17,270 | 15.3% ±0.1% , number 20,513,565 ±88,500 |
| $75,000 to $99,999 | 12.6% ±0.3% , number 679,731 ±15,180 | 12.5% ±0.1% , number 16,814,245 ±87,520 |
| $100,000 to $149,999 | 18.1% ±0.3% , number 979,571 ±16,430 | 17.9% ±0.1% , number 24,018,984 ±99,670 |
| $150,000 to $199,999 | 9.7% ±0.3% , number 524,459 ±13,700 | 10.1% ±0.1% , number 13,521,827 ±70,660 |
| $200,000 or more | 13.2% ±0.2% , number 712,438 ±13,000 | 14.8% ±0.1% , number 19,801,668 ±84,120 |
Embed
What residents do for work
Source: ACS 2025 1-year, table A17004.
Show data
| Pennsylvania | United States | |
|---|---|---|
| Education and health care | 27.4% ±0.3% , number 1,769,534 ±22,900 | 24.4% ±0.1% , number 40,862,193 ±140,800 |
| Professional and business services | 12.1% ±0.3% , number 778,382 ±19,550 | 12.8% ±0.1% , number 21,375,231 ±87,110 |
| Manufacturing | 11.2% ±0.3% , number 720,914 ±18,150 | 9.6% ±0.1% , number 16,064,394 ±91,270 |
| Retail trade | 10.5% ±0.3% , number 679,997 ±17,160 | 10.6% ±0.1% , number 17,781,181 ±96,660 |
| Arts, food and lodging | 7.5% ±0.2% , number 483,521 ±15,270 | 8.9% ±0.1% , number 14,811,502 ±87,840 |
| Finance, insurance and real estate | 6.3% ±0.2% , number 407,029 ±10,770 | 6.6% ±<0.1% , number 11,025,569 ±68,570 |
| Transportation and warehousing | 6.0% ±0.2% , number 384,206 ±11,720 | 5.9% ±<0.1% , number 9,832,211 ±73,020 |
| Construction | 5.8% ±0.2% , number 371,427 ±10,970 | 6.7% ±<0.1% , number 11,254,981 ±79,620 |
Embed
Where workers come from and go
Pennsylvania has 5,901,664 jobs and 5,982,164 employed residents. 350,821 people commute in to work and 431,321 commute out, while 5,550,843 both live and work here. The most commuters come from New Jersey.
Most commuters come from
- New Jersey: 157,323
- New York: 39,865
- Delaware: 37,710
Most residents commute to
- New Jersey: 159,087
- New York: 75,583
- Maryland: 70,391
Show data
| Pennsylvania | |
|---|---|
| Live and work here | 5,550,843 |
| Work here, live elsewhere | 350,821 |
| Live here, work elsewhere | 431,321 |
Embed
All the numbers
| Indicator | Pennsylvania | US | Rank among states* | Table |
|---|---|---|---|---|
| Median household income | $81,473 ±$603 | $84,780 ±$215 | 24th | A14006 |
| Income per person | $46,604 ±$336 | $47,171 ±$115 | 20th | A14024 |
| Income inequality (Gini index) | 0.472 ±0.003 | 0.482 ±0.001 | 20th | A14028 |
| Living in poverty | 11.2% ±0.3% , number 1,419,062 ±39,730 | 11.8% ±0.1% , number 39,264,183 ±277,400 | 27th | A13004 |
| Unemployment rate | 4.6% ±0.2% , number 309,337 ±12,850 | 4.9% ±<0.1% , number 8,574,594 ±64,350 | 17th | A17005 |
| No health insurance | 6.2% ±0.2% , number 800,156 ±23,200 | 8.4% ±<0.1% , number 28,323,306 ±152,000 | 39th | A20001 |
*1 is the highest. Population is ranked among all states, and the rest among those of 1,000 people or more, whose figures can be ranked. Ranks use 5-year estimates, the only ones covering every state, so they can differ slightly from the figures here.
Education
College degrees close to the US
37.1% of adults 25 and over have a bachelor’s degree or more, about the same as the US (37.4%).
Highest level of education
Source: ACS 2025 1-year, table A12001.
Show data
| Pennsylvania | United States | |
|---|---|---|
| Less than high school | 7.6% ±0.2% , number 707,373 ±18,860 | 9.4% ±0.1% , number 22,321,002 ±120,500 |
| High school only | 31.4% ±0.3% , number 2,930,887 ±30,080 | 25.6% ±0.1% , number 61,096,726 ±203,400 |
| Some college | 23.8% ±0.3% , number 2,222,488 ±28,700 | 27.7% ±0.1% , number 65,920,977 ±173,500 |
| Bachelor’s degree | 21.9% ±0.3% , number 2,040,247 ±27,640 | 22.3% ±0.1% , number 53,224,312 ±196,700 |
| Graduate degree | 15.2% ±0.3% , number 1,420,373 ±24,630 | 15.0% ±0.1% , number 35,816,011 ±159,400 |
Embed
All the numbers
| Indicator | Pennsylvania | US | Rank among states* | Table |
|---|---|---|---|---|
| Bachelor’s degree or more | 37.1% ±0.4% , number 3,460,620 ±37,020 | 37.4% ±0.1% , number 89,040,323 ±253,200 | 23rd | A12001 |
| High school graduate or more | 92.4% ±0.6% , number 8,613,995 ±55,670 | 90.6% ±0.2% , number 216,058,026 ±368,200 | 18th | A12001 |
*1 is the highest. Population is ranked among all states, and the rest among those of 1,000 people or more, whose figures can be ranked. Ranks use 5-year estimates, the only ones covering every state, so they can differ slightly from the figures here.
Housing
Home values outran incomes
30.8% of households rent, lower than the US (34.7%). The median home is worth $292,400 and the median rent is $1,329. After inflation, home values rose 25% from 2015 to 2025, while household income rose 7%.
Housing costs and income, 2015 to 2025, after inflation
Source: ACS 1-year, table A10036, A18009, A14006.
Show data
| Pennsylvania | United States | |
|---|---|---|
| Median home value | +25.1% | +39.3% |
| Median rent | +11.8% | +18.5% |
| Median household income | +6.8% | +10.9% |
Embed
Types of homes
Source: ACS 2025 1-year, table A10032.
Show data
| Pennsylvania | United States | |
|---|---|---|
| Single-family, detached | 56.1% ±0.3% , number 3,297,934 ±17,390 | 60.9% ±0.1% , number 90,335,844 ±173,300 |
| Single-family, attached | 18.9% ±0.2% , number 1,113,399 ±14,610 | 6.4% ±<0.1% , number 9,527,703 ±51,230 |
| 2 to 4 units | 8.2% ±0.3% , number 482,899 ±15,350 | 7.5% ±0.1% , number 11,109,005 ±75,790 |
| 5 to 19 units | 5.7% ±0.2% , number 333,945 ±12,340 | 8.7% ±0.1% , number 12,829,882 ±97,590 |
| 20 or more units | 7.7% ±0.2% , number 455,808 ±13,640 | 11.1% ±0.1% , number 16,381,450 ±92,310 |
| Mobile homes and other | 3.4% ±0.1% , number 197,918 ±7,700 | 5.4% ±<0.1% , number 8,045,083 ±53,680 |
Embed
When homes were built
Source: ACS 2025 1-year, table A10055.
Show data
| Pennsylvania | United States | |
|---|---|---|
| 2010 or later | 8.2% ±0.2% , number 442,229 ±12,320 | 15.1% ±0.1% , number 20,257,912 ±101,300 |
| 2000 to 2009 | 8.4% ±0.2% , number 451,647 ±11,730 | 13.8% ±0.1% , number 18,535,840 ±92,260 |
| 1980 to 1999 | 18.3% ±0.3% , number 988,748 ±17,020 | 24.1% ±0.1% , number 32,332,570 ±118,900 |
| 1960 to 1979 | 22.0% ±0.3% , number 1,187,422 ±18,090 | 22.9% ±0.1% , number 30,726,302 ±110,000 |
| Before 1960 | 43.2% ±0.5% , number 2,335,535 ±29,240 | 24.0% ±0.1% , number 32,210,798 ±121,500 |
Embed
All the numbers
| Indicator | Pennsylvania | US | Rank among states* | Table |
|---|---|---|---|---|
| Housing units | 5,881,903 | – | – | A10001 |
| Households | 5,405,581 ±14,200 | – | – | A10008 |
| People per household | 2.33 ±0.01 | 2.49 ±0.01 | 39th | A10003 |
| Households that rent | 30.8% ±0.4% , number 1,666,725 ±20,990 | 34.7% ±0.1% , number 46,551,688 ±193,200 | 35th | A10060 |
| Vacant homes | 8.1% ±0.2% , number 476,322 ±14,270 | 9.6% ±0.1% , number 14,165,545 ±137,100 | 35th | A10047, A10060 |
| Median gross rent | $1,329 ±$13 | $1,557 ±$4 | 28th | A18009 |
| Median home value | $292,400 ±$1,766 | $371,100 ±$646 | 35th | A10036 |
| Renters paying 30% or more of income | 45.0% ±1.1% , number 750,165 ±21,200 | 48.3% ±0.2% , number 22,486,693 ±122,100 | 28th | A18002 |
| Owners paying 30% or more of income | 20.4% ±0.4% , number 764,416 ±17,090 | 24.2% ±0.1% , number 21,201,943 ±93,050 | 31st | A10040 |
| Homes built before 1960 | 43.2% ±0.5% , number 2,335,535 ±29,240 | 24.0% ±0.1% , number 32,210,798 ±121,500 | 5th | A10055 |
*1 is the highest. Population is ranked among all states, and the rest among those of 1,000 people or more, whose figures can be ranked. Ranks use 5-year estimates, the only ones covering every state, so they can differ slightly from the figures here.
Getting around
How people get around
68.3% of workers drive alone and 13.6% work from home. 38.7% of those who travel to work spend 30 minutes or more getting there, and 11.4% of households have no vehicle.
How people get to work
Source: ACS 2025 1-year, table A09005.
Show data
| Pennsylvania | United States | |
|---|---|---|
| Drive alone | 68.3% ±0.4% , number 4,334,091 ±34,840 | 69.8% ±0.1% , number 115,297,377 ±192,900 |
| Carpool | 7.9% ±0.2% , number 501,552 ±15,510 | 8.9% ±0.1% , number 14,712,170 ±97,240 |
| Public transit | 4.9% ±0.2% , number 310,099 ±13,750 | 4.3% ±<0.1% , number 7,100,386 ±63,330 |
| Walk | 3.6% ±0.1% , number 228,076 ±8,566 | 2.4% ±<0.1% , number 4,016,469 ±41,070 |
| Work from home | 13.6% ±0.3% , number 865,298 ±19,990 | 12.9% ±0.1% , number 21,288,393 ±105,700 |
| Other | 1.6% ±0.1% , number 102,967 ±7,150 | 1.7% ±<0.1% , number 2,799,658 ±41,510 |
Embed
Time spent getting to work
Source: ACS 2025 1-year, table B09001.
Show data
| Pennsylvania | United States | |
|---|---|---|
| Under 10 minutes | 12.5% ±0.3% , number 684,323 ±16,800 | 12.0% ±0.1% , number 17,199,225 ±93,440 |
| 10 to 19 minutes | 27.3% ±0.4% , number 1,492,552 ±25,950 | 27.8% ±0.1% , number 40,059,540 ±137,700 |
| 20 to 29 minutes | 21.6% ±0.4% , number 1,181,629 ±23,800 | 21.0% ±0.1% , number 30,221,743 ±111,100 |
| 30 to 39 minutes | 17.2% ±0.3% , number 940,152 ±19,490 | 17.1% ±0.1% , number 24,659,138 ±103,800 |
| 40 to 59 minutes | 12.7% ±0.3% , number 696,170 ±18,610 | 12.6% ±0.1% , number 18,104,709 ±97,070 |
| 60 minutes or more | 8.8% ±0.3% , number 481,959 ±16,000 | 9.5% ±0.1% , number 13,681,705 ±84,440 |
Embed
Vehicles per household
Source: ACS 2025 1-year, table A10030.
Show data
| Pennsylvania | United States | |
|---|---|---|
| None | 11.4% ±0.3% , number 616,922 ±15,620 | 8.8% ±0.1% , number 11,781,997 ±77,240 |
| One | 34.5% ±0.5% , number 1,864,172 ±27,260 | 33.1% ±0.1% , number 44,424,682 ±160,700 |
| Two | 35.3% ±0.4% , number 1,906,968 ±24,550 | 36.0% ±0.1% , number 48,200,889 ±176,800 |
| Three or more | 18.8% ±0.3% , number 1,017,519 ±16,350 | 22.1% ±0.1% , number 29,655,854 ±113,300 |
Embed
All the numbers
| Indicator | Pennsylvania | US | Rank among states* | Table |
|---|---|---|---|---|
| Drive to work alone | 68.3% ±0.4% , number 4,334,091 ±34,840 | 69.8% ±0.1% , number 115,297,377 ±192,900 | 36th | A09005 |
| Take public transit | 4.9% ±0.2% , number 310,099 ±13,750 | 4.3% ±<0.1% , number 7,100,386 ±63,330 | 8th | A09005 |
| Work from home | 13.6% ±0.3% , number 865,298 ±19,990 | 12.9% ±0.1% , number 21,288,393 ±105,700 | 21st | A09005 |
| Commute 30 minutes or more | 38.7% ±0.5% , number 2,118,281 ±31,340 | 39.2% ±0.1% , number 56,445,552 ±165,300 | 15th | B09001 |
| Households with no vehicle | 11.4% ±0.3% , number 616,922 ±14,910 | 8.8% ±<0.1% , number 11,781,997 ±64,240 | 6th | A10030 |
*1 is the highest. Population is ranked among all states, and the rest among those of 1,000 people or more, whose figures can be ranked. Ranks use 5-year estimates, the only ones covering every state, so they can differ slightly from the figures here.
Places
The largest cities in Pennsylvania
Population, from the latest estimates available. Figures cover the whole of each place.
Largest cities
- Philadelphia: 1,574,281
- Pittsburgh: 307,634
- Allentown: 126,040
- Reading: 95,829
- Erie: 91,838
- Bethlehem: 79,688
- Scranton: 75,500
- Lancaster: 57,719
States like this one
- North Carolina: 10,730,404
- Michigan: 10,077,761
- Wisconsin: 5,914,872
- South Carolina: 5,296,225
States at least a third this size, with the closest income, education, age, housing and origins.
Every county and place in Pennsylvania
Find any county, city, town, metro area, ZIP code, school district or district in Pennsylvania.
Counties
Each of the 67 counties with its population, from ACS 2020–2024 5-year estimates.
- Adams County106,115
- Allegheny County1.24M
- Armstrong County64,622
- Beaver County166,324
- Bedford County47,513
- Berks County433,015
- Blair County121,277
- Bradford County59,858
- Bucks County647,461
- Butler County197,254
- Cambria County131,538
- Cameron County4,427
- Carbon County65,382
- Centre County158,576
- Chester County547,840
- Clarion County37,179
- Clearfield County78,635
- Clinton County37,798
- Columbia County65,362
- Crawford County82,716
- Cumberland County268,323
- Dauphin County289,593
- Delaware County579,222
- Elk County30,506
- Erie County269,052
- Fayette County125,997
- Forest County6,715
- Franklin County157,379
- Fulton County14,531
- Greene County34,835
- Huntingdon County43,653
- Indiana County83,042
- Jefferson County43,864
- Juniata County23,379
- Lackawanna County216,146
- Lancaster County557,931
- Lawrence County85,024
- Lebanon County144,186
- Lehigh County378,792
- Luzerne County327,675
- Lycoming County113,489
- McKean County39,904
- Mercer County109,257
- Mifflin County46,041
- Monroe County167,515
- Montgomery County867,573
- Montour County18,103
- Northampton County318,580
- Northumberland County90,560
- Perry County46,239
- Philadelphia County1.58M
- Pike County60,621
- Potter County16,188
- Schuylkill County143,558
- Snyder County39,668
- Somerset County72,799
- Sullivan County5,888
- Susquehanna County38,219
- Tioga County40,945
- Union County42,456
- Venango County49,801
- Warren County37,920
- Washington County210,042
- Wayne County51,262
- Westmoreland County352,500
- Wyoming County25,967
- York County462,924
Cities, towns and other places
Each of the 1,991 with its population, from ACS 2020–2024 5-year estimates. Census-designated places are communities without a local government of their own, drawn by the Census Bureau so they can be counted.
- Aaronsburg (Centre County)718
- Aaronsburg (Washington County)212
- Abbottstown940
- Ackermanville240
- Acosta301
- Adamsburg118
- Adamstown2,023
- Adamsville77
- Addison233
- Akron4,143
- Alba123
- Albion1,277
- Albrightsville85
- Alburtis2,598
- Aldan4,259
- Alexandria430
- Alfarata148
- Aliquippa9,079
- Alleghenyville932
- Allenport borough403
- Allenport CDP719
- Allensville389
- Allentown125,976
- Allenwood246
- Allison573
- Allison Park22,045
- Allport93
- Almedia1,271
- Alsace Manor246
- Altamont526
- Altoona43,196
- Alverda159
- Ambler6,847
- Ambridge6,890
- Ambridge Heights1,501
- Amity Gardens4,499
- Ancient Oaks7,777
- Andalusia2,251
- Annville4,915
- Apollo1,488
- Applewold385
- Arcadia University792
- Archbald7,404
- Ardmore13,909
- Arendtsville841
- Aristes246
- Arlington Heights6,847
- Armagh103
- Arnold4,704
- Arnold City538
- Arnot430
- Arona262
- Ashland2,324
- Ashley2,602
- Ashville161
- Aspers405
- Aspinwall2,843
- Atglen1,272
- Athens3,243
- Atkinson Mills181
- Atlantic56
- Atlas719
- Atlasburg482
- Atwood160
- Auburn449
- Audubon9,229
- Austin606
- Avalon4,674
- Avella688
- Avis1,171
- Avoca2,526
- Avon1,397
- Avondale1,084
- Avonia1,793
- Avonmore1,033
- Baden3,843
- Baidland1,809
- Baileyville190
- Bainbridge1,376
- Bairdford706
- Bakerstown2,527
- Bala Cynwyd10,227
- Bald Eagle272
- Baldwin21,057
- Bally1,161
- Bangor5,163
- Barkeyville217
- Barrville322
- Bath2,864
- Baumstown221
- Beallsville425
- Bear Creek Village628
- Bear Lake132
- Bear Rocks1,258
- Beaver4,374
- Beaver Falls8,850
- Beaver Meadows730
- Beaver Springs704
- Beaverdale852
- Beavertown borough888
- Beavertown CDP10
- Bechtelsville914
- Bedford2,851
- Beech Creek678
- Beech Mountain Lakes2,111
- Belfast1,144
- Bell Acres1,468
- Belle Vernon923
- Bellefonte6,009
- Belleville1,951
- Bellevue8,128
- Bellwood1,691
- Belmont2,618
- Belsano257
- Ben Avon1,919
- Ben Avon Heights304
- Bendersville631
- Benson157
- Bentleyville2,437
- Benton485
- Berlin2,481
- Bernville802
- Berrysburg301
- Berwick10,317
- Berwyn3,680
- Bessemer881
- Bethany279
- Bethel587
- Bethel Park32,881
- Bethlehem77,956
- Beurys Lake98
- Big Bass Lake1,428
- Big Beaver1,843
- Big Run505
- Bigler469
- Biglerville1,070
- Birchwood Lakes1,399
- Bird-in-Hand537
- Birdsboro5,116
- Birmingham93
- Black Lick899
- Blain278
- Blain City202
- Blaine Hill587
- Blairsville3,215
- Blakely6,662
- Blanchard593
- Blandburg393
- Blandon7,357
- Blawnox1,439
- Bloomfield1,090
- Blooming Glen868
- Blooming Valley390
- Bloomsburg13,024
- Blossburg1,739
- Blue Ball1,284
- Blue Bell6,424
- Blue Knob29
- Blue Ridge Summit922
- Boalsburg4,582
- Bobtown1,066
- Boiling Springs3,334
- Bolivar411
- Bonneauville2,232
- Boothwyn4,774
- Boston162
- Boswell1,153
- Bowers103
- Bowmanstown968
- Bowmansville2,959
- Boyers138
- Boyertown4,287
- Brackenridge3,167
- Braddock2,039
- Braddock Hills1,629
- Bradenville495
- Bradford7,683
- Bradford Woods1,194
- Branchdale379
- Brandonville199
- Brave140
- Breinigsville7,769
- Brentwood9,866
- Bressler2,060
- Briar Creek828
- Brickerville1,257
- Bridgeport5,174
- Bridgeville4,686
- Bridgewater789
- Brisbin326
- Bristol9,902
- Brittany Farms-The Highlands4,571
- Broad Top City391
- Brockton308
- Brockway2,191
- Brodheadsville1,774
- Brookhaven8,331
- Brooks Mill50
- Brookville3,946
- Broomall10,679
- Browndale722
- Brownstown borough674
- Brownstown CDP3,650
- Brownsville2,412
- Browntown1,671
- Bruin354
- Bryn Athyn1,143
- Bryn Mawr5,880
- Buck Run252
- Buckhorn646
- Buena Vista301
- Buffington123
- Bulger119
- Bunola134
- Burgettstown1,412
- Burlington188
- Burnham1,744
- Burnside161
- Burnt Cabins16
- Butler13,212
- Byrnedale434
- Cairnbrook419
- California4,864
- Callensburg117
- Callery458
- Callimont21
- Caln2,220
- Calumet1,093
- Cambridge576
- Cambridge Springs2,408
- Camp Hill8,169
- Campbelltown6,092
- Canadohta Lake290
- Canan Station53
- Canoe Creek4
- Canonsburg9,675
- Canton1,531
- Carbondale8,789
- Carlisle21,852
- Carlisle Barracks730
- Carmichaels388
- Carnegie7,978
- Carnot-Moon13,534
- Carroll Valley3,992
- Carrolltown914
- Carson Valley133
- Casanova227
- Cashtown346
- Cassandra101
- Casselman79
- Cassville145
- Castanea1,138
- Castle Shannon8,209
- Catasauqua6,541
- Catawissa1,536
- Cecil-Bishop2,910
- Cedar Crest111
- Cementon1,454
- Centerport342
- Centerville (Crawford County)222
- Centerville (Washington County)3,235
- Central City1,105
- Centralia1
- Centre Hall1,547
- Cetronia2,120
- Chadds Ford1,341
- Chalfant768
- Chalfont4,346
- Chalkhill141
- Chambersburg22,319
- Chapman175
- Charleroi4,202
- Charlottsville134
- Chase1,037
- Cheltenham Village2,112
- Cherry Tree215
- Cherry Valley60
- Cherryville1,159
- Chest Springs99
- Chester33,619
- Chester Heights2,948
- Chester Hill788
- Chesterbrook5,839
- Chestnut Hill7,086
- Cheswick1,661
- Chevy Chase Heights1,101
- Chewton345
- Cheyney University308
- Chicora876
- Chinchilla2,213
- Christiana998
- Church Hill1,673
- Churchill3,087
- Churchtown763
- Churchville6,084
- Clairton6,044
- Clappertown73
- Clarence795
- Clarendon358
- Clarion4,192
- Clark585
- Clarks Green1,656
- Clarks Summit5,073
- Clarksville219
- Clay1,362
- Claysburg1,244
- Claysville752
- Clearfield5,873
- Clearville161
- Cleona1,882
- Clifton Heights6,832
- Clinton (Allegheny County)899
- Clinton (Armstrong County)82
- Clintondale127
- Clintonville511
- Clymer1,106
- Coal Center101
- Coaldale (Bedford County)58
- Coaldale (Schuylkill County)2,514
- Coalmont62
- Coalport354
- Coatesville13,353
- Coburn111
- Cochranton1,084
- Cochranville590
- Cokeburg684
- Collegeville5,247
- Collingdale8,897
- Collinsburg1,328
- Colonial Park18,032
- Colony Park1,175
- Columbia10,278
- Columbus664
- Colver559
- Colwyn2,325
- Commodore148
- Conashaugh Lakes1,538
- Conestoga1,243
- Confluence577
- Conneaut Lake526
- Conneaut Lakeshore1,886
- Conneautville748
- Connellsville6,849
- Connoquenessing687
- Conshohocken9,282
- Continental Courts573
- Conway2,195
- Conyngham1,526
- Coopersburg2,495
- Cooperstown374
- Coplay3,466
- Coral214
- Coraopolis5,417
- Cornwall4,623
- Cornwells Heights1,319
- Corry6,116
- Corsica378
- Cotton Town60
- Coudersport2,174
- Coulter236
- Courtdale678
- Cove Forge80
- Crabtree201
- Crafton5,961
- Cranesville750
- Creekside336
- Crenshaw280
- Cresson1,475
- Cressona1,420
- Cross Creek164
- Cross Keys420
- Cross Roads506
- Crown145
- Croydon9,684
- Crucible352
- Culp39
- Cumbola243
- Curryville66
- Curtisville989
- Curwensville2,472
- Daisytown277
- Dale1,281
- Dallas2,692
- Dallastown4,185
- Dalmatia341
- Dalton1,415
- Danville4,217
- Darby10,687
- Darlington299
- Dauberville854
- Dauphin1,075
- Davidsville826
- Dawson388
- Dayton521
- Deemston672
- Deer Lake borough656
- Deer Lake CDP468
- Defiance316
- Delano148
- Delaware Water Gap738
- Delmont2,610
- Delta807
- Denver3,771
- Derry2,614
- DeSales University1,052
- Devon1,806
- Dewart1,247
- Dickson City6,023
- Dillsburg2,629
- Dilworthtown1,090
- Distant606
- Dixonville756
- Donaldson395
- Donegal89
- Donora4,527
- Dormont8,063
- Dorneyville5,211
- Dorseyville941
- Douglassville279
- Dover1,940
- Downingtown8,255
- Doylestown8,341
- Dravosburg1,643
- Drexel Hill30,451
- Drifting318
- Driftwood45
- Dry Tavern581
- Dryville256
- Dublin2,164
- DuBois7,402
- Duboistown1,403
- Dudley191
- Dumb Hundred82
- Dunbar999
- Duncannon1,391
- Duncansville1,147
- Dunlevy326
- Dunlo413
- Dunmore14,181
- Dunnstown1,331
- Dupont2,559
- Duquesne5,149
- Duryea5,084
- Dushore459
- Eagle413
- Eagle Creek105
- Eagles Mere99
- Eagleview2,050
- Eagleville (Centre County)336
- Eagleville (Montgomery County)4,985
- Earlston1,259
- East Altoona324
- East Bangor1,274
- East Berlin1,523
- East Berwick2,279
- East Brady1,041
- East Butler916
- East Conemaugh1,006
- East Earl1,050
- East Freedom597
- East Greenville3,169
- East Lansdowne2,712
- East Marianna141
- East McKeesport2,002
- East Petersburg4,591
- East Pittsburgh2,121
- East Prospect853
- East Rochester585
- East Salem115
- East Sharpsburg129
- East Side457
- East Smithfield208
- East Stroudsburg9,319
- East Uniontown2,195
- East Vandergrift631
- East Washington1,714
- East Waterford116
- East York9,388
- Eastlawn Gardens3,722
- Easton29,739
- Eastvale151
- Eau Claire272
- Ebensburg3,321
- Economy9,005
- Eddington1,606
- Eddystone2,562
- Edenborn398
- Edenburg691
- Edgewood borough3,077
- Edgewood CDP2,078
- Edgeworth1,587
- Edie158
- Edinboro5,440
- Edinburg196
- Edwardsville4,932
- Effort1,743
- Egypt3,053
- Ehrenfeld165
- Eighty Four626
- Elberta234
- Elco280
- Elderton310
- Eldorado476
- Eldred566
- Elgin181
- Elim3,759
- Elizabeth1,371
- Elizabethtown11,925
- Elizabethville1,350
- Elk Grove37
- Elkins Park7,213
- Elkland1,588
- Ellport1,127
- Ellsworth791
- Ellwood City7,532
- Elmora435
- Elrama279
- Elverson1,458
- Elysburg2,492
- Emeigh261
- Emerald Lakes2,716
- Emigsville4,254
- Emlenton663
- Emmaus11,889
- Emporium1,975
- Emsworth2,465
- Englewood661
- Enhaut1,197
- Enlow1,019
- Enola6,534
- Enon Valley458
- Ephrata13,772
- Erie93,850
- Ernest366
- Espy1,624
- Etna3,364
- Evans City2,074
- Evansburg2,976
- Everett2,052
- Everson592
- Exeter5,541
- Export857
- Exton6,772
- Eyers Grove125
- Factoryville1,368
- Fairchance1,241
- Fairdale2,126
- Fairfield569
- Fairhope1,082
- Fairless Hills8,827
- Fairview borough179
- Fairview CDP2,691
- Fairview-Ferndale1,742
- Falls Creek1,220
- Fallston271
- Falmouth521
- Farmersville870
- Farmington826
- Farrell4,199
- Farwell429
- Fawn Grove460
- Fawn Lake Forest765
- Faxon727
- Fayette City386
- Fayetteville2,593
- Feasterville2,461
- Fellsburg845
- Felton453
- Fenelton44
- Ferndale1,517
- Fernville456
- Finleyville341
- Fisherville35
- Fivepointville904
- Fleetwood4,064
- Flemington1,322
- Flinton169
- Flourtown4,992
- Flying Hills1,738
- Folcroft6,772
- Folsom8,671
- Foot of Ten466
- Force226
- Ford City2,813
- Ford Cliff409
- Forest City1,770
- Forest Hills6,286
- Forest Lake89
- Forestville (Butler County)381
- Forestville (Schuylkill County)483
- Forksville134
- Fort Fetter218
- Fort Loudon854
- Fort Washington6,271
- Forty Fort4,252
- Foster Brook942
- Foundryville360
- Fountain Hill4,834
- Fountain Springs99
- Fox Chapel5,246
- Fox Chase1,575
- Foxburg277
- Frackville3,878
- Frankfort Springs101
- Franklin borough265
- Franklin city5,984
- Franklin Forge31
- Franklin Park15,235
- Franklintown480
- Frazer3,389
- Fredericksburg (Blair County)131
- Fredericksburg (Crawford County)673
- Fredericksburg (Lebanon County)1,226
- Fredericktown488
- Fredonia314
- Freeburg814
- Freedom1,488
- Freeland3,837
- Freemansburg2,894
- Freeport1,708
- Frenchville159
- Friedens1,018
- Friedensburg842
- Friendsville162
- Friesville161
- Frisco1,134
- Frizzleburg403
- Frystown99
- Fullerton16,724
- Galeton789
- Gallitzin1,435
- Ganister3
- Gap2,128
- Garden View2,637
- Gardners76
- Garrett403
- Gastonville2,995
- Geeseytown156
- Geistown2,507
- Genesee252
- Geneva138
- Georgetown borough341
- Georgetown CDP (Lancaster County)784
- Georgetown CDP (Luzerne County)1,880
- Gettysburg8,254
- Gibraltar398
- Gibsonia2,899
- Gilberton687
- Gilbertsville6,165
- Girard2,962
- Girardville1,110
- Glasgow88
- Glassport4,368
- Glen Campbell166
- Glen Hope204
- Glen Lyon1,925
- Glen Osborne585
- Glen Richey198
- Glen Rock2,108
- Glenburn989
- Glendale1,408
- Glendon374
- Glenfield199
- Glenmoore910
- Glenolden7,220
- Glenshaw9,139
- Glenside7,659
- Gold Key Lake2,563
- Goldsboro981
- Goodville205
- Gordon959
- Gordonville310
- Gouglersville694
- Gouldsboro713
- Graceton106
- Grampian429
- Grantley4,775
- Granville395
- Grapeville421
- Grassflat474
- Gratz745
- Gray (Blair County)21
- Gray (Somerset County)252
- Grazierville511
- Great Bend581
- Green Lane511
- Green Tree4,833
- Greencastle4,222
- Greenfields986
- Greenock1,815
- Greens Landing593
- Greensboro285
- Greensburg14,741
- Greenville5,523
- Greenwood2,853
- Grier City167
- Grill1,903
- Grindstone580
- Grove City7,830
- Guilford3,919
- Guys Mills268
- Halfway House3,688
- Halifax515
- Hallam2,788
- Hallstead1,217
- Hamburg4,456
- Hamorton138
- Hampton1,404
- Hannasville161
- Hanover16,584
- Harford115
- Harlansburg269
- Harleigh1,389
- Harleysville9,090
- Harmonsburg95
- Harmony1,232
- Harrisburg50,287
- Harrison City96
- Harrisville901
- Hartleton248
- Hartstown181
- Harveys Lake2,809
- Harwick899
- Hasson Heights1,351
- Hastings880
- Hatboro8,283
- Hatfield3,502
- Haverford College1,695
- Hawk Run744
- Hawley925
- Hawthorn501
- Haysville99
- Hayti1,803
- Hazen117
- Hazleton30,111
- Hebron1,125
- Heckscherville279
- Hegins1,088
- Heidelberg1,234
- Heidlersburg457
- Heilwood239
- Hellertown6,118
- Hemlock Farms3,392
- Hendersonville243
- Henrietta188
- Hereford1,452
- Herminie700
- Hermitage16,041
- Herndon366
- Hershey14,242
- Hickory987
- Hickory Hills480
- Highland Park1,177
- Highspire2,732
- Hilldale1,012
- Hiller1,536
- Hillsville400
- Hinkletown181
- Hokendauqua3,145
- Holiday Pocono743
- Hollidaysburg5,558
- Holters Crossing96
- Homeacre-Lyndora6,783
- Homer City1,778
- Homestead2,874
- Hometown1,283
- Homewood75
- Homewood at Martinsburg332
- Honesdale4,467
- Honey Brook1,941
- Hookstown80
- Hooversville666
- Hop Bottom291
- Hopeland760
- Hopewell162
- Hopwood1,767
- Horsham16,005
- Hostetter453
- Houserville2,000
- Houston1,313
- Houtzdale857
- Howard653
- Hublersburg26
- Hudson1,588
- Hughestown1,506
- Hughesville2,274
- Hulmeville925
- Hummels Wharf876
- Hummelstown4,527
- Hunker297
- Hunterstown137
- Huntingdon6,897
- Hustontown127
- Hyde1,067
- Hyde Park borough464
- Hyde Park CDP2,846
- Hydetown505
- Hyndman850
- Hyner127
- Ickesburg416
- Idaville105
- Imperial3,001
- Indian Lake377
- Indian Mountain Lake3,889
- Indian Rocks375
- Indiana14,212
- Industry borough1,618
- Industry CDP406
- Ingram3,299
- Inkerman1,581
- Intercourse1,588
- Iola179
- Irvona451
- Irwin3,831
- Ivyland914
- Jackson Center172
- Jacksonville (Centre County)52
- Jacksonville (Indiana County)680
- Jacksonwald3,894
- Jacobus2,177
- James City174
- Jamestown borough683
- Jamestown CDP233
- Jamison City260
- Jeannette8,657
- Jeddo158
- Jefferson (Greene County)301
- Jefferson (York County)437
- Jefferson Hills12,317
- Jenkintown4,727
- Jennerstown1,115
- Jermyn2,141
- Jerome611
- Jersey Shore4,121
- Jerseytown154
- Jessup4,495
- Jim Thorpe4,540
- Joffre610
- Johnsonburg2,424
- Johnstown18,087
- Jonestown borough1,893
- Jonestown CDP36
- Jugtown23
- Julian206
- Juniata Gap691
- Juniata Terrace528
- Kane3,537
- Kapp Heights712
- Karns City194
- Karthaus212
- Kelayres413
- Kempton148
- Kenhorst3,009
- Kenilworth2,013
- Kenmar5,077
- Kennerdell221
- Kennett Square6,243
- Kerrtown100
- Kersey743
- Kimberton377
- King of Prussia25,857
- Kingston13,397
- Kirkwood307
- Kiskimere115
- Kistler279
- Kittanning3,902
- Klahr58
- Klingerstown105
- Knox1,082
- Knoxville784
- Koppel759
- Kratzerville319
- Kreamer491
- Kulpmont2,724
- Kulpsville8,799
- Kutztown4,180
- Kutztown University4,182
- Kylertown235
- Laboratory664
- Laceyville423
- Laflin1,459
- Lake Arthur Estates333
- Lake City2,895
- Lake Heritage2,997
- Lake Latonka651
- Lake Meade2,176
- Lake Wallenpaupack Estates233
- Lake Winola572
- Lake Wynonah3,036
- Lakemont1,644
- Lakeside96
- Lamar570
- Lampeter2,140
- Lancaster57,719
- Landingville208
- Landisburg261
- Landisville2,168
- Lanesboro669
- Langeloth632
- Langhorne1,657
- Langhorne Manor1,543
- Lansdale19,011
- Lansdowne11,122
- Lanse149
- Lansford4,156
- Laporte272
- Larke26
- Larksville4,255
- Latrobe7,977
- Lattimer684
- Laurel Lake144
- Laurel Mountain111
- Laurel Run469
- Laureldale4,284
- Laurelton258
- Laurys Station744
- Lavelle572
- Lawnton4,765
- Lawrence1,154
- Lawrence Park3,775
- Lawrenceville707
- Lawson Heights2,213
- Lebanon26,536
- Lebanon South2,374
- Leechburg1,985
- Leeper178
- Leesport2,166
- Leetsdale1,096
- Lehighton5,268
- Leith-Hatfield2,577
- Lemont2,076
- Lemont Furnace877
- Lemoyne4,742
- Lenape Heights1,042
- Lenhartsville197
- Lenkerville775
- Leola7,448
- LeRaysville293
- Level Green4,409
- Levittown50,926
- Lewis Run570
- Lewisberry530
- Lewisburg5,257
- Lewistown8,479
- Liberty (Allegheny County)2,320
- Liberty (Tioga County)268
- Lightstreet1,156
- Ligonier1,534
- Lilly792
- Lima2,812
- Lime Ridge842
- Lincoln922
- Lincoln Park1,801
- Lincoln University2,017
- Lincolnville118
- Linds Crossing40
- Linesville1,132
- Linglestown6,957
- Linntown1,764
- Linwood3,921
- Lionville7,683
- Lititz9,619
- Little Britain439
- Little Meadows239
- Littlestown4,850
- Liverpool850
- Llewellyn269
- Lock Haven8,447
- Locust Gap188
- Locustdale133
- Loganton391
- Loganville1,588
- Long Branch458
- Longfellow110
- Loop2,039
- Lorain594
- Lorane4,601
- Loretto1,420
- Lower Allen7,646
- Lower Burrell11,633
- Loyalhanna3,349
- Loysville587
- Lucerne Mines615
- Lumber City75
- Luthersburg331
- Luzerne2,723
- Lykens1,878
- Lynnwood-Pricedale2,128
- Lyons466
- Mackeyville279
- Macungie3,274
- Madera507
- Madison355
- Madisonburg148
- Mahaffey308
- Mahanoy City3,507
- Mainesburg92
- Mainville115
- Maitland253
- Malvern3,435
- Mammoth373
- Manchester2,803
- Manheim5,027
- Manns Choice315
- Manor3,538
- Manorville402
- Mansfield2,990
- Maple Glen6,643
- Mapleton398
- Mapletown71
- Marcus Hook2,102
- Marianna585
- Marianne1,135
- Marienville3,163
- Marietta2,886
- Marion878
- Marion Center436
- Marion Heights578
- Marklesburg291
- Markleysburg334
- Marlin281
- Mars1,285
- Marshallton (Chester County)438
- Marshallton (Northumberland County)1,187
- Martins Creek662
- Martinsburg1,741
- Martinsburg Junction8
- Maryd164
- Marysville2,681
- Masontown3,201
- Masthope689
- Matamoras2,539
- Mather509
- Mattawana334
- Maxatawny49
- Mayfield1,876
- Maytown4,443
- McAdoo2,501
- McAlisterville929
- McClure984
- McConnellsburg1,009
- McConnellstown1,428
- McDonald2,065
- McElhattan1,036
- McEwensville314
- McGovern4,393
- McKean437
- McKeansburg153
- McKee208
- McKees Rocks5,786
- McKeesport17,380
- McKinley2,662
- McKnightstown695
- McMurray4,286
- McSherrystown3,114
- McVeytown363
- Meadowlands495
- Meadowood2,644
- Meadville12,577
- Mechanicsburg9,720
- Mechanicsville448
- Media5,870
- Mehoopany317
- Melrose Park2,266
- Mercer2,006
- Mercersburg1,725
- Meridian3,837
- Merion Station5,788
- Mertztown530
- Meshoppen549
- Messiah College2,329
- Mexico470
- Meyersdale2,103
- Middleburg1,181
- Middleport362
- Middletown borough9,632
- Middletown CDP7,628
- Midland borough2,293
- Midland CDP196
- Midway borough837
- Midway CDP860
- Mifflin395
- Mifflinburg3,473
- Mifflintown914
- Mifflinville1,193
- Mildred340
- Milesburg1,105
- Milford1,198
- Milford Square1,312
- Mill Creek319
- Mill Hall1,364
- Mill Run253
- Mill Village334
- Millbourne1,467
- Millersburg2,531
- Millerstown borough736
- Millerstown CDP5
- Millersville8,982
- Millerton422
- Millheim777
- Millsboro282
- Millvale3,299
- Millville943
- Millwood366
- Milroy1,577
- Milton6,534
- Mineral Springs278
- Minersville4,396
- Mingoville180
- Misericordia University1,011
- Mocanaqua593
- Modena442
- Mohnton2,922
- Mohrsville341
- Monaca5,519
- Monessen6,780
- Monongahela4,109
- Monroe621
- Monroeville28,295
- Mont Alto1,632
- Mont Clare2,313
- Montandon831
- Montgomery1,564
- Montgomeryville13,388
- Montoursville4,706
- Montrose1,512
- Montrose Manor630
- Monument89
- Moose Run235
- Moosic5,973
- Morea157
- Morgan Hill1,348
- Morgantown1,381
- Morris Run669
- Morrisdale747
- Morrisville borough9,752
- Morrisville CDP1,082
- Morton2,773
- Moscow1,798
- Moshannon284
- Mount Aetna544
- Mount Bethel334
- Mount Carbon69
- Mount Carmel5,677
- Mount Cobb2,065
- Mount Eagle117
- Mount Gretna208
- Mount Gretna Heights325
- Mount Holly Springs2,373
- Mount Jackson590
- Mount Jewett674
- Mount Joy8,344
- Mount Morris568
- Mount Oliver3,319
- Mount Penn3,244
- Mount Pleasant4,199
- Mount Pleasant Mills503
- Mount Pocono3,072
- Mount Royal245
- Mount Union2,328
- Mount Wolf1,108
- Mountain Top11,850
- Mountainhome887
- Mountville3,004
- Muhlenberg Park1,259
- Muir572
- Muncy2,720
- Mundys Corner1,394
- Munhall10,548
- Murrysville20,817
- Muse2,529
- Myerstown3,124
- Nanticoke10,653
- Nanty-Glo2,598
- Naomi48
- Narberth4,511
- Natrona869
- Natrona Heights6,903
- Nazareth6,043
- Nealmont85
- Needmore196
- Nemacolin1,306
- Nescopeck1,486
- Nesquehoning3,344
- New Albany358
- New Alexandria448
- New Baltimore139
- New Beaver1,343
- New Bedford813
- New Berlin781
- New Berlinville1,432
- New Bethlehem957
- New Boston192
- New Brighton5,567
- New Britain2,821
- New Buffalo48
- New Castle21,579
- New Castle Northwest1,223
- New Centerville132
- New Columbia766
- New Columbus305
- New Cumberland7,580
- New Eagle2,085
- New Florence653
- New Freedom5,066
- New Freeport63
- New Galilee320
- New Holland5,780
- New Hope2,622
- New Jerusalem645
- New Kensington12,011
- New Kingstown748
- New Lebanon199
- New Market718
- New Milford748
- New Morgan75
- New Oxford1,675
- New Paris225
- New Philadelphia975
- New Ringgold284
- New Salem borough1,011
- New Salem CDP364
- New Schaefferstown189
- New Stanton2,515
- New Tripoli717
- New Washington42
- New Wilmington2,395
- Newburg borough (Clearfield County)63
- Newburg borough (Cumberland County)444
- Newburg CDP306
- Newell582
- Newmanstown3,227
- Newport1,621
- Newry157
- Newton Hamilton229
- Newtown borough2,224
- Newtown CDP275
- Newtown Grant6,193
- Newville1,283
- Nicholson696
- Nicktown143
- Nittany1,096
- Nixon1,251
- Noblestown616
- Norristown35,893
- North Apollo1,156
- North Belle Vernon1,723
- North Bend313
- North Braddock4,219
- North Catasauqua3,014
- North Charleroi1,316
- North East4,054
- North Irwin799
- North Philipsburg651
- North Towanda589
- North Vandergrift249
- North Wales3,440
- North Warren2,104
- North Washington141
- North York2,812
- Northampton10,400
- Northern Cambria3,494
- Northumberland3,866
- Northwest Harborcreek8,753
- Northwood206
- Norvelt987
- Norwood5,934
- Nottingham1,508
- Noxen690
- Nuangola748
- Numidia307
- Nuremberg133
- Oak Hills2,513
- Oak Lane4,210
- Oakdale1,489
- Oakland borough527
- Oakland CDP (Cambria County)1,627
- Oakland CDP (Lawrence County)1,330
- Oakmont6,702
- Oaks943
- Oakwood2,253
- Oberlin269
- Ohiopyle17
- Ohioville3,324
- Oil City9,468
- Oklahoma borough884
- Oklahoma CDP1,029
- Old Forge8,573
- Old Orchard1,910
- Oley1,153
- Oliver2,393
- Olivia387
- Olyphant5,381
- Oneida371
- Orangeville421
- Orbisonia468
- Orchard Hills1,546
- Ore Hill214
- Oreland5,953
- Oreminea87
- Orrstown287
- Orrtanna143
- Orviston69
- Orwigsburg3,005
- Orwin200
- Osceola Mills1,325
- Oswayo121
- Oval478
- Oxford5,825
- Paint842
- Palmdale1,542
- Palmer Heights3,624
- Palmerton5,622
- Palmyra7,755
- Palo Alto960
- Paoli6,362
- Paradise1,091
- Pardeesville366
- Paris652
- Park Crest645
- Park Forest Village8,624
- Park Place204
- Parker634
- Parkesburg3,937
- Parkhill346
- Parkland1,599
- Parkside2,321
- Parkville8,128
- Parryville445
- Patterson Heights711
- Patton1,809
- Paxtang1,662
- Paxtonia4,074
- Paxtonville218
- Pen Argyl3,495
- Pen Mar1,171
- Penbrook3,266
- Penfield379
- Penn679
- Penn Estates3,659
- Penn Farms2,508
- Penn Lake Park376
- Penn State Berks872
- Penn State Erie (Behrend)1,607
- Penn Wynne6,070
- Penndel2,513
- Penns Creek823
- Pennsburg3,994
- Pennsbury Village655
- Pennside5,407
- Pennville2,405
- Pennwyn384
- Penryn1,257
- Perkasie9,216
- Perryopolis1,529
- Peru76
- Petersburg404
- Petrolia186
- Philadelphia1.58M
- Philipsburg2,748
- Phoenixville19,452
- Picture Rocks716
- Pikes Creek221
- Pillow264
- Pine Glen167
- Pine Grove2,118
- Pine Grove Mills1,502
- Pine Ridge3,099
- Pine Run1,067
- Pinecroft350
- Pitcairn3,032
- Pittsburgh304,759
- Pittston7,626
- Plainfield248
- Plains4,153
- Platea591
- Pleasant Gap3,208
- Pleasant Hill3,128
- Pleasant Hills8,399
- Pleasant View809
- Pleasantville (Bedford County)128
- Pleasantville (Venango County)759
- Pleasureville2,735
- Plum26,723
- Plumsteadville2,592
- Plumville174
- Plymouth5,770
- Plymouth Meeting7,502
- Plymptonville1,076
- Pocono Mountain Lake Estates700
- Pocono Pines953
- Pocono Ranch Lands1,187
- Pocono Springs835
- Pocono Woodland Lakes3,202
- Point Marion1,178
- Point View15
- Polk615
- Pomeroy856
- Port Allegany2,356
- Port Carbon1,768
- Port Clinton271
- Port Matilda552
- Port Royal740
- Port Trevorton687
- Port Vue3,620
- Portage2,495
- Portersville196
- Portland546
- Potlicker Flats44
- Potters Mills172
- Pottsgrove3,409
- Pottstown23,476
- Pottsville13,364
- Pringle803
- Progress11,017
- Prompton248
- Prospect1,157
- Prospect Park borough6,417
- Prospect Park CDP288
- Pughtown1,125
- Pulaski85
- Punxsutawney5,665
- Puzzletown112
- Pymatuning Central2,593
- Pymatuning North290
- Pymatuning South367
- Quakertown9,319
- Quarryville2,856
- Queens Gate1,602
- Quentin720
- Railroad335
- Rainsburg138
- Ramblewood1,092
- Ramey389
- Rankin1,793
- Ranshaw708
- Raubsville1,092
- Rauchtown586
- Ravine537
- Reading95,242
- Reamstown3,468
- Rebersburg583
- Red Hill borough2,513
- Red Hill CDP116
- Red Lion6,516
- Reedsville872
- Reese37
- Refton321
- Rehrersburg145
- Reiffton4,575
- Reightown227
- Reinerton358
- Reinholds2,168
- Renfrew129
- Rennerdale1,067
- Renningers511
- Renovo1,045
- Republic1,332
- Reservoir67
- Revloc391
- Rew200
- Reynolds Heights1,845
- Reynoldsville2,431
- Rheems2,426
- Rices Landing515
- Riceville60
- Richboro6,963
- Richfield374
- Richland1,547
- Richlandtown1,209
- Riddlesburg152
- Ridgway3,969
- Ridley Park7,261
- Riegelsville860
- Rimersburg1,100
- Ringtown745
- Riverside borough1,806
- Riverside CDP267
- Riverview Park3,619
- Roaring Spring2,335
- Robertsdale199
- Robeson Extension247
- Robesonia2,261
- Robinson526
- Rochester3,422
- Rockdale Acres61
- Rockhill386
- Rockledge2,634
- Rockwood793
- Rogersville350
- Rohrerstown706
- Rohrsburg127
- Rome547
- Ronco10
- Ronks202
- Roots287
- Roscoe567
- Rose Valley1,225
- Rosebud351
- Rosemont3,421
- Roseto1,362
- Roseville164
- Roslyn10,639
- Rossiter652
- Rosslyn Farms534
- Rote501
- Rothsville2,934
- Roulette635
- Rouseville460
- Rouzerville573
- Rowes Run449
- Royalton941
- Royer23
- Royersford4,945
- Runville425
- Rupert164
- Rural Valley1,019
- Russell1,215
- Russellton1,333
- Rutherford6,890
- Rutledge935
- S.N.P.J.10
- Sabinsville164
- Sadsburyville967
- Saegertown828
- Sagamore121
- Saginaw553
- Salisbury587
- Salix1,115
- Salladasburg223
- Salona357
- Saltillo417
- Saltsburg738
- Salunga3,355
- Sanatoga8,949
- Sand Hill2,513
- Sandy1,497
- Sandy Lake783
- Sandy Ridge181
- Sankertown682
- Saw Creek4,422
- Saxonburg1,202
- Saxton791
- Saylorsburg804
- Sayre5,431
- Scalp Level791
- Schaefferstown942
- Schellsburg342
- Schenley65
- Schlusser5,402
- Schnecksville3,922
- Schoeneck1,018
- Schubert39
- Schuylkill Haven5,253
- Schwenksville1,385
- Scotland1,492
- Scottdale4,363
- Scranton76,033
- Selinsgrove5,593
- Sellersville4,542
- Seltzer321
- Seneca1,439
- Seven Fields2,884
- Seven Springs40
- Seven Valleys598
- Seward412
- Sewickley3,823
- Sewickley Heights690
- Sewickley Hills672
- Shade Gap68
- Shamokin6,853
- Shamokin Dam1,708
- Shanksville183
- Shanor-Northvue5,125
- Sharon12,936
- Sharon Hill6,002
- Sharpsburg3,119
- Sharpsville4,187
- Shartlesville387
- Shavertown2,137
- Sheakleyville100
- Sheatown614
- Sheffield833
- Shelltown93
- Shellytown82
- Shelocta48
- Shenandoah4,146
- Shenandoah Heights1,262
- Sheppton588
- Shickshinny638
- Shillington5,492
- Shiloh11,246
- Shinglehouse1,076
- Shippensburg5,620
- Shippensburg University2,071
- Shippenville520
- Shippingport159
- Shiremanstown1,777
- Shirleysburg101
- Shoemakersville1,394
- Shrewsbury3,878
- Sickles Corner223
- Sidman305
- Sierra View6,365
- Siglerville191
- Silkworth745
- Silverdale1,288
- Simpson1,475
- Sinking Spring4,281
- Sinnamahoning31
- Skelp139
- Skippack3,937
- Skyline View4,704
- Slabtown62
- Slatedale303
- Slatington4,290
- Slickville147
- Sligo731
- Slippery Rock3,495
- Slippery Rock University2,853
- Slovan714
- Smethport1,462
- Smicksburg41
- Smithfield1,050
- Smithton406
- Smock564
- Smoketown342
- Snow Shoe702
- Snydertown borough311
- Snydertown CDP467
- Somerset5,944
- Soudersburg592
- Souderton7,181
- South Bethlehem382
- South Coatesville1,928
- South Connellsville1,807
- South Fork749
- South Greensburg2,446
- South Heights408
- South Montrose199
- South New Castle712
- South Philipsburg397
- South Pottstown1,893
- South Renovo409
- South Temple1,882
- South Uniontown1,168
- South Waverly1,069
- South Williamsport6,211
- Southmont2,059
- Southpointe3,136
- Southview303
- Southwest Greensburg1,949
- Spartansburg378
- Speers1,105
- Spinnerstown1,780
- Spring Church598
- Spring City3,657
- Spring Drive Mobile Home Park92
- Spring Grove2,433
- Spring Hill1,006
- Spring House5,137
- Spring Mills564
- Spring Mount2,288
- Spring Ridge917
- Springboro425
- Springdale3,319
- Springmont1,319
- Springville246
- Sproul393
- Spry4,909
- St. Benedict476
- St. Clair borough2,754
- St. Clair CDP37
- St. Clairsville101
- St. Davids3,875
- St. Lawrence1,851
- St. Marys12,529
- St. Michael431
- St. Petersburg267
- St. Vincent College1,326
- Star Junction456
- Starbrick493
- Starrucca171
- State College41,050
- State Line3,111
- Steelton6,296
- Stevens799
- Stewartstown1,761
- Stiles1,441
- Stillwater169
- Stockdale291
- Stockertown775
- Stoneboro785
- Stonerstown430
- Stony Creek Mills1,081
- Stonybrook3,483
- Stormstown2,532
- Stouchsburg452
- Stowe3,698
- Stoystown354
- Strabane605
- Strasburg3,109
- Strattanville598
- Strausstown302
- Strodes Mills836
- Strong14
- Stroudsburg5,894
- Sturgeon1,466
- Sugar Grove492
- Sugar Notch999
- Sugarcreek4,716
- Summerhill523
- Summerville436
- Summit Hill3,137
- Summit Station201
- Sun Valley2,529
- Sunbrook440
- Sunbury9,617
- Sunrise Lake1,126
- Susquehanna Depot1,297
- Susquehanna Trails2,251
- Sutersville544
- Swarthmore6,550
- Swartzville1,799
- Swedeland1,630
- Sweden Valley166
- Swedesburg806
- Swissvale8,418
- Swoyersville5,048
- Sykesville895
- Sylvan Hills578
- Sylvania237
- Table Rock98
- Tamaqua6,924
- Tarentum4,249
- Tatamy1,464
- Taylor6,265
- Taylorstown176
- Telford4,829
- Temple2,135
- Templeton213
- Terre Hill1,004
- Tharptown (Uniontown)358
- The Escape416
- The Hideout2,432
- Thompson327
- Thompsontown515
- Thompsonville3,646
- Thornburg464
- Thorndale3,854
- Three Springs404
- Throop4,081
- Tidioute786
- Timber Hills306
- Timblin185
- Tioga598
- Tionesta323
- Tipton730
- Titusville5,189
- Toftrees2,873
- Topton2,215
- Toughkenamon804
- Towamensing Trails1,716
- Towanda2,791
- Tower City1,545
- Townville340
- Trafford3,216
- Trainer1,733
- Trappe4,025
- Treasure Lake5,336
- Tremont1,605
- Tresckow696
- Trevorton1,775
- Trevose3,635
- Trexlertown2,416
- Trooper4,907
- Troutville201
- Troxelville396
- Troy1,408
- Trucksville2,042
- Trumbauersville772
- Tullytown2,358
- Tunkhannock1,636
- Tunnelhill278
- Turbotville808
- Turtle Creek5,007
- Tuscarora452
- Twilight221
- Twin Rocks238
- Tyler Run1,814
- Tylersburg94
- Tylersville171
- Tyrone5,377
- Tyrone Forge39
- Ulster349
- Ulysses532
- Union City2,887
- Union Dale225
- Union Deposit808
- Uniontown9,742
- Unionville borough238
- Unionville CDP (Beaver County)190
- Unionville CDP (Butler County)644
- Unionville CDP (Chester County)652
- University of Pittsburgh Bradford974
- University of Pittsburgh Johnstown1,380
- Upland3,057
- Upper Exeter1,004
- Ursina209
- Utica157
- Vail23
- Valencia550
- Valley Green3,676
- Valley View (Schuylkill County)1,487
- Valley View (York County)2,981
- Van Voorhis516
- Vanderbilt353
- Vandergrift5,011
- Vandling964
- Venango199
- Verona2,524
- Versailles1,533
- Vicksburg (Blair County)165
- Vicksburg (Union County)289
- Village Green-Green Ridge9,073
- Village Shires3,503
- Villanova9,186
- Vinco1,657
- Vintondale390
- Virginville336
- Volant89
- Vowinckel134
- Wagner58
- Wakefield573
- Wall563
- Wallaceton293
- Wallenpaupack Lake Estates1,232
- Waller72
- Walnutport2,085
- Walnuttown426
- Wampum502
- Wanamie555
- Warfordsburg44
- Warminster Heights3,940
- Warren9,240
- Warrior Run466
- Warriors Mark452
- Washington13,368
- Washington Boro663
- Washingtonville263
- Waterford1,301
- Watsontown2,005
- Wattsburg341
- Waverly653
- Waymart1,114
- Wayne6,635
- Wayne Heights3,293
- Waynesboro11,047
- Waynesburg3,811
- Weatherly2,551
- Webster65
- Weedville523
- Weigelstown15,485
- Weissport506
- Weissport East1,646
- Wellersburg147
- Wells Tannery101
- Wellsboro3,437
- Wellsville239
- Wernersville2,786
- Wescosville7,148
- Wesleyville3,179
- West Alexander491
- West Brownsville1,100
- West Chester20,666
- West Conshohocken1,536
- West Decatur650
- West Easton1,245
- West Elizabeth344
- West Fairview1,208
- West Falls379
- West Grove2,798
- West Hamburg1,896
- West Hazleton5,178
- West Hills1,584
- West Homestead1,905
- West Kittanning1,284
- West Lawn1,384
- West Leechburg1,190
- West Liberty327
- West Mayfield1,332
- West Middlesex980
- West Middletown67
- West Mifflin19,190
- West Milton804
- West Myerstown1,465
- West Nanticoke632
- West Newton2,621
- West Pittsburg909
- West Pittston4,679
- West Reading4,562
- West Sunbury197
- West View6,533
- West Waynesburg299
- West Wilmerding475
- West Wyoming2,662
- West Wyomissing3,289
- West York5,092
- Westfield1,189
- Westland40
- Westmont4,855
- Weston495
- Westover323
- Westwood (Cambria County)1,613
- Westwood (Chester County)1,501
- Wheatland819
- Whitaker1,140
- White Haven1,014
- White Mills703
- White Oak7,468
- Whitehall14,811
- Whitfield5,226
- Wickerham Manor-Fisher1,247
- Wiconsico734
- Wilburton Number One413
- Wilburton Number Two33
- Wilcox323
- Wilkes-Barre44,423
- Wilkinsburg14,027
- Williamsburg1,073
- Williamsport27,612
- Williamstown1,345
- Willow Grove14,131
- Willow Street9,647
- Wilmerding1,761
- Wilmore394
- Wilson8,183
- Winburne576
- Wind Gap3,360
- Wind Ridge228
- Windber3,860
- Windsor1,323
- Winfield909
- Winterstown389
- Witmer527
- Wolfdale2,938
- Womelsdorf2,904
- Wood330
- Woodbourne3,834
- Woodbury346
- Woodcock131
- Woodland458
- Woodland Heights1,585
- Woodlyn9,736
- Woodside2,491
- Woodward106
- Woolrich815
- Wopsononock38
- Wormleysburg3,077
- Worthington499
- Worthville49
- Woxall1,347
- Wrightsville1,869
- Wurtemburg740
- Wyalusing653
- Wyano263
- Wylandville890
- Wyncote3,389
- Wyndmoor5,633
- Wynnewood2,766
- Wyoming3,118
- Wyomissing11,172
- Yardley2,609
- Yarnell92
- Yatesboro49
- Yatesville749
- Yeadon12,181
- Yeagertown1,165
- Yellow Springs167
- Yoe1,162
- York44,938
- York Haven732
- York Springs865
- Yorkana247
- Yorklyn1,525
- Youngstown218
- Youngsville1,803
- Youngwood2,926
- Yukon750
- Zelienople3,827
- Zion1,981
Metro and micro areas
Each of the 36 that reach into Pennsylvania, with its whole population, from ACS 2020–2024 5-year estimates. Metro and micro areas are counties tied together by commuting, drawn by the Office of Management and Budget.
- Allentown-Bethlehem-Easton, PA-NJ Metro Area873,603
- Altoona, PA Metro Area121,277
- Bloomsburg-Berwick, PA Micro Area65,362
- Bradford, PA Micro Area39,904
- Chambersburg, PA Metro Area157,379
- DuBois, PA Micro Area78,635
- East Stroudsburg, PA Micro Area167,515
- Erie, PA Metro Area269,052
- Gettysburg, PA Metro Area106,115
- Harrisburg-Carlisle, PA Metro Area604,155
- Hemlock Farms, PA Micro Area60,621
- Hermitage, PA Micro Area109,257
- Huntingdon, PA Micro Area43,653
- Indiana, PA Micro Area83,042
- Johnstown, PA Metro Area131,538
- Lancaster, PA Metro Area557,931
- Lebanon, PA Metro Area144,186
- Lewisburg, PA Micro Area42,456
- Lewistown, PA Micro Area46,041
- Lock Haven, PA Micro Area37,798
- Meadville, PA Micro Area82,716
- Oil City, PA Micro Area49,801
- Philadelphia-Camden-Wilmington, PA-NJ-DE-MD Metro Area6.27M
- Pittsburgh, PA Metro Area2.44M
- Pottsville, PA Micro Area143,558
- Reading, PA Metro Area433,015
- Sayre, PA Micro Area59,858
- Scranton--Wilkes-Barre, PA Metro Area569,788
- Selinsgrove, PA Micro Area39,668
- Somerset, PA Micro Area72,799
- St. Marys, PA Micro Area30,506
- State College, PA Metro Area158,576
- Sunbury, PA Micro Area108,663
- Warren, PA Micro Area37,920
- Williamsport, PA Metro Area113,489
- York-Hanover, PA Metro Area462,924
ZIP codes
Each of the 1,812 with people in it, by the town it's centered in, from ACS 2020–2024 5-year estimates. These are the Census Bureau's ZIP Code Tabulation Areas, which follow the Postal Service's ZIP codes as closely as census blocks allow.
- 15001Aliquippa31,976
- 15003Ambridge11,387
- 15004Atlasburg217
- 15005Economy9,570
- 15006Bairdford180
- 15007Bakerstown256
- 15009Beaver15,565
- 15010West Mayfield28,542
- 15012Fellsburg15,412
- 15014Brackenridge3,095
- 15015Bradford Woods1,291
- 15017Bridgeville17,782
- 15018Buena Vista712
- 15019Bulger1,056
- 15020Bunola481
- 15021Langeloth7,110
- 15022Charleroi9,959
- 15024Russellton9,325
- 15025Jefferson Hills16,939
- 15026Clinton4,175
- 15027Conway2,258
- 15028Coulter128
- 15030Arnold1,018
- 15031Cecil-Bishop382
- 15033Donora4,572
- 15034Dravosburg1,643
- 15035East McKeesport2,002
- 15037Blaine Hill10,417
- 15038Elrama279
- 15042Pine Run7,733
- 15043Hookstown2,253
- 15044Gibsonia27,370
- 15045Glassport4,368
- 15046Leetsdale2,141
- 15047Greenock203
- 15049Harwick974
- 15050Hookstown2,155
- 15051Dorseyville329
- 15052Industry borough2,873
- 15053Joffre127
- 15054Slovan352
- 15055Lawrence1,403
- 15056Leetsdale1,041
- 15057McDonald16,583
- 15059Ohioville4,070
- 15060Midway borough853
- 15061Beaver12,413
- 15062Monessen6,780
- 15063Monongahela10,525
- 15064Bridgeville360
- 15065Natrona Heights10,894
- 15066Unionville CDP12,048
- 15067New Eagle2,142
- 15068Lower Burrell36,203
- 15071Oakdale12,663
- 15072Lynnwood-Pricedale42
- 15074Unionville CDP8,550
- 15075Russellton22
- 15076Russellton1,010
- 15077Shippingport154
- 15078Slovan714
- 15081South Heights404
- 15082Sturgeon275
- 15083Industry CDP913
- 15084Russellton9,743
- 15085Level Green8,062
- 15086Seven Fields788
- 15087Webster85
- 15088West Elizabeth344
- 15089West Newton6,789
- 15090Bradford Woods25,763
- 15101Allison Park26,036
- 15102Bethel Park30,344
- 15104North Braddock8,034
- 15106Glendale19,244
- 15108Carnot-Moon42,799
- 15110Duquesne5,149
- 15112Chalfant3,655
- 15116Glenshaw14,461
- 15120West Homestead18,029
- 15122West Mifflin18,816
- 15123West Mifflin2
- 15126Imperial7,276
- 15129Gastonville10,789
- 15131White Oak8,209
- 15132McKeesport18,898
- 15133Liberty6,112
- 15135Coulter4,859
- 15136Thornburg22,623
- 15137East McKeesport10,043
- 15139Oakmont6,702
- 15140Pitcairn3,032
- 15142Rennerdale1,513
- 15143Sewickley Heights21,851
- 15144Springdale3,771
- 15145Turtle Creek6,695
- 15146Monroeville28,332
- 15147Verona15,798
- 15148Wall2,351
- 15201Pittsburgh13,333
- 15202Avalon19,564
- 15203Pittsburgh10,370
- 15204Pittsburgh8,467
- 15205Pennsbury Village24,060
- 15206Pittsburgh29,056
- 15207Pittsburgh10,961
- 15208Pittsburgh10,094
- 15209Etna12,328
- 15210Mount Oliver25,227
- 15211Pittsburgh10,728
- 15212Pittsburgh27,652
- 15213Pittsburgh30,466
- 15214Pittsburgh14,048
- 15215Sharpsburg11,907
- 15216Pittsburgh21,471
- 15217Pittsburgh25,795
- 15218Swissvale13,379
- 15219Pittsburgh11,376
- 15220Green Tree17,644
- 15221Wilkinsburg29,374
- 15222Pittsburgh5,725
- 15223Etna6,255
- 15224Pittsburgh10,665
- 15225Emsworth1,085
- 15226Pittsburgh13,999
- 15227Brentwood28,460
- 15228Castle Shannon18,236
- 15229West View15,188
- 15232Pittsburgh11,349
- 15233Pittsburgh2,596
- 15234Castle Shannon14,014
- 15235Churchill33,951
- 15236Whitehall31,313
- 15237West View43,588
- 15238Fox Chapel12,868
- 15239Plum21,410
- 15241Bridgeville22,294
- 15243Heidelberg13,456
- 15275Enlow86
- 15282Pittsburgh5,772
- 15301Washington50,348
- 15310New Freeport296
- 15311Marianna843
- 15312West Middletown3,603
- 15313Beallsville422
- 15314Bentleyville3,545
- 15315Bobtown1,078
- 15316Brave231
- 15317Southpointe43,871
- 15320Fairdale4,558
- 15321Cecil-Bishop2,025
- 15322Clarksville1,892
- 15323Claysville3,860
- 15324Cokeburg662
- 15325Crucible269
- 15327Bobtown1,092
- 15329Marianna1,390
- 15330Eighty Four6,023
- 15331Ellsworth891
- 15332Finleyville7,678
- 15333Deemston1,883
- 15334Mapletown339
- 15337Wind Ridge474
- 15338Mapletown1,356
- 15340Hickory1,524
- 15341Rogersville664
- 15342McGovern5,097
- 15344Jefferson1,541
- 15345Marianna1,547
- 15346Mather509
- 15347Meadowlands350
- 15348Millsboro39
- 15349Mount Morris1,498
- 15350Muse373
- 15351Nemacolin1,306
- 15352New Freeport635
- 15353Rogersville67
- 15357Crucible1,572
- 15358Centerville1,025
- 15359Rogersville330
- 15360Cokeburg1,690
- 15361Southview107
- 15362Brave550
- 15363Strabane605
- 15364Rogersville628
- 15365Taylorstown145
- 15366Van Voorhis550
- 15367McMurray9,906
- 15368Aaronsburg353
- 15370Waynesburg13,462
- 15376West Alexander1,441
- 15377Wind Ridge614
- 15379West Middletown64
- 15380Wind Ridge730
- 15401South Uniontown29,942
- 15410Edenborn728
- 15411Addison695
- 15412Allenport borough208
- 15413Allison526
- 15416Leith-Hatfield531
- 15417Hiller7,363
- 15419California3,421
- 15420Republic129
- 15421Deer Lake CDP207
- 15422Rowes Run302
- 15423California1,846
- 15424Confluence2,011
- 15425Connellsville17,545
- 15427Centerville789
- 15428Dawson1,763
- 15429Centerville551
- 15430Dawson224
- 15431Dunbar4,661
- 15432Dunlevy326
- 15433Crucible550
- 15434Elco280
- 15435Buffington85
- 15436Fairchance1,750
- 15437Farmington2,518
- 15438Roscoe1,915
- 15440Farmington297
- 15442Grindstone2,596
- 15443Buffington89
- 15444Hiller1,066
- 15445Hopwood2,314
- 15446Seven Springs35
- 15447Crucible73
- 15448Smithton150
- 15449Smock632
- 15450Aaronsburg2,252
- 15451Point Marion675
- 15454Edenborn313
- 15455Vanderbilt332
- 15456Lemont Furnace2,534
- 15458Edenborn2,620
- 15459Markleysburg1,861
- 15460Greensboro89
- 15461Masontown3,792
- 15462Donegal80
- 15463Republic59
- 15464Ohiopyle1,564
- 15465Lemont Furnace508
- 15466Newell413
- 15467Greensboro52
- 15468Buffington2,211
- 15469Seven Springs2,377
- 15470Ohiopyle601
- 15472Oliver166
- 15473Star Junction3,422
- 15474Point Marion2,456
- 15475Republic944
- 15476Ronco10
- 15477Roscoe733
- 15478Smithfield5,560
- 15479Smithton2,010
- 15480Smock1,766
- 15482Star Junction456
- 15483Stockdale291
- 15484South Uniontown792
- 15486Vanderbilt2,027
- 15488Smock74
- 15489Oliver146
- 15490Bear Rocks659
- 15492Perryopolis173
- 15501Edie16,240
- 15502Seven Springs113
- 15510Somerset2,118
- 15520Acosta301
- 15521Pleasantville1,712
- 15522Rainsburg11,111
- 15530Berlin5,299
- 15531Jennerstown3,603
- 15532Salisbury107
- 15533Everett1,222
- 15534Hyndman884
- 15535Rainsburg1,994
- 15536Needmore397
- 15537Earlston8,083
- 15538Hyndman867
- 15539New Paris158
- 15540Ursina418
- 15541Friedens3,112
- 15542Garrett1,088
- 15544Gray274
- 15545Hyndman2,562
- 15546Jennerstown437
- 15547Jennerstown862
- 15550Manns Choice1,658
- 15551Casselman609
- 15552Meyersdale5,685
- 15554New Paris2,726
- 15555Acosta69
- 15557New Centerville3,323
- 15558Salisbury1,960
- 15559Schellsburg2,084
- 15560Shanksville142
- 15561Acosta179
- 15562Salisbury344
- 15563Stoystown2,824
- 15564Wellersburg86
- 15565Salisbury25
- 15601Greensburg56,425
- 15610Donegal3,988
- 15611Adamsburg241
- 15612Scottdale443
- 15613Oklahoma borough12,854
- 15615North Irwin148
- 15616Youngwood363
- 15617Arona262
- 15618Spring Church2,386
- 15619Greensburg488
- 15620Bradenville801
- 15622Seven Springs682
- 15623Harrison City1,135
- 15624Crabtree218
- 15625Arona58
- 15626Delmont5,129
- 15627Millwood6,167
- 15628Donegal458
- 15629East Vandergrift631
- 15631Everson672
- 15632Murrysville8,377
- 15633Crabtree682
- 15634Grapeville421
- 15635Crabtree228
- 15636Harrison City3,560
- 15637Herminie1,821
- 15638Hostetter104
- 15639Hunker2,160
- 15640West Newton355
- 15641Hyde Park borough464
- 15642Irwin46,325
- 15644Jeannette18,512
- 15646Donegal161
- 15647North Irwin49
- 15650Hostetter26,312
- 15655Laurel Mountain357
- 15656West Leechburg9,506
- 15658Ligonier8,115
- 15660Sutersville299
- 15661Loyalhanna858
- 15662Crabtree969
- 15663Madison377
- 15665Manor1,339
- 15666Mount Pleasant15,980
- 15668Murrysville14,584
- 15670New Alexandria3,675
- 15671Millwood671
- 15672New Stanton3,321
- 15673North Apollo1,156
- 15674Norvelt158
- 15675Penn1,290
- 15676Calumet544
- 15677Laurel Mountain516
- 15678Herminie472
- 15679Wyano2,781
- 15680Avonmore230
- 15681Saltsburg4,698
- 15682Schenley234
- 15683Scottdale7,643
- 15684Slickville201
- 15686Spring Church1,102
- 15687Donegal1,241
- 15688Hunker612
- 15689Calumet92
- 15690Hyde Park borough8,985
- 15691Adamsburg302
- 15692Manor992
- 15693Hostetter277
- 15695Wyano181
- 15696Youngstown218
- 15697Youngwood2,877
- 15698Yukon789
- 15701Indiana31,269
- 15705Indiana3,101
- 15710Alverda188
- 15711Punxsutawney322
- 15712Glen Campbell42
- 15713Jacksonville131
- 15714Alverda5,205
- 15715Big Run505
- 15716Black Lick369
- 15717Blairsville9,206
- 15720Lucerne Mines382
- 15721Burnside161
- 15722Carrolltown2,358
- 15723Ernest26
- 15724Cherry Tree2,049
- 15725Jacksonville979
- 15727Jacksonville195
- 15728Clymer3,510
- 15729Commodore970
- 15730Worthville142
- 15731Coral200
- 15732Atwood1,606
- 15733Punxsutawney71
- 15734Dixonville176
- 15736Elderton386
- 15737Elmora123
- 15738Emeigh186
- 15739Ernest366
- 15741Glen Campbell45
- 15742Glen Campbell929
- 15744Punxsutawney44
- 15745Heilwood239
- 15746Cherry Tree105
- 15747Plumville1,641
- 15748Homer City7,343
- 15750Black Lick347
- 15752Jacksonville143
- 15753Westover463
- 15754Lucerne Mines266
- 15756Jacksonville196
- 15757Mahaffey1,272
- 15759Marion Center2,550
- 15760Northern Cambria127
- 15761Heilwood144
- 15762Nicktown887
- 15763Smicksburg15
- 15764Punxsutawney178
- 15765Heilwood1,469
- 15767Punxsutawney13,918
- 15770Worthville188
- 15771Marion Center903
- 15772Rossiter1,556
- 15773St. Benedict448
- 15774Shelocta2,602
- 15775Northern Cambria513
- 15776Worthville29
- 15777Commodore28
- 15778Timblin367
- 15779Blairsville526
- 15780Punxsutawney120
- 15781Punxsutawney89
- 15783Jacksonville113
- 15784Worthville49
- 15801Oklahoma CDP20,160
- 15821Byrnedale74
- 15823Crenshaw1,266
- 15824Brockway5,115
- 15825Brookville9,426
- 15827Byrnedale301
- 15828Vowinckel285
- 15829Corsica1,233
- 15831Kersey58
- 15832Driftwood289
- 15834Emporium4,015
- 15840Falls Creek1,928
- 15841Force226
- 15845Johnsonburg3,121
- 15846Kersey3,408
- 15847Brookville65
- 15848Luthersburg1,085
- 15849Penfield1,369
- 15851Reynoldsville7,059
- 15853Ridgway6,420
- 15856Luthersburg776
- 15857St. Marys12,736
- 158601,160
- 15861Sinnamahoning84
- 15863Sykesville159
- 15864Summerville1,789
- 15865Sykesville923
- 15866Troutville201
- 15868Weedville1,435
- 15870Wilcox1,109
- 15901Johnstown3,397
- 15902Oakland CDP11,462
- 15904Geistown16,026
- 15905Elim19,329
- 15906Brownstown borough9,504
- 15909Vinco4,571
- 15920Armagh695
- 15921Beaverdale269
- 15922Belsano82
- 15923Bolivar1,585
- 15924Central City740
- 15925Cassandra101
- 15926Indian Lake2,602
- 15927Colver846
- 15928Davidsville2,171
- 15929Armagh112
- 15930Dunlo413
- 15931Revloc8,919
- 15934University of Pittsburgh Johnstown36
- 15935Jerome2,514
- 15936Hooversville1,463
- 15937Jerome543
- 15938Lilly2,312
- 15940Loretto3,841
- 15942Vinco2,185
- 15943Nanty-Glo3,925
- 15944New Florence3,063
- 15945Parkhill173
- 15946Spring Hill6,561
- 15948Revloc391
- 15949Robinson716
- 15951St. Michael633
- 15952Salix1,015
- 15953Benson96
- 15954Seward2,279
- 15955Beaverdale2,399
- 15956South Fork2,274
- 15957Belsano262
- 15958Wilmore2,260
- 15960Twin Rocks163
- 15961Vintondale875
- 15962Wilmore391
- 15963Windber10,132
- 16001Shanor-Northvue39,234
- 16002Meadowood15,587
- 16020Boyers1,169
- 16022Bruin219
- 16023Saxonburg4,082
- 16024Callery210
- 16025Chicora4,793
- 16027Connoquenessing423
- 16028East Brady1,981
- 16029East Butler916
- 16030Eau Claire272
- 16033Evans City8,185
- 16034Fenelton1,752
- 16035Forestville252
- 16036Foxburg305
- 16037Harmony5,291
- 16038Barkeyville3,292
- 16040Boyers1,013
- 16041Karns City1,747
- 16045Homeacre-Lyndora1,136
- 16046Mars19,757
- 16048North Washington225
- 16049Parker2,965
- 16050Bruin1,097
- 16051Portersville3,119
- 16052Prospect2,215
- 16053Renfrew3,429
- 16054St. Petersburg333
- 16055Freeport8,993
- 16056Saxonburg4,232
- 16057West Liberty15,718
- 16059Bakerstown10,062
- 16061West Sunbury2,564
- 16063Zelienople8,256
- 16066Seven Fields33,873
- 16101South New Castle30,767
- 16102Mount Jackson4,929
- 16105New Castle Northwest15,418
- 16110Adamsville295
- 16111Atlantic1,282
- 16112Bessemer1,322
- 16113Clark358
- 16114Sheakleyville579
- 16115Darlington3,467
- 16116Frizzleburg2,727
- 16117Ellport15,786
- 16120Enon Valley2,221
- 16121Farrell4,199
- 16123Hazen2,335
- 16124Fredonia1,462
- 16125Greenville17,178
- 16127Grove City15,117
- 16130Sheakleyville1,810
- 16131Hartstown777
- 16132Hillsville327
- 16133Jackson Center1,425
- 16134Pymatuning South3,992
- 16136Koppel811
- 16137Mercer12,490
- 16140New Bedford293
- 16141New Beaver2,033
- 16142New Wilmington5,522
- 16143Pulaski2,100
- 16145Sandy Lake2,660
- 16146Sharon12,936
- 16148Hermitage16,545
- 16150Sharpsville6,856
- 16151Sheakleyville52
- 16153Stoneboro2,234
- 16154Reynolds Heights2,539
- 16155New Bedford98
- 16156Volant3,431
- 16157Chewton2,840
- 16159West Middlesex4,455
- 16160West Pittsburg909
- 16161Hermitage819
- 16172New Wilmington983
- 16201Applewold17,040
- 16210Templeton574
- 16211Plumville218
- 16212Ford Cliff261
- 16213Callensburg107
- 16214Strattanville8,494
- 16217Vowinckel77
- 16218East Brady1,000
- 16220Crown19
- 16222Dayton3,306
- 16223Distant65
- 16224Hawthorn763
- 16226Lenape Heights7,689
- 16228Ford Cliff409
- 16229Schenley4,798
- 16230Hawthorn501
- 16232Knox4,025
- 16233Leeper1,195
- 16235Leeper1,356
- 16236Manorville405
- 16238Manorville402
- 16239Marienville3,951
- 16240Hawthorn1,327
- 16242Distant4,513
- 16244Rural Valley342
- 16245Hawthorn196
- 16246Plumville152
- 16248Rimersburg3,216
- 16249Rural Valley1,791
- 16250Sagamore240
- 16253Distant87
- 16254Shippenville3,516
- 16255Sligo1,981
- 16256Smicksburg2,162
- 16258Strattanville1,837
- 16259Templeton1,911
- 16260Vowinckel293
- 16262Worthington2,772
- 16263Yatesboro259
- 16301Hasson Heights15,233
- 16311New Lebanon421
- 16312Sugar Grove31
- 16313Clarendon1,653
- 16314Cochranton5,188
- 16316Conneaut Lake4,562
- 16317Cooperstown1,220
- 16319Seneca961
- 16321Tionesta11
- 16322Tidioute159
- 16323Sugarcreek14,353
- 16326Tylersburg283
- 16327Guys Mills2,553
- 16328Hydetown231
- 16329Youngsville441
- 16331Knox123
- 16332Tylersburg121
- 16333Sheffield248
- 16334Shippenville453
- 16335Meadville27,175
- 16340Youngsville1,763
- 16341Pleasantville1,761
- 16342Polk2,126
- 16343Sugarcreek670
- 16344Rouseville460
- 16345Russell3,436
- 16346Seneca3,201
- 16347Sheffield1,596
- 16350Sugar Grove2,477
- 16351Tidioute1,576
- 16352Clarendon263
- 16353Tionesta2,473
- 16354Titusville9,989
- 16360Townville1,363
- 16361Tylersburg49
- 16362Utica1,066
- 16364Shippenville1,306
- 16365Warren17,292
- 16370Tionesta215
- 16371Youngsville3,211
- 16372Clintonville517
- 16373Emlenton3,254
- 16374Kennerdell1,672
- 16401Albion3,744
- 16402Bear Lake624
- 16403Cambridge Springs6,959
- 16404Centerville3,446
- 16405Columbus514
- 16406Conneautville3,388
- 16407Corry10,525
- 16410Cranesville1,931
- 16411Lake City1,325
- 16412Edinboro9,612
- 16415Fairview CDP10,104
- 16416Youngsville113
- 16417Platea8,599
- 16420Pleasantville515
- 16421Northwest Harborcreek2,289
- 16422Harmonsburg95
- 16423Lake City3,857
- 16424Pymatuning North4,503
- 16426McKean3,273
- 16427Mill Village204
- 16428North East12,595
- 16430Lake City148
- 16433Saegertown4,694
- 16434Spartansburg3,120
- 16435Springboro1,677
- 16436Columbus639
- 16438Union City7,421
- 16440Venango787
- 16441Waterford9,134
- 16442Wattsburg3,050
- 16443Albion1,196
- 16444Edinboro1,190
- 16475Albion2,194
- 16501Erie2,022
- 16502Erie15,995
- 16503Erie15,753
- 16504Erie15,931
- 16505Erie15,270
- 16506McKean24,070
- 16507Erie8,597
- 16508Erie14,958
- 16509Erie28,595
- 16510Penn State Erie24,198
- 16511Northwest Harborcreek11,776
- 16546Erie929
- 16563Penn State Erie1,607
- 16601Altoona33,515
- 16602Altoona26,352
- 16611Alexandria2,665
- 16613Ashville1,647
- 16616Glen Hope103
- 16617Bellwood2,392
- 16619Blandburg393
- 16620Brisbin326
- 16621Broad Top City604
- 16622Cassville82
- 16623Cassville492
- 16624Chest Springs253
- 16625Klahr3,147
- 16627Blain City1,927
- 16630Cresson4,726
- 16631Curryville57
- 16633Defiance313
- 16634Dudley262
- 16635Foot of Ten12,003
- 16636Wopsononock808
- 16637East Freedom2,345
- 16638Beavertown CDP58
- 16639Blandburg1,390
- 16640Flinton1,077
- 16641Gallitzin2,348
- 16645Glen Hope204
- 16646Hastings2,185
- 16647Marklesburg864
- 16648Linds Crossing14,904
- 16650Hopewell1,796
- 16651Brisbin5,484
- 16652Huntingdon15,866
- 16654Huntingdon1,906
- 16655Cotton Town1,427
- 16656Irvona1,148
- 16657Marklesburg1,170
- 16659Woodbury255
- 16661Madera944
- 16662Fredericksburg6,069
- 16664Woodbury2,195
- 16665Newry253
- 16666Osceola Mills2,999
- 16667St. Clairsville1,371
- 16668Patton3,507
- 16669Ramblewood2,099
- 16670Cotton Town89
- 16671Ramey411
- 16672Coaldale177
- 16673Ore Hill5,204
- 16674Robertsdale548
- 16675Hastings88
- 16677Sandy Ridge239
- 16678Saxton2,452
- 16679Coaldale656
- 16680Ramey359
- 16682Claysburg402
- 16683Warriors Mark353
- 16684Tipton108
- 16685Cassville303
- 16686Tyrone13,427
- 16689Hustontown389
- 16691Wells Tannery325
- 16692Westover923
- 16693Franklin Forge3,795
- 16694Broad Top City355
- 16695Woodbury941
- 16701University of Pittsburgh Bradford16,556
- 16720Austin1,261
- 16724Smethport69
- 16725Lewis Run147
- 16726Mount Jewett665
- 16727Foster Brook37
- 16729Eldred684
- 16730Smethport27
- 16731Eldred2,407
- 16732Lewis Run241
- 16733Mount Jewett226
- 16734James City174
- 16735James City6,149
- 16738Lewis Run2,118
- 16740Mount Jewett878
- 16743Port Allegany4,061
- 16744Rew187
- 16745Rew592
- 16746Roulette1,046
- 16748Shinglehouse2,908
- 16749Smethport3,777
- 16750Eldred464
- 16801State College40,774
- 16802State College14,793
- 16803Park Forest Village23,977
- 16820Woodward1,457
- 16821Allport93
- 16822Monument1,784
- 16823Bellefonte29,126
- 16825Bigler231
- 16826Eagleville439
- 16827Boalsburg5,123
- 16828Centre Hall5,000
- 16829Clarence762
- 16830Plymptonville13,526
- 16832Coburn224
- 16833Grampian5,021
- 16834Drifting733
- 16835Unionville borough199
- 16836Frenchville1,057
- 16837Glen Richey81
- 16838Grampian1,821
- 16839Grassflat392
- 16840Hawk Run476
- 16841Howard6,477
- 16843Hyde165
- 16844Eagle Creek2,606
- 16845Clarence1,010
- 16847Kylertown221
- 16848Lamar215
- 16849Lanse149
- 16851Lemont974
- 16852Madisonburg203
- 16853Milesburg242
- 16854Millheim883
- 16855Woodland172
- 16856Mingoville160
- 16858Kylertown3,945
- 16859Moshannon500
- 16860Hawk Run358
- 16861Glen Hope327
- 16863Glen Richey586
- 16864Orviston69
- 16865Ramblewood1,820
- 16866Philipsburg9,152
- 16868Pine Grove Mills1,050
- 16870Port Matilda7,499
- 16871Karthaus47
- 16872Tylersville1,430
- 16874Snow Shoe1,220
- 16875Spring Mills3,708
- 16876Wallaceton285
- 16877Warriors Mark1,524
- 16878West Decatur1,783
- 16879Winburne406
- 16881Woodland2,245
- 16882Woodward429
- 16901Wellsboro10,242
- 16910Alba64
- 16911Arnot259
- 16912Blossburg2,507
- 16914Troy2,354
- 16915Sweden Valley5,600
- 16917Blossburg1,293
- 16920Elkland1,760
- 16921Galeton622
- 16922Galeton1,575
- 16923Genesee1,457
- 16925Millerton3,268
- 16926Alba926
- 16927Ulysses614
- 16928Knoxville1,476
- 16929Lawrenceville2,666
- 16930Liberty1,119
- 16932Mainesburg546
- 16933Mansfield6,610
- 16935Knoxville1,181
- 16936Millerton1,940
- 16937Ulysses167
- 16938837
- 16939Morris Run172
- 16940Elkland19
- 16941Genesee94
- 16942Elkland892
- 16943Sabinsville417
- 16946Tioga2,455
- 16947Troy4,797
- 16948Ulysses1,570
- 16950Westfield3,327
- 17002Mill Creek451
- 17003Annville12,534
- 17004Belleville5,551
- 17005Berrysburg289
- 17006Blain1,102
- 17007Boiling Springs5,865
- 17009Burnham1,765
- 17010Campbelltown160
- 17011Camp Hill39,664
- 17013Schlusser38,513
- 17014Richfield174
- 17015Carlisle24,385
- 17016Cornwall909
- 17017Dalmatia1,509
- 17018Linglestown3,902
- 17019Franklintown19,594
- 17020Duncannon8,826
- 17021East Waterford912
- 17022Elizabethtown31,908
- 17023Berrysburg3,489
- 17024Loysville1,734
- 17025Enola17,648
- 17026Fredericksburg3,137
- 17027Messiah College2,801
- 17028Skyline View3,563
- 17029Granville382
- 17030Gratz541
- 17032Elizabethville7,551
- 17033Hershey16,481
- 17034Highspire3,071
- 17035East Waterford864
- 17036Hummelstown23,520
- 17037Ickesburg1,176
- 17038Jonestown borough8,394
- 17039Schaefferstown38
- 17040Landisburg2,631
- 17041Timber Hills190
- 17042Cornwall40,161
- 17043Lemoyne5,852
- 17044Juniata Terrace20,234
- 17045Liverpool3,811
- 17046Sand Hill31,835
- 17047Loysville3,228
- 17048Wiconsico3,870
- 17049McAlisterville3,046
- 17050New Kingstown43,571
- 17051Atkinson Mills4,352
- 17052Cassville1,474
- 17053Duncannon5,067
- 17054Mattawana286
- 17055Messiah College42,006
- 17056Mexico27
- 17057Middletown borough23,560
- 17058Granville1,578
- 17059Mifflintown8,013
- 17060Allensville1,248
- 17061Millersburg6,842
- 17062Millerstown borough3,917
- 17063Siglerville3,177
- 17064Mount Gretna839
- 17065Idaville4,389
- 17066Allenport CDP5,102
- 17067Myerstown15,815
- 17068Bloomfield4,235
- 17069New Buffalo192
- 17070New Market16,830
- 17071East Waterford116
- 17073Schaefferstown6,314
- 17074Newport7,304
- 17075Newton Hamilton125
- 17077Jonestown borough108
- 17078Campbelltown23,840
- 17080Pillow264
- 17081Plainfield248
- 17082Port Royal3,046
- 17084Lumber City4,683
- 17086Richfield1,982
- 17087Mount Aetna2,370
- 17088Schaefferstown459
- 17090Schlusser5,206
- 17093Enola684
- 17094Thompsontown2,424
- 17097Wiconsico721
- 17098Williamstown2,618
- 17099Yeagertown1,187
- 17101Harrisburg2,722
- 17102Harrisburg8,118
- 17103Harrisburg13,115
- 17104Harrisburg18,541
- 17109Progress27,466
- 17110Harrisburg27,364
- 17111Rutherford36,744
- 17112Linglestown38,502
- 17113Bressler11,724
- 17201Chambersburg27,554
- 17202Chambersburg33,566
- 17210Newburg borough242
- 17211354
- 17212Needmore750
- 17213Shirleysburg525
- 17214Blue Ridge Summit1,143
- 17215Burnt Cabins182
- 17217Shade Gap182
- 17219484
- 17220Shade Gap347
- 17221Burnt Cabins458
- 17222Fayetteville10,550
- 17223Burnt Cabins326
- 17224Fort Loudon1,603
- 17225Greencastle20,347
- 17228Hustontown1,000
- 17229Hustontown1,253
- 17232Orrstown27
- 17233McConnellsburg4,961
- 17235Marion622
- 17236Mercersburg8,845
- 17237Mont Alto1,759
- 17238Needmore1,782
- 17239Shade Gap209
- 17240Newburg borough3,241
- 17241Newville11,181
- 17243Shirleysburg1,264
- 17244Orrstown2,263
- 17246Orrstown542
- 17247Mont Alto629
- 17249Rockhill386
- 17251Orrstown70
- 17252Fort Loudon4,038
- 17253Saltillo433
- 17254Scotland362
- 17255Shade Gap992
- 17257Shippensburg University29,204
- 17260Shirleysburg1,090
- 17262Shade Gap1,048
- 17263State Line896
- 17264Three Springs2,292
- 17265Burnt Cabins300
- 17266Newville445
- 17267Warfordsburg2,916
- 17268Waynesboro29,362
- 17271Burnt Cabins527
- 17301Abbottstown4,133
- 17302Susquehanna Trails2,834
- 17303Arendtsville395
- 17304Aspers3,171
- 17306Bendersville537
- 17307Arendtsville5,467
- 17309Felton1,393
- 17311Jefferson127
- 17313Dallastown11,428
- 17314Delta6,640
- 17315Dover25,760
- 17316Lake Meade8,497
- 17317East Prospect466
- 17318Emigsville230
- 17319Valley Green11,292
- 17320Carroll Valley8,124
- 17321Fawn Grove2,419
- 17322Felton6,473
- 17323Franklintown83
- 17324Idaville4,433
- 17325Gettysburg30,373
- 17327Glen Rock7,828
- 17329Jefferson2,999
- 17331Parkville56,443
- 17339Lewisberry6,281
- 17340Littlestown11,405
- 17342Loganville563
- 17343McKnightstown31
- 17344McSherrystown3,719
- 17345Manchester7,715
- 17347Saginaw6,393
- 17349Shrewsbury8,254
- 17350New Oxford13,169
- 17352Fawn Grove1,288
- 17353Cashtown2,825
- 17355Railroad322
- 17356Windsor22,869
- 17360Seven Valleys5,735
- 17361Shrewsbury6,156
- 17362Spring Grove14,730
- 17363Stewartstown8,553
- 17364Spring Grove4,209
- 17365Wellsville2,897
- 17366Windsor6,392
- 17368East Prospect7,005
- 17370Valley Green7,090
- 17371New Salem borough375
- 17372York Springs4,045
- 17401York18,570
- 17402East York37,466
- 17403Tyler Run40,287
- 17404Shiloh39,374
- 17406Yorklyn23,636
- 17407Jacobus2,673
- 17408New Salem borough25,431
- 17501Akron4,614
- 17502Bainbridge2,485
- 17504Millersville105
- 17505Witmer2,358
- 17506Blue Ball469
- 17507Bowmansville64
- 17508Brownstown CDP1,125
- 17509Georgetown CDP5,135
- 17512Columbia18,148
- 17516Conestoga5,180
- 17517Denver14,686
- 17518Wakefield1,360
- 17519Goodville7,127
- 17520East Petersburg5,040
- 17522Ephrata33,852
- 17527Gap6,094
- 17529Intercourse4,826
- 17532Conestoga3,328
- 17535Gap3,042
- 17536Kirkwood3,452
- 17538Landisville7,314
- 17540Leola10,728
- 17543Lititz45,912
- 17545Manheim23,556
- 17547Maytown9,210
- 17550Maytown313
- 17551Millersville11,753
- 17552Mount Joy19,761
- 17554Mountville7,453
- 17555Churchtown7,251
- 17557New Holland15,055
- 17560Refton5,460
- 17562Georgetown CDP4,373
- 17563Wakefield3,952
- 17565Conestoga2,523
- 17566Quarryville12,603
- 17569Reinholds7,323
- 17570Rheems176
- 17572Soudersburg3,643
- 17576Smoketown103
- 17578Stevens7,504
- 17579Strasburg6,875
- 17581Terre Hill180
- 17582Washington Boro1,702
- 17584Refton11,646
- 17601Lancaster56,382
- 17602Lampeter52,217
- 17603Lancaster67,571
- 17606East Petersburg404
- 17701Montoursville43,104
- 17702Duboistown10,488
- 17720Oval250
- 17721Avis1,419
- 1772334
- 17724Canton4,693
- 1772741
- 17728Garden View4,675
- 17729156
- 17730Dewart11
- 17731Eagles Mere188
- 17737Picture Rocks5,970
- 1773927
- 17740Jersey Shore12,017
- 17742Picture Rocks21
- 17744Salladasburg2,808
- 17745Woolrich17,718
- 17747Loganton3,421
- 17748McElhattan184
- 17749McEwensville234
- 17750Mackeyville177
- 17751Mill Hall7,431
- 17752Montgomery4,975
- 17754Montoursville12,061
- 17756Hughesville12,856
- 17758Eagles Mere943
- 17760North Bend572
- 17762Picture Rocks557
- 17763241
- 17764Renovo2,361
- 17765Liberty1,279
- 17768Canton367
- 1776931
- 17771Liberty2,929
- 17772Turbotville2,693
- 17774Waller962
- 17776145
- 17777McEwensville7,030
- 17778Sinnamahoning74
- 17779Woolrich179
- 17801Sunbury16,429
- 17810Allenwood5,309
- 17812Beaver Springs1,378
- 17813Troxelville2,028
- 17814Jamison City4,669
- 17815Lightstreet29,790
- 17820Slabtown5,499
- 17821Danville18,613
- 17822Danville11
- 17823Herndon1,258
- 17824Elysburg3,949
- 17827Freeburg877
- 17829Hartleton212
- 17830Herndon1,938
- 17832Marion Heights578
- 17834Kulpmont3,480
- 17835Laurelton114
- 17836Fairview-Ferndale190
- 17837Linntown18,403
- 17840Locust Gap188
- 17841McClure4,896
- 17842Middleburg8,266
- 17844Mifflinburg10,291
- 17845Laurelton2,058
- 17846Iola3,621
- 17847Milton11,260
- 17850Montandon576
- 17851Atlas7,234
- 17853Mount Pleasant Mills2,993
- 17855New Berlin1,014
- 17856New Columbia3,167
- 17857Northumberland7,671
- 17858Wilburton Number One111
- 17859Rohrsburg2,701
- 17860Tharptown2,332
- 17861Paxtonville152
- 17862Penns Creek530
- 17864Port Trevorton2,495
- 17865Milton24
- 17866Fairview-Ferndale9,769
- 17867Klingerstown239
- 17868Riverside borough719
- 17870Selinsgrove14,490
- 17872Trevorton8,894
- 17876Shamokin Dam1,827
- 17878New Columbus1,488
- 17880Hartleton29
- 17881Trevorton1,479
- 17884Washingtonville263
- 17885Woodward181
- 17886West Milton804
- 17887Watsontown591
- 17888Wilburton Number Two446
- 17889Kratzerville3,039
- 17901Minersville22,371
- 17920Aristes246
- 17921Gordon6,931
- 17922Auburn4,803
- 17923Branchdale385
- 17925Brockton305
- 17929Cressona1,432
- 17930New Philadelphia258
- 17931Altamont8,899
- 17933Friedensburg123
- 17934Gilberton417
- 17935Girardville1,371
- 17936Gordon959
- 17938Hegins2,479
- 17941Klingerstown733
- 17943Lavelle42
- 17944Llewellyn265
- 17945Locustdale133
- 17946Girardville185
- 17948Mahanoy City4,188
- 17949Gilberton240
- 17951Marlin281
- 17952Maryd172
- 17953Middleport426
- 17954Minersville4,623
- 17957Muir481
- 17959St. Clair borough1,445
- 17960New Ringgold4,264
- 17961Deer Lake borough6,740
- 17963Ravine9,323
- 17964Hegins952
- 17965Port Carbon1,927
- 17967Ringtown2,202
- 17968Klingerstown321
- 17970St. Clair borough3,171
- 17972Summit Station11,826
- 17974Seltzer312
- 17976Shenandoah5,916
- 17978Williamstown688
- 17979Summit Station130
- 17980Wiconsico3,342
- 17981Tremont2,468
- 17982Tuscarora452
- 17983Valley View1,541
- 17985Nuremberg1,237
- 18011Mertztown5,338
- 18012Palmerton32
- 18013East Bangor17,597
- 18014Chapman12,097
- 18015Hellertown34,852
- 18017Bethlehem40,640
- 18018Bethlehem32,965
- 18020Middletown CDP21,204
- 18030Bowmanstown483
- 18031Breinigsville11,570
- 18032Catasauqua9,555
- 18034DeSales University9,209
- 18035Cherryville39
- 18036Coopersburg15,581
- 18037Egypt7,472
- 18038Cherryville3,549
- 18040Tatamy17,256
- 18041East Greenville5,768
- 18042Glendon45,532
- 18045Palmer Heights30,429
- 18046Wescosville201
- 18049Emmaus18,941
- 18051Maxatawny3,624
- 18052Hokendauqua29,451
- 18053Slatedale2,344
- 18054Green Lane4,932
- 18055Hellertown12,117
- 18056Hereford1,489
- 18058Effort9,674
- 18059Laurys Station744
- 18062Alburtis27,110
- 18063Martins Creek606
- 18064Nazareth26,970
- 18065Schnecksville577
- 18066New Tripoli6,102
- 18067Northampton19,590
- 18069Schnecksville8,515
- 18070Hereford223
- 18071Palmerton11,313
- 18072Pen Argyl6,938
- 18073Red Hill borough11,755
- 18074Green Lane5,590
- 18076Red Hill borough2,833
- 18077Riegelsville2,203
- 18078Schnecksville7,857
- 18079Slatedale303
- 18080Slatedale11,226
- 18081Hellertown85
- 18083Stockertown489
- 18085Tatamy1,175
- 18086Laurys Station229
- 18087Trexlertown590
- 18088Cherryville8,488
- 18091Wind Gap6,547
- 18092Hereford3,230
- 18101Allentown6,120
- 18102Allentown51,001
- 18103Allentown48,746
- 18104Cetronia48,683
- 18106Wescosville6,226
- 18109Catasauqua18,446
- 18201Hazleton32,067
- 18202West Hazleton13,755
- 18210Towamensing Trails7,587
- 18211Summit Hill1,207
- 18212Bowmanstown43
- 18214Park Crest2,522
- 18216Beaver Meadows957
- 18218Coaldale2,514
- 18219Conyngham1,047
- 18220Delano170
- 18221Jeddo436
- 18222Pardeesville9,789
- 18224Freeland6,031
- 18229Weissport East9,248
- 18230Beaver Meadows152
- 18231Kelayres413
- 18232Lansford4,156
- 18234Lattimer616
- 18235Weissport East19,158
- 18237Delano3,712
- 18240Nesquehoning3,913
- 18241Nuremberg249
- 18242Oneida371
- 18244Parryville365
- 18245Delano216
- 18246Nuremberg84
- 18248Sheppton599
- 18249Conyngham4,191
- 18250Summit Hill3,137
- 18252Tamaqua11,024
- 18254Tresckow696
- 18255Weatherly4,223
- 18256Weston185
- 18301East Stroudsburg28,977
- 18302Saw Creek17,733
- 18321Penn Estates1,844
- 18322Brodheadsville2,724
- 18323Mountainhome222
- 18324Pine Ridge9,935
- 18325Mountainhome2,700
- 18326Mountainhome3,559
- 18327Delaware Water Gap723
- 18328Birchwood Lakes8,185
- 18330Sun Valley8,219
- 18331Effort655
- 18332Penn Estates3,508
- 18333Effort115
- 18334Emerald Lakes4,539
- 18335Saw Creek974
- 18336Matamoras4,114
- 18337Pocono Woodland Lakes15,799
- 18340Matamoras177
- 18342Mountainhome503
- 18343Mount Bethel3,637
- 18344Mount Pocono3,385
- 18346Pocono Pines2,128
- 18347Pocono Pines3,733
- 18349Mount Pocono85
- 18350Pocono Pines902
- 18351Portland546
- 18353Saylorsburg10,953
- 18354Saylorsburg1,243
- 18355Emerald Lakes1,615
- 18357Mountainhome147
- 18360Arlington Heights30,080
- 18370Mount Pocono671
- 18371Saw Creek737
- 18372Penn Estates2,599
- 18403Archbald6,851
- 18405Fawn Lake Forest2,412
- 18407Carbondale14,445
- 18411Clarks Summit22,820
- 18413Forest City81
- 18414Dalton5,444
- 18415966
- 184171,298
- 18419Factoryville4,734
- 18420Nicholson69
- 18421Forest City4,603
- 18424Big Bass Lake5,213
- 18425Fawn Lake Forest946
- 18426The Escape3,705
- 18428Hawley12,634
- 18430Union Dale57
- 18431Bethany12,775
- 18433Mayfield7,564
- 18434Jessup4,031
- 18435Masthope907
- 18436The Hideout13,569
- 18437Starrucca137
- 18438Wallenpaupack Lake Estates1,139
- 18439Starrucca390
- 18440Factoryville35
- 18441Forest City405
- 18443327
- 18444Moscow13,604
- 18445Pocono Springs2,342
- 18446Nicholson3,209
- 18447Blakely9,470
- 18451Wallenpaupack Lake Estates413
- 18452Blakely5,203
- 18453Union Dale1,286
- 18454Starrucca97
- 18455Starrucca148
- 18456Prompton319
- 18457Fawn Lake Forest9
- 18458Pocono Woodland Lakes3,792
- 18460Pocono Springs118
- 18461Starrucca202
- 18462Starrucca543
- 18463Lake Wallenpaupack Estates268
- 18464Wallenpaupack Lake Estates1,927
- 18465Thompson1,324
- 18466Gouldsboro17,794
- 18469Bethany629
- 18470Union Dale2,139
- 18471Waverly667
- 18472Waymart6,601
- 18473White Mills511
- 18503Scranton1,629
- 18504Scranton21,069
- 18505Scranton20,797
- 18507Moosic5,443
- 18508Scranton11,565
- 18509Scranton13,055
- 18510Scranton14,332
- 18512Dunmore12,986
- 18517Taylor5,303
- 18518Old Forge8,573
- 18519Dickson City5,266
- 18602Bear Creek Village628
- 18603Foundryville18,827
- 18610Indian Mountain Lake5,079
- 18612Misericordia University17,739
- 18614Mildred1,986
- 18615West Falls1,646
- 18616Forksville734
- 18617Glen Lyon1,791
- 18618Harveys Lake3,570
- 18619Eagles Mere162
- 18621Silkworth4,744
- 18622New Columbus252
- 18623Laceyville2,298
- 18624Holiday Pocono487
- 18625Lake Winola114
- 18626Laporte505
- 18628Mildred185
- 18629Mehoopany1,760
- 18630Meshoppen2,923
- 18631Mifflinville1,100
- 18632Mildred430
- 18634Sheatown13,785
- 18635Nescopeck3,734
- 18636Noxen1,610
- 18640Dupont16,581
- 18641Avoca6,305
- 18642Duryea4,530
- 18643Exeter12,848
- 18644West Wyoming7,552
- 18651Plymouth8,703
- 18655Shickshinny6,018
- 18656Pikes Creek2,066
- 18657Tunkhannock10,866
- 18660Mocanaqua3,137
- 18661East Side5,759
- 18701Wilkes-Barre4,294
- 18702Bear Creek Village41,970
- 18704Pringle31,149
- 18705Plains15,624
- 18706Ashley16,387
- 18707Mountain Top16,689
- 18708Chase8,867
- 18709Luzerne2,910
- 18801South Montrose8,102
- 18810Athens5,774
- 18812Laurel Lake1,537
- 18814Burlington200
- 18816Springville132
- 18817East Smithfield74
- 18818Friendsville1,371
- 18820Harford36
- 18821Great Bend1,044
- 18822Hallstead3,084
- 18823Harford132
- 18824Hop Bottom1,408
- 18825Lakeside137
- 18826Harford1,466
- 18828LeRaysville146
- 18829LeRaysville754
- 18830Little Meadows593
- 18831East Smithfield1,081
- 18832Monroe1,924
- 18833New Albany2,089
- 18834New Milford3,245
- 18837Rome2,936
- 18840Sayre10,968
- 18842Harford121
- 18843South Montrose345
- 18844Springville1,335
- 18845LeRaysville489
- 18846Wyalusing770
- 18847Susquehanna Depot5,104
- 18848Towanda8,199
- 18850Ulster2,070
- 18851Little Meadows615
- 18853Wyalusing4,028
- 18854Rome1,595
- 18901Doylestown28,509
- 18902Plumsteadville22,898
- 18912Doylestown213
- 18913Plumsteadville243
- 18914Chalfont21,598
- 18915Montgomeryville1,648
- 18917Dublin2,216
- 18920Plumsteadville393
- 18921Riegelsville160
- 18923Plumsteadville984
- 18925Doylestown6,250
- 18927Silverdale239
- 18929Ivyland9,748
- 18930Riegelsville1,892
- 18932Chalfont436
- 18933New Hope105
- 18935Milford Square273
- 18936Montgomeryville296
- 18938New Hope13,649
- 18940Newtown Grant29,626
- 18942Plumsteadville2,377
- 18944Dublin27,570
- 18946Newtown Grant689
- 18947Plumsteadville6,477
- 18950Plumsteadville262
- 18951Quakertown36,568
- 18954Richboro10,380
- 18955Richlandtown1,511
- 18960Sellersville13,597
- 18962Silverdale531
- 18964Souderton14,546
- 18966Churchville36,370
- 18969Telford15,245
- 18970Trumbauersville553
- 18972Riegelsville3,104
- 18974Ivyland43,122
- 18976New Britain22,202
- 18977Yardley4,569
- 18980Newtown Grant308
- 19001Roslyn17,867
- 19002Spring House32,128
- 19003Ardmore14,255
- 19004Bala Cynwyd11,230
- 19006Bryn Athyn23,443
- 19007Bristol21,800
- 19008Broomall20,697
- 19009Bryn Athyn1,124
- 19010Rosemont21,827
- 19012Oak Lane6,910
- 19013Chester35,064
- 19014Village Green-Green Ridge21,427
- 19015Brookhaven16,464
- 19017Chester Heights355
- 19018Clifton Heights23,505
- 19020Eddington56,809
- 19021Croydon9,638
- 19022Eddystone4,482
- 19023Collingdale22,247
- 19025Fort Washington7,423
- 19026Drexel Hill32,725
- 19027Elkins Park20,420
- 19029Norwood3,980
- 19030Fairless Hills12,305
- 19031Flourtown4,929
- 19032Folcroft6,772
- 19033Folsom8,261
- 19034Fort Washington7,488
- 19035Conshohocken3,937
- 19036Glenolden13,668
- 19038Oreland32,296
- 19040Hatboro22,078
- 19041Haverford College6,308
- 19043Glenolden3,317
- 19044Horsham17,279
- 19046McKinley19,640
- 19047Langhorne34,563
- 19050East Lansdowne29,373
- 19052Chester Heights631
- 19053Trevose28,509
- 19054Levittown17,518
- 19055Levittown13,833
- 19056Levittown15,960
- 19057Levittown17,925
- 19060Boothwyn11,524
- 19061Linwood19,896
- 19063Media38,172
- 19064Morton25,277
- 19066Merion Station5,839
- 19067Woodside53,885
- 19070Morton6,359
- 19072Narberth10,129
- 19073Berwyn21,915
- 19074Norwood5,934
- 19075Oreland7,384
- 19076Prospect Park borough6,441
- 19078Ridley Park11,683
- 19079Sharon Hill8,745
- 19081Swarthmore10,089
- 19082Millbourne41,541
- 19083Drexel Hill37,590
- 19085Villanova11,230
- 19086Rose Valley12,930
- 19087Wayne33,528
- 19090Willow Grove19,662
- 19094Woodlyn3,929
- 19095Wyncote8,030
- 19096Wynnewood15,249
- 19102Philadelphia6,195
- 19103Philadelphia25,900
- 19104Philadelphia55,172
- 19106Philadelphia14,597
- 19107Philadelphia14,825
- 19108Philadelphia154
- 19111Philadelphia66,283
- 19114Philadelphia30,411
- 19115Philadelphia35,279
- 19116Philadelphia33,654
- 19118Philadelphia9,978
- 19119Philadelphia28,356
- 19120Philadelphia66,469
- 19121Philadelphia41,574
- 19122Philadelphia25,439
- 19123Philadelphia19,681
- 19124Philadelphia71,004
- 19125Philadelphia25,140
- 19126Philadelphia17,483
- 19127Philadelphia5,664
- 19128Philadelphia38,039
- 19129Philadelphia11,937
- 19130Philadelphia30,116
- 19131Philadelphia43,776
- 19132Philadelphia33,006
- 19133Philadelphia24,864
- 19134Philadelphia53,594
- 19135Philadelphia33,803
- 19136Philadelphia36,262
- 19137Philadelphia8,026
- 19138Philadelphia30,821
- 19139Philadelphia43,090
- 19140Philadelphia53,385
- 19141Philadelphia32,385
- 19142Philadelphia28,829
- 19143Philadelphia62,572
- 19144Philadelphia50,580
- 19145Philadelphia43,440
- 19146Philadelphia41,058
- 19147Philadelphia39,704
- 19148Philadelphia50,400
- 19149Philadelphia56,914
- 19150Philadelphia24,304
- 19151Philadelphia33,267
- 19152Philadelphia35,955
- 19153Philadelphia13,018
- 19154Philadelphia33,796
- 19301Paoli7,814
- 19310Atglen2,950
- 19311Avondale11,692
- 19312Berwyn12,283
- 19316Glenmoore389
- 19317Chadds Ford10,864
- 19319Cheyney University792
- 19320South Coatesville55,941
- 19330Cochranville5,957
- 19333Berwyn7,471
- 19335Downingtown53,629
- 19341Exton21,709
- 19342Chester Heights20,770
- 19343Glenmoore8,450
- 19344Honey Brook12,827
- 19345Frazer768
- 19348Kennett Square23,621
- 19350West Grove10,945
- 19352Lincoln University11,484
- 19355Malvern29,425
- 19358Modena191
- 19362Nottingham6,092
- 19363Oxford18,231
- 19365Parkesburg8,006
- 19367Pomeroy21
- 19369Sadsburyville122
- 19372Thorndale1,854
- 19373Dilworthtown2,357
- 19374Toughkenamon434
- 19375Unionville CDP234
- 19380West Chester49,856
- 19382West Chester54,127
- 19383West Chester6,537
- 19390West Grove12,546
- 19401Norristown43,359
- 19403Trooper44,017
- 19405Swedeland5,145
- 19406King of Prussia30,362
- 19422Blue Bell20,412
- 19425Eagle17,219
- 19426Evansburg43,460
- 19428Conshohocken20,411
- 19435Gilbertsville75
- 19436North Wales435
- 19437Spring House531
- 19438Harleysville25,438
- 19440Hatfield19,431
- 19444Plymouth Meeting11,065
- 19446Lansdale61,848
- 19453Mont Clare1,259
- 19454Montgomeryville27,755
- 19456Oaks286
- 19457Kenilworth148
- 19460Phoenixville45,423
- 19462Plymouth Meeting16,331
- 19464Pottsgrove49,101
- 19465Pughtown18,564
- 19468Royersford28,194
- 19472Gilbertsville54
- 19473Schwenksville17,259
- 19474Skippack222
- 19475Spring City12,298
- 19477Spring House136
- 19490Skippack507
- 19492Spring Mount811
- 19501Adamstown823
- 19503Bally1,149
- 19504Bally5,335
- 19505Bechtelsville3,135
- 19506Bernville7,108
- 19507Bethel3,563
- 19508Birdsboro14,871
- 19510Blandon8,010
- 19511Bowers33
- 19512Boyertown15,794
- 19516Centerport176
- 19518Amity Gardens16,805
- 19520Elverson6,277
- 19522Fleetwood14,127
- 19523New Morgan41
- 19525Gilbertsville17,725
- 19526West Hamburg11,581
- 19529Kempton3,109
- 19530Kutztown15,573
- 19533Leesport8,648
- 19534Lenhartsville1,970
- 19535Jacksonwald42
- 19536Lyons466
- 19538Maxatawny64
- 19539Mertztown3,823
- 19540Alleghenyville11,957
- 19541Centerport4,367
- 19543New Morgan6,401
- 19544Mount Aetna199
- 19545New Berlinville868
- 19547Oley4,579
- 19549Port Clinton271
- 19550Rehrersburg488
- 19551Robesonia4,778
- 19554Shartlesville338
- 19555Shoemakersville3,577
- 19559Strausstown302
- 19560Alsace Manor9,137
- 19562Topton2,947
- 19564Virginville265
- 19565Wernersville9,302
- 19567Stouchsburg6,057
- 19601Reading36,479
- 19602Reading18,495
- 19604Reading30,124
- 19605Riverview Park21,419
- 19606Stony Creek Mills35,853
- 19607Grill24,045
- 19608Sinking Spring24,178
- 19609West Lawn9,874
- 19610Wyomissing16,581
- 19611Reading10,986
Towns and townships
Each of the 1,548 with people in it, from ACS 2020–2024 5-year estimates: the county subdivisions that are governments of their own. A city, borough or village that is one too is listed with the places above.
- Abbott township235
- Abington township58,664
- Adams township (Butler County)15,282
- Adams township (Cambria County)5,691
- Adams township (Snyder County)934
- Addison township1,059
- Albany township (Berks County)1,743
- Albany township (Bradford County)983
- Aleppo township (Allegheny County)1,747
- Aleppo township (Greene County)542
- Allegany township456
- Allegheny township (Blair County)6,597
- Allegheny township (Butler County)505
- Allegheny township (Cambria County)2,765
- Allegheny township (Somerset County)786
- Allegheny township (Venango County)308
- Allegheny township (Westmoreland County)8,238
- Allen township5,500
- Allison township271
- Alsace township3,863
- Amity township (Berks County)13,440
- Amity township (Erie County)976
- Amwell township3,660
- Annin township679
- Annville township4,915
- Anthony township (Lycoming County)885
- Anthony township (Montour County)1,435
- Antis township6,412
- Antrim township16,018
- Apolacon township319
- Ararat township478
- Armagh township4,028
- Armenia township141
- Armstrong township (Indiana County)2,753
- Armstrong township (Lycoming County)536
- Ashland township915
- Aston township16,738
- Asylum township911
- Athens township (Bradford County)5,161
- Athens township (Crawford County)676
- Auburn township1,441
- Ayr township2,011
- Bald Eagle township2,237
- Baldwin township1,987
- Banks township (Carbon County)1,040
- Banks township (Indiana County)1,062
- Barnett township (Forest County)328
- Barnett township (Jefferson County)216
- Barr township1,992
- Barree township509
- Barrett township4,038
- Barry township860
- Bart township3,219
- Bastress township562
- Beale township756
- Bear Creek township2,776
- Beaver township (Clarion County)1,491
- Beaver township (Columbia County)1,001
- Beaver township (Crawford County)782
- Beaver township (Jefferson County)495
- Beaver township (Snyder County)525
- Beccaria township1,672
- Bedford township5,098
- Bedminster township7,518
- Beech Creek township900
- Belfast township1,403
- Bell township (Clearfield County)544
- Bell township (Jefferson County)2,108
- Bell township (Westmoreland County)2,055
- Benezette township127
- Benner township8,876
- Bensalem township62,818
- Benton township (Columbia County)1,344
- Benton township (Lackawanna County)1,589
- Berlin township2,832
- Bern township6,705
- Berwick township2,619
- Bethel township (Armstrong County)1,058
- Bethel township (Berks County)4,092
- Bethel township (Delaware County)9,669
- Bethel township (Fulton County)1,533
- Bethel township (Lebanon County)5,313
- Bethlehem township26,237
- Bigler township1,022
- Bingham township664
- Birmingham township4,098
- Black Creek township1,715
- Black Lick township1,144
- Black township849
- Blacklick township1,708
- Blaine township535
- Blair township4,726
- Bloom township512
- Bloomfield township (Bedford County)967
- Bloomfield township (Crawford County)1,739
- Blooming Grove township5,584
- Bloss township456
- Blythe township846
- Boggs township (Armstrong County)868
- Boggs township (Centre County)2,713
- Boggs township (Clearfield County)1,750
- Bradford township (Clearfield County)2,820
- Bradford township (McKean County)4,698
- Brady township (Butler County)1,092
- Brady township (Clarion County)73
- Brady township (Clearfield County)1,931
- Brady township (Huntingdon County)954
- Brady township (Lycoming County)516
- Bradys Bend township757
- Braintrim township402
- Branch township1,907
- Bratton township1,375
- Brecknock township (Berks County)4,624
- Brecknock township (Lancaster County)7,644
- Briar Creek township3,000
- Bridgeton township1,235
- Bridgewater township2,618
- Brighton township8,770
- Bristol township54,173
- Broad Top township1,541
- Brokenstraw township1,630
- Brookfield township384
- Brooklyn township646
- Brothersvalley township2,047
- Brown township (Lycoming County)96
- Brown township (Mifflin County)4,150
- Brownsville township539
- Brush Creek township628
- Brush Valley township1,747
- Buck township269
- Buckingham township (Bucks County)20,852
- Buckingham township (Wayne County)465
- Buffalo township (Butler County)8,070
- Buffalo township (Perry County)1,151
- Buffalo township (Union County)3,584
- Buffalo township (Washington County)2,107
- Buffington township1,604
- Bullskin township6,600
- Burlington township536
- Burnside township (Centre County)407
- Burnside township (Clearfield County)1,144
- Burrell township (Armstrong County)482
- Burrell township (Indiana County)3,467
- Bushkill township8,623
- Butler township (Adams County)2,587
- Butler township (Butler County)16,988
- Butler township (Luzerne County)9,827
- Butler township (Schuylkill County)4,972
- Cadogan township290
- Caernarvon township (Berks County)4,338
- Caernarvon township (Lancaster County)4,591
- Caln township14,742
- Cambria township5,763
- Cambridge township1,487
- Canaan township3,453
- Canal township799
- Canoe township1,416
- Canton township (Bradford County)2,145
- Canton township (Washington County)8,258
- Carbon township220
- Carbondale township1,092
- Carroll township (Perry County)5,284
- Carroll township (Washington County)5,339
- Carroll township (York County)7,079
- Cascade township345
- Cass township (Huntingdon County)1,049
- Cass township (Schuylkill County)1,670
- Castanea township1,211
- Catawissa township891
- Catharine township625
- Cecil township14,925
- Center township (Beaver County)11,691
- Center township (Butler County)7,818
- Center township (Greene County)1,155
- Center township (Indiana County)4,364
- Center township (Snyder County)2,708
- Centre township (Berks County)4,192
- Centre township (Perry County)2,524
- Ceres township1,002
- Chadds Ford township3,966
- Chanceford township5,958
- Chapman township (Clinton County)1,058
- Chapman township (Snyder County)1,754
- Charleston township3,531
- Charlestown township6,320
- Chartiers township9,027
- Chatham township604
- Cheltenham township38,374
- Cherry Grove township151
- Cherry Ridge township2,090
- Cherry township (Butler County)987
- Cherry township (Sullivan County)1,558
- Cherryhill township2,525
- Cherrytree township1,234
- Chest township (Cambria County)506
- Chest township (Clearfield County)503
- Chester township4,066
- Chestnuthill township16,654
- Chippewa township8,005
- Choconut township693
- Clara township147
- Clarion township3,602
- Clay township (Butler County)2,243
- Clay township (Huntingdon County)1,075
- Clay township (Lancaster County)6,948
- Clearfield township (Butler County)2,649
- Clearfield township (Cambria County)1,696
- Cleveland township1,185
- Clifford township2,016
- Clifton township1,302
- Clinton township (Butler County)2,878
- Clinton township (Lycoming County)3,626
- Clinton township (Venango County)817
- Clinton township (Wayne County)1,961
- Clinton township (Wyoming County)1,094
- Clover township398
- Clymer township676
- Coal township9,769
- Codorus township3,943
- Cogan House township826
- Cold Spring township27
- Colebrook township153
- Colebrookdale township5,136
- Colerain township (Bedford County)1,047
- Colerain township (Lancaster County)3,945
- College township10,540
- Colley township611
- Collier township8,972
- Columbia township968
- Columbus township1,907
- Concord township (Butler County)1,373
- Concord township (Delaware County)18,288
- Concord township (Erie County)1,046
- Conemaugh township (Cambria County)1,956
- Conemaugh township (Indiana County)2,136
- Conemaugh township (Somerset County)6,654
- Conestoga township3,908
- Conewago township (Adams County)7,964
- Conewago township (Dauphin County)2,999
- Conewago township (York County)8,738
- Conewango township3,367
- Conneaut township (Crawford County)1,000
- Conneaut township (Erie County)4,072
- Connellsville township2,091
- Connoquenessing township4,184
- Conoy township3,302
- Conyngham township (Columbia County)815
- Conyngham township (Luzerne County)1,303
- Cook township2,412
- Cooke township181
- Coolbaugh township20,715
- Coolspring township1,940
- Cooper township (Clearfield County)2,564
- Cooper township (Montour County)1,021
- Cornplanter township2,368
- Corydon township240
- Covington township (Clearfield County)388
- Covington township (Lackawanna County)2,266
- Covington township (Tioga County)921
- Cowanshannock township2,692
- Cranberry township (Butler County)34,094
- Cranberry township (Venango County)6,273
- Crawford township835
- Crescent township2,141
- Cresson township2,802
- Cromwell township1,244
- Cross Creek township1,734
- Croyle township2,343
- Cumberland township (Adams County)7,116
- Cumberland township (Greene County)6,225
- Cumberland Valley township1,372
- Cummings township238
- Cumru township15,702
- Curtin township507
- Cussewago township1,550
- Dallas township9,227
- Damascus township3,698
- Darby township9,191
- Darlington township1,843
- Daugherty township3,033
- Davidson township565
- Dean township298
- Decatur township (Clearfield County)3,743
- Decatur township (Mifflin County)2,942
- Deer Creek township458
- Deerfield township (Tioga County)567
- Deerfield township (Warren County)173
- Delano township205
- Delaware township (Juniata County)1,682
- Delaware township (Mercer County)2,044
- Delaware township (Northumberland County)4,280
- Delaware township (Pike County)7,629
- Delmar township2,783
- Dennison township1,081
- Derry township (Dauphin County)24,977
- Derry township (Mifflin County)7,238
- Derry township (Montour County)1,294
- Derry township (Westmoreland County)13,472
- Dickinson township5,388
- Dimock township1,324
- Dingman township12,931
- District township1,399
- Donegal township (Butler County)1,596
- Donegal township (Washington County)2,255
- Donegal township (Westmoreland County)1,684
- Dorrance township2,127
- Douglass township (Berks County)3,744
- Douglass township (Montgomery County)10,801
- Dover township23,280
- Doylestown township18,008
- Dreher township1,370
- Drumore township2,593
- Dublin township (Fulton County)1,105
- Dublin township (Huntingdon County)1,178
- Dunbar township6,529
- Duncan township188
- Dunkard township2,329
- Dunnstable township1,021
- Durham township1,047
- Dyberry township1,303
- Earl township (Berks County)3,130
- Earl township (Lancaster County)7,163
- East Allen township5,195
- East Bethlehem township2,041
- East Bradford township10,753
- East Brandywine township10,148
- East Brunswick township2,187
- East Buffalo township7,464
- East Caln township5,608
- East Cameron township663
- East Carroll township1,373
- East Chillisquaque township617
- East Cocalico township10,949
- East Coventry township7,209
- East Deer township1,389
- East Donegal township8,689
- East Drumore township3,929
- East Earl township6,773
- East Fairfield township880
- East Fallowfield township (Chester County)7,824
- East Fallowfield township (Crawford County)1,457
- East Finley township1,351
- East Franklin township3,776
- East Goshen township18,441
- East Hanover township (Dauphin County)6,029
- East Hanover township (Lebanon County)2,664
- East Hempfield township26,745
- East Hopewell township2,471
- East Huntingdon township7,621
- East Keating township15
- East Lackawannock township1,899
- East Lampeter township17,958
- East Mahoning township951
- East Manchester township8,523
- East Marlborough township7,714
- East Mead township1,429
- East Nantmeal township1,715
- East Norriton township14,106
- East Norwegian township829
- East Nottingham township9,068
- East Penn township2,778
- East Pennsboro township21,162
- East Pikeland township8,519
- East Providence township1,647
- East Rockhill township5,817
- East St. Clair township2,896
- East Taylor township2,158
- East Union township1,783
- East Vincent township7,608
- East Wheatfield township2,117
- East Whiteland township14,774
- Easttown township11,067
- Eaton township1,365
- Eden township2,584
- Edgmont township4,476
- Elder township954
- Eldred township (Jefferson County)1,339
- Eldred township (Lycoming County)1,874
- Eldred township (McKean County)1,454
- Eldred township (Monroe County)2,544
- Eldred township (Schuylkill County)911
- Eldred township (Warren County)632
- Elizabeth township (Allegheny County)12,690
- Elizabeth township (Lancaster County)3,979
- Elk Creek township1,587
- Elk Lick township2,435
- Elk township (Chester County)1,762
- Elk township (Clarion County)1,522
- Elk township (Tioga County)35
- Elk township (Warren County)453
- Elkland township516
- Elmhurst township881
- Ephrata township10,632
- Eulalia township1,051
- Exeter township (Berks County)25,608
- Exeter township (Luzerne County)2,604
- Exeter township (Wyoming County)726
- Fairfield township (Crawford County)1,068
- Fairfield township (Lycoming County)2,826
- Fairfield township (Westmoreland County)2,206
- Fairhope township86
- Fairmount township1,119
- Fairview township (Butler County)1,921
- Fairview township (Erie County)11,247
- Fairview township (Luzerne County)4,733
- Fairview township (Mercer County)913
- Fairview township (York County)17,676
- Fallowfield township4,060
- Falls Creek borough72
- Falls township (Bucks County)34,552
- Falls township (Wyoming County)1,624
- Fannett township2,358
- Farmington township (Clarion County)1,792
- Farmington township (Tioga County)798
- Farmington township (Warren County)1,266
- Fawn township (Allegheny County)2,197
- Fawn township (York County)3,020
- Fayette township3,310
- Fell township2,312
- Ferguson township (Centre County)19,079
- Ferguson township (Clearfield County)652
- Fermanagh township2,863
- Findlay township6,698
- Findley township2,635
- Fishing Creek township1,361
- Forest Lake township1,184
- Forks township (Northampton County)16,382
- Forks township (Sullivan County)355
- Forkston township307
- Forward township (Allegheny County)3,009
- Forward township (Butler County)3,304
- Foster township (Luzerne County)3,446
- Foster township (McKean County)3,956
- Foster township (Schuylkill County)258
- Fox township (Elk County)3,541
- Fox township (Sullivan County)373
- Frailey township415
- Franconia township13,546
- Franklin township (Adams County)4,722
- Franklin township (Beaver County)3,843
- Franklin township (Bradford County)763
- Franklin township (Butler County)2,590
- Franklin township (Carbon County)4,396
- Franklin township (Chester County)4,448
- Franklin township (Columbia County)524
- Franklin township (Erie County)1,653
- Franklin township (Fayette County)2,364
- Franklin township (Greene County)6,802
- Franklin township (Huntingdon County)431
- Franklin township (Luzerne County)1,744
- Franklin township (Lycoming County)789
- Franklin township (Snyder County)2,072
- Franklin township (Susquehanna County)710
- Franklin township (York County)5,087
- Frankstown township7,395
- Frazer township1,040
- Freedom township (Adams County)1,055
- Freedom township (Blair County)2,968
- Freehold township892
- Freeport township234
- French Creek township674
- Frenchcreek township1,359
- Fulton township3,215
- Gaines township559
- Gallagher township516
- Gallitzin township1,397
- Gamble township804
- Gaskill township700
- Genesee township682
- Georges township6,213
- German township4,563
- Germany township2,879
- Gibson township (Cameron County)117
- Gibson township (Susquehanna County)1,270
- Gilmore township236
- Gilpin township2,243
- Girard township (Clearfield County)526
- Girard township (Erie County)4,828
- Glade township2,053
- Glenburn township1,207
- Goshen township401
- Graham township1,568
- Grant township727
- Granville township (Bradford County)942
- Granville township (Mifflin County)4,597
- Gray township139
- Great Bend township1,591
- Green township (Forest County)531
- Green township (Indiana County)3,404
- Greene township (Beaver County)2,060
- Greene township (Clinton County)2,182
- Greene township (Erie County)4,456
- Greene township (Franklin County)18,532
- Greene township (Greene County)539
- Greene township (Mercer County)1,032
- Greene township (Pike County)3,545
- Greenfield township (Blair County)3,736
- Greenfield township (Erie County)2,051
- Greenfield township (Lackawanna County)2,514
- Greenville township810
- Greenwich township3,434
- Greenwood township (Clearfield County)406
- Greenwood township (Columbia County)1,846
- Greenwood township (Crawford County)1,361
- Greenwood township (Juniata County)594
- Greenwood township (Perry County)970
- Gregg township (Centre County)2,142
- Gregg township (Union County)4,010
- Grove township82
- Grugan township28
- Guilford township14,819
- Gulich township1,022
- Haines township1,892
- Halfmoon township2,823
- Halifax township3,351
- Hamilton township (Adams County)2,749
- Hamilton township (Franklin County)11,466
- Hamilton township (McKean County)432
- Hamilton township (Monroe County)8,556
- Hamilton township (Tioga County)756
- Hamiltonban township2,397
- Hamlin township780
- Hampden township34,222
- Hampton township18,185
- Hanover township (Beaver County)3,313
- Hanover township (Lehigh County)1,866
- Hanover township (Luzerne County)11,522
- Hanover township (Northampton County)11,701
- Hanover township (Washington County)2,415
- Harborcreek township16,671
- Harford township1,325
- Harmar township3,075
- Harmony township (Beaver County)3,149
- Harmony township (Forest County)550
- Harmony township (Susquehanna County)399
- Harris township5,947
- Harrison township (Allegheny County)9,949
- Harrison township (Bedford County)977
- Harrison township (Potter County)1,092
- Hartley township1,701
- Hatfield township18,937
- Haverford township50,874
- Haycock township2,136
- Hayfield township2,747
- Hazle township10,263
- Heath township163
- Hebron township546
- Hector township346
- Hegins township3,352
- Heidelberg township (Berks County)1,778
- Heidelberg township (Lebanon County)4,070
- Heidelberg township (Lehigh County)3,356
- Heidelberg township (York County)3,054
- Hellam township5,953
- Hemlock township2,396
- Hempfield township (Mercer County)3,678
- Hempfield township (Westmoreland County)41,637
- Henderson township (Huntingdon County)769
- Henderson township (Jefferson County)1,853
- Henry Clay township1,892
- Hepburn township2,568
- Hereford township3,048
- Herrick township (Bradford County)668
- Herrick township (Susquehanna County)637
- Hickory township (Forest County)340
- Hickory township (Lawrence County)2,565
- Highland township (Adams County)852
- Highland township (Chester County)1,316
- Highland township (Clarion County)526
- Highland township (Elk County)339
- Hillsgrove township262
- Hilltown township16,749
- Hollenback township1,142
- Homer township483
- Honey Brook township8,401
- Hopewell township (Beaver County)13,371
- Hopewell township (Bedford County)1,953
- Hopewell township (Cumberland County)2,537
- Hopewell township (Huntingdon County)495
- Hopewell township (Washington County)891
- Hopewell township (York County)5,337
- Horsham township26,970
- Horton township1,458
- Hovey township97
- Howard township766
- Howe township (Forest County)209
- Howe township (Perry County)345
- Hubley township891
- Hunlock township2,093
- Huntington township (Adams County)2,309
- Huntington township (Luzerne County)2,055
- Huston township (Blair County)1,362
- Huston township (Centre County)1,516
- Huston township (Clearfield County)1,475
- Independence township (Beaver County)2,117
- Independence township (Washington County)1,185
- Indiana township7,309
- Irwin township1,322
- Jackson township (Butler County)5,521
- Jackson township (Cambria County)4,173
- Jackson township (Columbia County)655
- Jackson township (Dauphin County)1,712
- Jackson township (Greene County)451
- Jackson township (Huntingdon County)829
- Jackson township (Lebanon County)9,317
- Jackson township (Luzerne County)4,408
- Jackson township (Lycoming County)403
- Jackson township (Mercer County)1,080
- Jackson township (Monroe County)6,532
- Jackson township (Northumberland County)825
- Jackson township (Perry County)533
- Jackson township (Snyder County)1,593
- Jackson township (Susquehanna County)737
- Jackson township (Tioga County)1,806
- Jackson township (Venango County)828
- Jackson township (York County)8,955
- Jay township2,039
- Jefferson township (Berks County)2,348
- Jefferson township (Butler County)5,126
- Jefferson township (Dauphin County)484
- Jefferson township (Fayette County)1,937
- Jefferson township (Greene County)2,065
- Jefferson township (Lackawanna County)3,828
- Jefferson township (Mercer County)1,688
- Jefferson township (Somerset County)1,227
- Jefferson township (Washington County)1,292
- Jenkins township4,401
- Jenks township3,626
- Jenner township3,631
- Jessup township395
- Jones township1,430
- Jordan township (Clearfield County)529
- Jordan township (Lycoming County)745
- Jordan township (Northumberland County)791
- Juniata township (Bedford County)776
- Juniata township (Blair County)926
- Juniata township (Huntingdon County)411
- Juniata township (Perry County)1,814
- Karthaus township762
- Keating township (McKean County)2,690
- Keating township (Potter County)241
- Kelly township3,765
- Kennedy township8,549
- Kennett township8,968
- Kidder township1,862
- Kilbuck township704
- Kimmel township1,413
- King township1,183
- Kingsley township207
- Kingston township7,138
- Kiskiminetas township4,564
- Kittanning township2,104
- Kline township1,624
- Knox township (Clarion County)1,102
- Knox township (Clearfield County)639
- Knox township (Jefferson County)1,016
- La Plume township454
- Lack township629
- Lackawannock township2,151
- Lackawaxen township5,253
- Lafayette township1,852
- Lake township (Luzerne County)1,867
- Lake township (Mercer County)702
- Lake township (Wayne County)4,897
- Lamar township2,628
- Lancaster township (Butler County)3,207
- Lancaster township (Lancaster County)18,641
- Laporte township440
- Larimer township520
- Lathrop township695
- Latimore township2,670
- Lausanne township380
- Lawrence Park township3,775
- Lawrence township (Clearfield County)7,395
- Lawrence township (Tioga County)1,729
- Leacock township5,669
- Lebanon township686
- LeBoeuf township1,775
- Leet township1,530
- Lehigh township (Carbon County)330
- Lehigh township (Northampton County)10,780
- Lehigh township (Wayne County)2,014
- Lehman township (Luzerne County)3,396
- Lehman township (Pike County)11,105
- Leidy township176
- Lemon township990
- Lenox township1,842
- Leroy township642
- Letterkenny township2,491
- Lewis township (Lycoming County)988
- Lewis township (Northumberland County)1,966
- Lewis township (Union County)1,408
- Liberty township (Adams County)1,204
- Liberty township (Bedford County)1,228
- Liberty township (Centre County)1,875
- Liberty township (McKean County)1,537
- Liberty township (Mercer County)1,351
- Liberty township (Montour County)1,533
- Liberty township (Susquehanna County)1,137
- Liberty township (Tioga County)902
- Licking Creek township1,457
- Licking township581
- Ligonier township6,012
- Limerick township20,978
- Limestone township (Clarion County)1,962
- Limestone township (Lycoming County)1,934
- Limestone township (Montour County)1,016
- Limestone township (Union County)1,894
- Limestone township (Warren County)284
- Lincoln township (Bedford County)317
- Lincoln township (Huntingdon County)219
- Lincoln township (Somerset County)1,395
- Litchfield township1,304
- Little Beaver township1,048
- Little Britain township4,146
- Little Mahanoy township288
- Liverpool township1,183
- Locust township1,304
- Logan township (Blair County)12,318
- Logan township (Clinton County)754
- Logan township (Huntingdon County)730
- London Britain township3,201
- London Grove township8,980
- Londonderry township (Bedford County)1,646
- Londonderry township (Chester County)2,566
- Londonderry township (Dauphin County)4,906
- Longswamp township5,613
- Lower Allen township20,577
- Lower Alsace township4,843
- Lower Augusta township1,262
- Lower Chanceford township3,075
- Lower Chichester township3,386
- Lower Frankford township1,752
- Lower Frederick township4,905
- Lower Gwynedd township12,219
- Lower Heidelberg township6,507
- Lower Macungie township32,727
- Lower Mahanoy township1,432
- Lower Makefield township33,485
- Lower Merion township64,174
- Lower Mifflin township1,840
- Lower Milford township3,872
- Lower Moreland township14,070
- Lower Mount Bethel township2,913
- Lower Nazareth township7,107
- Lower Oxford township5,660
- Lower Paxton township54,657
- Lower Pottsgrove township12,557
- Lower Providence township25,897
- Lower Salford township16,137
- Lower Saucon township11,089
- Lower Southampton township20,555
- Lower Swatara township9,796
- Lower Towamensing township3,076
- Lower Turkeyfoot township470
- Lower Tyrone township1,009
- Lower Windsor township7,595
- Lower Yoder township2,207
- Lowhill township2,134
- Loyalhanna township1,651
- Loyalsock township11,491
- Lumber township170
- Lurgan township1,954
- Luzerne township5,409
- Lycoming township1,568
- Lykens township1,684
- Lynn township4,278
- Madison township (Armstrong County)991
- Madison township (Clarion County)972
- Madison township (Columbia County)1,783
- Madison township (Lackawanna County)2,401
- Mahanoy township3,043
- Mahoning township (Armstrong County)1,233
- Mahoning township (Carbon County)4,296
- Mahoning township (Lawrence County)2,670
- Mahoning township (Montour County)4,533
- Maidencreek township9,208
- Main township1,410
- Manchester township (Wayne County)680
- Manchester township (York County)19,682
- Manheim township (Lancaster County)44,237
- Manheim township (York County)3,493
- Mann township527
- Manor township (Armstrong County)4,116
- Manor township (Lancaster County)21,989
- Marion township (Beaver County)697
- Marion township (Berks County)1,741
- Marion township (Butler County)1,033
- Marion township (Centre County)1,199
- Marlborough township3,547
- Marple township24,216
- Marshall township10,226
- Martic township5,192
- Maxatawny township7,884
- Mayberry township243
- McCalmont township1,167
- McCandless township29,100
- McHenry township98
- McIntyre township406
- McKean township4,382
- McNett township107
- Mead township1,352
- Mehoopany township1,062
- Menallen township (Adams County)3,751
- Menallen township (Fayette County)4,048
- Menno township2,062
- Mercer township1,201
- Meshoppen township938
- Metal township1,663
- Middle Paxton township5,088
- Middle Smithfield township16,010
- Middle Taylor township793
- Middlebury township1,186
- Middlecreek township (Snyder County)1,989
- Middlecreek township (Somerset County)682
- Middlesex township (Butler County)7,236
- Middlesex township (Cumberland County)7,189
- Middletown township (Bucks County)45,861
- Middletown township (Delaware County)16,732
- Middletown township (Susquehanna County)383
- Mifflin township (Columbia County)2,149
- Mifflin township (Dauphin County)857
- Mifflin township (Lycoming County)1,027
- Miles township1,688
- Milford township (Bucks County)10,231
- Milford township (Juniata County)2,126
- Milford township (Pike County)1,548
- Milford township (Somerset County)1,329
- Mill Creek township (Lycoming County)460
- Mill Creek township (Mercer County)796
- Millcreek township (Clarion County)416
- Millcreek township (Erie County)53,472
- Millcreek township (Lebanon County)4,384
- Miller township (Huntingdon County)459
- Miller township (Perry County)993
- Millstone township100
- Mineral township472
- Monaghan township2,732
- Monongahela township1,255
- Monroe township (Bedford County)1,299
- Monroe township (Bradford County)1,037
- Monroe township (Clarion County)1,314
- Monroe township (Cumberland County)6,524
- Monroe township (Juniata County)1,719
- Monroe township (Snyder County)4,170
- Monroe township (Wyoming County)1,509
- Montgomery township (Franklin County)5,754
- Montgomery township (Indiana County)1,290
- Montgomery township (Montgomery County)26,076
- Montour township1,129
- Moon township26,902
- Moore township9,364
- Moreland township1,178
- Morgan township2,038
- Morris township (Clearfield County)2,750
- Morris township (Greene County)556
- Morris township (Huntingdon County)655
- Morris township (Tioga County)641
- Morris township (Washington County)886
- Mount Carmel township2,501
- Mount Joy township (Adams County)3,830
- Mount Joy township (Lancaster County)10,803
- Mount Lebanon township33,370
- Mount Pleasant township (Adams County)4,709
- Mount Pleasant township (Columbia County)1,605
- Mount Pleasant township (Washington County)3,322
- Mount Pleasant township (Wayne County)1,742
- Mount Pleasant township (Westmoreland County)10,042
- Muddy Creek township2,025
- Muhlenberg township22,127
- Muncy Creek township3,551
- Muncy township1,071
- Munster township698
- Napier township2,107
- Nelson township566
- Nescopeck township1,178
- Neshannock township9,721
- Nether Providence township14,426
- Neville township1,085
- New Britain township12,319
- New Castle township469
- New Garden township11,449
- New Hanover township13,448
- New London township5,844
- New Milford township1,634
- New Sewickley township7,069
- New Vernon township482
- Newberry township15,922
- Newlin township1,240
- Newport township4,464
- Newton township2,897
- Newtown township (Bucks County)19,828
- Newtown township (Delaware County)15,260
- Nicholson township (Fayette County)1,417
- Nicholson township (Wyoming County)1,066
- Nippenose township565
- Nockamixon township3,368
- North Abington township944
- North Annville township2,078
- North Beaver township3,946
- North Bethlehem township1,693
- North Branch township214
- North Buffalo township2,661
- North Centre township1,866
- North Codorus township9,228
- North Cornwall township9,041
- North Coventry township8,442
- North East township6,484
- North Fayette township16,107
- North Franklin township4,788
- North Heidelberg township1,081
- North Hopewell township2,742
- North Huntingdon township31,826
- North Lebanon township12,111
- North Londonderry township8,956
- North Mahoning township1,137
- North Manheim township4,136
- North Middleton township12,441
- North Newton township2,581
- North Sewickley township5,456
- North Shenango township1,346
- North Strabane township16,417
- North Towanda township983
- North Union township (Fayette County)11,592
- North Union township (Schuylkill County)1,208
- North Versailles township9,845
- North Whitehall township15,822
- North Woodbury township2,490
- Northampton township (Bucks County)39,920
- Northampton township (Somerset County)336
- Northeast Madison township845
- Northmoreland township1,432
- Norwegian township2,047
- Norwich township502
- Nottingham township2,911
- Noxen township1,057
- Noyes township391
- O'Hara township9,109
- Oakland township (Butler County)2,739
- Oakland township (Susquehanna County)541
- Oakland township (Venango County)1,409
- Ogle township454
- Ohio township7,228
- Oil Creek township (Crawford County)1,715
- Oil Creek township (Venango County)638
- Old Lycoming township4,960
- Oley township3,849
- Oliver township (Jefferson County)942
- Oliver township (Mifflin County)2,041
- Oliver township (Perry County)1,750
- Oneida township1,136
- Ontelaunee township2,830
- Orange township1,097
- Oregon township933
- Orwell township1,188
- Osceola township742
- Oswayo township303
- Otter Creek township529
- Otto township1,328
- Overfield township1,437
- Overton township253
- Oxford township5,985
- Packer township829
- Paint township (Clarion County)1,807
- Paint township (Somerset County)3,021
- Palmer township22,424
- Palmyra township (Pike County)3,309
- Palmyra township (Wayne County)1,241
- Paradise township (Lancaster County)5,689
- Paradise township (Monroe County)2,906
- Paradise township (York County)4,019
- Parker township534
- Parks township2,747
- Patterson township3,083
- Patton township15,791
- Paupack township3,714
- Pavia township385
- Peach Bottom township5,007
- Penn Forest township10,157
- Penn Hills township40,242
- Penn township (Berks County)2,021
- Penn township (Butler County)4,923
- Penn township (Centre County)1,082
- Penn township (Chester County)5,744
- Penn township (Clearfield County)1,130
- Penn township (Cumberland County)2,917
- Penn township (Huntingdon County)1,073
- Penn township (Lancaster County)10,422
- Penn township (Lycoming County)774
- Penn township (Perry County)3,136
- Penn township (Snyder County)4,079
- Penn township (Westmoreland County)20,456
- Penn township (York County)17,974
- Pennsbury township3,887
- Pequea township5,918
- Perkiomen township8,986
- Perry township (Armstrong County)292
- Perry township (Berks County)2,485
- Perry township (Clarion County)950
- Perry township (Fayette County)2,590
- Perry township (Greene County)1,271
- Perry township (Jefferson County)1,185
- Perry township (Lawrence County)1,686
- Perry township (Mercer County)1,246
- Perry township (Snyder County)2,286
- Peters township (Franklin County)4,466
- Peters township (Washington County)23,167
- Piatt township972
- Pike township (Berks County)1,568
- Pike township (Bradford County)695
- Pike township (Clearfield County)1,911
- Pike township (Potter County)333
- Pine Creek township (Clinton County)3,416
- Pine Creek township (Jefferson County)1,320
- Pine Grove township (Schuylkill County)4,049
- Pine Grove township (Warren County)2,544
- Pine township (Allegheny County)15,224
- Pine township (Armstrong County)296
- Pine township (Clearfield County)102
- Pine township (Columbia County)850
- Pine township (Crawford County)451
- Pine township (Indiana County)1,495
- Pine township (Lycoming County)293
- Pine township (Mercer County)4,758
- Pinegrove township1,270
- Piney township392
- Pittsfield township1,074
- Pittston township3,216
- Plain Grove township751
- Plainfield township6,241
- Plains township9,905
- Pleasant township2,371
- Pleasant Valley township116
- Plum township981
- Plumcreek township2,068
- Plumstead township14,154
- Plunketts Creek township623
- Plymouth township (Luzerne County)1,697
- Plymouth township (Montgomery County)18,417
- Pocono township10,860
- Pocopson township4,469
- Point township3,805
- Polk township (Jefferson County)270
- Polk township (Monroe County)7,419
- Portage township (Cambria County)3,393
- Portage township (Cameron County)131
- Portage township (Potter County)180
- Porter township (Clarion County)1,366
- Porter township (Clinton County)1,478
- Porter township (Huntingdon County)1,771
- Porter township (Jefferson County)318
- Porter township (Lycoming County)1,521
- Porter township (Pike County)393
- Porter township (Schuylkill County)2,107
- Potter township (Beaver County)519
- Potter township (Centre County)3,581
- President township495
- Preston township916
- Price township3,734
- Providence township7,106
- Pulaski township (Beaver County)1,315
- Pulaski township (Lawrence County)3,059
- Putnam township374
- Pymatuning township3,066
- Quemahoning township1,783
- Quincy township5,312
- Raccoon township2,755
- Radnor township33,718
- Ralpho township4,171
- Randolph township1,789
- Ransom township1,297
- Rapho township12,149
- Rayburn township1,608
- Rayne township2,769
- Reade township1,612
- Reading township5,873
- Redbank township (Armstrong County)851
- Redbank township (Clarion County)974
- Redstone township4,981
- Reed township195
- Reilly township678
- Reserve township3,180
- Rice township3,701
- Richhill township736
- Richland township (Allegheny County)11,844
- Richland township (Bucks County)14,087
- Richland township (Cambria County)12,082
- Richland township (Clarion County)420
- Richland township (Venango County)702
- Richmond township (Berks County)3,665
- Richmond township (Crawford County)1,285
- Richmond township (Tioga County)2,029
- Ridgebury township2,254
- Ridgway township2,359
- Ridley township30,923
- Ringgold township944
- Roaring Brook township2,250
- Roaring Creek township683
- Robeson township7,642
- Robinson township (Allegheny County)15,534
- Robinson township (Washington County)1,733
- Rochester township2,740
- Rockdale township1,198
- Rockefeller township2,411
- Rockland township (Berks County)3,662
- Rockland township (Venango County)1,153
- Rome township (Bradford County)1,010
- Rome township (Crawford County)1,935
- Rose township1,103
- Ross township (Allegheny County)32,939
- Ross township (Luzerne County)2,751
- Ross township (Monroe County)5,488
- Rostraver township11,411
- Roulette township1,077
- Ruscombmanor township4,015
- Rush township (Centre County)3,637
- Rush township (Dauphin County)290
- Rush township (Northumberland County)1,585
- Rush township (Schuylkill County)3,456
- Rush township (Susquehanna County)1,163
- Rutland township620
- Ryan township2,756
- Rye township2,288
- Sadsbury township (Chester County)4,371
- Sadsbury township (Crawford County)2,716
- Sadsbury township (Lancaster County)3,536
- Salem township (Clarion County)921
- Salem township (Luzerne County)4,047
- Salem township (Mercer County)849
- Salem township (Wayne County)4,144
- Salem township (Westmoreland County)6,035
- Salford township3,059
- Salisbury township (Lancaster County)11,521
- Salisbury township (Lehigh County)13,677
- Saltlick township2,980
- Sandy Creek township762
- Sandy Lake township1,170
- Sandy township11,710
- Sandycreek township2,188
- Saville township2,615
- Schuylkill township (Chester County)8,864
- Schuylkill township (Schuylkill County)995
- Scott township (Allegheny County)17,270
- Scott township (Columbia County)5,583
- Scott township (Lackawanna County)4,642
- Scott township (Lawrence County)2,016
- Scott township (Wayne County)434
- Scrubgrass township855
- Sergeant township68
- Sewickley township5,601
- Shade township2,189
- Shaler township27,538
- Shamokin township2,328
- Sharon township704
- Sheffield township1,534
- Shenango township (Lawrence County)7,062
- Shenango township (Mercer County)3,475
- Sheshequin township1,256
- Shippen township (Cameron County)1,907
- Shippen township (Tioga County)477
- Shippensburg township4,303
- Shirley township2,418
- Shohola township2,605
- Shrewsbury township (Lycoming County)437
- Shrewsbury township (Sullivan County)244
- Shrewsbury township (York County)6,920
- Silver Lake township1,691
- Silver Spring township20,661
- Skippack township14,520
- Slippery Rock township (Butler County)8,059
- Slippery Rock township (Lawrence County)2,894
- Slocum township1,021
- Smith township4,212
- Smithfield township (Bradford County)1,467
- Smithfield township (Huntingdon County)4,350
- Smithfield township (Monroe County)7,953
- Snake Spring township1,904
- Snow Shoe township1,694
- Snyder township (Blair County)3,316
- Snyder township (Jefferson County)2,297
- Solebury township8,685
- Somerset township (Somerset County)11,531
- Somerset township (Washington County)2,556
- South Abington township9,572
- South Annville township3,454
- South Beaver township2,648
- South Bend township1,015
- South Buffalo township2,681
- South Canaan township1,855
- South Centre township1,968
- South Coventry township2,808
- South Creek township933
- South Fayette township18,460
- South Franklin township2,850
- South Hanover township7,289
- South Heidelberg township7,795
- South Huntingdon township5,362
- South Lebanon township10,548
- South Londonderry township8,823
- South Mahoning township1,905
- South Manheim township2,752
- South Middleton township16,754
- South Newton township1,204
- South Park township13,706
- South Pymatuning township2,608
- South Shenango township2,042
- South Strabane township9,647
- South Union township10,620
- South Versailles township312
- South Whitehall township21,390
- South Woodbury township2,193
- Southampton township (Bedford County)792
- Southampton township (Cumberland County)7,938
- Southampton township (Franklin County)8,576
- Southampton township (Somerset County)601
- Southwest Madison township1,305
- Southwest township388
- Sparta township2,070
- Spring Brook township2,770
- Spring Creek township (Elk County)191
- Spring Creek township (Warren County)861
- Spring Garden township13,631
- Spring township (Berks County)28,601
- Spring township (Centre County)8,053
- Spring township (Crawford County)1,300
- Spring township (Perry County)2,113
- Spring township (Snyder County)1,548
- Springdale township1,436
- Springettsbury township27,276
- Springfield township (Bradford County)1,303
- Springfield township (Bucks County)5,193
- Springfield township (Delaware County)25,038
- Springfield township (Erie County)3,049
- Springfield township (Fayette County)2,677
- Springfield township (Huntingdon County)594
- Springfield township (Mercer County)2,089
- Springfield township (Montgomery County)21,005
- Springfield township (York County)6,078
- Springhill township (Fayette County)2,664
- Springhill township (Greene County)249
- Springville township1,441
- Spruce Creek township160
- Spruce Hill township818
- St. Clair township1,247
- St. Thomas township5,956
- Standing Stone township771
- Sterling township1,407
- Steuben township853
- Stevens township490
- Stewardson township69
- Stewart township613
- Stonycreek township (Cambria County)2,705
- Stonycreek township (Somerset County)2,162
- Stowe township6,294
- Straban township4,892
- Strasburg township4,527
- Stroud township19,764
- Sugar Grove township (Mercer County)825
- Sugar Grove township (Warren County)1,719
- Sugarcreek township1,456
- Sugarloaf township (Columbia County)1,193
- Sugarloaf township (Luzerne County)3,961
- Sullivan township1,365
- Summerhill township (Cambria County)1,715
- Summerhill township (Crawford County)1,245
- Summit township (Butler County)4,422
- Summit township (Crawford County)1,499
- Summit township (Erie County)7,314
- Summit township (Potter County)139
- Summit township (Somerset County)1,941
- Susquehanna township (Cambria County)1,874
- Susquehanna township (Dauphin County)27,245
- Susquehanna township (Juniata County)1,441
- Susquehanna township (Lycoming County)1,113
- Swatara township (Dauphin County)27,953
- Swatara township (Lebanon County)5,059
- Sweden township827
- Sylvania township60
- Taylor township (Blair County)2,452
- Taylor township (Centre County)812
- Taylor township (Fulton County)1,252
- Taylor township (Lawrence County)1,056
- Tell township551
- Terry township760
- Texas township2,223
- Thompson township (Fulton County)952
- Thompson township (Susquehanna County)344
- Thornbury township (Chester County)3,179
- Thornbury township (Delaware County)6,927
- Thornhurst township893
- Tilden township3,631
- Tinicum township (Bucks County)3,827
- Tinicum township (Delaware County)3,980
- Tioga township851
- Tionesta township601
- Toboyne township488
- Toby township1,079
- Tobyhanna township8,340
- Todd township (Fulton County)1,736
- Todd township (Huntingdon County)837
- Towamencin township18,035
- Towamensing township4,514
- Towanda township1,109
- Tredyffrin township31,922
- Tremont township272
- Triumph township254
- Troy township (Bradford County)1,567
- Troy township (Crawford County)888
- Tulpehocken township3,562
- Tunkhannock township (Monroe County)6,979
- Tunkhannock township (Wyoming County)3,960
- Turbett township920
- Turbot township1,560
- Tuscarora township (Bradford County)1,052
- Tuscarora township (Juniata County)1,169
- Tuscarora township (Perry County)1,161
- Tyrone township (Adams County)2,294
- Tyrone township (Blair County)1,937
- Tyrone township (Perry County)1,996
- Ulster township1,051
- Ulysses township615
- Union township (Adams County)3,102
- Union township (Berks County)3,952
- Union township (Centre County)1,300
- Union township (Clearfield County)774
- Union township (Crawford County)818
- Union township (Erie County)1,542
- Union township (Fulton County)972
- Union township (Huntingdon County)919
- Union township (Jefferson County)882
- Union township (Lawrence County)4,926
- Union township (Lebanon County)2,920
- Union township (Luzerne County)2,033
- Union township (Mifflin County)3,670
- Union township (Schuylkill County)1,083
- Union township (Snyder County)1,358
- Union township (Tioga County)1,007
- Union township (Union County)1,607
- Union township (Washington County)5,401
- Unity township21,419
- Upper Allen township23,801
- Upper Augusta township2,287
- Upper Bern township1,909
- Upper Burrell township2,022
- Upper Chichester township16,895
- Upper Darby township85,486
- Upper Dublin township27,122
- Upper Fairfield township1,685
- Upper Frankford township1,954
- Upper Frederick township3,707
- Upper Gwynedd township17,202
- Upper Hanover township8,609
- Upper Leacock township8,939
- Upper Macungie township27,850
- Upper Mahanoy township769
- Upper Mahantongo township550
- Upper Makefield township8,855
- Upper Merion township34,977
- Upper Mifflin township1,328
- Upper Milford township8,057
- Upper Moreland township26,131
- Upper Mount Bethel township6,415
- Upper Nazareth township8,313
- Upper Oxford township2,586
- Upper Paxton township4,026
- Upper Pottsgrove township6,064
- Upper Providence township (Delaware County)10,853
- Upper Providence township (Montgomery County)24,666
- Upper Salford township3,171
- Upper Saucon township17,484
- Upper Southampton township15,209
- Upper St. Clair township20,863
- Upper Tulpehocken township1,609
- Upper Turkeyfoot township1,131
- Upper Tyrone township1,937
- Upper Uwchlan township13,010
- Upper Yoder township5,081
- Uwchlan township19,394
- Valley township (Armstrong County)634
- Valley township (Chester County)8,002
- Valley township (Montour County)2,058
- Vanport township1,309
- Venango township (Butler County)937
- Venango township (Crawford County)915
- Venango township (Erie County)2,292
- Vernon township5,269
- Victory township411
- Walker township (Centre County)4,672
- Walker township (Huntingdon County)2,111
- Walker township (Juniata County)2,788
- Walker township (Schuylkill County)1,004
- Wallace township3,768
- Ward township157
- Warminster township33,470
- Warren township (Bradford County)903
- Warren township (Franklin County)372
- Warrington township (Bucks County)25,972
- Warrington township (York County)4,584
- Warriors Mark township1,613
- Warsaw township1,441
- Warwick township (Bucks County)14,829
- Warwick township (Chester County)2,613
- Warwick township (Lancaster County)19,234
- Washington township (Armstrong County)703
- Washington township (Berks County)4,512
- Washington township (Butler County)1,368
- Washington township (Cambria County)980
- Washington township (Clarion County)1,614
- Washington township (Dauphin County)2,137
- Washington township (Erie County)4,380
- Washington township (Fayette County)3,787
- Washington township (Franklin County)15,182
- Washington township (Greene County)991
- Washington township (Indiana County)1,550
- Washington township (Jefferson County)1,606
- Washington township (Lawrence County)654
- Washington township (Lehigh County)6,595
- Washington township (Lycoming County)1,884
- Washington township (Northampton County)5,164
- Washington township (Northumberland County)798
- Washington township (Schuylkill County)3,134
- Washington township (Snyder County)1,511
- Washington township (Westmoreland County)6,843
- Washington township (Wyoming County)1,502
- Washington township (York County)2,603
- Waterford township3,893
- Watson township (Lycoming County)560
- Watson township (Warren County)204
- Watts township1,570
- Waverly township1,962
- Wayne township (Armstrong County)1,508
- Wayne township (Clinton County)1,253
- Wayne township (Crawford County)1,313
- Wayne township (Dauphin County)1,294
- Wayne township (Erie County)1,512
- Wayne township (Greene County)871
- Wayne township (Lawrence County)2,308
- Wayne township (Mifflin County)2,316
- Wayne township (Schuylkill County)5,277
- Weisenberg township5,018
- Wells township (Bradford County)952
- Wells township (Fulton County)473
- West Abington township290
- West Beaver township1,081
- West Bethlehem township1,277
- West Bradford township14,681
- West Branch township431
- West Brandywine township7,669
- West Brunswick township3,291
- West Buffalo township2,862
- West Burlington township662
- West Caln township8,980
- West Cameron township557
- West Carroll township1,272
- West Chillisquaque township2,604
- West Cocalico township7,577
- West Cornwall township2,111
- West Deer township12,228
- West Donegal township9,058
- West Earl township8,443
- West Fallowfield township (Chester County)2,625
- West Fallowfield township (Crawford County)701
- West Finley township708
- West Franklin township1,774
- West Goshen township23,553
- West Hanover township11,049
- West Hemlock township490
- West Hempfield township17,163
- West Keating township26
- West Lampeter township17,391
- West Lebanon township827
- West Mahanoy township2,885
- West Mahoning township1,451
- West Manchester township19,262
- West Manheim township9,839
- West Marlborough township777
- West Mead township4,974
- West Nantmeal township2,103
- West Norriton township16,324
- West Nottingham township2,823
- West Penn township4,451
- West Pennsboro township5,660
- West Perry township892
- West Pike Run township1,508
- West Pikeland township4,038
- West Pottsgrove township3,791
- West Providence township3,066
- West Rockhill township5,446
- West Sadsbury township2,633
- West Salem township3,201
- West Shenango township404
- West St. Clair township1,535
- West Taylor township706
- West township485
- West Vincent township6,841
- West Wheatfield township2,054
- West Whiteland township20,249
- Westfall township2,982
- Westfield township771
- Westtown township11,254
- Wetmore township1,838
- Wharton township (Fayette County)3,332
- Wharton township (Potter County)93
- Wheatfield township3,219
- White Deer township4,402
- White township (Beaver County)1,138
- White township (Cambria County)856
- White township (Indiana County)15,170
- Whitehall township29,317
- Whiteley township632
- Whitemarsh township19,966
- Whitpain township20,446
- Wiconisco township1,050
- Wilkes-Barre township3,198
- Wilkins township6,212
- Williams township (Dauphin County)1,178
- Williams township (Northampton County)6,589
- Willistown township11,366
- Wilmington township (Lawrence County)2,655
- Wilmington township (Mercer County)1,531
- Wilmot township1,086
- Windham township (Bradford County)768
- Windham township (Wyoming County)610
- Windsor township (Berks County)2,518
- Windsor township (York County)17,972
- Winfield township3,325
- Winslow township2,800
- Wolf Creek township750
- Wolf township3,095
- Wood township615
- Woodbury township (Bedford County)1,285
- Woodbury township (Blair County)1,643
- Woodcock township2,732
- Woodward township (Clearfield County)3,957
- Woodward township (Clinton County)2,422
- Woodward township (Lycoming County)1,939
- Worcester township10,793
- Worth township (Butler County)1,303
- Worth township (Centre County)603
- Worth township (Mercer County)733
- Wright township5,762
- Wrightstown township3,283
- Wyalusing township1,254
- Wysox township1,397
- York township30,398
- Young township (Indiana County)1,870
- Young township (Jefferson County)1,472
- Zerbe township1,832
School districts
Each of the 500 with people in it, from ACS 2020–2024 5-year estimates.
- Abington Heights School District24,608
- Abington School District61,298
- Albert Gallatin Area School District21,527
- Aliquippa School District9,079
- Allegheny Valley School District9,491
- Allegheny-Clarion Valley School District5,370
- Allentown City School District122,611
- Altoona Area School District56,459
- Ambridge Area School District23,295
- Annville-Cleona School District12,329
- Antietam School District8,087
- Apollo-Ridge School District9,078
- Armstrong School District40,849
- Athens Area School District14,432
- Austin Area School District1,180
- Avella Area School District3,877
- Avon Grove School District32,099
- Avonworth School District12,620
- Bald Eagle Area School District12,249
- Baldwin-Whitehall School District37,855
- Bangor Area School District21,897
- Beaver Area School District15,242
- Bedford Area School District16,198
- Belle Vernon Area School District18,230
- Bellefonte Area School District28,721
- Bellwood-Antis School District8,103
- Bensalem Township School District62,818
- Benton Area School District5,207
- Bentworth School District8,161
- Berlin Brothersvalley School District5,875
- Bermudian Springs School District13,269
- Berwick Area School District21,998
- Bethel Park School District33,282
- Bethlehem Area School District123,622
- Bethlehem-Center School District8,235
- Big Beaver Falls Area School District13,136
- Big Spring School District20,700
- Blackhawk School District18,379
- Blacklick Valley School District4,696
- Blairsville-Saltsburg School District12,351
- Bloomsburg Area School District19,020
- Blue Mountain School District20,705
- Blue Ridge School District6,508
- Boyertown Area School District50,840
- Bradford Area School District18,999
- Brandywine Heights Area School District12,889
- Brentwood Borough School District9,866
- Bristol Borough School District9,902
- Bristol Township School District54,173
- Brockway Area School District7,114
- Brookville Area School District11,873
- Brownsville Area School District13,719
- Bryn Athyn School District1,143
- Burgettstown Area School District9,331
- Burrell School District13,655
- Butler Area School District53,615
- California Area School District8,903
- Cambria Heights School District9,503
- Cameron County School District4,427
- Camp Hill School District8,169
- Canon-McMillan School District41,017
- Canton Area School District5,838
- Carbondale Area School District11,101
- Carlisle Area School District42,054
- Carlynton School District14,473
- Carmichaels Area School District6,613
- Catasauqua Area School District11,421
- Centennial School District49,593
- Central Bucks School District121,422
- Central Cambria School District13,257
- Central Columbia School District14,689
- Central Dauphin School District104,750
- Central Fulton School District6,213
- Central Greene School District14,378
- Central Valley School District17,729
- Central York School District40,080
- Chambersburg Area School District71,372
- Charleroi School District11,521
- Chartiers Valley School District32,162
- Chartiers-Houston School District10,340
- Cheltenham School District38,374
- Chester-Upland School District40,742
- Chestnut Ridge School District9,995
- Chichester School District24,116
- Clairton City School District6,044
- Clarion Area School District7,797
- Clarion-Limestone Area School District7,838
- Claysburg-Kimmel School District5,149
- Clearfield Area School District18,144
- Coatesville Area School District67,311
- Cocalico School District24,286
- Colonial School District47,665
- Columbia Borough School District10,278
- Commodore Perry School District3,944
- Conemaugh Township Area School District7,642
- Conemaugh Valley School District5,662
- Conestoga Valley School District35,340
- Conewago Valley School District28,241
- Conneaut School District16,689
- Connellsville Area School District31,303
- Conrad Weiser Area School District20,364
- Cornell School District6,502
- Cornwall-Lebanon School District38,642
- Corry Area School District14,071
- Coudersport Area School District5,412
- Council Rock School District74,110
- Cranberry Area School District8,696
- Crawford Central School District28,657
- Crestwood School District20,563
- Cumberland Valley School District68,596
- Curwensville Area School District7,000
- Dallas School District20,801
- Dallastown Area School District45,588
- Daniel Boone Area School District22,508
- Danville Area School District19,043
- Deer Lakes School District14,657
- Delaware Valley School District31,432
- Derry Area School District16,534
- Derry Township School District24,977
- Donegal School District22,667
- Dover Area School District25,220
- Downingtown Area School District78,902
- DuBois Area School District31,351
- Dunmore School District14,181
- Duquesne City School District5,149
- East Allegheny School District14,171
- East Lycoming School District10,468
- East Penn School District58,545
- East Pennsboro Area School District21,162
- East Stroudsburg Area School District48,514
- Eastern Lancaster County School District32,955
- Eastern Lebanon County School District22,442
- Eastern York School District19,305
- Easton Area School District69,466
- Elizabeth Forward School District17,070
- Elizabethtown Area School District32,340
- Elk Lake School District7,239
- Ellwood City Area School District13,155
- Ephrata Area School District35,495
- Erie City School District93,850
- Everett Area School District9,383
- Exeter Township School District27,459
- Fairfield Area School District8,162
- Fairview School District11,247
- Fannett-Metal School District4,102
- Farrell Area School District5,018
- Ferndale Area School District4,859
- Fleetwood Area School District16,937
- Forbes Road School District2,830
- Forest Area School District7,249
- Forest City Regional School District6,184
- Forest Hills School District11,580
- Fort Cherry School District7,957
- Fort LeBoeuf School District14,617
- Fox Chapel Area School District29,065
- Franklin Area School District14,852
- Franklin Regional School District23,596
- Frazier School District7,647
- Freedom Area School District10,752
- Freeport Area School District12,459
- Galeton Area School District2,583
- Garnet Valley School District30,905
- Gateway School District31,327
- General McLane School District16,292
- Gettysburg Area School District29,323
- Girard School District10,685
- Glendale School District4,945
- Governor Mifflin School District31,749
- Great Valley School District35,895
- Greater Johnstown School District24,064
- Greater Latrobe School District29,614
- Greater Nanticoke Area School District18,117
- Greencastle-Antrim School District20,240
- Greensburg Salem School District25,314
- Greenville Area School District10,026
- Greenwood School District5,494
- Grove City Area School District16,778
- Halifax Area School District6,872
- Hamburg Area School District18,002
- Hampton Township School District18,185
- Hanover Area School District15,589
- Hanover Public School District16,584
- Harbor Creek School District16,671
- Harmony Area School District2,185
- Harrisburg City School District50,287
- Hatboro-Horsham School District35,253
- Haverford Township School District50,874
- Hazleton Area School District78,908
- Hempfield Area School District48,638
- Hempfield School District51,503
- Hermitage School District16,041
- Highlands School District19,562
- Hollidaysburg Area School District26,506
- Homer-Center School District6,142
- Hopewell Area School District18,243
- Huntingdon Area School District19,818
- Indiana Area School District32,183
- Interboro School District23,551
- Iroquois School District6,954
- Jamestown Area School District4,161
- Jeannette City School District8,657
- Jefferson-Morgan School District5,138
- Jenkintown School District4,727
- Jersey Shore Area School District16,761
- Jim Thorpe Area School District16,066
- Johnsonburg Area School District4,237
- Juniata County School District22,785
- Juniata Valley School District5,144
- Kane Area School District6,905
- Karns City Area School District9,459
- Kennett Consolidated School District28,226
- Keystone Central School District36,264
- Keystone Oaks School District20,704
- Keystone School District7,149
- Kiski Area School District27,906
- Knoch School District17,454
- Kutztown Area School District17,904
- Lackawanna Trail School District7,972
- Lake-Lehman School District16,288
- Lakeland School District12,265
- Lakeview School District7,815
- Lampeter-Strasburg School District25,508
- Lancaster School District75,890
- Laurel Highlands School District22,212
- Laurel School District7,475
- Lebanon School District27,363
- Leechburg Area School District5,418
- Lehighton Area School District17,689
- Lewisburg Area School District17,956
- Ligonier Valley School District14,998
- Line Mountain School District8,920
- Littlestown Area School District16,189
- Lower Dauphin School District25,750
- Lower Merion School District68,685
- Lower Moreland Township School District14,070
- Loyalsock Township School District11,491
- Mahanoy Area School District10,888
- Manheim Central School District27,598
- Manheim Township School District44,208
- Marion Center Area School District9,620
- Marple Newtown School District39,476
- Mars Area School District24,353
- McGuffey School District11,444
- McKeesport Area School District28,017
- Mechanicsburg Area School District35,298
- Mercer Area School District10,168
- Methacton School District36,690
- Meyersdale Area School District6,546
- Mid Valley School District15,485
- Midd-West School District17,088
- Middletown Area School District20,369
- Midland Borough School District2,293
- Mifflin County School District43,217
- Mifflinburg Area School District16,088
- Millcreek Township School District53,472
- Millersburg Area School District6,557
- Millville Area School District5,422
- Milton Area School District15,717
- Minersville Area School District8,909
- Mohawk Area School District9,539
- Monessen City School District6,780
- Moniteau School District8,470
- Montgomery Area School District7,590
- Montour School District28,501
- Montoursville Area School District12,863
- Montrose Area School District10,660
- Moon Area School District29,043
- Morrisville Borough School District9,752
- Moshannon Valley School District8,306
- Mount Carmel Area School District11,481
- Mount Lebanon School District33,370
- Mount Pleasant Area School District16,014
- Mount Union Area School District8,988
- Mountain View School District8,085
- Muhlenberg School District26,411
- Muncy School District7,342
- Nazareth Area School District32,344
- Neshaminy School District73,054
- Neshannock Township School District9,721
- New Brighton Area School District10,186
- New Castle Area School District22,635
- New Hope-Solebury School District11,307
- New Kensington-Arnold School District16,715
- Newport School District7,674
- Norristown Area School District66,323
- North Allegheny School District55,833
- North Clarion County School District4,508
- North East School District10,538
- North Hills School District39,472
- North Penn School District106,423
- North Pocono School District20,403
- North Schuylkill School District15,886
- North Star School District8,702
- Northampton Area School District44,278
- Northeast Bradford School District5,404
- Northeastern York School District25,725
- Northern Bedford County School District6,906
- Northern Cambria School District7,360
- Northern Lebanon School District17,876
- Northern Lehigh School District12,970
- Northern Potter School District3,994
- Northern Tioga School District14,360
- Northern York County School District25,433
- Northgate School District12,802
- Northwest Area School District8,243
- Northwestern Lehigh School District14,786
- Northwestern School District11,326
- Norwin School District36,775
- Octorara Area School District18,883
- Oil City Area School District13,766
- Old Forge School District8,573
- Oley Valley School District13,295
- Oswayo Valley School District3,164
- Otto-Eldred School District3,537
- Owen J. Roberts School District37,236
- Oxford Area School District27,724
- Palisades School District15,530
- Palmerton Area School District14,180
- Palmyra Area School District25,534
- Panther Valley School District13,151
- Parkland School District68,427
- Pen Argyl Area School District13,096
- Penn Cambria School District15,183
- Penn Hills School District40,518
- Penn Manor School District46,007
- Penn-Delco School District27,390
- Penn-Trafford School District27,289
- Penncrest School District22,826
- Pennridge School District52,740
- Penns Manor Area School District5,126
- Penns Valley Area School District12,709
- Pennsbury School District73,004
- Pequea Valley School District22,879
- Perkiomen Valley School District39,068
- Peters Township School District23,167
- Philadelphia City School District1.58M
- Philipsburg-Osceola Area School District14,284
- Phoenixville Area School District36,835
- Pine Grove Area School District11,593
- Pine-Richland School District26,990
- Pittsburgh School District308,078
- Pittston Area School District27,667
- Pleasant Valley School District32,105
- Plum Borough School District26,723
- Pocono Mountain School District63,442
- Port Allegany School District5,765
- Portage Area School District5,989
- Pottsgrove School District22,412
- Pottstown School District23,476
- Pottsville Area School District18,656
- Punxsutawney Area School District20,302
- Purchase Line School District5,978
- Quaker Valley School District13,496
- Quakertown Community School District37,754
- Radnor Township School District33,718
- Reading School District95,242
- Red Lion Area School District38,428
- Redbank Valley School District7,297
- Reynolds School District8,625
- Richland School District14,230
- Ridgway Area School District6,759
- Ridley School District40,746
- Ringgold School District24,713
- Riverside Beaver County School District9,996
- Riverside School District12,238
- Riverview School District9,226
- Rochester Area School District6,747
- Rockwood Area School District5,005
- Rose Tree Media School District37,931
- Salisbury Township School District13,677
- Salisbury-Elk Lick School District3,022
- Saucon Valley School District17,207
- Sayre Area School District7,804
- Schuylkill Haven Area School District8,484
- Schuylkill Valley School District16,235
- Scranton School District76,033
- Selinsgrove Area School District22,580
- Seneca Valley School District56,601
- Shade-Central City School District3,294
- Shaler Area School District37,381
- Shamokin Area School District19,613
- Shanksville-Stonycreek School District2,722
- Sharon City School District12,936
- Sharpsville Area School District7,380
- Shenandoah Valley School District7,031
- Shenango Area School District7,774
- Shikellamy School District22,297
- Shippensburg Area School District29,705
- Slippery Rock Area School District22,346
- Smethport Area School District5,502
- Solanco School District33,593
- Somerset Area School District20,097
- Souderton Area School District47,923
- South Allegheny School District11,230
- South Eastern School District19,369
- South Fayette Township School District18,460
- South Middleton School District16,754
- South Park School District13,706
- South Side Area School District6,054
- South Western School District31,306
- South Williamsport Area School District9,263
- Southeast Delco School District30,862
- Southeastern Greene School District4,408
- Southern Columbia Area School District10,234
- Southern Fulton School District5,488
- Southern Huntingdon County School District7,579
- Southern Lehigh School District23,851
- Southern Tioga School District14,611
- Southern York County School District22,250
- Southmoreland School District14,513
- Spring Cove School District13,348
- Spring Grove Area School District29,735
- Spring-Ford Area School District54,246
- Springfield School District27,811
- Springfield Township School District21,005
- St. Clair Area School District6,235
- St. Marys Area School District18,236
- State College Area School District95,318
- Steel Valley School District15,327
- Steelton-Highspire School District9,028
- Sto-Rox School District12,080
- Stroudsburg Area School District34,952
- Sullivan County School District5,888
- Susquehanna Community School District4,753
- Susquehanna Township School District27,245
- Susquenita School District14,528
- Tamaqua Area School District16,140
- Titusville Area School District12,893
- Towanda Area School District10,383
- Tredyffrin-Easttown School District42,989
- Tri-Valley School District6,564
- Trinity Area School District26,353
- Troy Area School District9,960
- Tulpehocken Area School District12,825
- Tunkhannock Area School District17,337
- Turkeyfoot Valley Area School District2,548
- Tuscarora School District18,273
- Tussey Mountain School District6,429
- Twin Valley School District25,958
- Tyrone Area School District12,634
- Union Area School District5,285
- Union City Area School District6,168
- Union School District4,274
- Uniontown Area School District22,342
- Unionville-Chadds Ford School District24,585
- United School District7,625
- Upper Adams School District10,931
- Upper Darby School District93,785
- Upper Dauphin Area School District9,700
- Upper Dublin School District27,122
- Upper Merion Area School District41,687
- Upper Moreland Township School District26,131
- Upper Perkiomen School District25,391
- Upper St. Clair School District20,863
- Valley Grove School District5,918
- Valley View School District18,561
- Wallenpaupack Area School District25,650
- Wallingford-Swarthmore School District23,136
- Warren County School District34,764
- Warrior Run School District15,834
- Warwick School District32,832
- Washington School District15,082
- Wattsburg Area School District10,116
- Wayne Highlands School District20,545
- Waynesboro Area School District33,382
- Weatherly Area School District5,040
- Wellsboro Area School District11,895
- West Allegheny School District24,294
- West Branch Area School District7,670
- West Chester Area School District115,022
- West Greene School District4,298
- West Jefferson Hills School District21,060
- West Middlesex Area School District6,606
- West Mifflin Area School District20,330
- West Perry School District19,251
- West Shore School District67,264
- West York Area School District24,354
- Western Beaver County School District5,030
- Western Wayne School District17,985
- Westmont Hilltop School District11,995
- Whitehall-Coplay School District32,783
- Wilkes-Barre Area School District63,127
- Wilkinsburg Borough School District14,027
- William Penn School District43,286
- Williams Valley School District7,515
- Williamsburg Community School District3,341
- Williamsport Area School District39,635
- Wilmington Area School District11,134
- Wilson Area School District16,391
- Wilson School District41,974
- Windber Area School District8,137
- Wissahickon School District39,512
- Woodland Hills School District44,380
- Wyalusing Area School District8,693
- Wyoming Area School District19,330
- Wyoming Valley West School District41,858
- Wyomissing Area School District13,165
- York City School District44,894
- York Suburban School District23,365
- Yough School District15,151
Congressional districts
As drawn for the 119th Congress (2025–2027).
- Congressional District 1767,357
- Congressional District 2746,424
- Congressional District 3762,762
- Congressional District 4774,814
- Congressional District 5765,322
- Congressional District 6779,553
- Congressional District 7775,601
- Congressional District 8768,757
- Congressional District 9765,525
- Congressional District 10779,640
- Congressional District 11772,863
- Congressional District 12760,856
- Congressional District 13765,396
- Congressional District 14757,997
- Congressional District 15758,565
- Congressional District 16762,592
- Congressional District 17754,615
State senate districts
The upper chamber’s districts, as drawn in 2024.
- State Senate District 1236,056
- State Senate District 2249,042
- State Senate District 3264,272
- State Senate District 4276,093
- State Senate District 5258,525
- State Senate District 6269,469
- State Senate District 7267,595
- State Senate District 8248,744
- State Senate District 9255,239
- State Senate District 10269,886
- State Senate District 11264,942
- State Senate District 12266,500
- State Senate District 13264,326
- State Senate District 14268,849
- State Senate District 15262,406
- State Senate District 16267,764
- State Senate District 17261,287
- State Senate District 18268,865
- State Senate District 19259,381
- State Senate District 20273,132
- State Senate District 21256,770
- State Senate District 22251,559
- State Senate District 23262,636
- State Senate District 24268,047
- State Senate District 25266,616
- State Senate District 26255,194
- State Senate District 27260,968
- State Senate District 28266,284
- State Senate District 29268,077
- State Senate District 30248,881
- State Senate District 31264,837
- State Senate District 32250,672
- State Senate District 33263,494
- State Senate District 34273,552
- State Senate District 35257,727
- State Senate District 36271,388
- State Senate District 37246,283
- State Senate District 38249,269
- State Senate District 39260,647
- State Senate District 40256,302
- State Senate District 41252,247
- State Senate District 42248,399
- State Senate District 43248,830
- State Senate District 44271,263
- State Senate District 45245,396
- State Senate District 46250,408
- State Senate District 47257,130
- State Senate District 48271,579
- State Senate District 49260,197
- State Senate District 50261,614
State house districts
The lower chamber’s districts, as drawn in 2024.
- State House District 165,016
- State House District 264,229
- State House District 364,719
- State House District 464,353
- State House District 566,214
- State House District 663,818
- State House District 765,164
- State House District 864,276
- State House District 963,237
- State House District 1057,600
- State House District 1163,999
- State House District 1267,207
- State House District 1365,246
- State House District 1466,075
- State House District 1565,554
- State House District 1664,380
- State House District 1767,652
- State House District 1863,743
- State House District 1962,344
- State House District 2060,246
- State House District 2161,741
- State House District 2261,705
- State House District 2359,651
- State House District 2463,236
- State House District 2563,481
- State House District 2665,584
- State House District 2761,724
- State House District 2864,047
- State House District 2965,675
- State House District 3061,809
- State House District 3167,001
- State House District 3263,244
- State House District 3360,547
- State House District 3461,162
- State House District 3563,682
- State House District 3660,158
- State House District 3767,378
- State House District 3863,210
- State House District 3965,143
- State House District 4065,155
- State House District 4165,088
- State House District 4263,385
- State House District 4364,541
- State House District 4465,344
- State House District 4564,956
- State House District 4667,411
- State House District 4764,515
- State House District 4866,276
- State House District 4963,098
- State House District 5065,417
- State House District 5163,087
- State House District 5262,910
- State House District 5366,575
- State House District 5463,592
- State House District 5565,240
- State House District 5666,080
- State House District 5766,594
- State House District 5862,743
- State House District 5965,878
- State House District 6063,228
- State House District 6164,236
- State House District 6265,532
- State House District 6364,538
- State House District 6461,226
- State House District 6562,843
- State House District 6661,374
- State House District 6760,519
- State House District 6863,710
- State House District 6964,622
- State House District 7068,488
- State House District 7162,057
- State House District 7263,096
- State House District 7361,163
- State House District 7465,949
- State House District 7562,540
- State House District 7662,771
- State House District 7762,127
- State House District 7862,044
- State House District 7962,210
- State House District 8061,204
- State House District 8166,029
- State House District 8265,006
- State House District 8364,368
- State House District 8463,421
- State House District 8565,692
- State House District 8664,589
- State House District 8769,128
- State House District 8869,147
- State House District 8967,136
- State House District 9065,730
- State House District 9167,733
- State House District 9268,296
- State House District 9366,152
- State House District 9464,031
- State House District 9566,473
- State House District 9663,935
- State House District 9766,403
- State House District 9867,492
- State House District 9963,496
- State House District 10064,294
- State House District 10165,797
- State House District 10265,904
- State House District 10364,848
- State House District 10464,418
- State House District 10565,304
- State House District 10667,910
- State House District 10766,929
- State House District 10864,479
- State House District 10965,362
- State House District 11063,060
- State House District 11165,824
- State House District 11263,206
- State House District 11360,931
- State House District 11463,638
- State House District 11562,280
- State House District 11665,192
- State House District 11761,751
- State House District 11862,176
- State House District 11961,556
- State House District 12063,343
- State House District 12161,668
- State House District 12265,382
- State House District 12365,765
- State House District 12466,969
- State House District 12564,263
- State House District 12664,645
- State House District 12759,974
- State House District 12864,565
- State House District 12964,972
- State House District 13065,775
- State House District 13166,528
- State House District 13265,892
- State House District 13366,010
- State House District 13463,998
- State House District 13567,402
- State House District 13664,936
- State House District 13766,939
- State House District 13866,767
- State House District 13965,151
- State House District 14062,319
- State House District 14164,075
- State House District 14264,253
- State House District 14366,440
- State House District 14465,693
- State House District 14562,802
- State House District 14665,747
- State House District 14767,138
- State House District 14864,402
- State House District 14965,936
- State House District 15064,567
- State House District 15162,933
- State House District 15261,634
- State House District 15362,817
- State House District 15464,106
- State House District 15566,297
- State House District 15668,988
- State House District 15763,219
- State House District 15864,449
- State House District 15962,618
- State House District 16064,216
- State House District 16163,759
- State House District 16264,157
- State House District 16364,873
- State House District 16462,350
- State House District 16562,637
- State House District 16663,537
- State House District 16765,690
- State House District 16864,320
- State House District 16966,699
- State House District 17060,873
- State House District 17165,560
- State House District 17262,675
- State House District 17359,121
- State House District 17461,399
- State House District 17560,015
- State House District 17662,512
- State House District 17761,211
- State House District 17865,460
- State House District 17961,988
- State House District 18059,616
- State House District 18158,137
- State House District 18260,169
- State House District 18366,569
- State House District 18460,654
- State House District 18559,915
- State House District 18659,197
- State House District 18766,028
- State House District 18860,351
- State House District 18961,850
- State House District 19061,699
- State House District 19161,176
- State House District 19264,833
- State House District 19364,705
- State House District 19462,897
- State House District 19563,262
- State House District 19666,758
- State House District 19761,894
- State House District 19866,057
- State House District 19966,575
- State House District 20067,600
- State House District 20171,778
- State House District 20259,898
- State House District 20364,864
PUMAs
Public Use Microdata Areas: areas of 100,000 people or more that the state draws from census tracts, for the Census Bureau’s microdata.
- Adams & Franklin (Southeast) Counties PUMA132,344
- Allegheny County (East)–Monroeville Municipality, Plum & Wilkinsburg Boroughs PUMA169,977
- Allegheny County (North Central) PUMA126,661
- Allegheny County (North)–Franklin Park Borough & Allison Park PUMA162,893
- Allegheny County (South Central)–Baldwin & Whitehall Boroughs PUMA128,678
- Allegheny County (South)–Bethel Park Municipality & Jefferson Hills Borough PUMA119,189
- Allegheny County (Southeast)–West Mifflin Borough, McKeesport City & Munhall Borough PUMA107,866
- Allegheny County (West) PUMA114,835
- Allentown City PUMA125,976
- Beaver County (South) PUMA137,445
- Berks County (East) PUMA150,607
- Berks County (Northwest)–Wyomissing Borough PUMA130,713
- Berks County (Southwest)–Reading City PUMA151,695
- Blair & Huntingdon Counties–Altoona City PUMA164,930
- Bradford, Tioga, Susquehanna & Sullivan Counties PUMA144,910
- Bucks County (Eastern Lower) PUMA146,831
- Bucks County (Northern Central) PUMA118,120
- Bucks County (Southern Central) PUMA138,532
- Bucks County (Upper) PUMA108,106
- Bucks County (Western Lower) PUMA135,872
- Butler County PUMA197,254
- Cambria County PUMA131,538
- Carbon & Lehigh (North) Counties PUMA134,725
- Centre County PUMA158,576
- Chester County (East Central)–West Chester Borough PUMA126,056
- Chester County (North) PUMA103,525
- Chester County (South) PUMA107,136
- Chester County (West Central)–Coatesville City PUMA103,923
- Chester County (West)–Phoenixville Borough PUMA107,200
- Clearfield, McKean, Elk, Potter & Cameron Counties PUMA169,660
- Columbia & Luzerne (West) Counties–Bloomsburg Town & Berwick Borough PUMA126,546
- Crawford & Warren Counties PUMA120,636
- Cumberland (West) & Perry Counties–Carlisle Borough PUMA145,361
- Cumberland County (East) PUMA169,201
- Dauphin County (Central)–Harrisburg City & Colonial Park PUMA174,098
- Dauphin County (Outer)–Hershey PUMA115,495
- Delaware County (East)–Yeadon, Lansdowne, Darby Boroughs & Drexel Hill PUMA162,557
- Delaware County (North)–Broomall PUMA162,992
- Delaware County (Southeast)–Chester City PUMA148,703
- Delaware County (West) PUMA104,970
- Erie City, Millcreek township, Lawrence Park Township & Wesleyville Borough PUMA154,276
- Erie County (Outer) PUMA114,776
- Fayette County PUMA125,997
- Franklin County (Outside Washington Township & Waynesboro Borough) PUMA131,150
- Indiana & Armstrong Counties PUMA147,664
- Lackawanna (Outside Greater Scranton City) & Wyoming Counties PUMA131,088
- Lackawanna County–Scranton City, Dunmore, Old Forge, Taylor & Moosic Boroughs PUMA111,025
- Lancaster County (East)–Ephrata Borough PUMA177,498
- Lancaster County (Northwest)–Elizabethtown Borough PUMA116,717
- Lancaster County (Southwest)–Columbia Borough PUMA141,064
- Lancaster County–Lancaster City, East Lampeter, Lancaster & West Lampeter Townships PUMA122,652
- Lawrence & Beaver (North) Counties–New Castle City PUMA113,903
- Lebanon County PUMA144,186
- Lehigh County (South, Outside Allentown & Bethlehem Cities)–Emmaus Borough PUMA163,487
- Luzerne County (East)–Kingston Borough PUMA129,056
- Luzerne County (South Central)–Wilkes-Barre & Hazleton Cities PUMA137,435
- Lycoming & Clinton Counties PUMA151,287
- Mercer County PUMA109,257
- Mifflin, Union, Snyder & Juniata Counties PUMA151,544
- Monroe County PUMA167,515
- Montgomery County (Eastern Lower) PUMA125,404
- Montgomery County (Eastern Upper) PUMA107,252
- Montgomery County (Northeastern Lower)–Willow Grove & Horsham PUMA143,231
- Montgomery County (Northern Central)–Lansdale Borough PUMA106,203
- Montgomery County (Southern Central)–Norristown Borough PUMA150,678
- Montgomery County (Southern Lower)–King of Prussia PUMA110,372
- Montgomery County (Western Upper)–Pottstown Borough PUMA124,433
- Northampton (South) & Lehigh (East) Counties–Bethlehem (East) & Easton Cities PUMA182,125
- Northampton County (North) PUMA156,441
- Northumberland & Montour Counties PUMA108,663
- Philadelphia City (Central and Lower Northeast) PUMA185,606
- Philadelphia City (Central) PUMA140,361
- Philadelphia City (Far Northeast) PUMA140,701
- Philadelphia City (Lower North and River Wards) PUMA170,402
- Philadelphia City (North Delaware) PUMA98,069
- Philadelphia City (North) PUMA133,177
- Philadelphia City (Northwest) PUMA146,446
- Philadelphia City (South and Lower South) PUMA138,401
- Philadelphia City (University-Southwest and Lower Southwest) PUMA123,257
- Philadelphia City (Upper North) PUMA146,819
- Philadelphia City (West and West Park) PUMA156,467
- Pike & Wayne Counties PUMA111,883
- Pittsburgh City (North) PUMA197,009
- Pittsburgh City (South) PUMA111,069
- Schuylkill County PUMA143,558
- Somerset, Bedford & Fulton Counties PUMA134,843
- Venango, Jefferson, Clarion & Forest Counties PUMA137,559
- Washington (South) & Greene Counties PUMA107,985
- Washington County (North)–Washington City PUMA136,892
- Westmoreland County (East & South) PUMA117,447
- Westmoreland County (Northwest)–Murrysville Municipality & New Kensington City PUMA112,690
- Westmoreland County (West)–Greensburg City PUMA122,363
- York County (Central)–York City & Shiloh PUMA174,954
- York County (North)–Weigelstown PUMA133,683
- York County (South) PUMA154,287
Urban areas
Each that reaches into Pennsylvania, with its whole population. Urban areas are the densely settled land the Census Bureau draws after each census, whatever the city lines.
- Allentown–Bethlehem, PA–NJ632,251
- Altoona, PA73,522
- Ashland, PA4,153
- Bedford, PA3,988
- Bellefonte, PA15,685
- Birdsboro–Amity, PA16,661
- Blairsville, PA5,634
- Bloomsburg–Berwick, PA39,961
- Bradford, PA–NY10,854
- Brookville, PA4,337
- Butler, PA38,289
- California–Brownsville, PA10,413
- Chambersburg, PA52,207
- Clarion, PA6,032
- Clearfield, PA10,775
- Conneaut Lakeshore, PA2,223
- Connellsville, PA30,512
- Coolbaugh–Pocono Pines, PA24,208
- Corry, PA5,641
- Cresson, PA6,370
- Cumberland, MD–WV–PA45,480
- Danville–Mahoning, PA9,794
- DuBois, PA11,897
- East Liverpool, OH–WV–PA21,457
- East Stroudsburg–Stroudsburg, PA49,560
- Ebensburg, PA4,331
- Edinboro, PA6,490
- Ellwood City, PA13,135
- Erie, PA186,797
- Franklin (Venango County), PA8,509
- Freeland, PA5,686
- Gettysburg–Cumberland, PA16,635
- Greenville, PA10,698
- Grove City, PA10,064
- Hagerstown, MD–WV–PA–VA201,864
- Hanover, PA57,636
- Harrisburg, PA503,631
- Hazleton, PA50,783
- Honesdale, PA5,276
- Huntingdon, PA11,353
- Indiana–White, PA27,908
- Jersey Shore, PA9,783
- Johnstown, PA62,155
- Kittanning–Ford City, PA14,765
- Kutztown, PA9,636
- Lambertville, NJ–PA9,915
- Lancaster–Manheim, PA402,312
- Lebanon, PA76,127
- Lehighton–Palmerton–Jim Thorpe, PA18,792
- Lewistown, PA20,674
- Littlestown, PA6,683
- Lock Haven, PA14,704
- Mahanoy City, PA3,710
- Maytown–Marietta, PA8,046
- Meadville, PA19,726
- Millersburg, PA4,847
- Milton, PA27,799
- Monessen, PA48,916
- Mountain Top, PA11,194
- Muncy, PA8,297
- New Castle, PA39,280
- New Freedom–Shrewsbury, PA12,684
- North East, PA6,510
- Oil City, PA14,066
- Oxford, PA11,239
- Palmyra, PA3,207
- Pennsburg–Upper Hanover–East Greenville, PA17,666
- Philadelphia, PA–NJ–DE–MD5.73M
- Philipsburg, PA9,163
- Pittsburgh, PA1.74M
- Port Jervis, NY–PA17,050
- Portage, PA5,728
- Pottsville, PA29,393
- Punxsutawney, PA5,954
- Reading, PA277,596
- Ridgway, PA4,326
- Roaring Spring, PA6,241
- Sayre–Waverly, PA–NY16,941
- Schuylkill Haven–Orwigsburg, PA14,370
- Scranton, PA368,443
- Shamokin–Mount Carmel, PA28,022
- Sharon–Hermitage, PA–OH42,407
- Shenandoah–Frackville, PA12,077
- Shippensburg, PA16,594
- Slatington, PA8,311
- Slippery Rock, PA8,173
- Somerset, PA9,944
- St. Marys, PA9,752
- State College, PA83,229
- Steubenville–Weirton, OH–WV–PA63,495
- Sunbury, PA28,245
- Swatara, PA6,554
- Tamaqua, PA15,370
- Titusville, PA5,166
- Towanda, PA4,126
- Treasure Lake, PA4,609
- Tyrone, PA9,570
- Uniontown, PA31,376
- Warren, PA15,015
- Waynesboro, PA–MD23,403
- Waynesburg, PA8,144
- Williamsport, PA55,436
- York, PA243,415
Turn Pennsylvania into your planning report.
Social Explorer Studio builds an editable profile of any place, with tables and charts beside the county and state, and exports to Word, PDF and Excel.
Questions about Pennsylvania
What is the population of Pennsylvania?
13,059,432 people, according to the ACS 2025 1-year estimates, which the Census Bureau adjusts to match its own population estimate. That’s the 5th largest of the 50 states and DC.
What is the FIPS code for Pennsylvania?
42. Every county’s and place’s FIPS code in Pennsylvania starts with it. The Census Bureau’s full geographic identifier (GEOID) is 0400000US42.
What is the largest city in Pennsylvania?
Philadelphia, with 1,574,281 people. Other large cities here include Pittsburgh, Allentown and Reading.
What is the median household income in Pennsylvania?
$81,473 (±$603), according to the ACS 2025 1-year estimates, lower than the US ($84,780).
What is the median age in Pennsylvania?
41.4 years (±0.1), according to the ACS 2025 1-year estimates, higher than the US (39.5).
How much does housing cost in Pennsylvania?
Pennsylvania’s median home value is $292,400 (±$1,766) and its median gross rent is $1,329 (±$13) a month, according to the ACS 2025 1-year estimates. 45.0% (±1.1%) of its renters pay 30% or more of their income on rent.
Is Pennsylvania growing?
Pennsylvania’s population grew 2.0%, from 12,802,503 in 2015 to 13,059,432 in 2025, according to the ACS 1-year estimates.
Where do people who work in Pennsylvania live?
5,550,843 of its 5,901,664 jobs are held by people who live here. Of those who commute in, the most come from New Jersey, New York, Delaware.
Where does this census data come from?
The U.S. Census Bureau’s American Community Survey, through Social Explorer’s tables: the latest 1-year estimates where they exist, for the most recent numbers, and 5-year estimates otherwise. Each table lists its code, so you can find it again.
Is this data free to use?
Yes. You can read it, cite it, download the CSV and embed the charts, with no account. To map other variables, compare your own areas or build a report, see Social Explorer’s plans in a live demo.
Sources and how to cite
American Community Survey 2025 1-year estimates, or 2020–2024 5-year estimates where noted, U.S. Census Bureau, from Social Explorer’s tables A00001, A00002, A01004, A04001, A06001, A08001, A09005, A10001, A10003, A10008, A10030, A10036, A10040, A10047, A10055, A10060, A12001, A13004, A14006, A14024, A14028, A16002, A17005, A18002, A18009, A20001, B02002, B09001, B13002, B18101, C16001. Maps by census tract use 2020–2024 5-year estimates, since the 1-year survey doesn’t cover tracts. Commuting: LEHD LODES 2023. These are estimates from a sample, each with its margin of error. Data retrieved November 14, 2026. How these profiles are made.
U.S. Census Bureau, American Community Survey 2025 1-year estimates, or 2020–2024 5-year estimates where noted, via Social Explorer. “Pennsylvania.” https://www.socialexplorer.com/places/pennsylvania. Accessed November 14, 2026.