

Population mapping software:
See every neighborhood.
From every angle.
Social Explorer Maps shades states, counties, tracts and block groups by 610,000+ variables from the census and other public sources, as fine as each dataset goes, on a map you can search, tilt, compare and share.

- Population
- 217,783
- People per sq mi
- 1,974
- Median household income
- $77,186
Take a closer look.
-
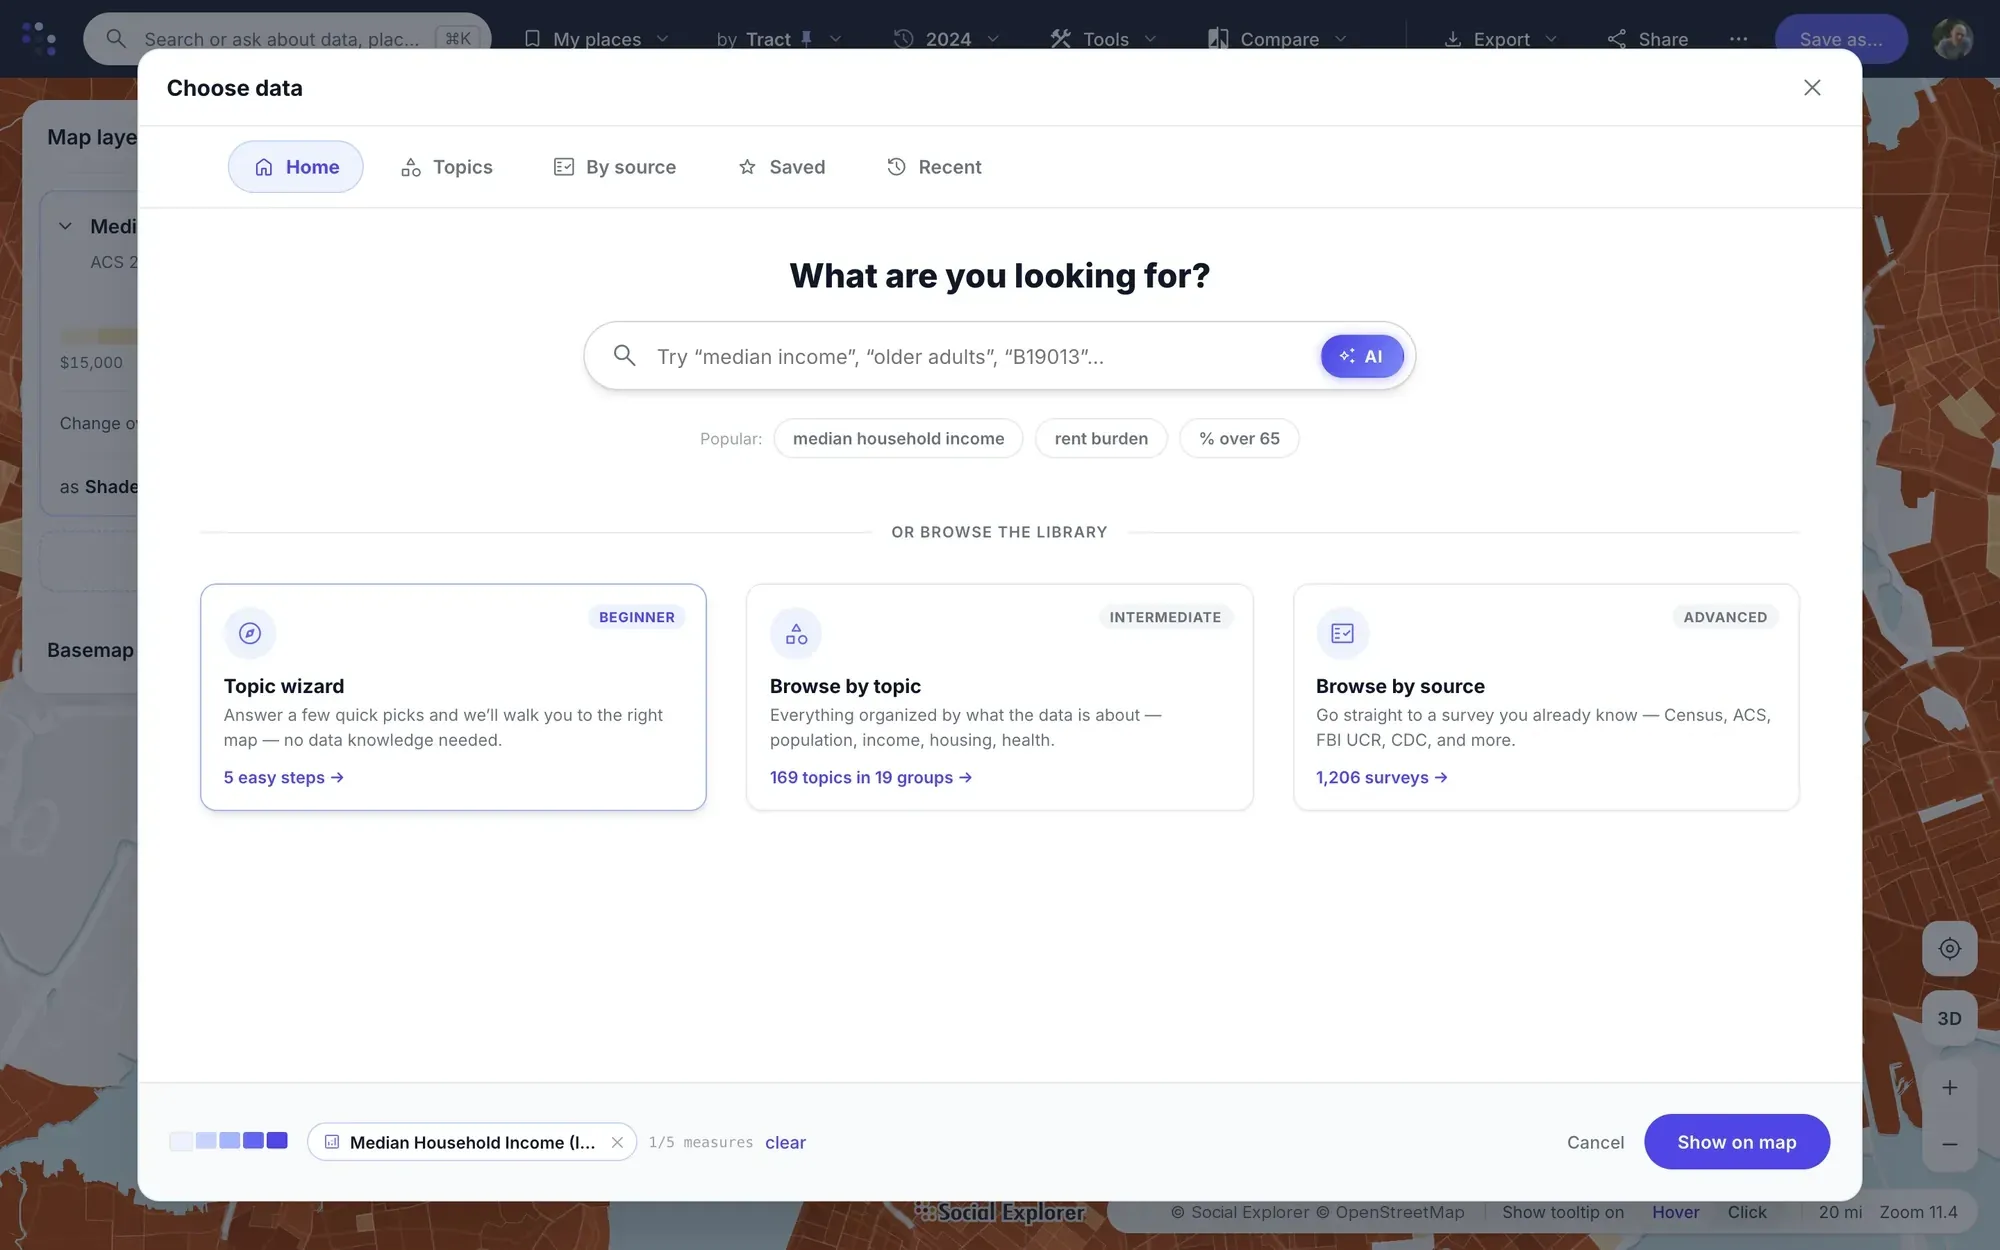
Beginners follow a five-step topic wizard; others browse 169 topics or go straight to one of 1,206 surveys: Census, ACS, FBI UCR, CDC and more.
-
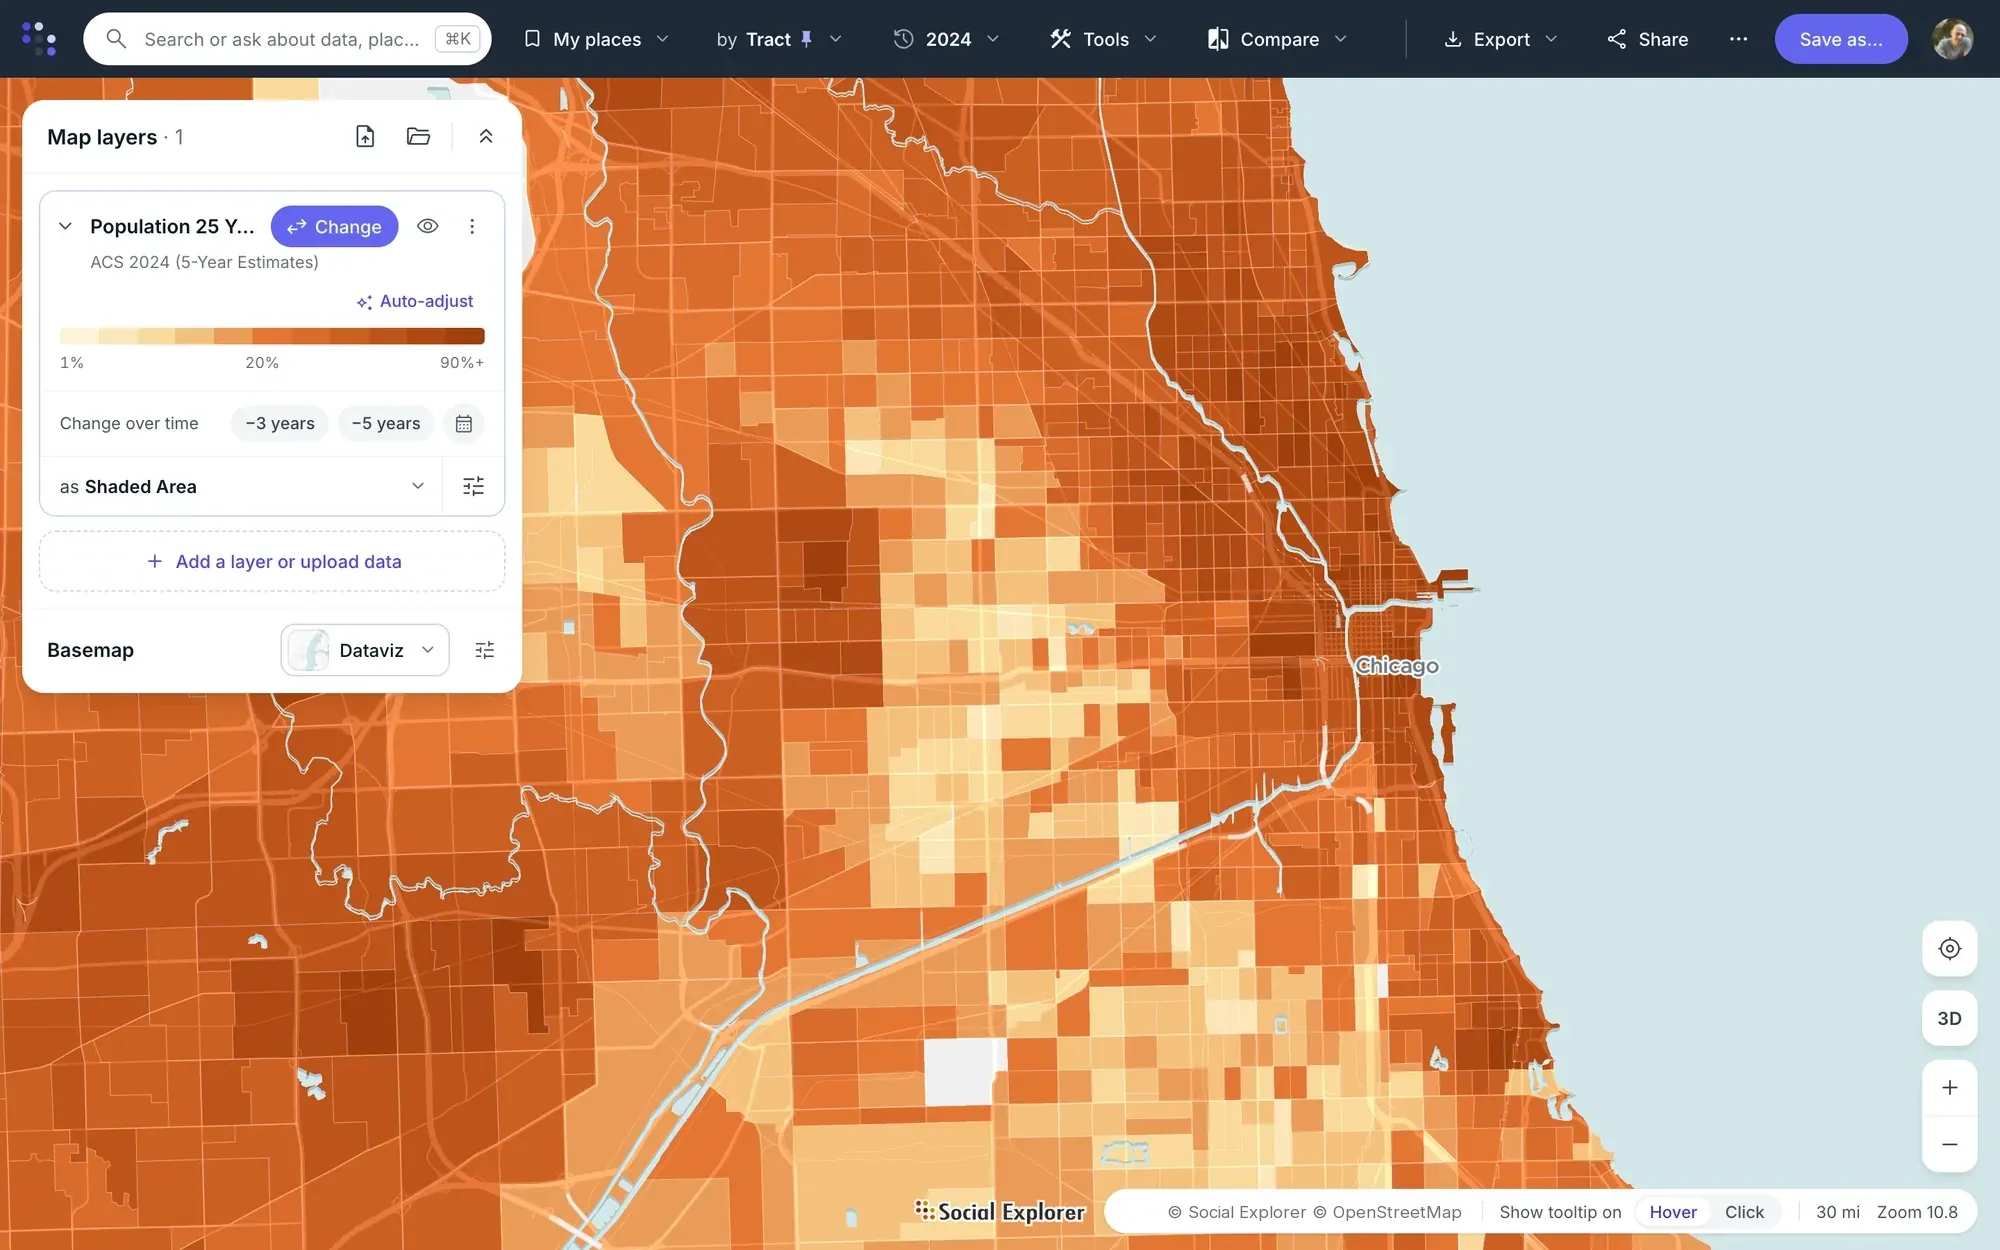
One panel holds the variable, its year and geography, how it’s drawn, its colors and its classes. Pin a geography level, or let it follow the zoom.
-
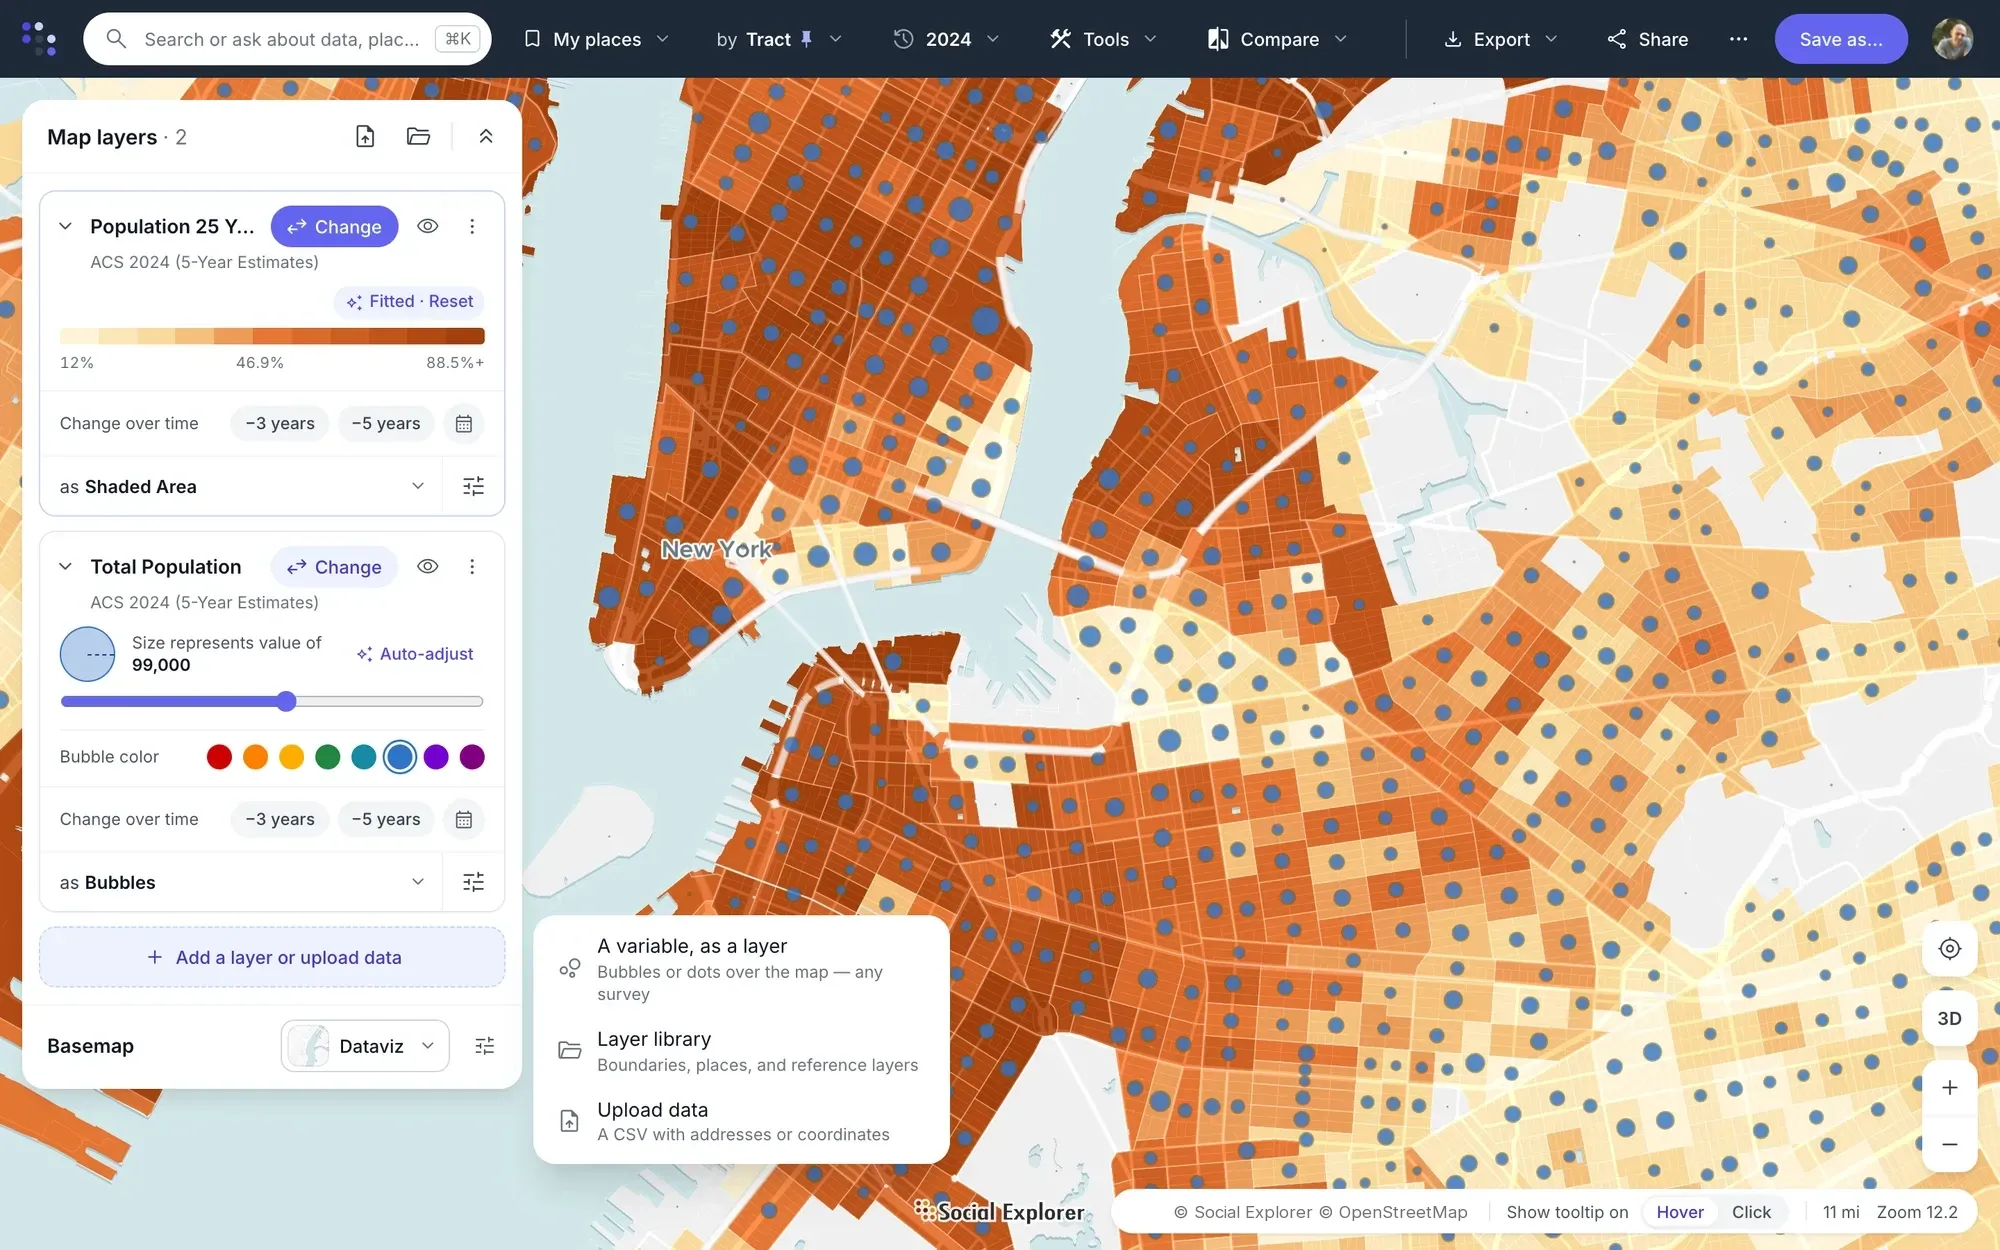
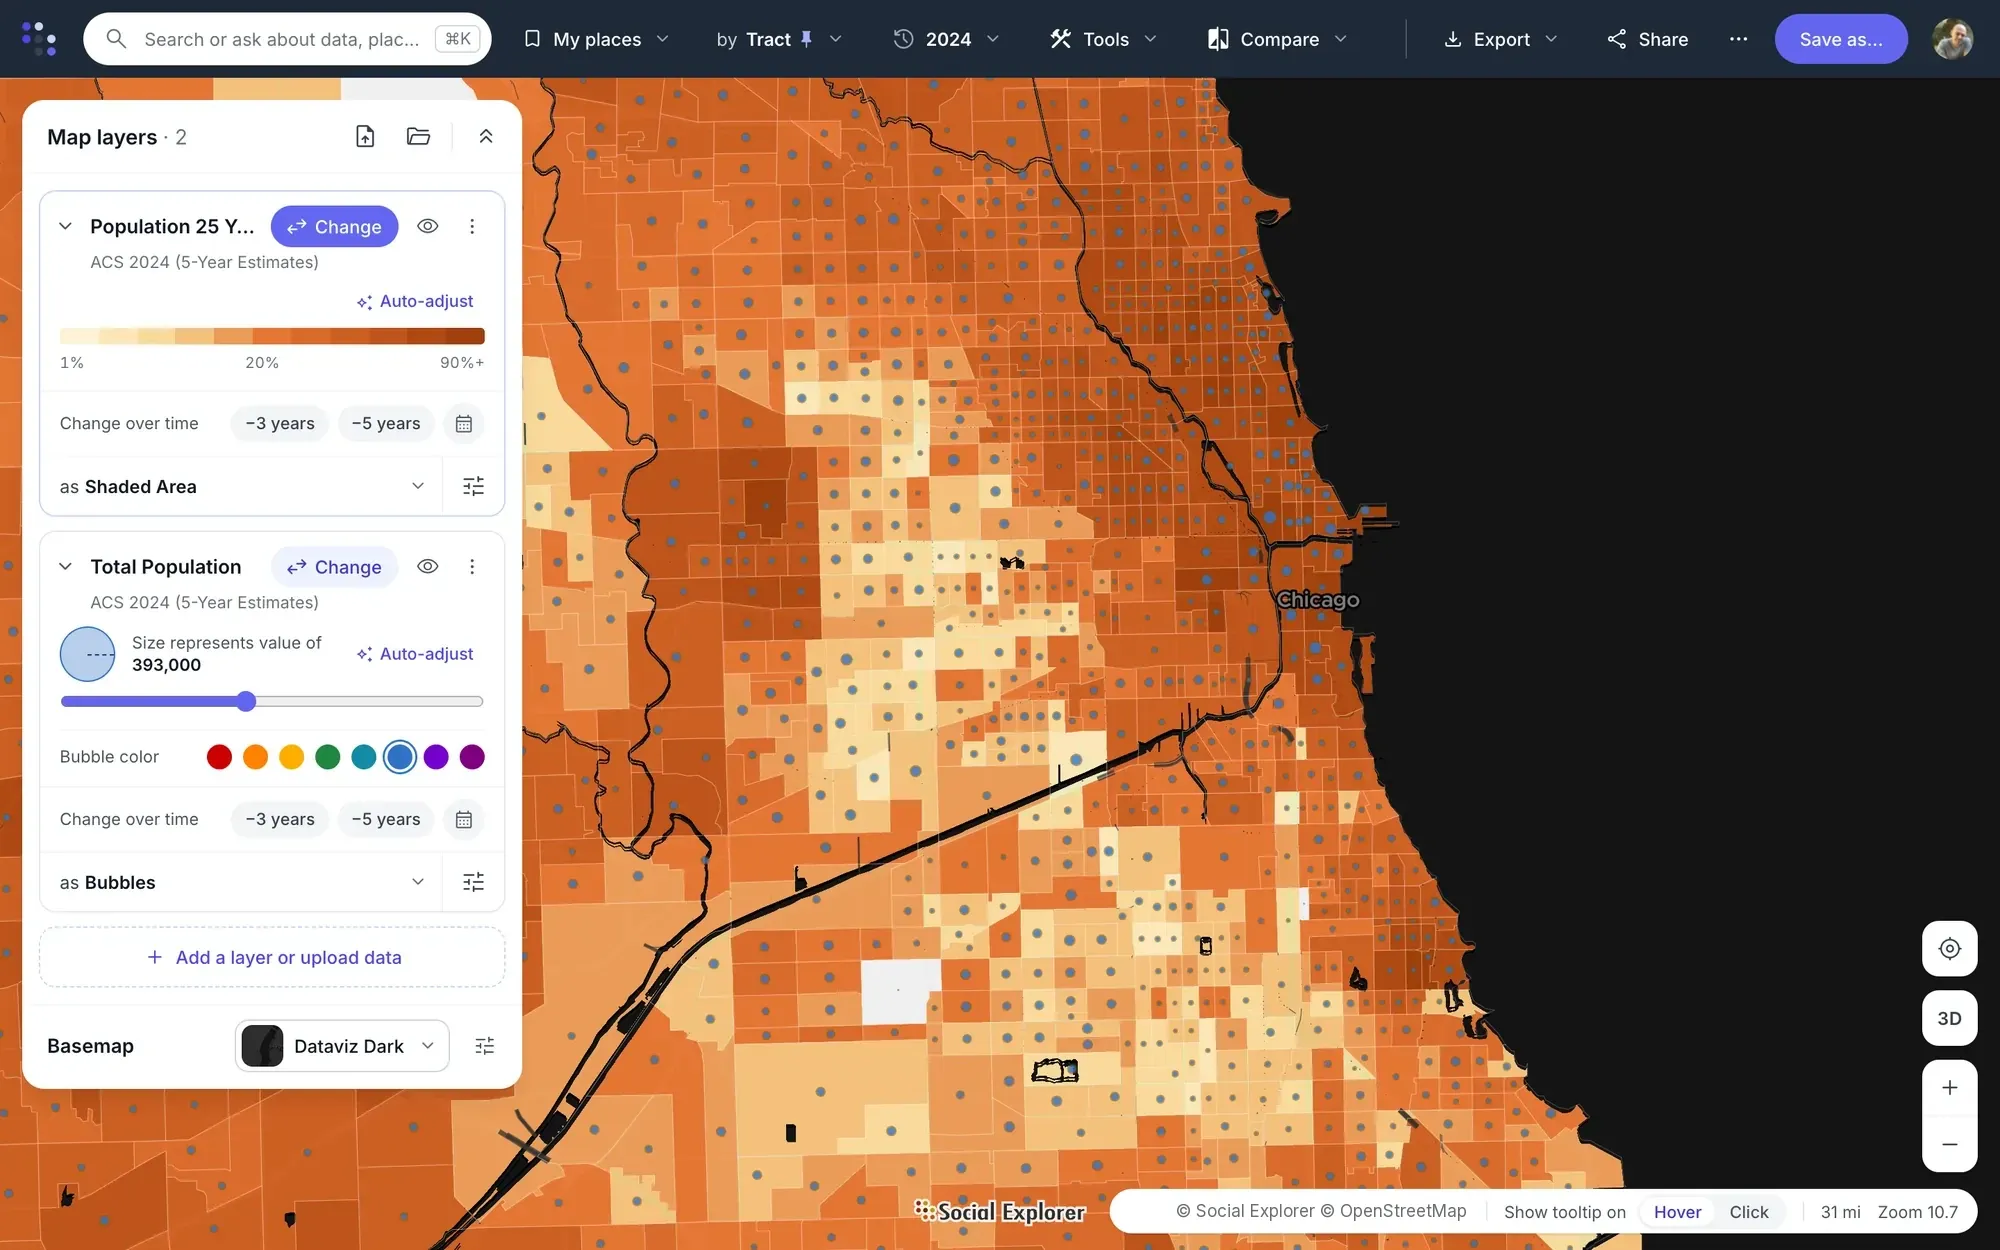
Put a second variable over the first, add any of 198 reference layers such as hospitals, schools and transit, or upload a CSV of addresses or coordinates.
-
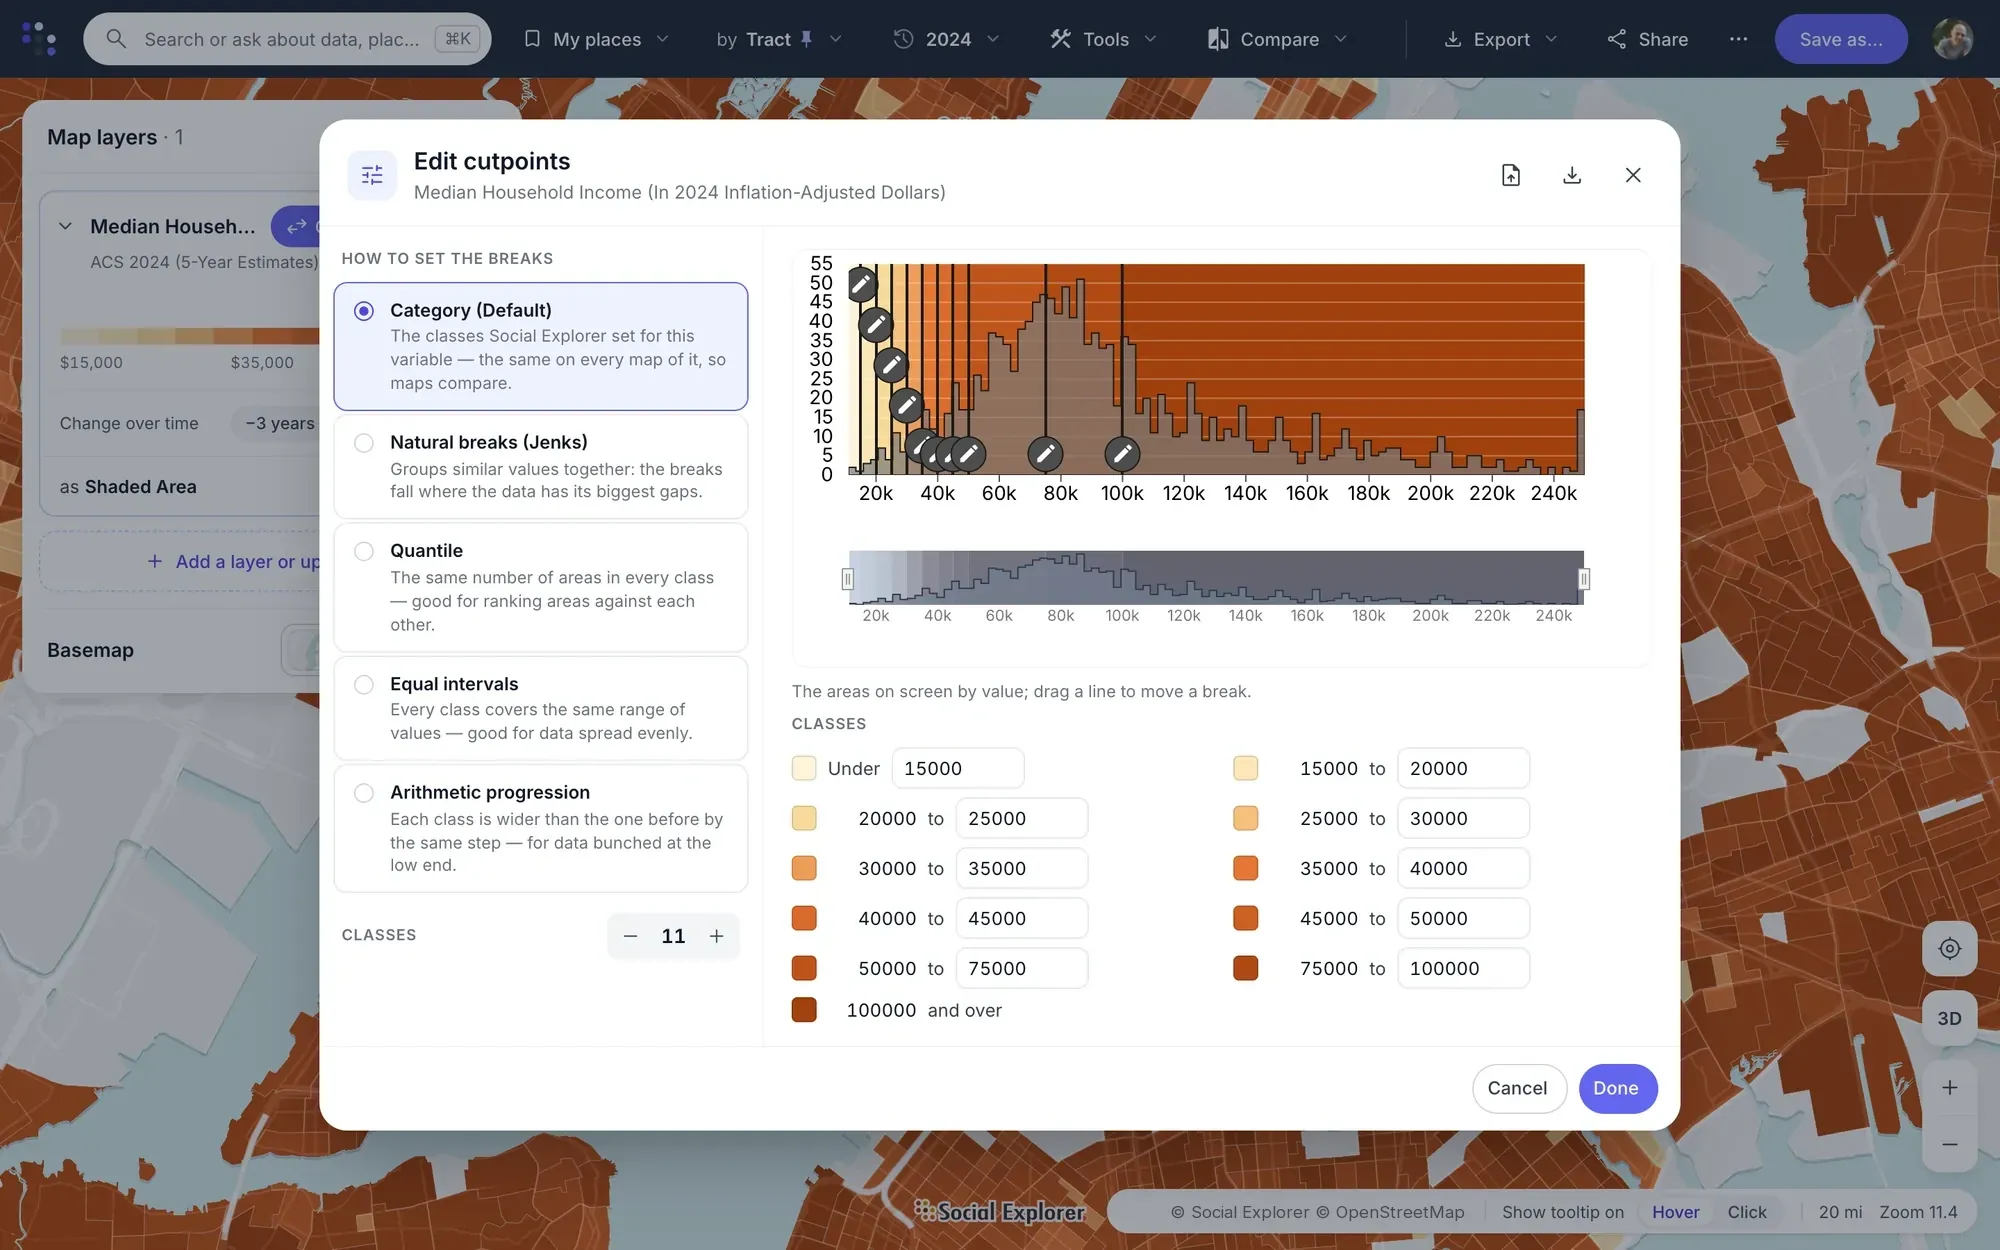
Keep the national classes so maps compare anywhere, fit them to the view, or drag the breaks on a histogram of the areas on screen.
-
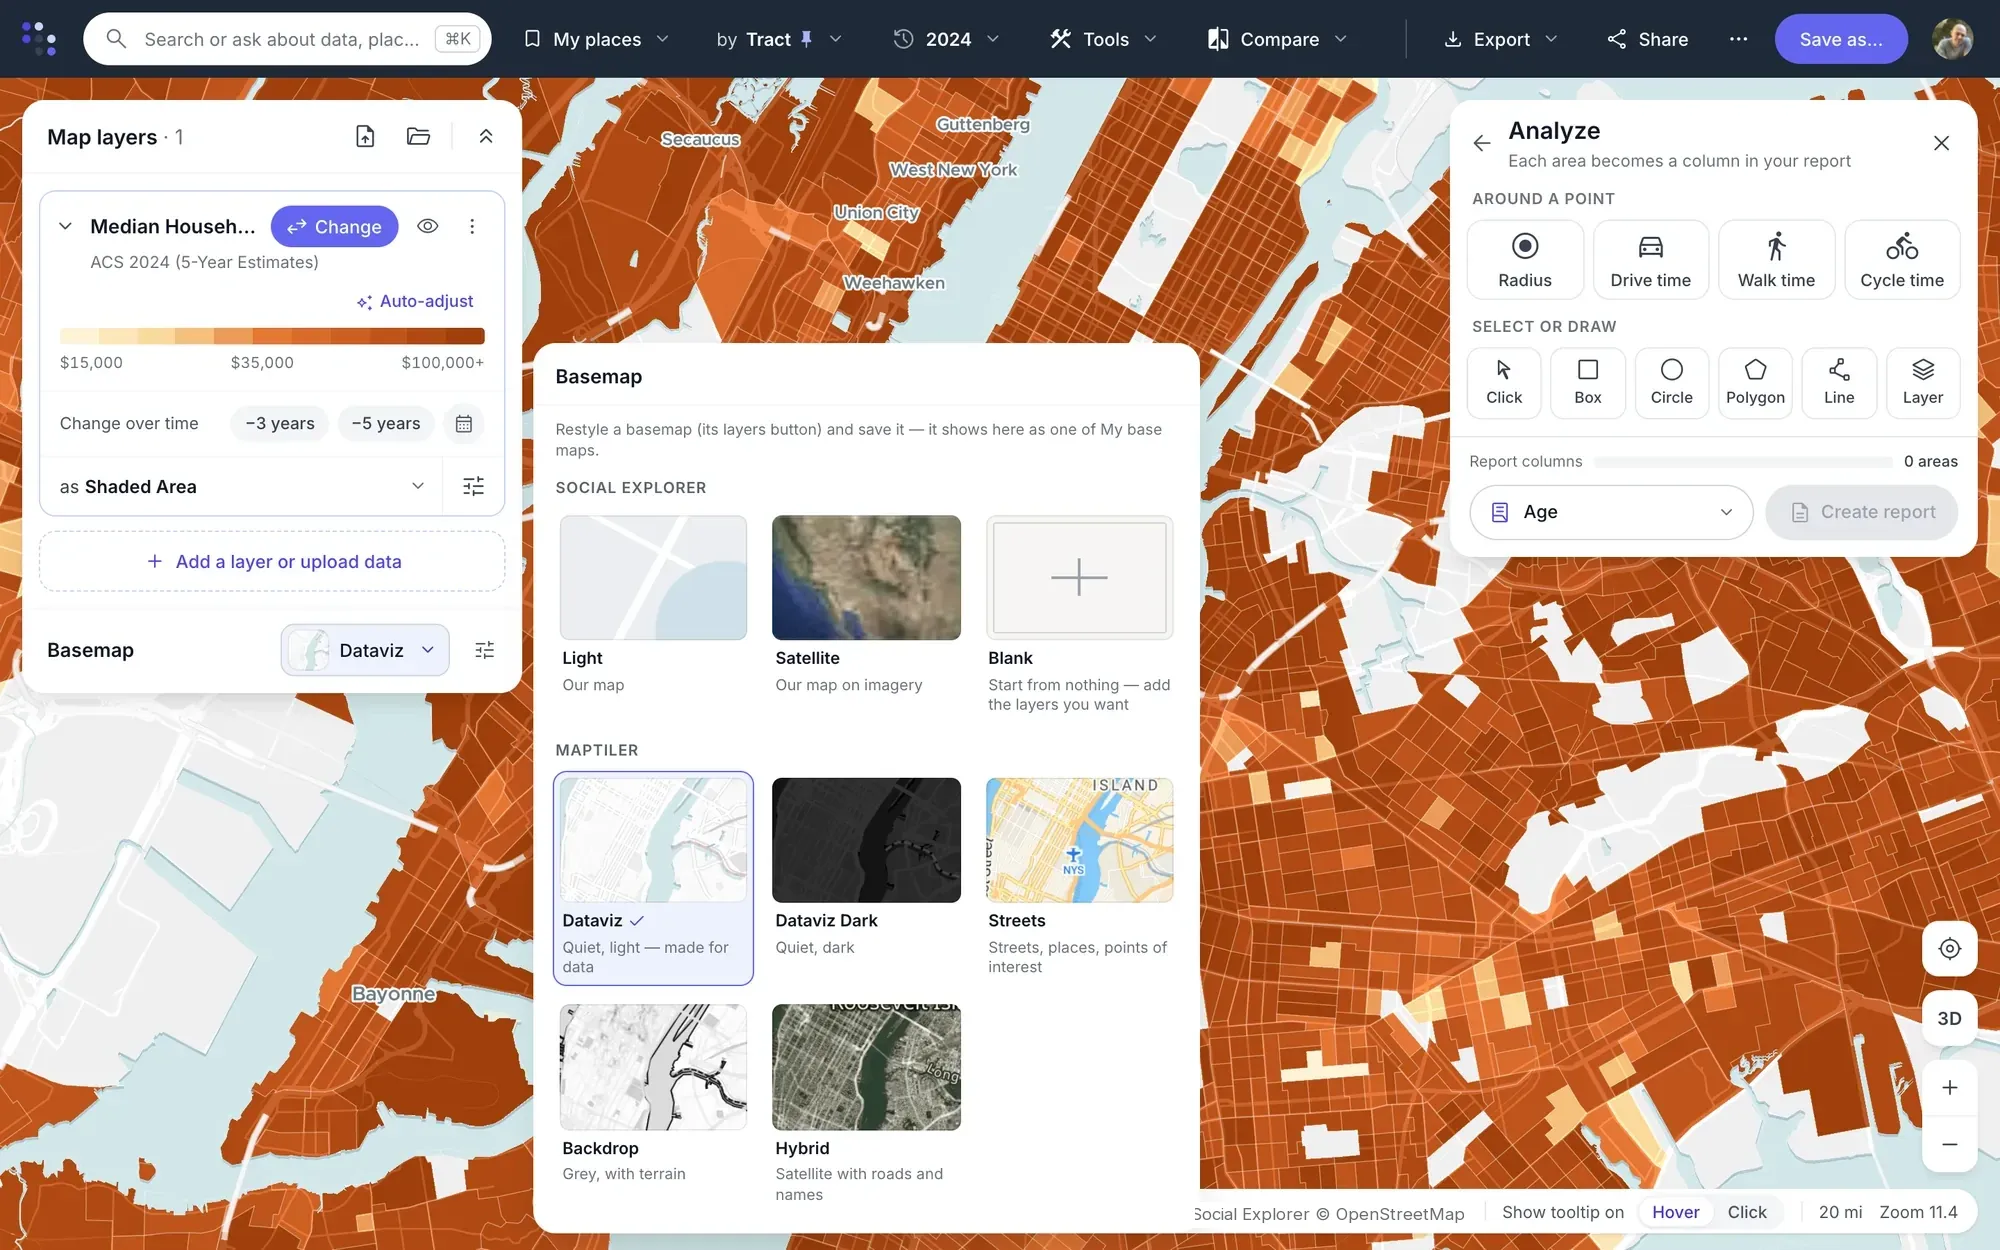
Seven styles, from a quiet light map to satellite imagery, plus Blank. Each map keeps its own, for viewers and embeds too.
-
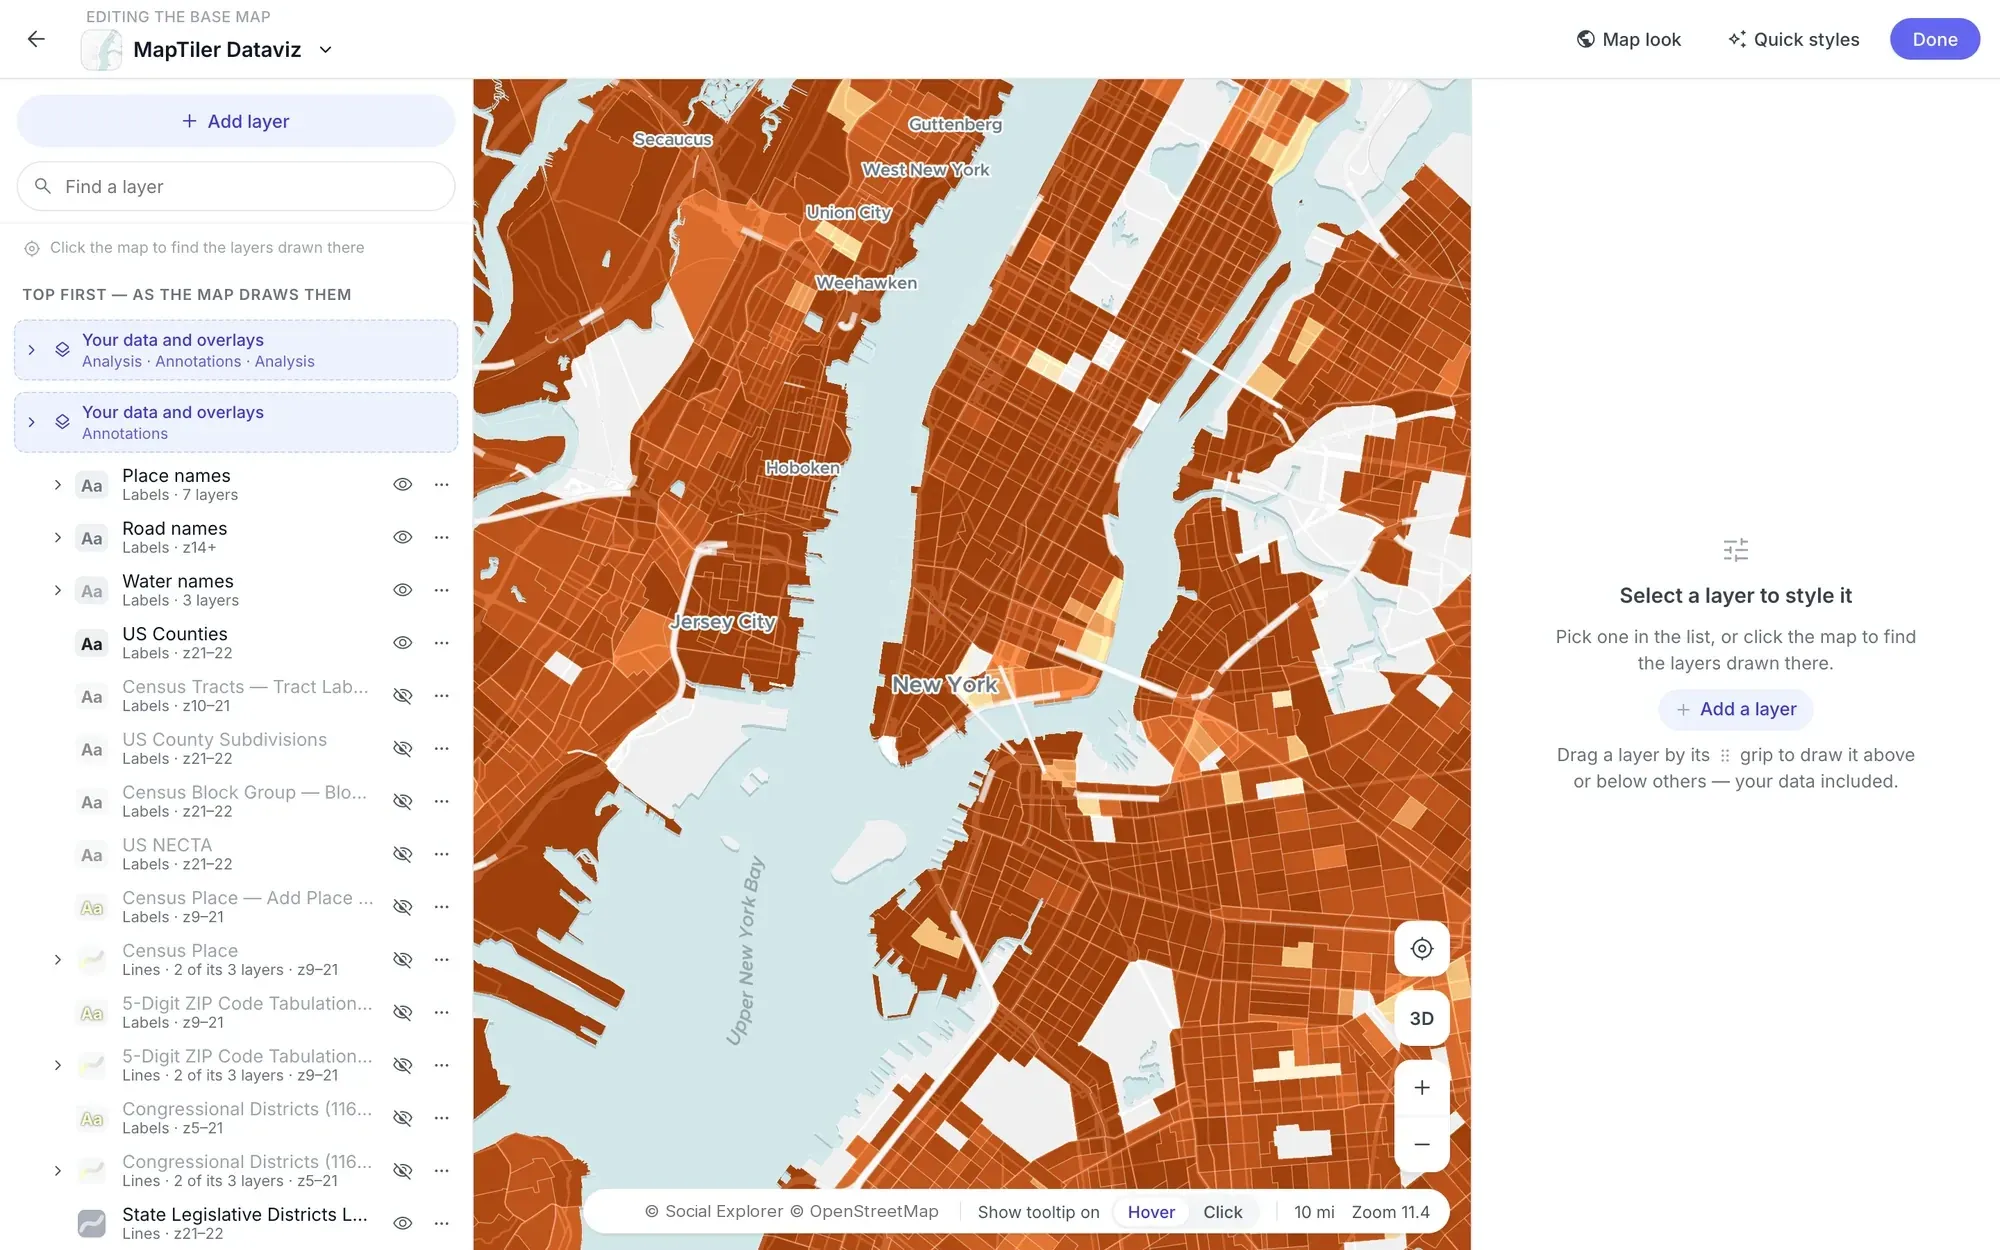
Restyle roads, water, labels and boundaries in plain terms, drag your data above or below any layer, and save the result as your own base map.
Compare
Two years. One swipe.
Compare two years, two variables or two base maps in one view: swipe between the maps or set them side by side. Three or five years back turns any map into a map of change, and every area can be colored against a county or a state.
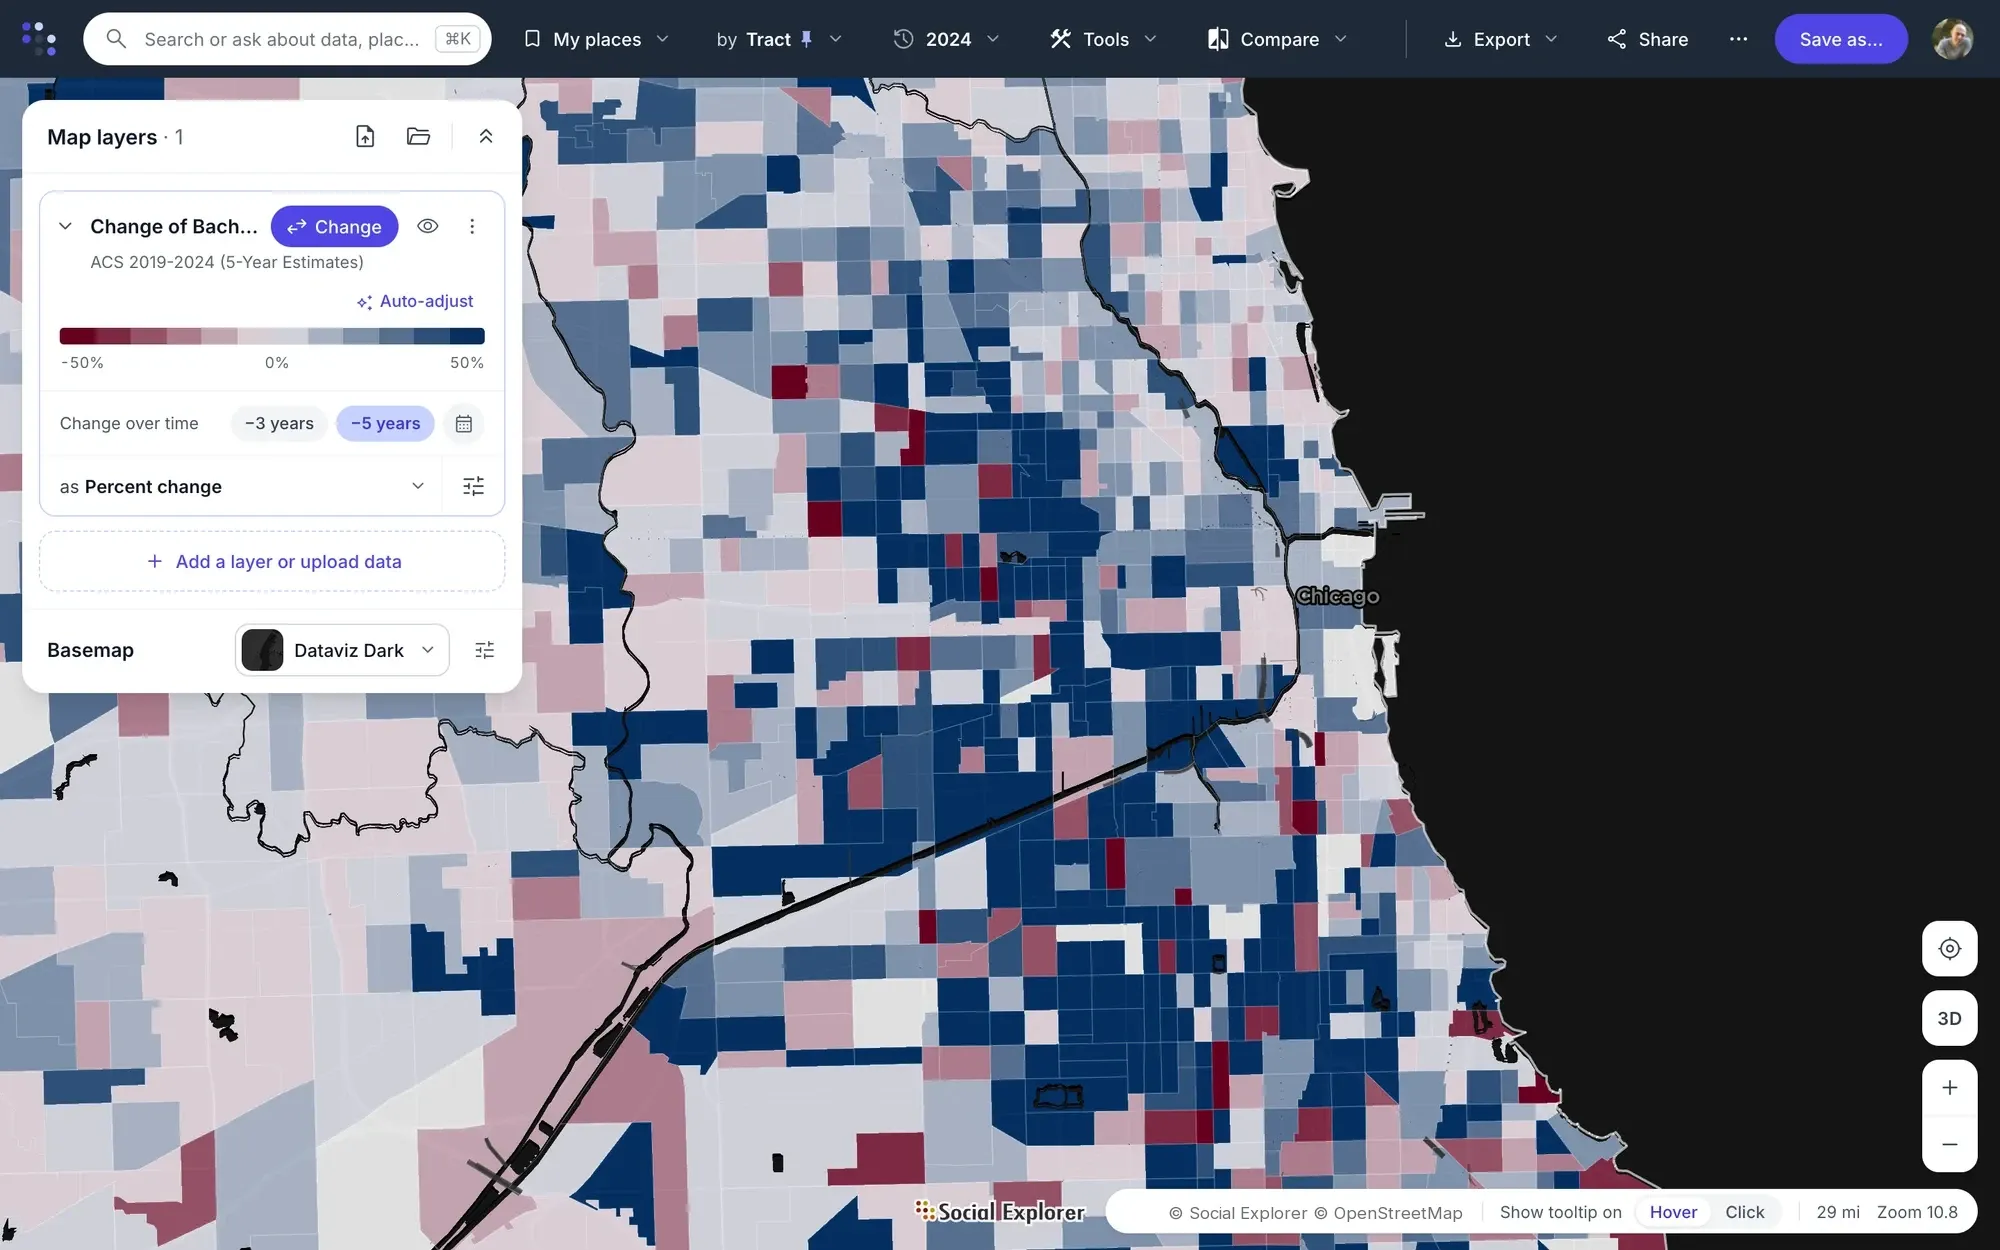
Chicago: where the share of adults with a degree grew (blue) or fell (red) from 2019 to 2024. One click on −5 years turns the map into a map of change.
Chicago: population bubbles over the share of adults with a degree, on the Dataviz Dark base map.
Chicago in 2019 on the left and 2024 on the right: drag the divider to see how the share of adults with a degree changed.
Analyze places
Market areas around every site.
Analyze draws the market area around each site and compares them all in one report. Click a store, clinic or branch, choose a radius or a drive, walk or cycle time, then add the next site, and the next.
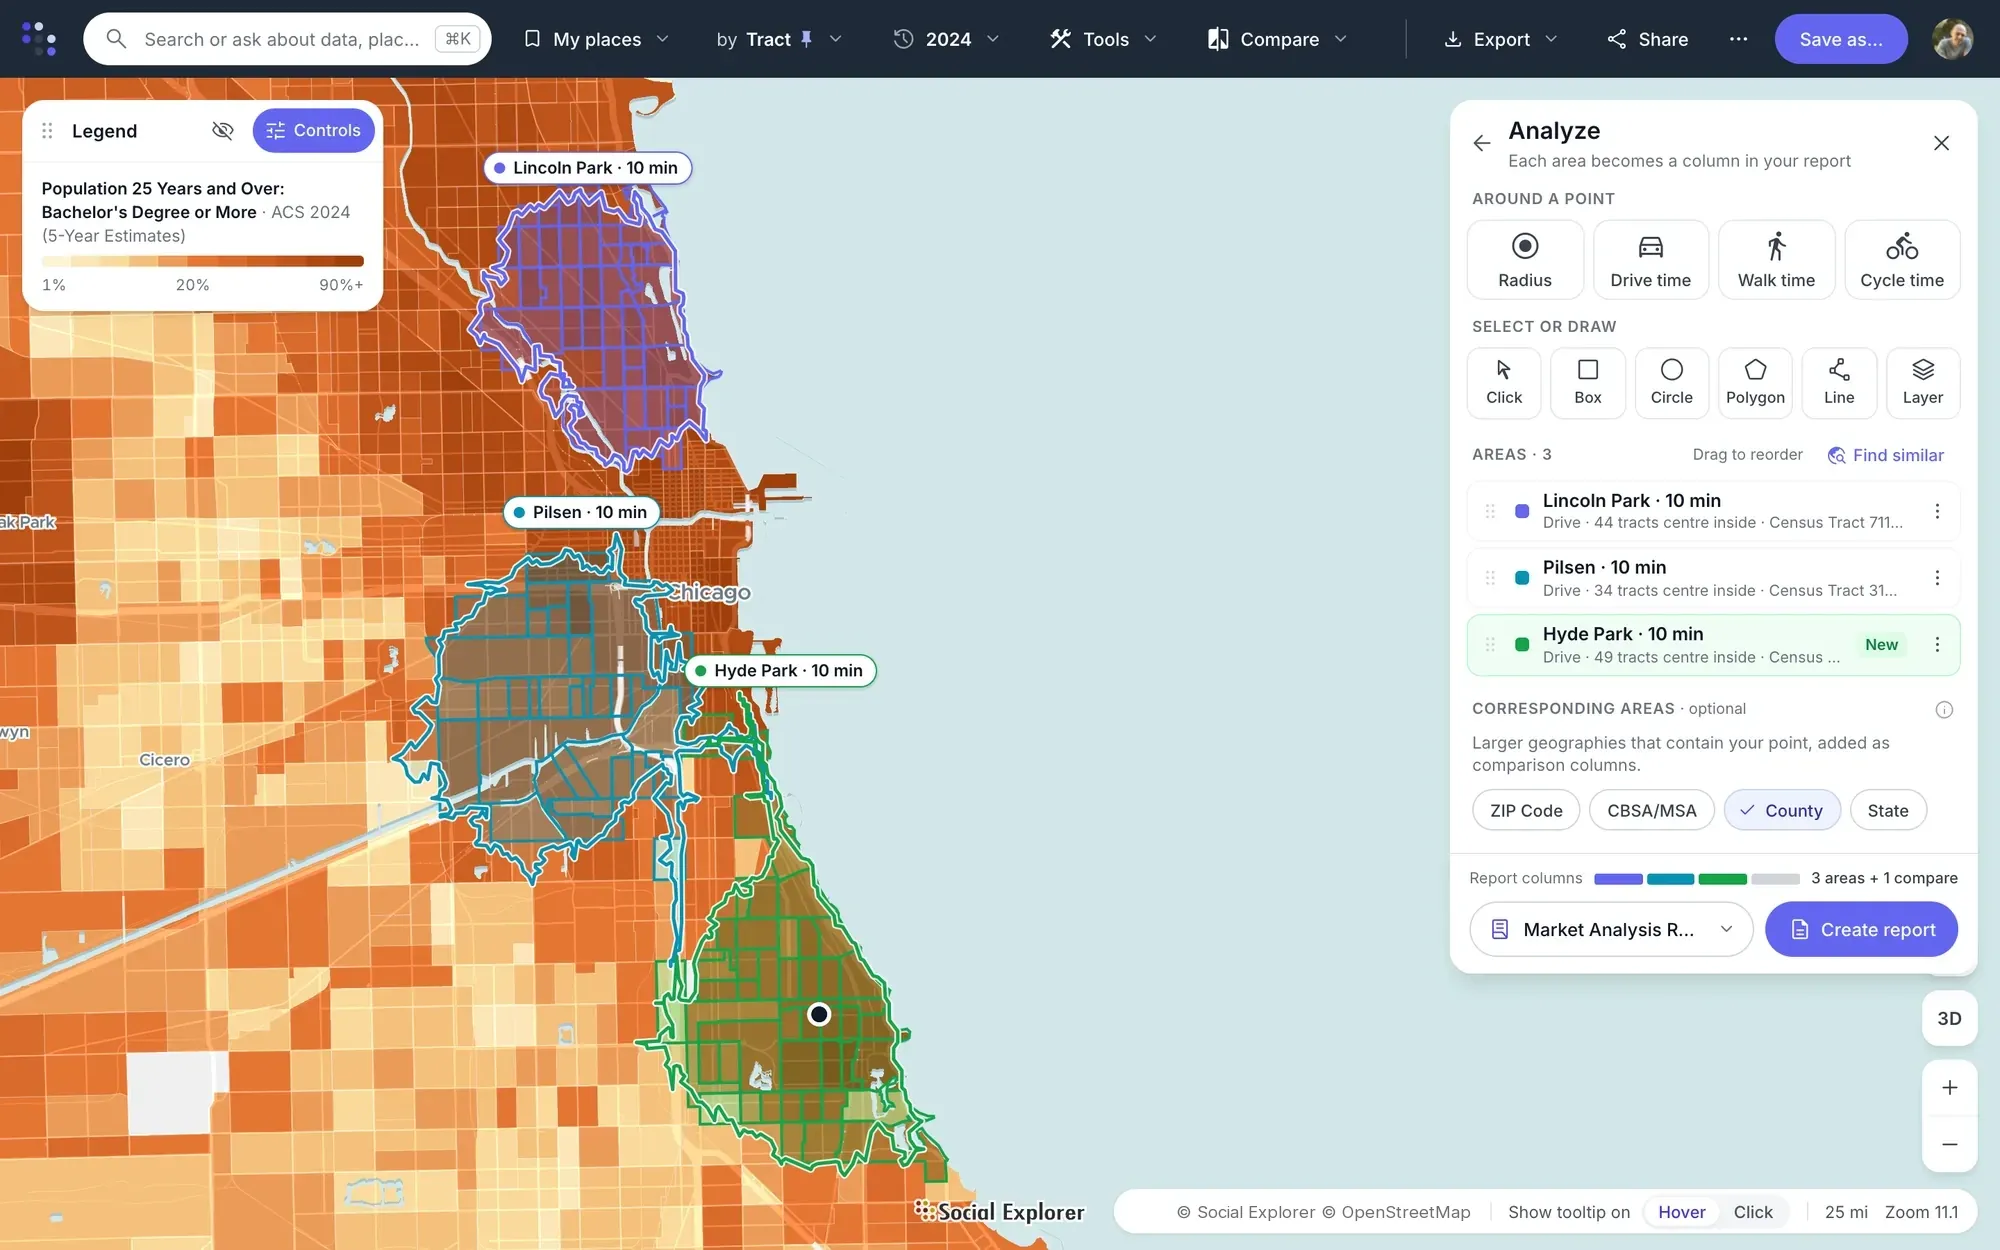
- Market areas by drive, walk or cycle time
- or a radius, several sizes at once
- Select areas by click, box or polygon
- or a circle, a line or a layer’s points
- Compare with the ZIP, county or state
- around each site, as a column in the report
- Every area side by side
- in one report you can export and cite
-
Filter areas
Show only the areas that meet all, any or none of your criteria, such as income over $75,000 and renters over 40%.
-
Mask map data
Hide everything outside the areas you choose, picked by click, box or lasso, or from an uploaded list.
-
Measure and report
Measure distances in miles, feet or kilometers, and create tables for the areas you select.
Find patterns across places
-
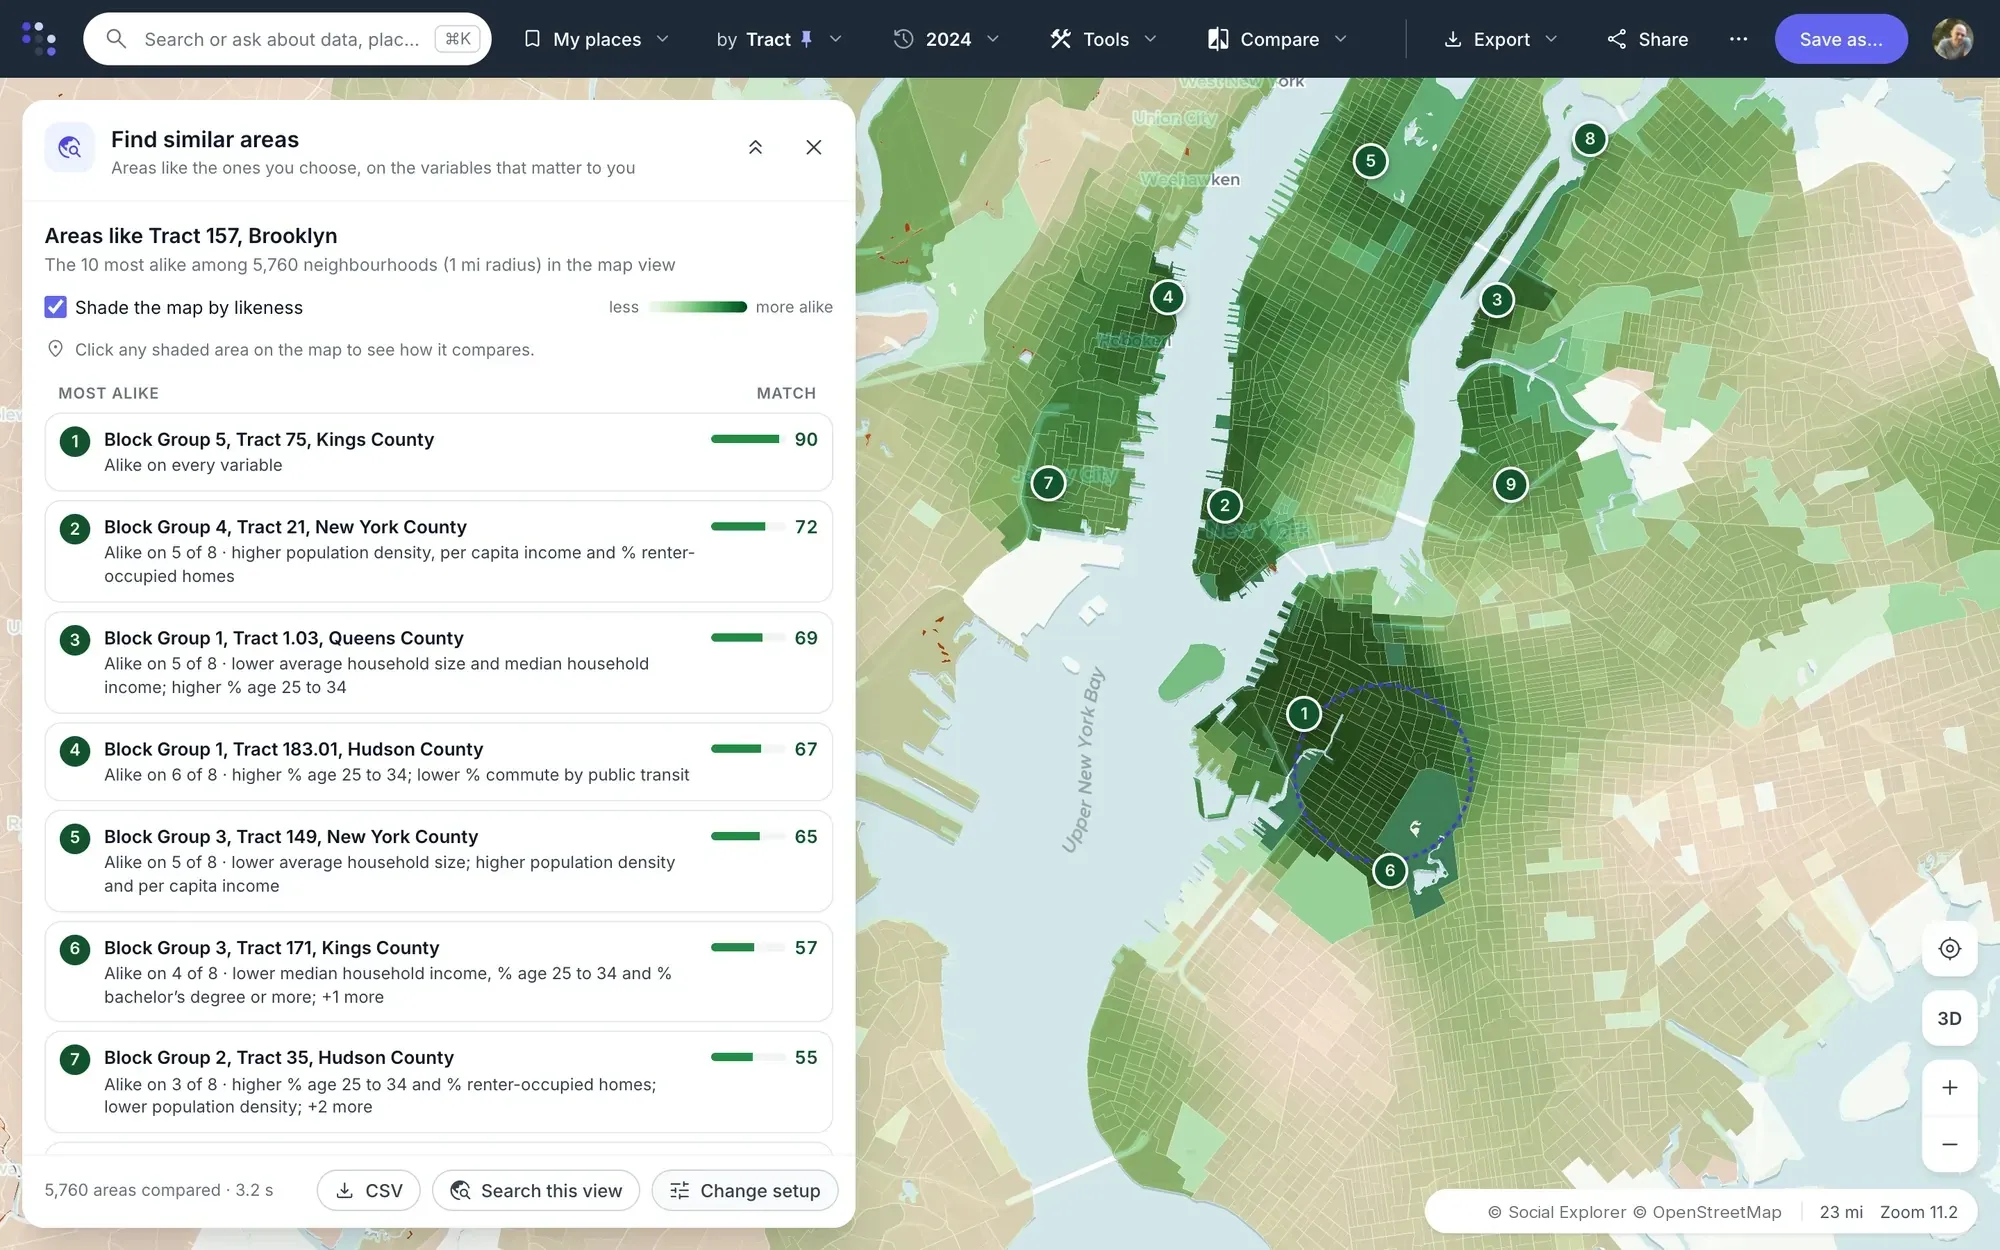
Premium Find similar areas. Pick a place and the map scores every other one by how alike it is on the variables that matter to you, and lists the ten most alike and why they match.
-
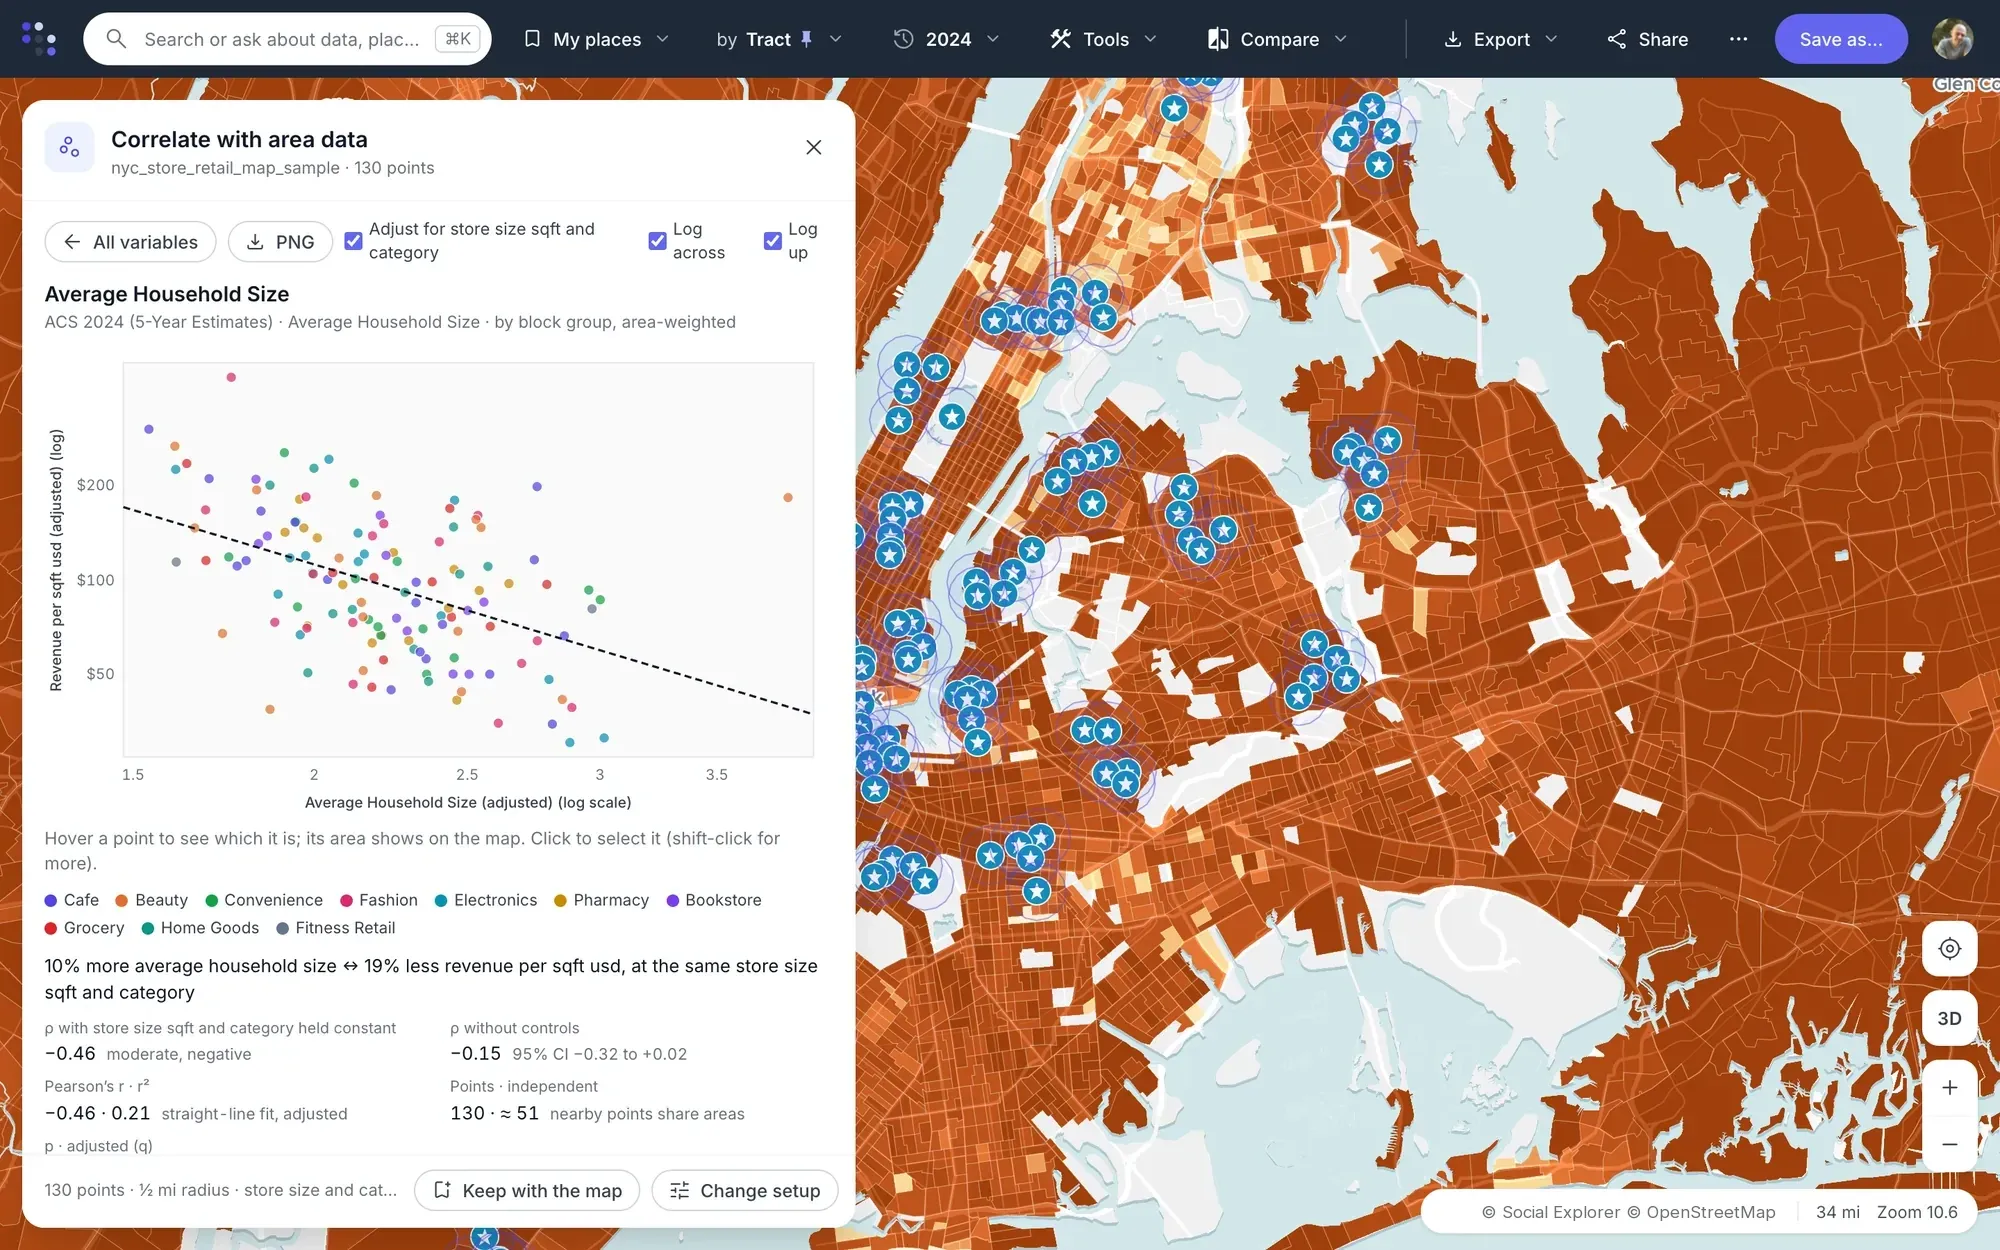
Premium Correlate with area data. Upload your locations with a measure, such as sales or visits, and see how it moves with the neighborhood around each one.
Reports
Every area. One report.
Every area you analyze becomes a column in a report, next to the places you compare it with, with every number ready to export and cite.
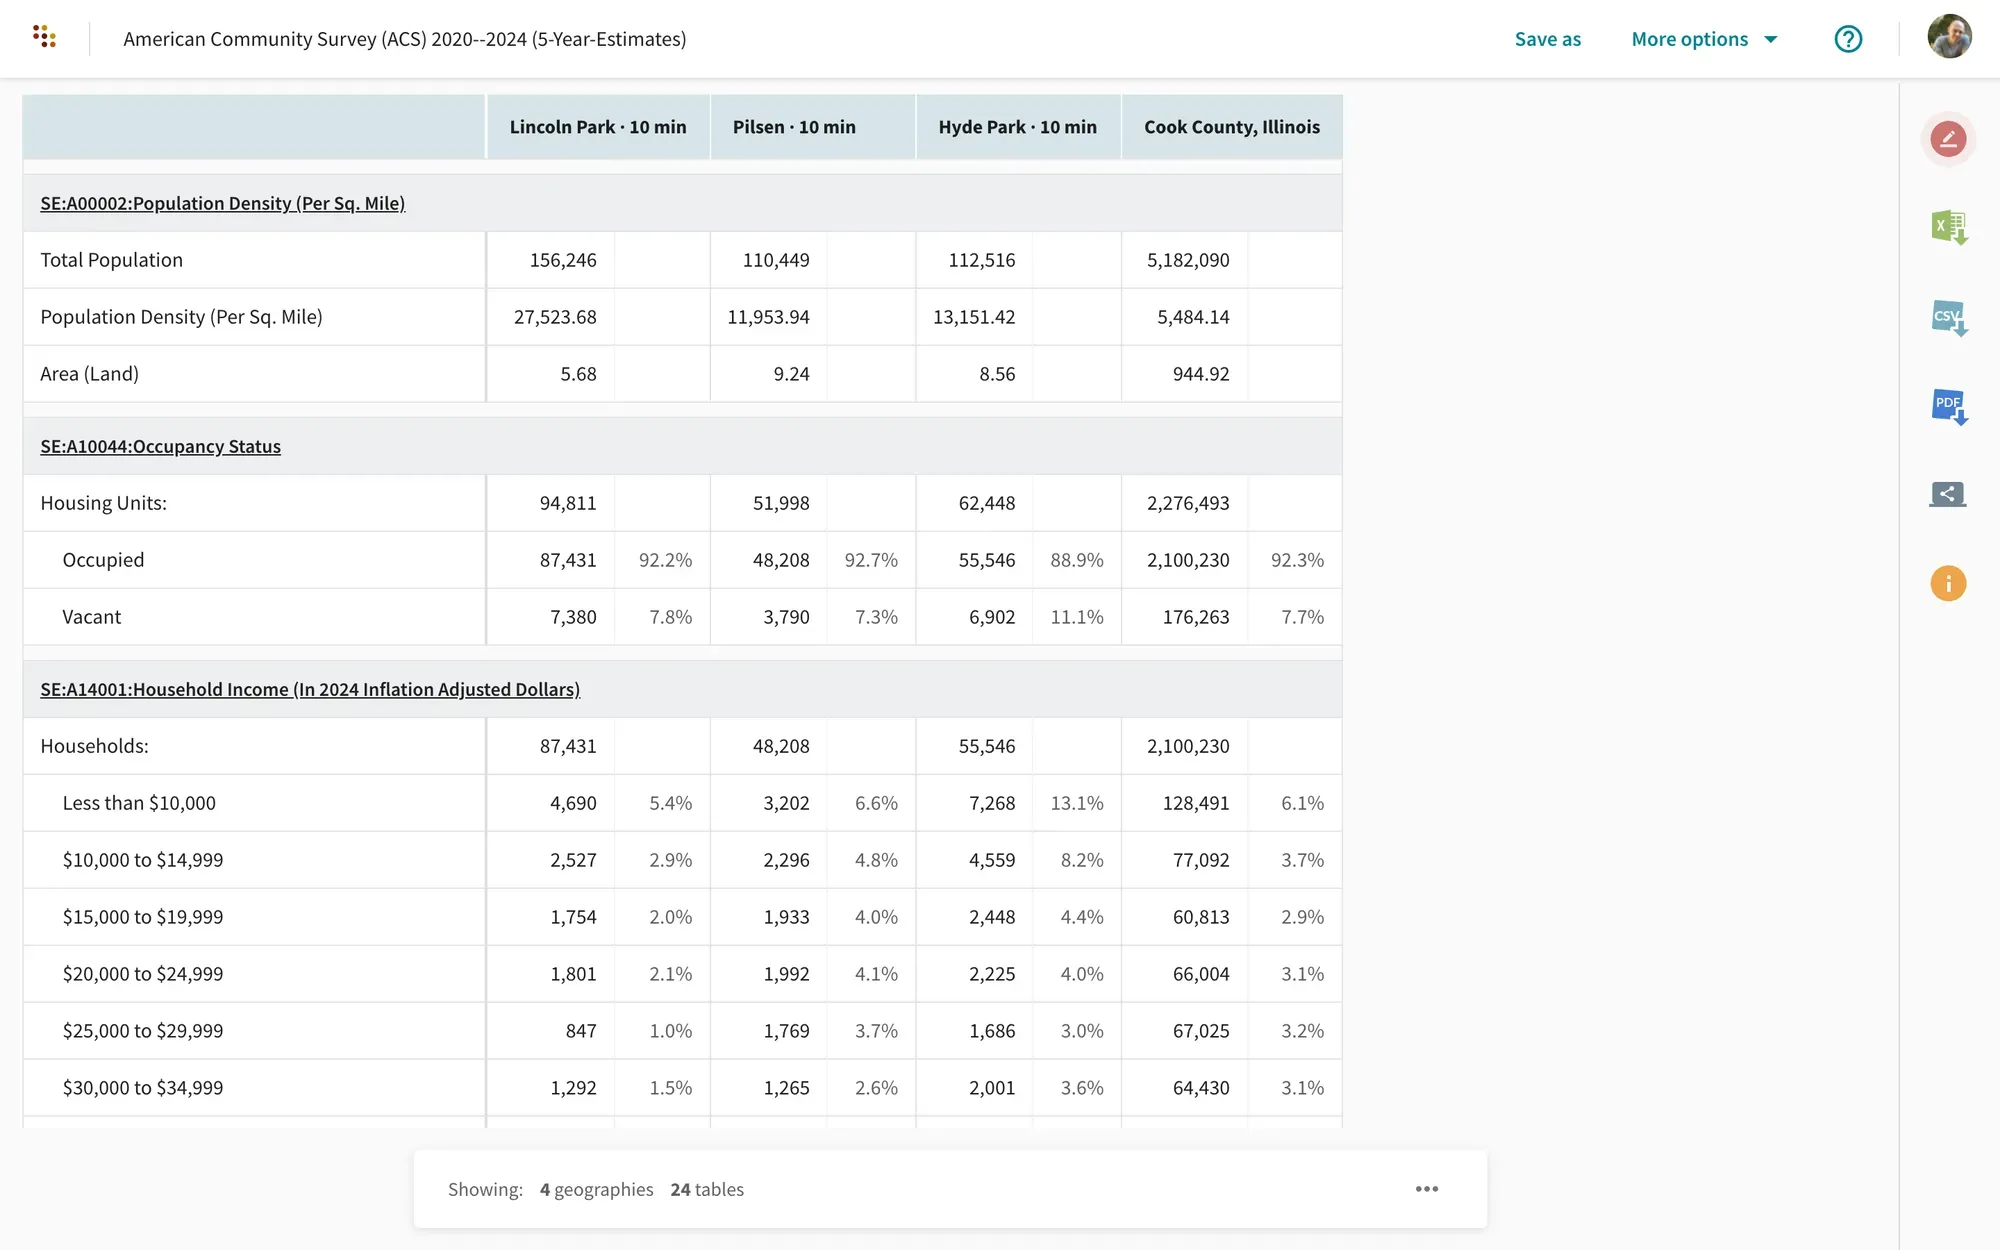
- Up to 3 years
- in one report, with dollars adjusted for inflation
- 6 export formats
- Excel, CSV, PDF, SAS, SPSS and Stata
- 3 citation styles
- Chicago, MLA and APA
- From metro area to census tract
- geography levels mixed in one report
Present and share
Make the map the story.
Mark up the map, build a story of slides, share a link or an embed, and export pictures and editable vector files.
Made to be shared.
-
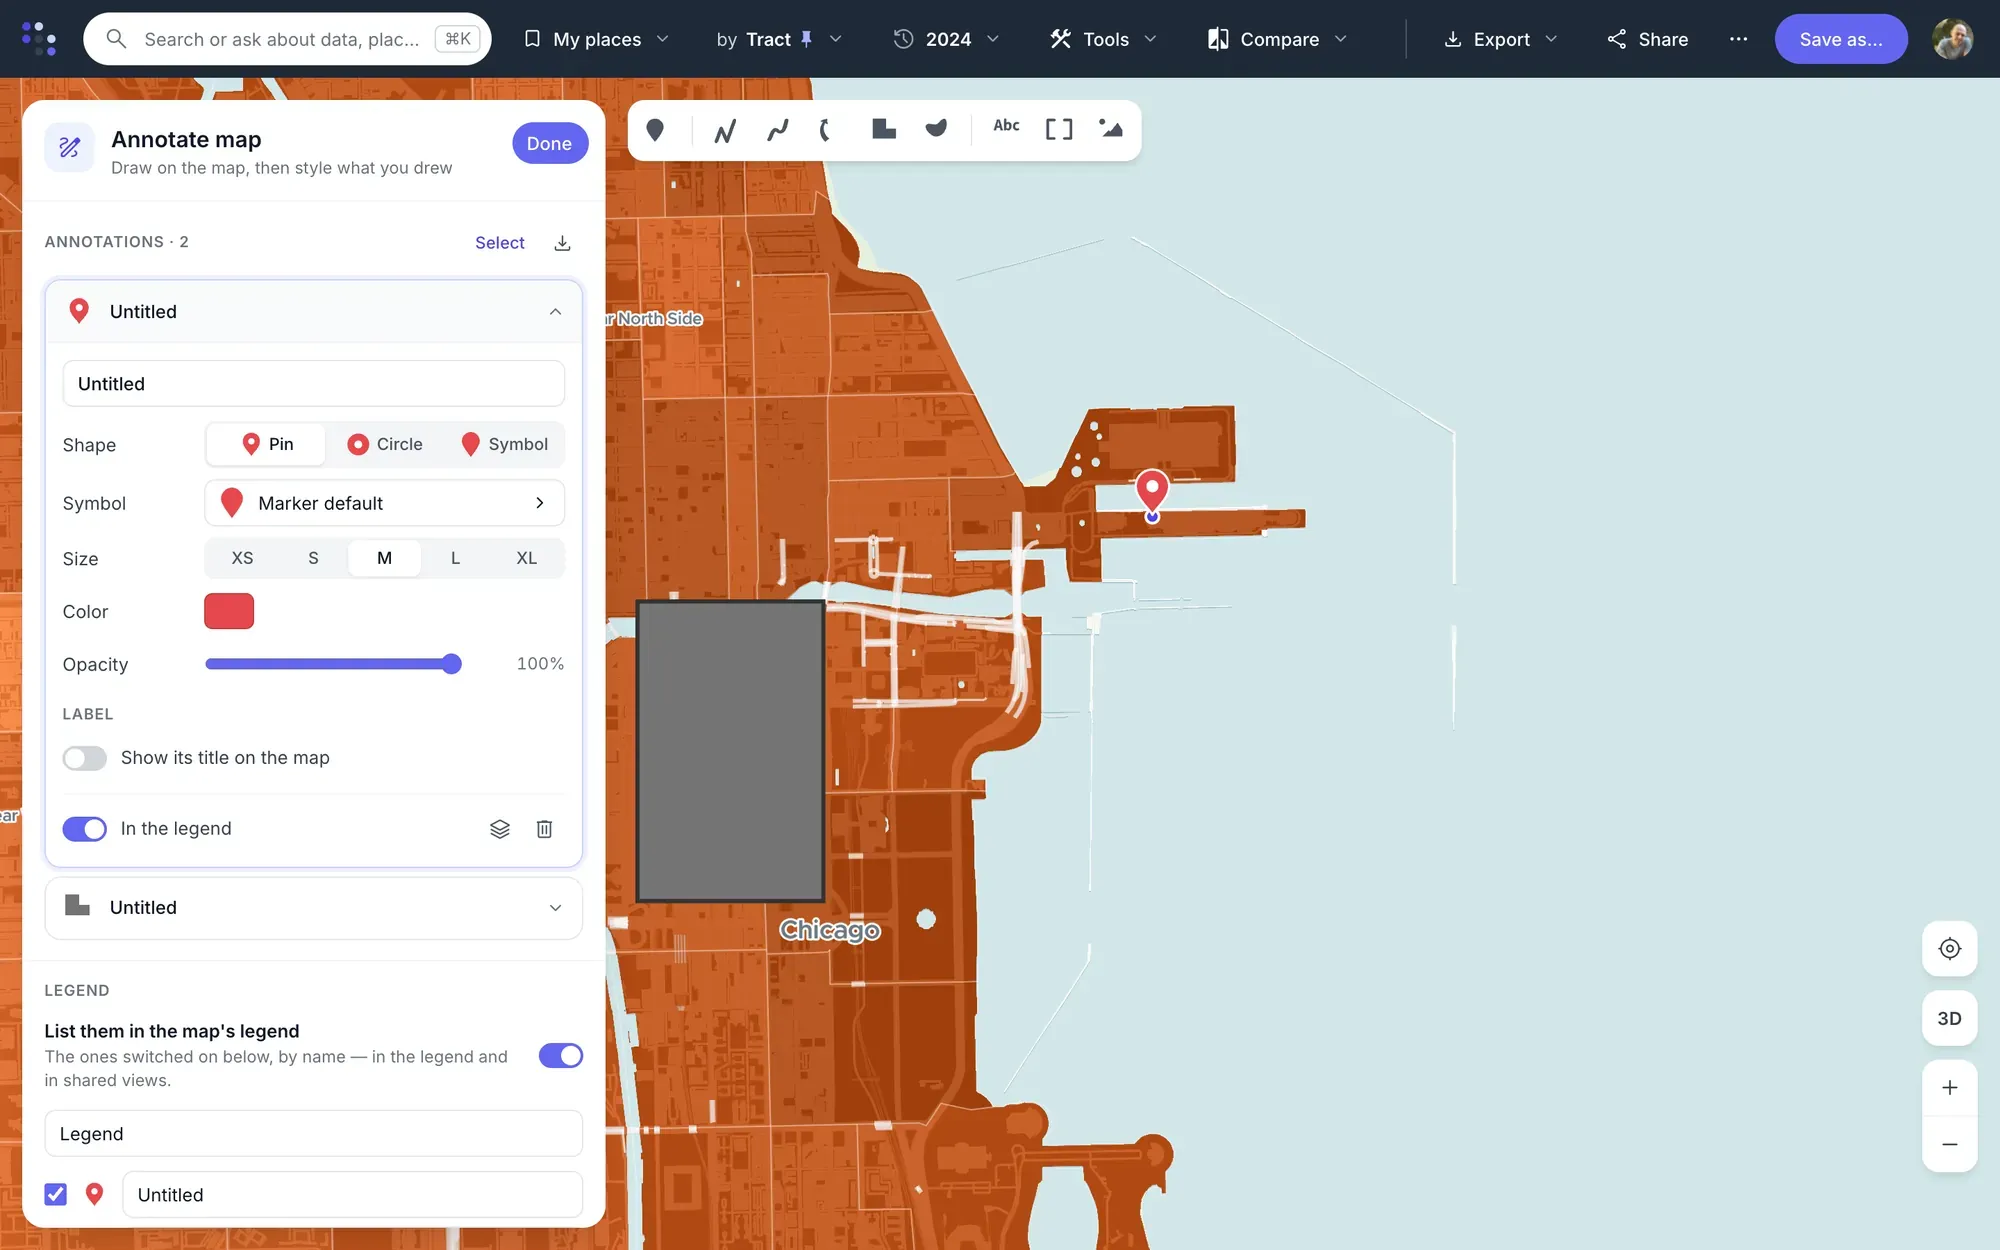
Annotate. Markers, lines, arrows, areas, text and images over the live data, exported as GeoJSON or KML when you need them.
-
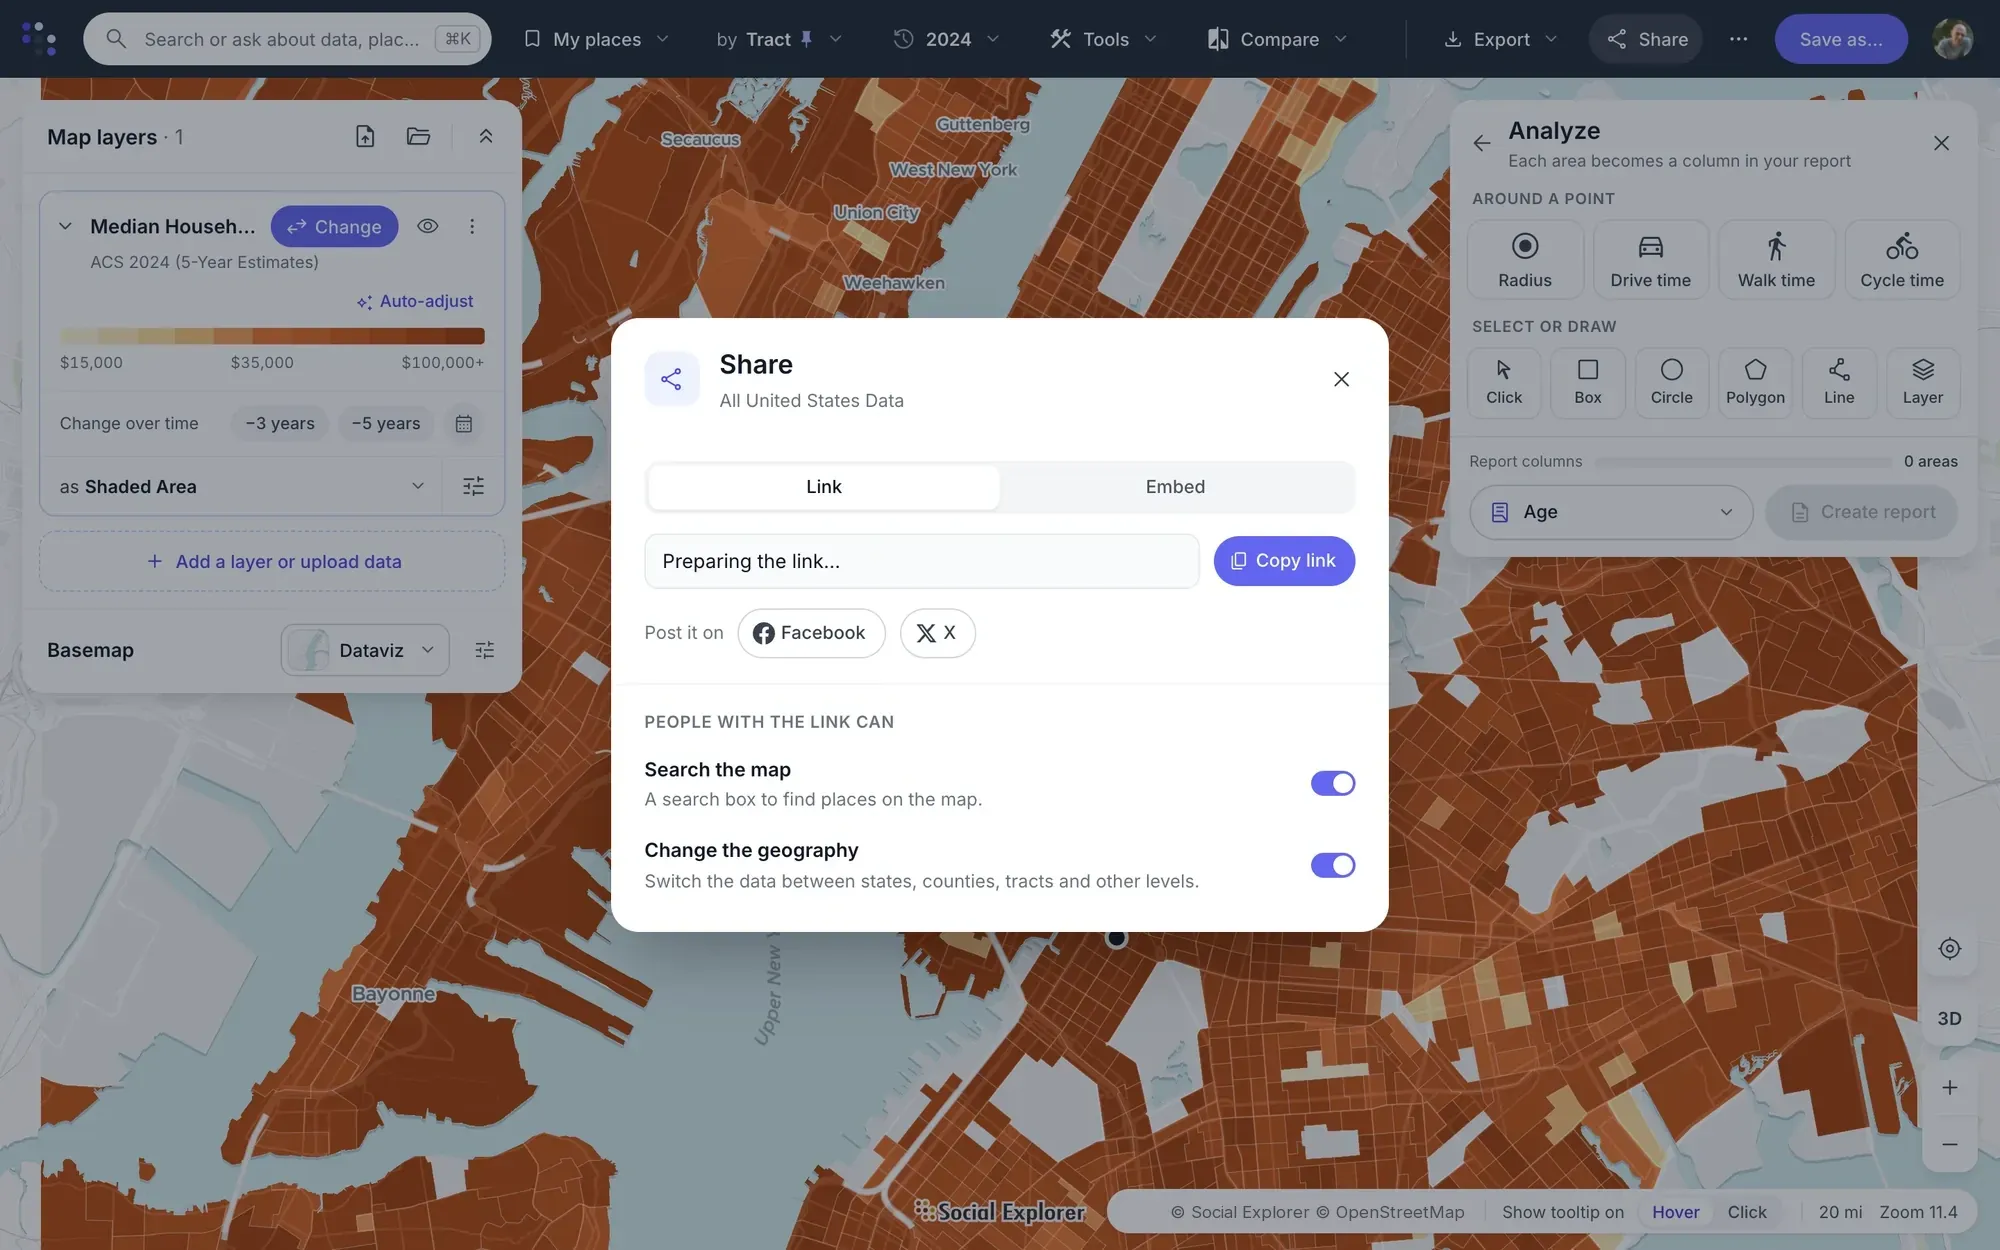
Share and embed. Make a map public or private, copy its link, and embed it in a page at any size.
-
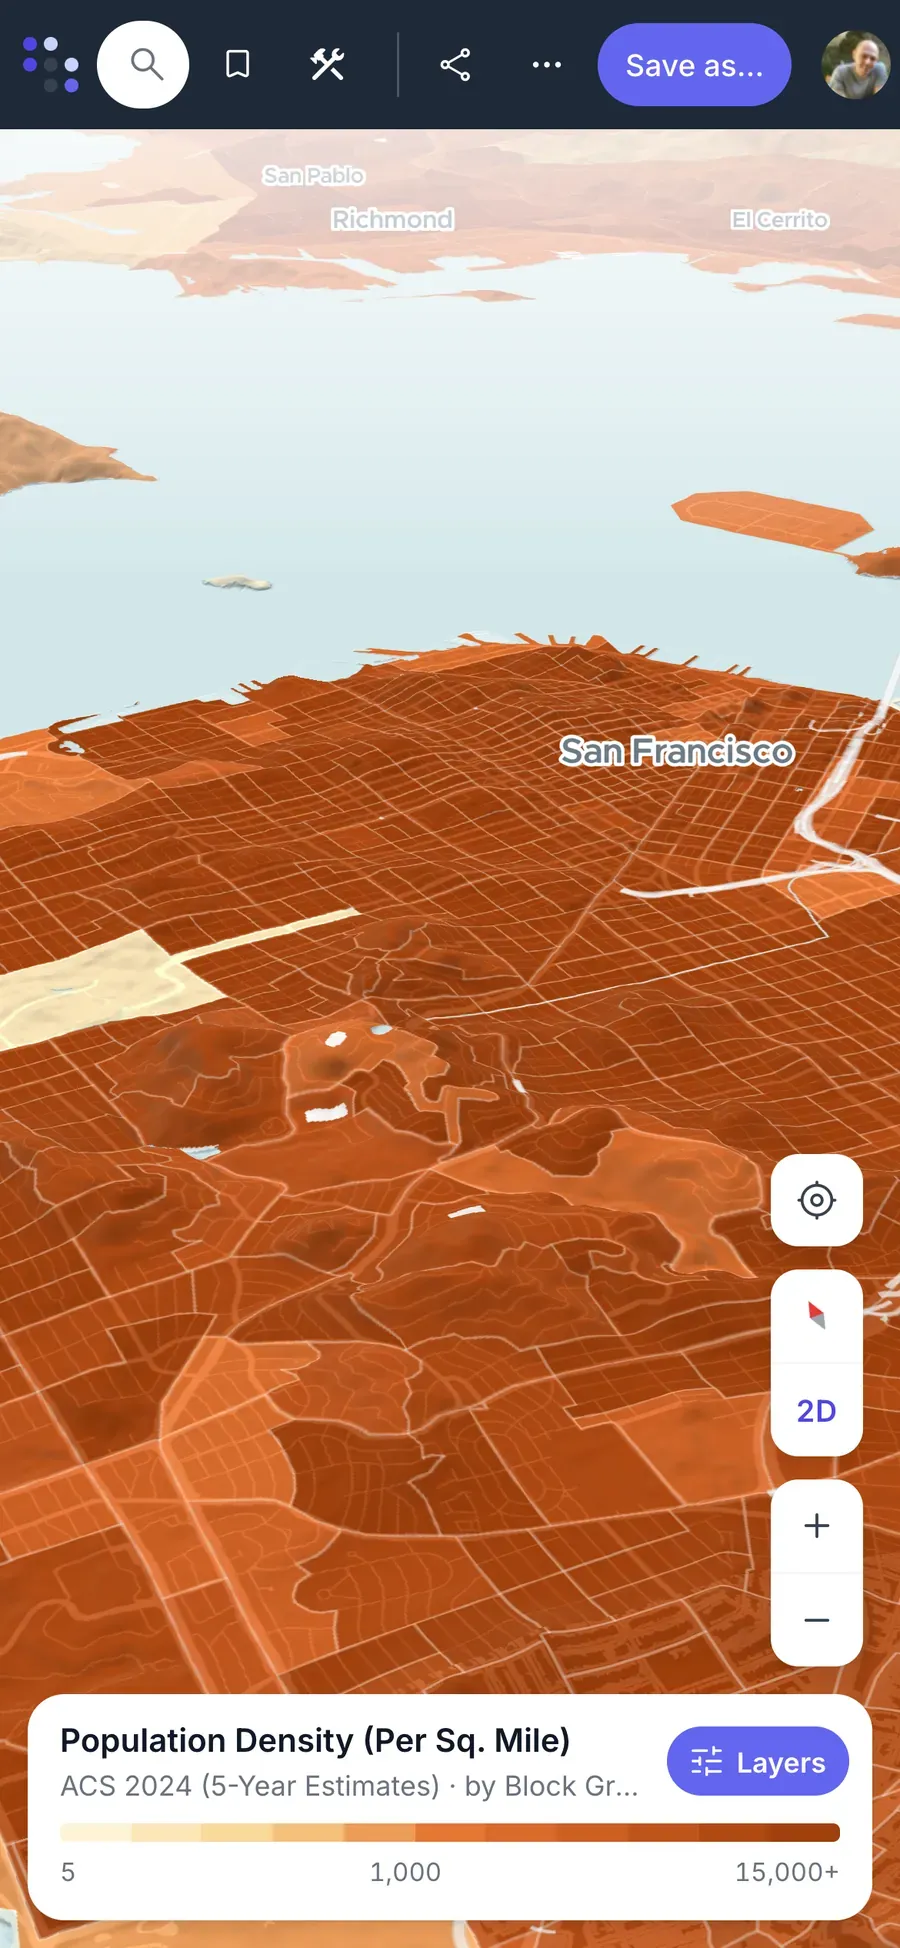
On a phone. Shared maps and stories open on any phone, with no app to install, 3D terrain included.
-
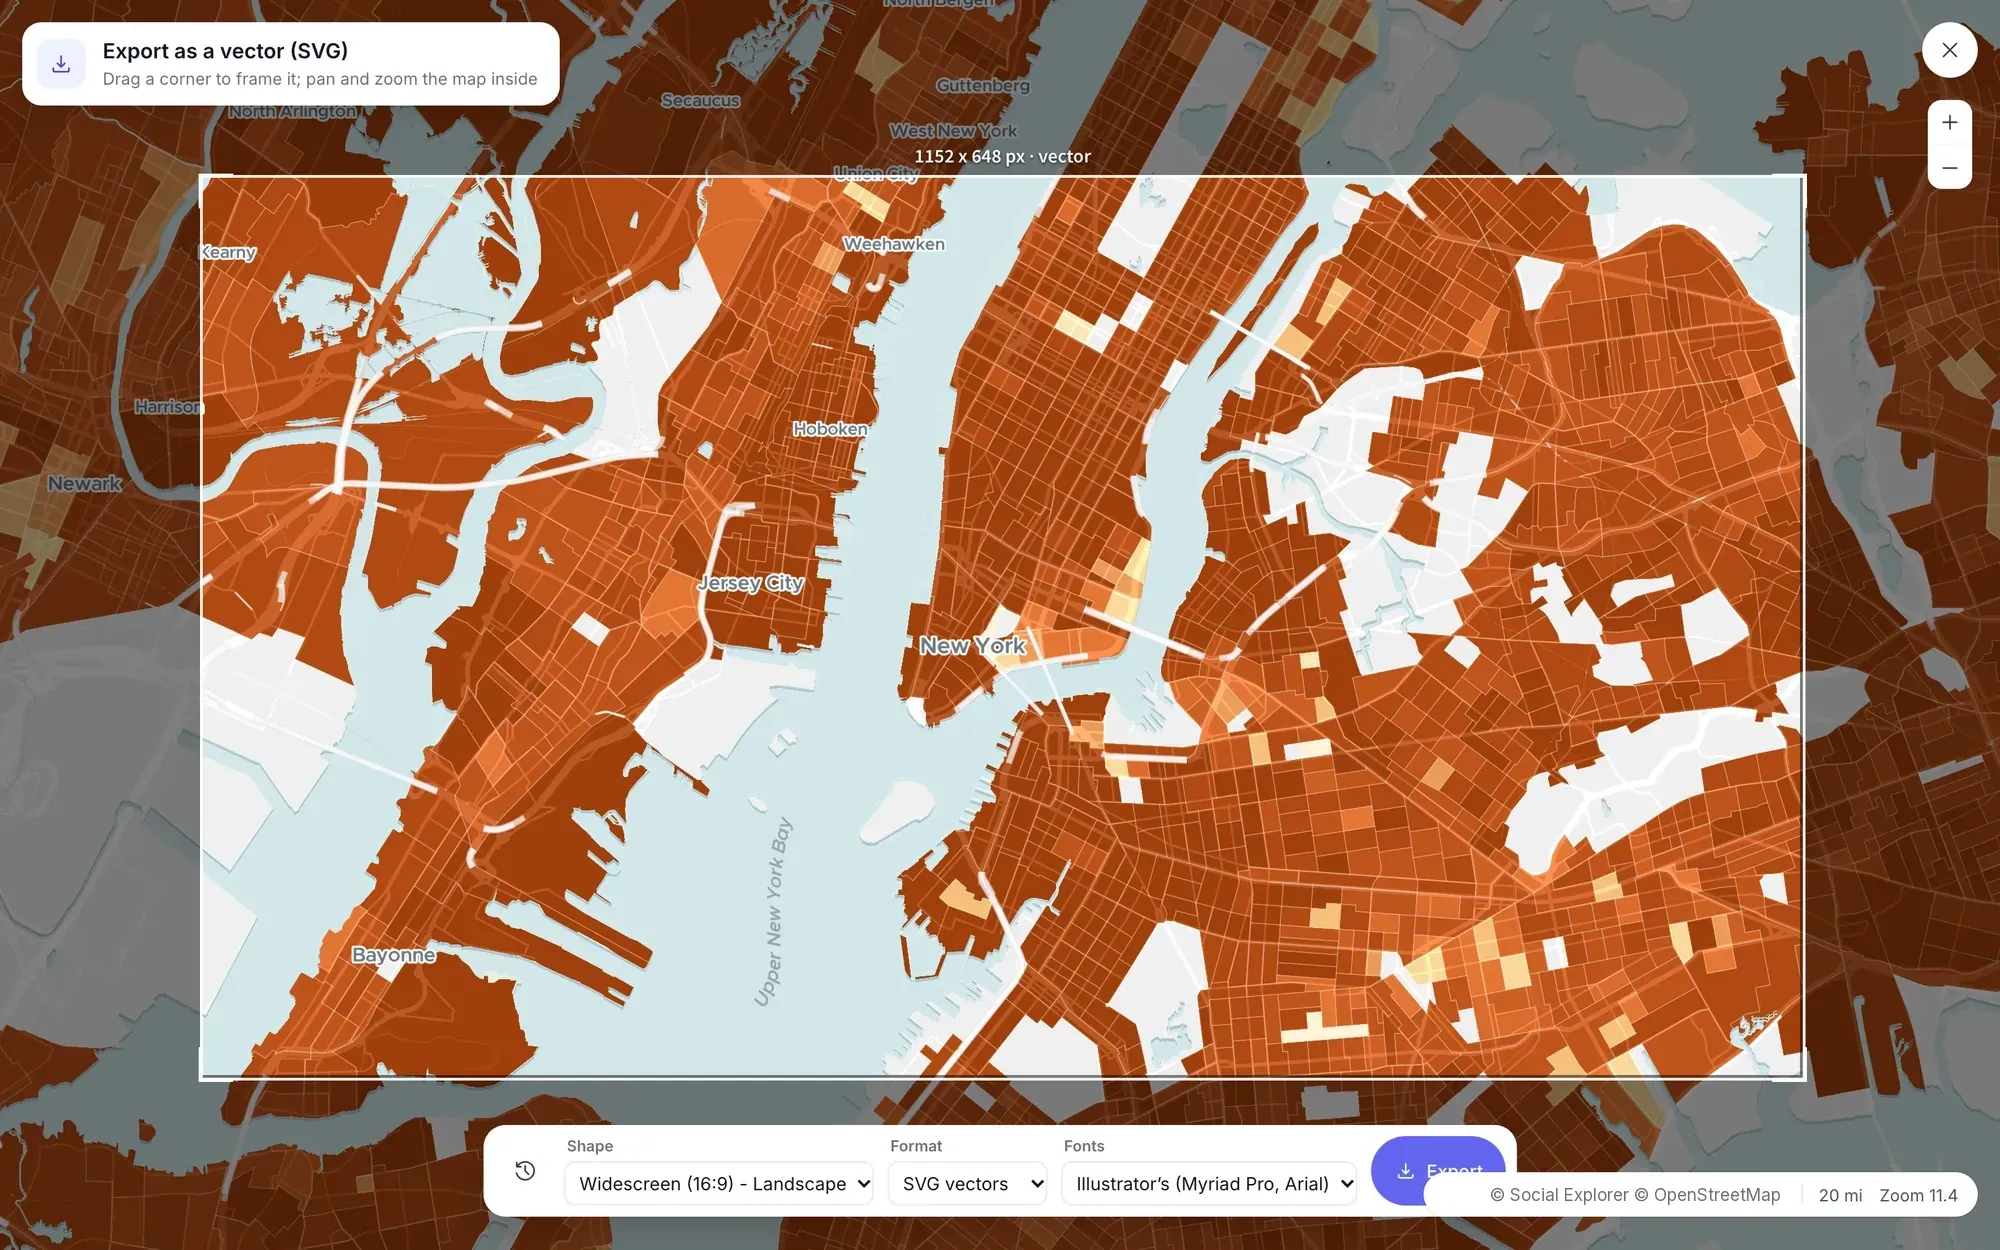
Export for print and design. A picture with the title, legend and scale, or an SVG for Illustrator with every layer and label editable.
-
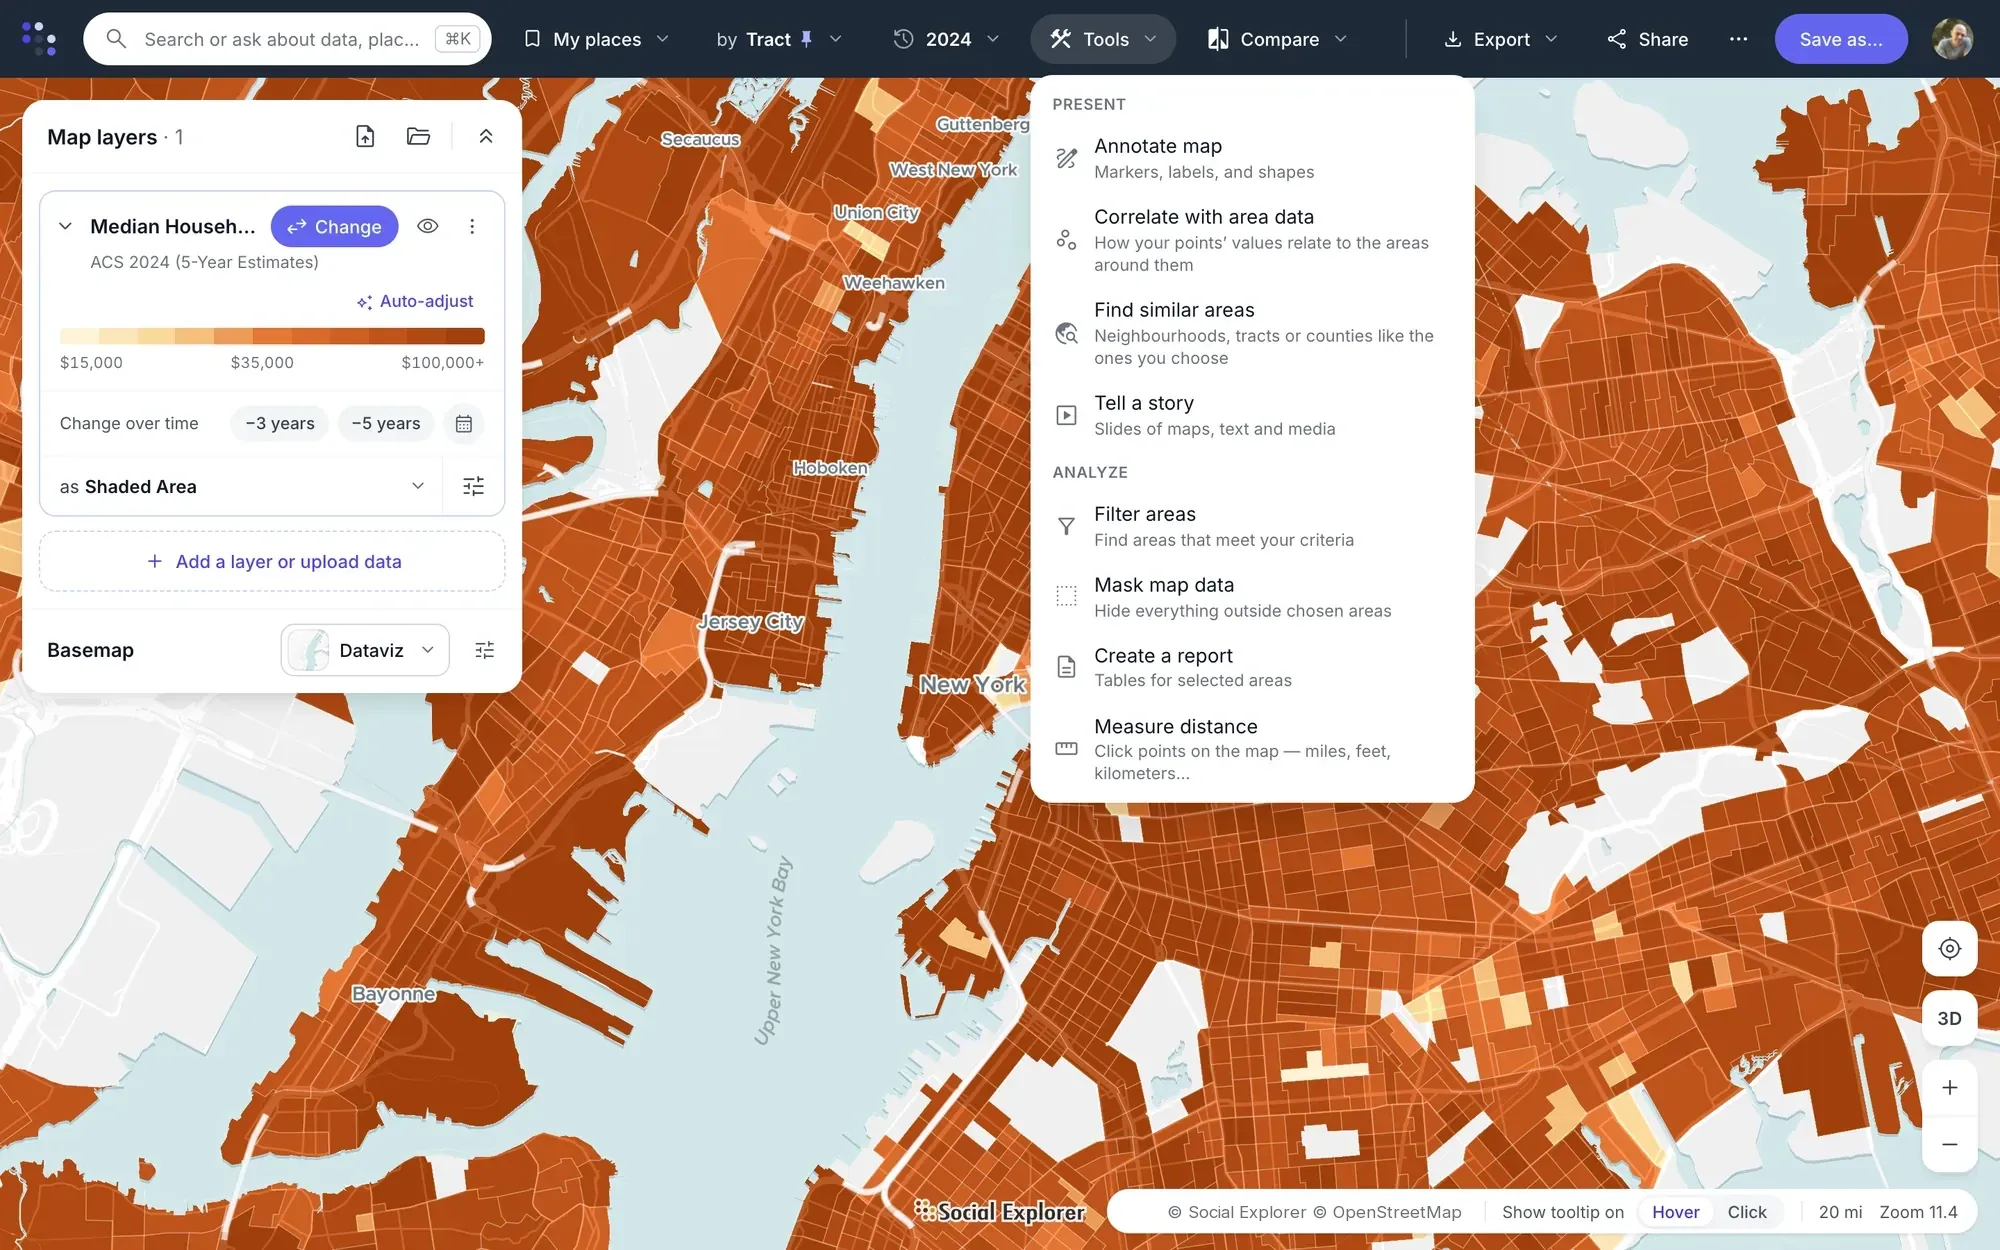
Every tool, one menu away. Filters, masks, reports and measuring, and the ways to present a map: annotations and stories.
3D terrain
The land under the numbers.
Tilt any map into 3D and switch on terrain. Mountains, valleys and volcanoes rise in relief under the data, with sky and haze at the horizon, so you can see where communities sit against the land around them.
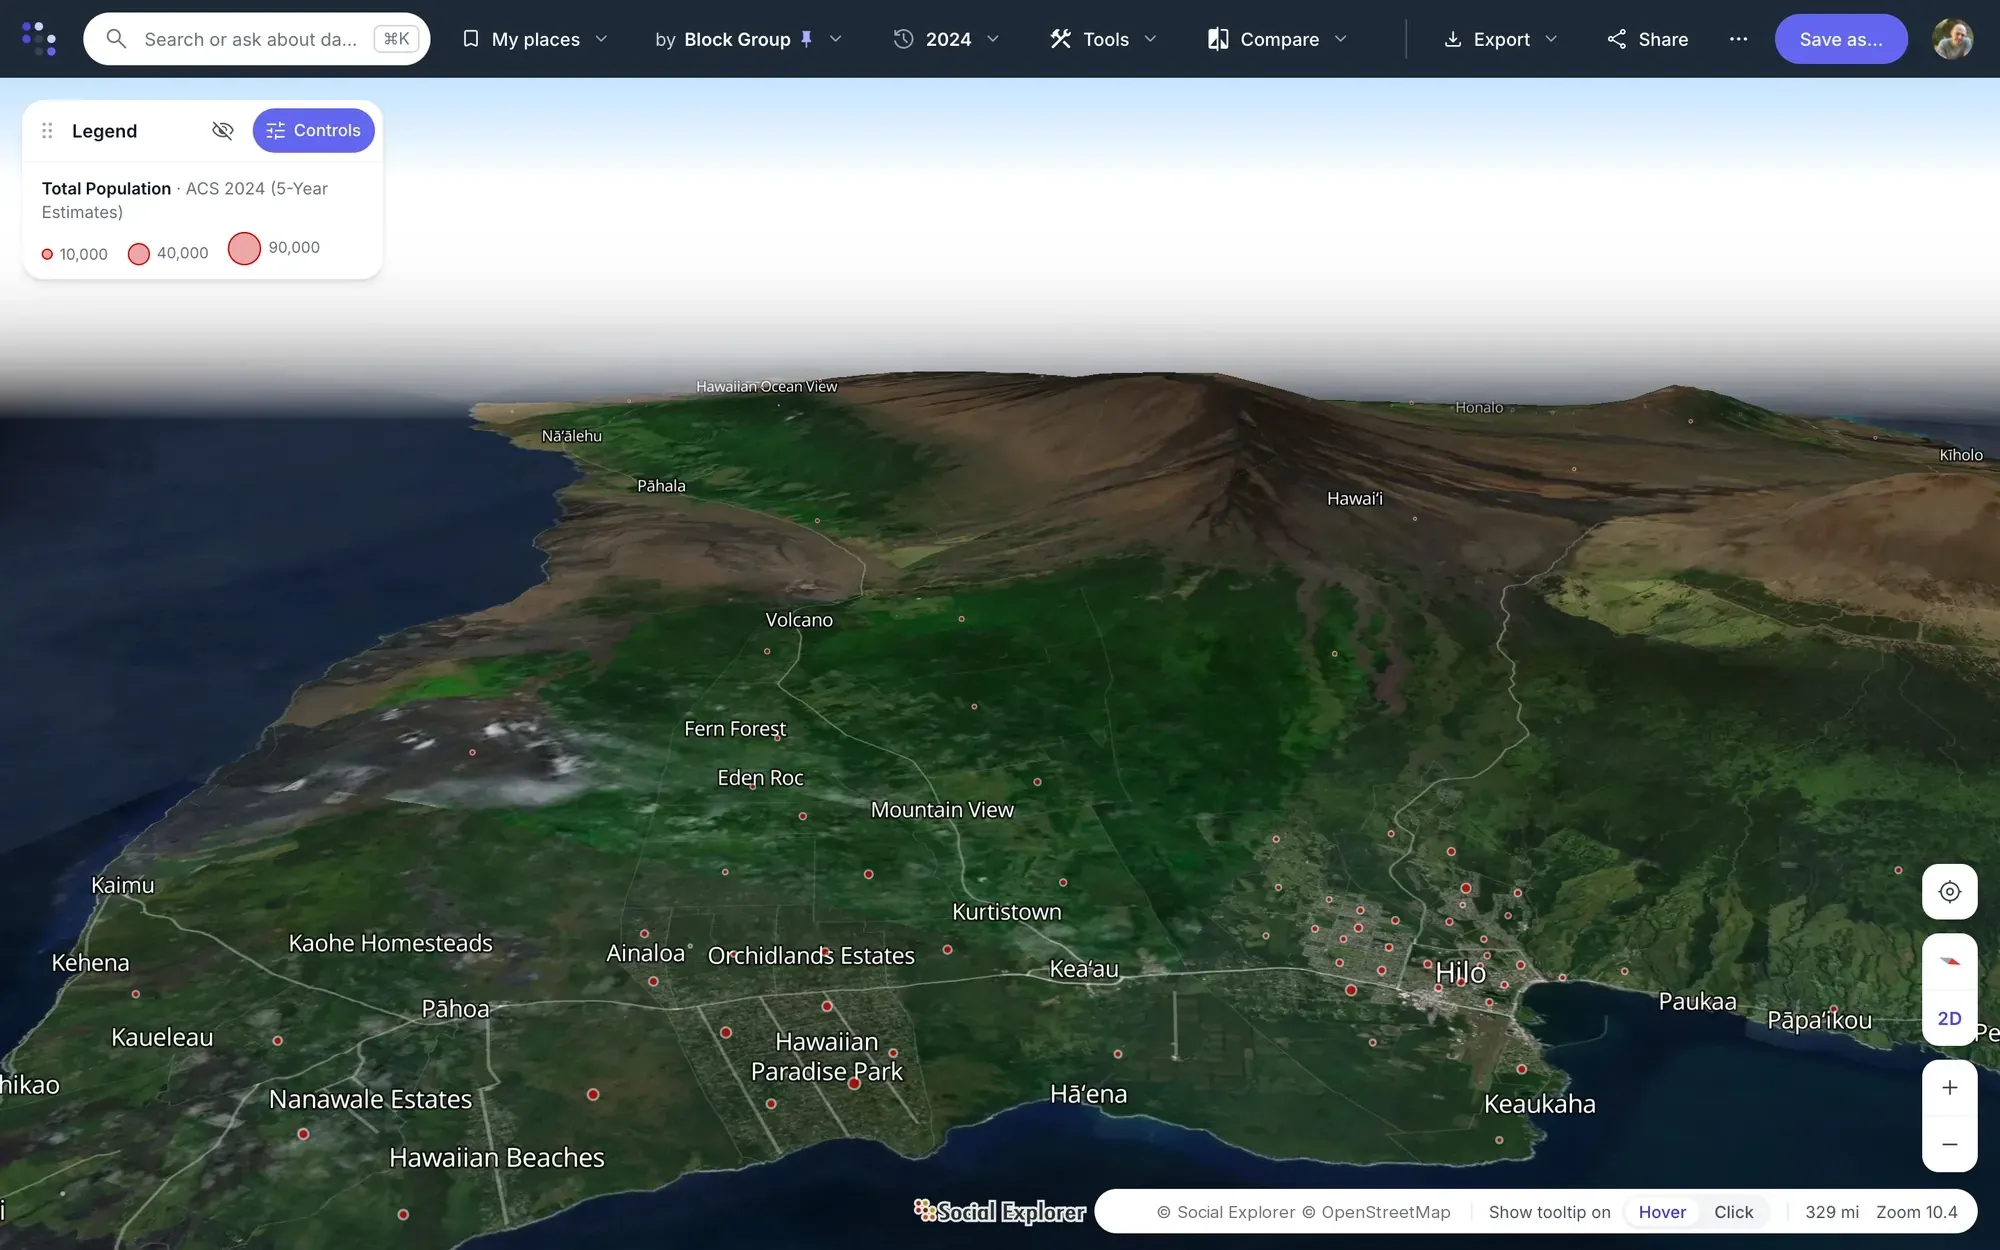
On Hawaiʻi Island the Hybrid base map lays satellite imagery over the terrain, and population bubbles mark the Puna subdivisions on the flank of Kīlauea. Shaded areas, bubbles and dots all drape over the relief. Tilt with right-drag, Ctrl-drag or two fingers, turn the map with the compass, and zoom all the way out to a globe.
- 3 ways
- to draw data over the relief: shaded areas, bubbles and dots
- 7 base maps
- from a quiet light map to satellite imagery
- Down to the block group
- the smallest areas the American Community Survey publishes
Population mapping for the way you work.
-
Retail and real estate
Draw drive-time trade areas around sites, compare them side by side, and find neighborhoods like the best-performing locations.
Site selection software -
Health and human services
Map who lives within reach of a clinic, where older or uninsured residents are, and which areas meet a program’s criteria.
Healthcare -
Planning and government
Follow growth and decline between surveys, compare tracts and districts, and publish maps residents can explore.
GIS data for urban planning -
Journalism
Find the number behind a story fast, show the change on a map, and export a print-ready graphic for the newsroom’s designers.
Build an interactive population map -
Teaching and research
Let students explore any place and year, build stories of maps for class, and cite every variable properly.
Universities and libraries -
Nonprofits and grants
Show the communities a program serves, the places that qualify, and the change the program is working toward.
Nonprofits
Questions about Social Explorer Maps
What is a population map?
A population map shades each area by data about the people who live there, such as how many there are, their age or their income. Social Explorer Maps is population mapping software that draws these maps with 610,000+ variables from the census and other public sources, from states down to block groups depending on the dataset.
What does a population density map show?
A population density map shows how many people live per square mile in each area, so crowded neighborhoods stand out from sparse ones. It’s usually a choropleth map, with each area shaded, or a dot-density map. Social Explorer Maps draws both from the census and the American Community Survey, with each map’s legend and source.
What data can I map?
Social Explorer Maps can map variables from 1,206 surveys in 169 topics, including every census back to 1790, the American Community Survey, FBI crime data and CDC health data. Every variable comes with its definition and a citation. Search in plain words, browse by topic or by source, or let the topic wizard walk you through it.
How small are the areas?
Social Explorer Maps goes down to census tracts and block groups, the smallest areas the American Community Survey publishes. The map follows your zoom from states and counties down, or you can pin one geography level. Click any area for its numbers, or select several and compare them in one report.
Do I need to know GIS?
No. Social Explorer Maps is demographic mapping software for people who aren’t GIS specialists. Search for a place or a topic in plain words, or let the topic wizard walk you through it. It runs in the browser, with nothing to install, and every map keeps its legend and source.
Can I add my own data?
Yes. In Social Explorer Maps, upload a CSV of addresses or coordinates, and it becomes a layer over the census data, beside any of 198 reference layers such as hospitals, schools and transit. Add a measure such as sales or visits, and Correlate with area data shows how it moves with the neighborhood around each location.
The rest of the platform.
Try Maps on a place you know
See Maps in a live demo, or talk to us about access for your team or campus.
Videos and screenshots show Social Explorer Maps with American Community Survey 2024 5-year estimates.