

Connecticut: Population, demographics and census data
Home to 3,688,496 people, the 29th largest of the 50 states and DC. It grew 2.7% between 2015 and 2025.
- Population
- 3.69M. Census Bureau estimate · Rank 29 of the 50 states and DC
- Median household income
- $100,056 ±$1,570. US $84,780
- Median age
- 41.6 ±0.3. US 39.5
ACS 2025 1-year estimates, U.S. Census Bureau
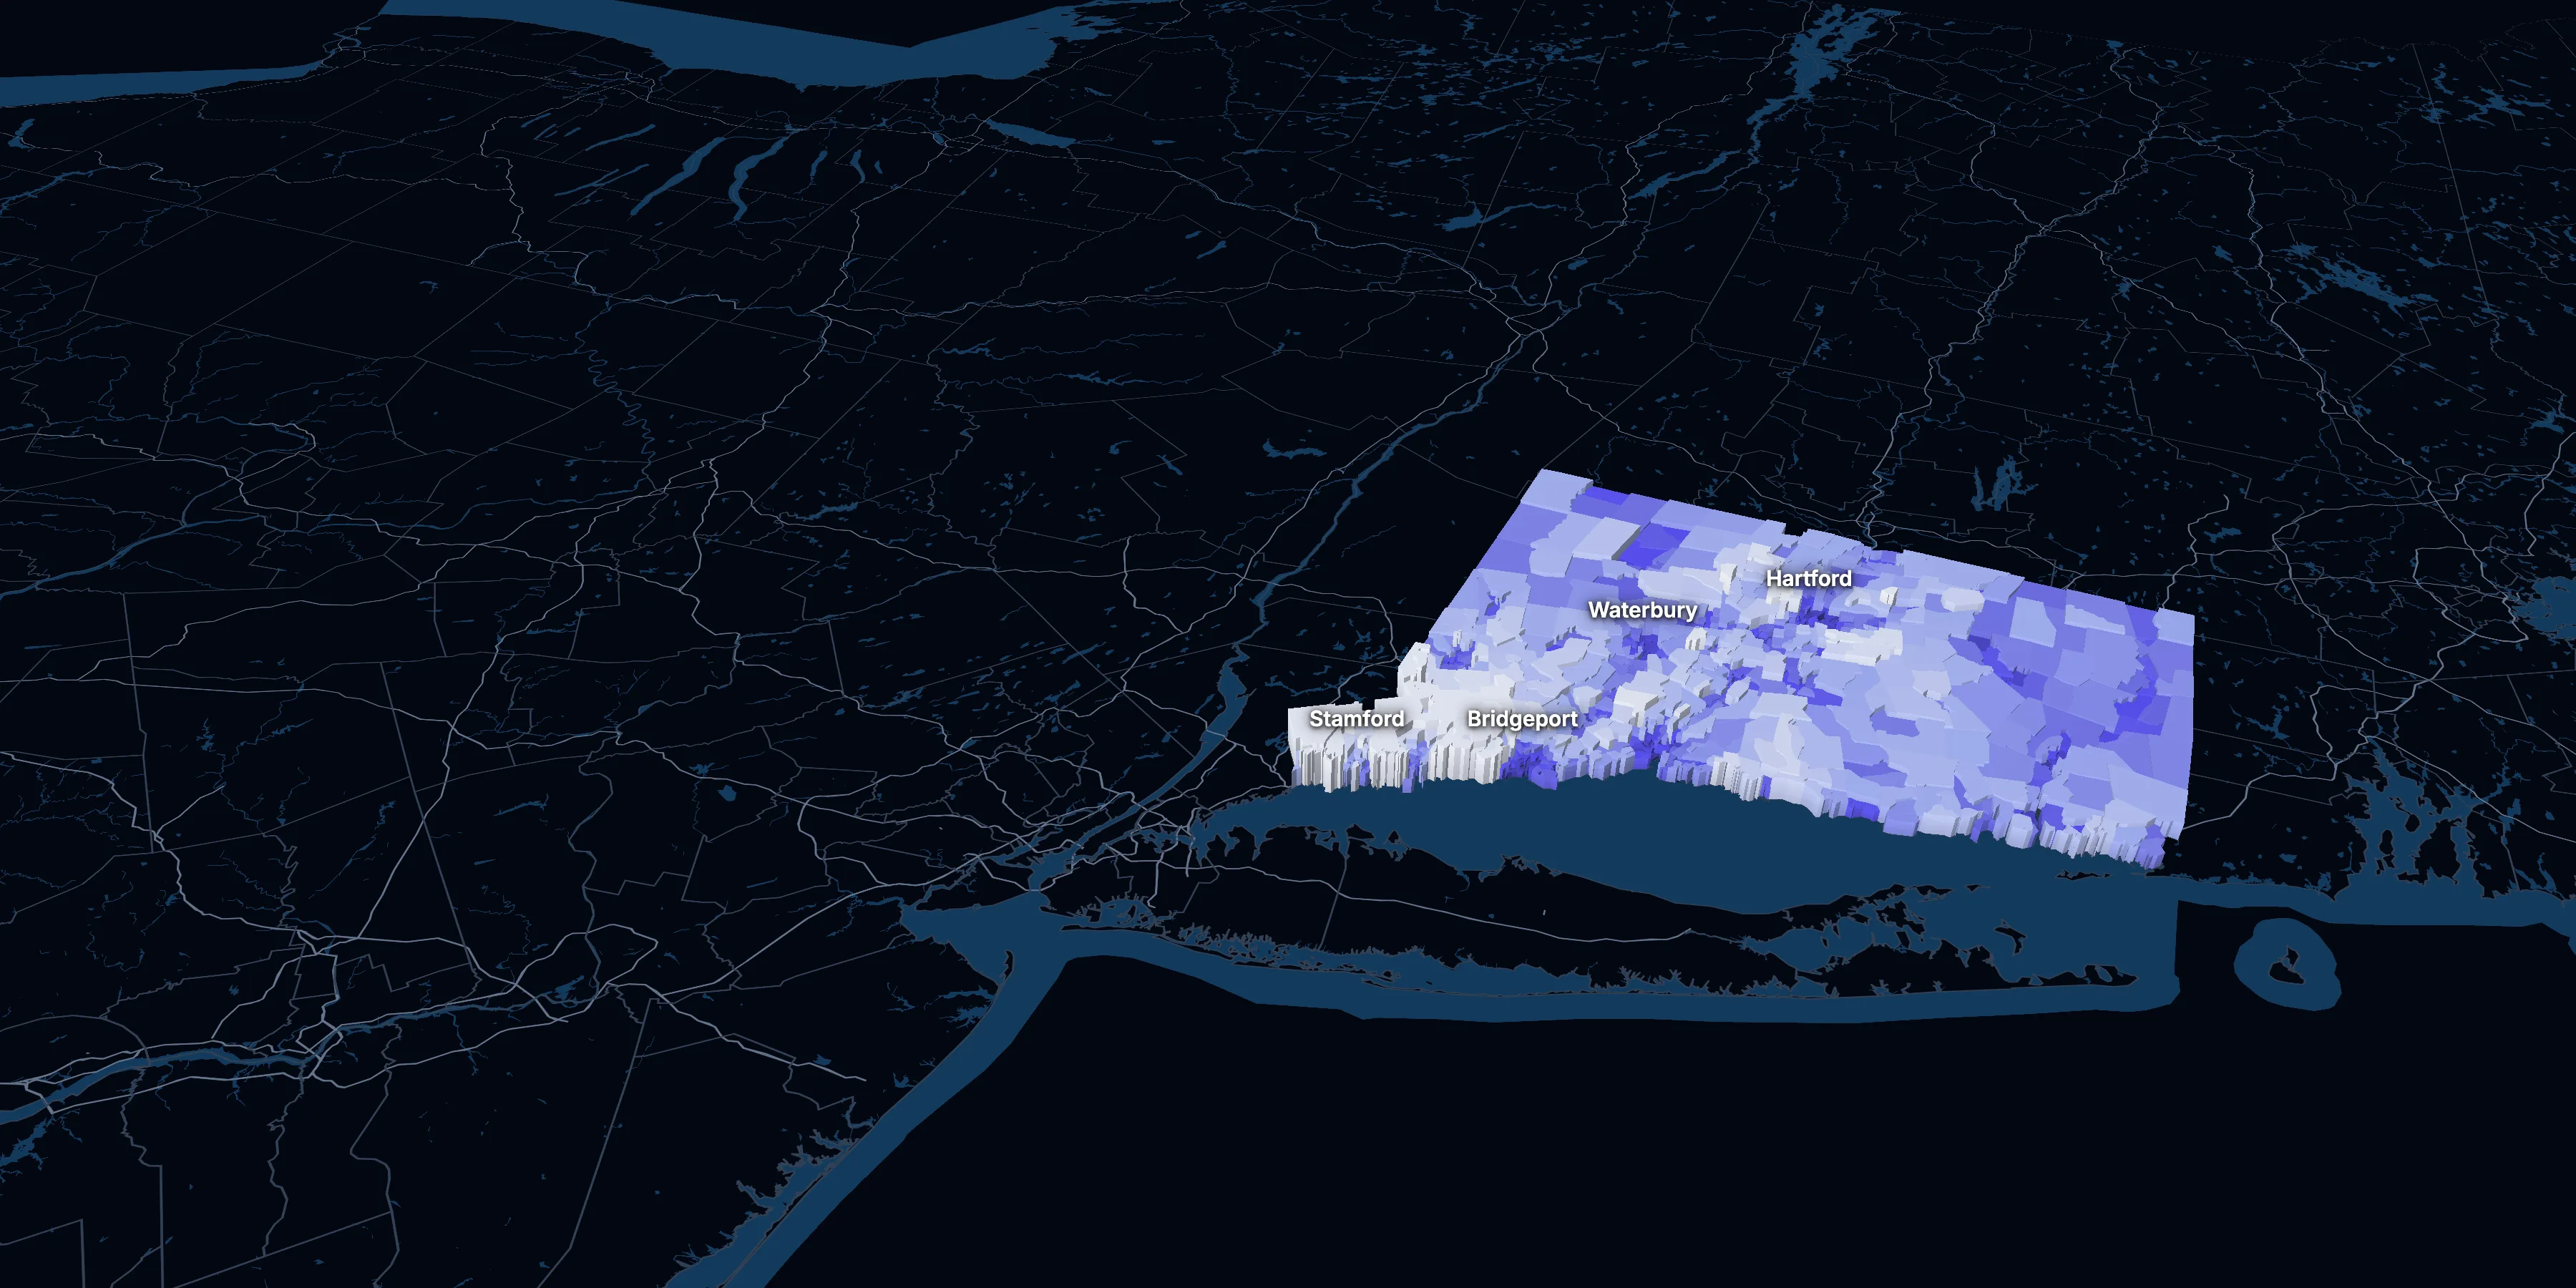
Taller, lighter tracts have higher household incomes
About Connecticut
Connecticut’s median household income is $100,056 (±$1,570), higher than the US ($84,780), and its median age is 41.6 (±0.3), according to the ACS 2025 1-year estimates. Its largest city is Bridgeport.
± is each figure’s margin of error, at 90% confidence, and † marks one too uncertain to lean on. Under each percentage in the tables is the number it counts. How the margins are worked out.
FIPS code 09
Highlights
What stands out in Connecticut
The numbers where Connecticut sits furthest from the nation, or past a recognized policy benchmark.
Past a policy benchmark
52.4%
Very highRenters paying 30% or more of income
That’s higher than the US (48.3%). HUD counts households paying 30% or more of income on housing as cost-burdened. It’s the 7th highest of the 50 states and DC.
26.5%
Very highOwners paying 30% or more of income
That’s higher than the US (24.2%). HUD’s 30% standard, applied to homeowners. It’s the 7th highest of the 50 states and DC.
38.6%
Very highHomes built before 1960
That’s higher than the US (24.0%). Older homes carry more lead-paint risk: the EPA found lead paint in 69% of homes built from 1940 to 1959. It’s the 6th highest of the 50 states and DC.
5.6%
ElevatedUnemployment rate
That’s higher than the US (4.9%). The Department of Labor uses 6% as its floor for a labor surplus area.
+8 points
ElevatedRent growth ahead of income
After inflation, rent grew 11% from 2015 to 2025, and household income 2%. The dots show rent growth.
Furthest from the national picture
$100,056
Higher than the USMedian household income
That’s higher than the US ($84,780).
2015 to 2025
How Connecticut changed in ten years
The state added 97,610 people. It got older, more foreign-born and better educated, and poverty fell 1.4 points.
Population, change since 2015
+2.7% in the state and +6.3% in the US.
Source: ACS 1-year, 2015 to 2025, table A00001.
Show data
| Connecticut | United States | |
|---|---|---|
| 2015 | 0.0% | 0.0% |
| 2016 | −0.4% | +0.5% |
| 2017 | −0.1% | +1.3% |
| 2018 | −0.5% | +1.8% |
| 2019 | −0.7% | +2.1% |
| 2021 | +0.4% | +3.3% |
| 2022 | +1.0% | +3.7% |
| 2023 | +0.7% | +4.2% |
| 2024 | +2.3% | +5.8% |
| 2025 | +2.7% | +6.3% |
Embed
Median household income, in 2025 dollars
+2.4% in the state and +10.9% in the US.
Source: ACS 1-year, 2015 to 2025, table A14006.
Show data
| Connecticut | United States | |
|---|---|---|
| 2015 | $97,745 | $76,413 |
| 2016 | $99,324 | $77,931 |
| 2017 | $98,206 | $79,891 |
| 2018 | $98,687 | $80,059 |
| 2019 | $100,085 | $83,427 |
| 2021 | $100,357 | $83,521 |
| 2022 | $97,958 | $82,811 |
| 2023 | $97,520 | $82,683 |
| 2024 | $99,268 | $84,339 |
| 2025 | $100,056 | $84,780 |
Embed
Living in poverty
−1.4 points in the state and −3.0 points in the US.
Source: ACS 1-year, 2015 to 2025, table A13004.
Show data
| Connecticut | United States | |
|---|---|---|
| 2015 | 10.5% | 14.7% |
| 2016 | 9.8% | 14.0% |
| 2017 | 9.6% | 13.4% |
| 2018 | 10.4% | 13.1% |
| 2019 | 10.0% | 12.3% |
| 2021 | 10.1% | 12.8% |
| 2022 | 9.8% | 12.6% |
| 2023 | 10.3% | 12.5% |
| 2024 | 10.2% | 12.1% |
| 2025 | 9.1% | 11.8% |
Embed
Bachelor’s degree or more
+5.3 points in the state and +6.7 points in the US.
Source: ACS 1-year, 2015 to 2025, table A12001.
Show data
| Connecticut | United States | |
|---|---|---|
| 2015 | 38.3% | 30.6% |
| 2016 | 38.6% | 31.3% |
| 2017 | 38.7% | 32.0% |
| 2018 | 39.6% | 32.6% |
| 2019 | 39.8% | 33.1% |
| 2021 | 42.1% | 35.0% |
| 2022 | 41.9% | 35.7% |
| 2023 | 42.9% | 36.2% |
| 2024 | 42.6% | 36.8% |
| 2025 | 43.6% | 37.4% |
Embed
Median gross rent, in 2025 dollars
+10.6% in the state and +18.5% in the US.
Source: ACS 1-year, 2015 to 2025, table A18009.
Show data
| Connecticut | United States | |
|---|---|---|
| 2015 | $1,518 | $1,314 |
| 2016 | $1,508 | $1,327 |
| 2017 | $1,490 | $1,340 |
| 2018 | $1,514 | $1,368 |
| 2019 | $1,494 | $1,393 |
| 2021 | $1,530 | $1,427 |
| 2022 | $1,507 | $1,440 |
| 2023 | $1,556 | $1,496 |
| 2024 | $1,602 | $1,537 |
| 2025 | $1,679 | $1,557 |
Embed
Median home value, in 2025 dollars
+14.2% in the state and +39.3% in the US.
Source: ACS 1-year, 2015 to 2025, table A10036.
Show data
| Connecticut | United States | |
|---|---|---|
| 2015 | $371,138 | $266,469 |
| 2016 | $371,417 | $277,278 |
| 2017 | $361,612 | $288,124 |
| 2018 | $358,565 | $296,908 |
| 2019 | $356,373 | $305,336 |
| 2021 | $373,175 | $337,116 |
| 2022 | $384,616 | $355,481 |
| 2023 | $391,294 | $361,931 |
| 2024 | $410,202 | $372,685 |
| 2025 | $423,900 | $371,100 |
Embed
ACS 1-year estimates. The dotted stretch of each line spans 2020, when the Census Bureau released no standard 1-year estimates. Dollar values are in 2025 dollars.
| Indicator | 2015 | 2025 | Change |
|---|---|---|---|
| Population | 3,590,886 | 3,688,496 | +2.7% |
| Median age | 40.6 | 41.6 | +1.0 years |
| 65 and over | 15.7% | 20.5% | +4.7 points |
| Born outside the US | 14.5% | 15.7% | +1.3 points |
| Hispanic or Latino | 15.4% | 19.9% | +4.5 points |
| Median household income | $97,745 | $100,056 | +2.4% |
| Living in poverty | 10.5% | 9.1% | −1.4 points |
| Bachelor’s degree or more | 38.3% | 43.6% | +5.3 points |
| Households that rent | 33.8% | 33.4% | −0.5 points |
| Median gross rent | $1,518 | $1,679 | +10.6% |
| Median home value | $371,138 | $423,900 | +14.2% |
884 census tracts
Connecticut, tract by tract
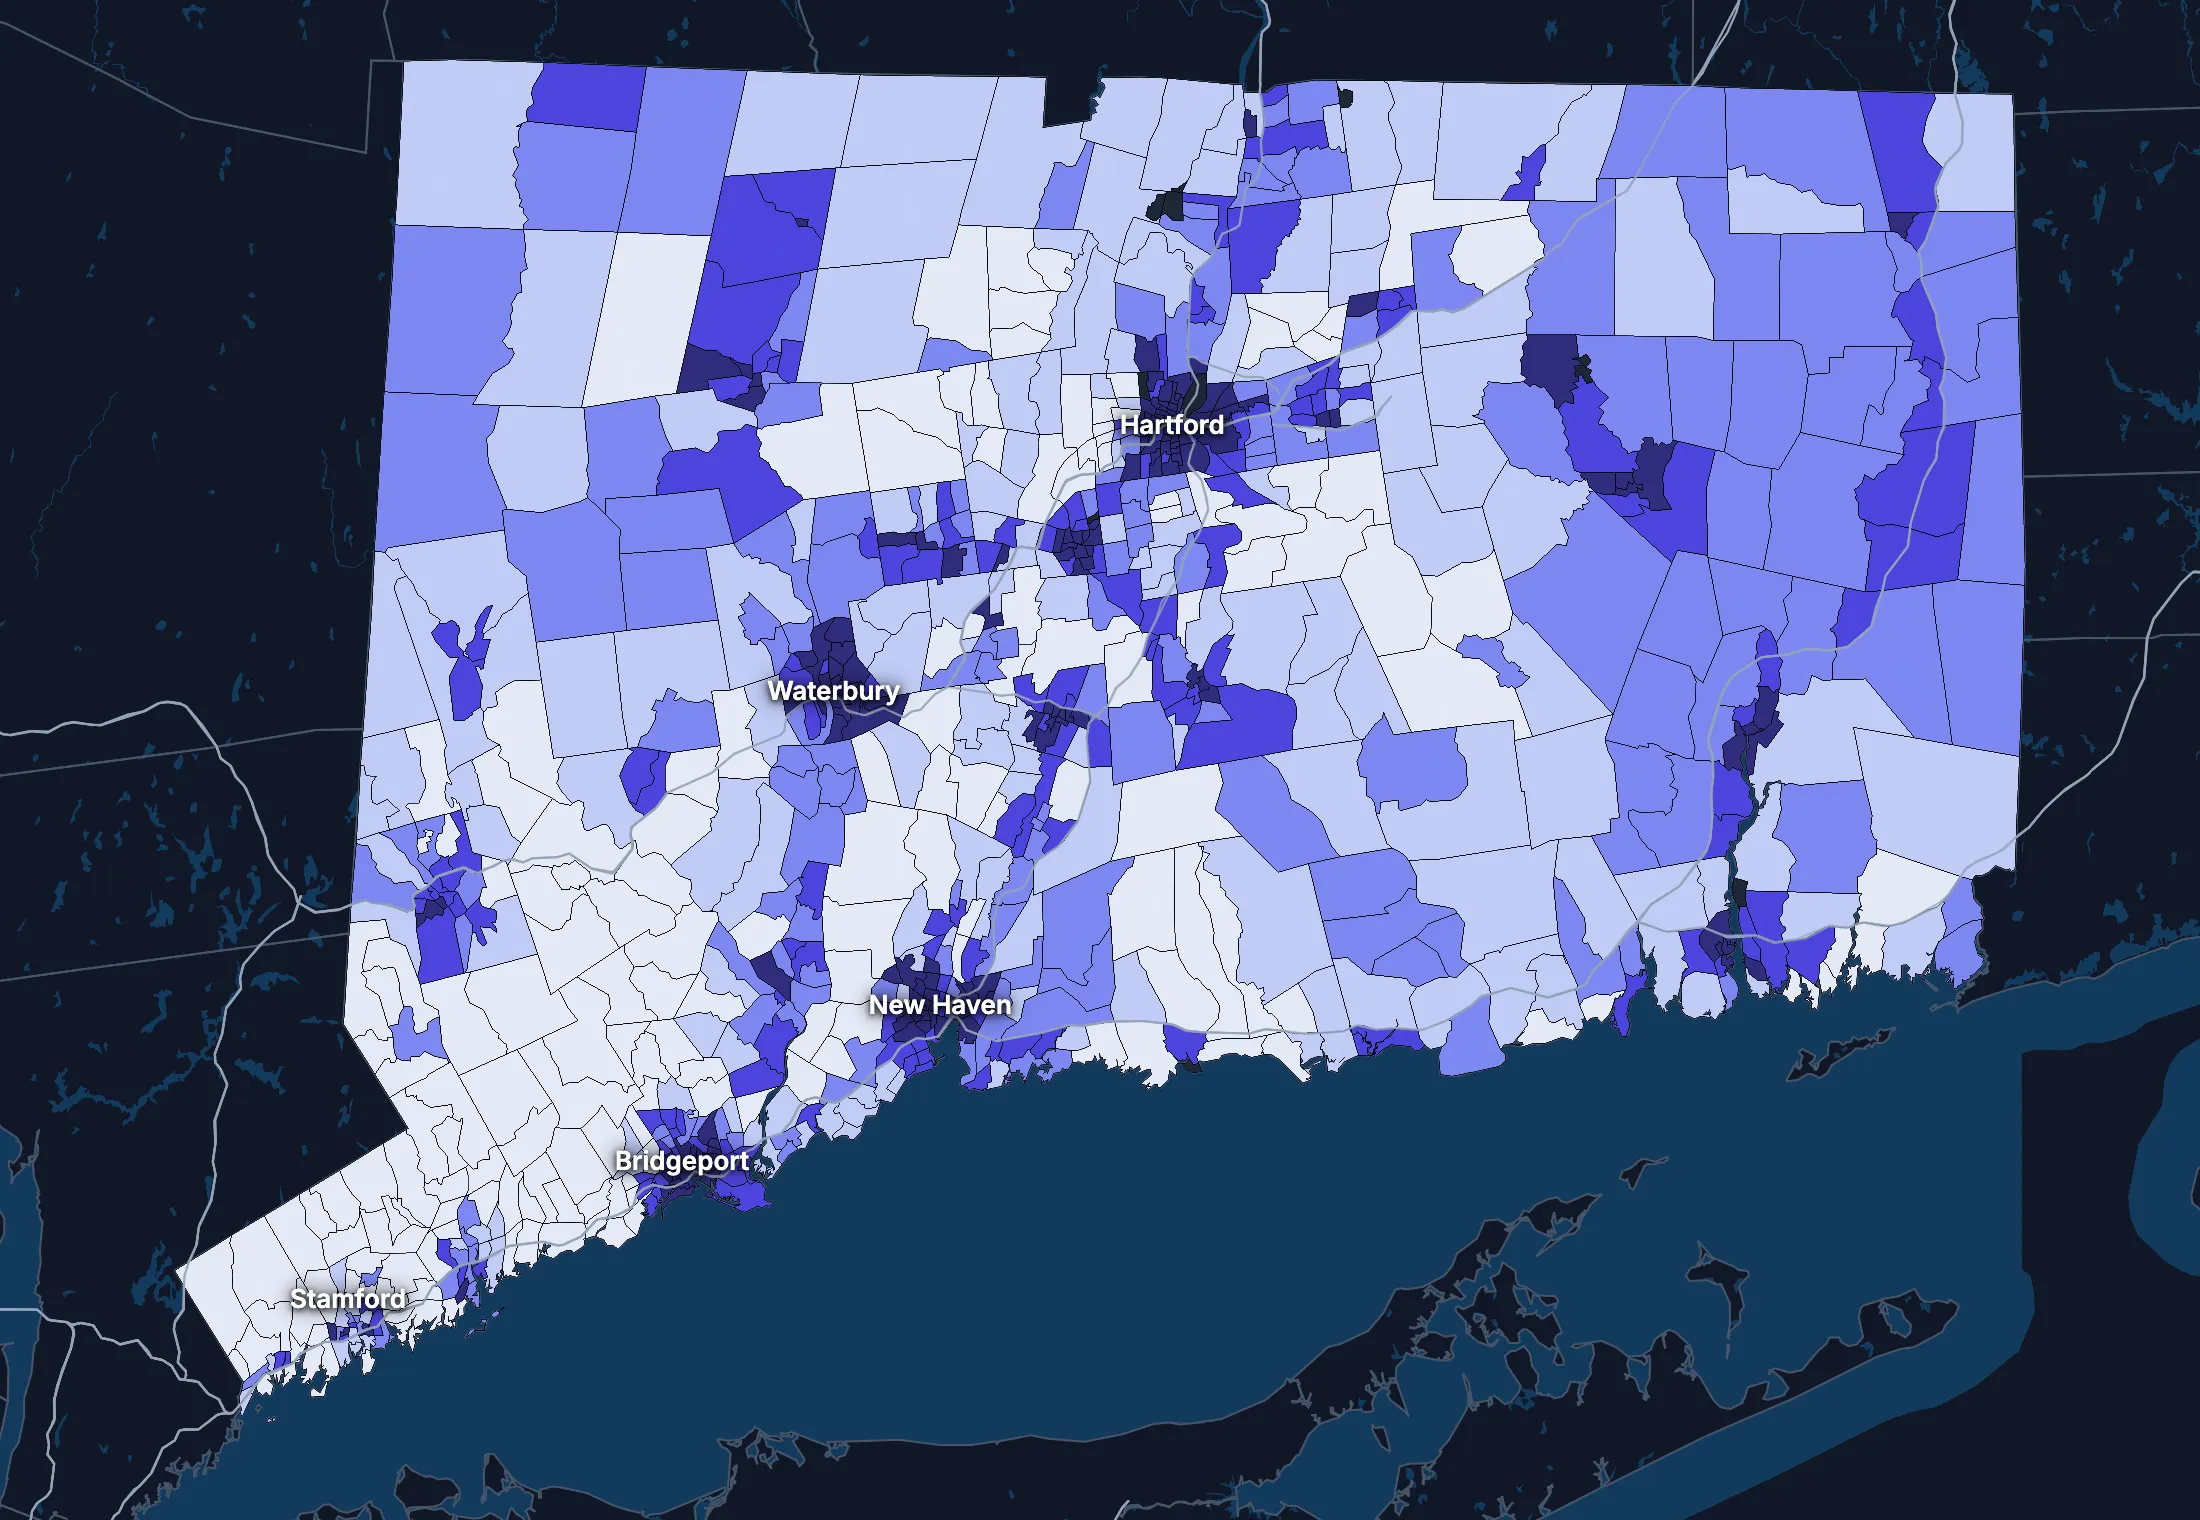
State averages hide a lot. These census tracts are the closest the census comes to neighborhoods.
Where the state’s average misleads
Each tick is one census tract, and the dark line marks the state. Hover over a tick or tap it to see the tract.
Poverty
204 of 871 tracts are at least 1.5 times the state’s overall 10.0%, and 311 are at two-thirds of it or less.
Highest: Tract 703, 67.8%. Lowest: Tract 6937, 0.0%.
Renters paying 30% or more of income
38 of 817 tracts are at least 1.5 times the state’s overall 49.4%, and 156 are at two-thirds of it or less.
Highest: Tract 1574, 100.0%. Lowest: Tract 4306.04, 0.0%.
Adults with a bachelor’s degree
135 of 875 tracts are at least 1.5 times the state’s overall 42.5%, and 271 are at two-thirds of it or less.
Highest: Tract 303, 94.0%. Lowest: Tract 9801, 1.5%.
Median household income
146 of 870 tracts are at least 1.5 times the typical tract’s $99,813, and 188 are at two-thirds of it or less.
Highest: Tract 604, $250,000 or more. Lowest: Tract 3501.01, $15,351.
American Community Survey 2020–2024 5-year estimates, by census tract. Income is capped at $250,000+ by the Census Bureau.
People
Who lives in Connecticut
Its median age of 41.6 is higher than the US (39.5). 15.7% of residents were born outside the US, and 23.5% speak a language other than English at home.
Age
Source: ACS 2025 1-year, table A01001.
Show data
| Connecticut | United States | |
|---|---|---|
| Under 18 | 19.4% ±0.3% , number 714,345 ±10,620 | 21.0% ±<0.1% , number 71,689,151 ±111,800 |
| 18 to 24 | 9.5% ±0.3% , number 349,366 ±9,599 | 9.3% ±<0.1% , number 31,716,680 ±98,660 |
| 25 to 34 | 12.4% ±0.1% , number 456,609 ±3,806 | 13.6% ±<0.1% , number 46,357,354 ±55,690 |
| 35 to 44 | 13.3% ±0.3% , number 491,779 ±11,340 | 13.4% ±<0.1% , number 45,746,189 ±105,700 |
| 45 to 54 | 11.7% ±0.1% , number 431,027 ±4,272 | 11.8% ±<0.1% , number 40,257,563 ±53,540 |
| 55 to 64 | 13.3% ±0.3% , number 490,817 ±11,300 | 12.1% ±<0.1% , number 41,242,904 ±104,700 |
| 65 to 74 | 11.4% ±0.3% , number 422,102 ±9,812 | 10.8% ±<0.1% , number 36,895,650 ±91,520 |
| 75 and over | 9.0% ±0.2% , number 332,451 ±8,557 | 8.2% ±<0.1% , number 27,879,368 ±78,140 |
Embed
Race and ethnicity
Source: ACS 2025 1-year, table A04001.
Show data
| Connecticut | United States | |
|---|---|---|
| White, not Hispanic | 59.2% ±0.2% , number 2,183,301 ±6,531 | 55.0% ±<0.1% , number 187,959,031 ±58,340 |
| Hispanic or Latino | 19.9% , number 733,560 | 20.5% ±<0.1% , number 69,975,516 ±13,270 |
| Black, not Hispanic | 10.0% ±0.2% , number 368,093 ±8,343 | 11.7% ±<0.1% , number 40,096,453 ±106,200 |
| Asian, not Hispanic | 5.1% ±0.1% , number 186,900 ±5,368 | 6.5% ±<0.1% , number 22,096,709 ±58,340 |
| Other or multiracial | 5.9% ±0.4% , number 216,642 ±13,410 | 6.3% ±<0.1% , number 21,657,150 ±150,100 |
Embed
Language spoken at home
Source: ACS 2025 1-year, table C16001.
Show data
| Connecticut | United States | |
|---|---|---|
| English only | 76.5% ±0.6% , number 2,685,373 ±20,660 | 77.1% ±0.1% , number 249,390,588 ±275,300 |
| Spanish | 13.1% ±0.4% , number 460,600 ±14,270 | 13.9% ±0.1% , number 44,921,985 ±177,800 |
| Other Indo-European | 6.9% ±0.4% , number 240,735 ±14,340 | 4.0% ±<0.1% , number 12,862,980 ±113,500 |
| Asian and Pacific Island | 2.5% ±0.3% , number 89,388 ±8,840 | 3.8% ±<0.1% , number 12,288,841 ±99,740 |
| Arabic and other | 0.9% ±0.2% , number 32,545 ±5,591 | 1.3% ±<0.1% , number 4,116,949 ±71,480 |
Embed
Marital status
Source: ACS 2025 1-year, table A11001.
Show data
| Connecticut | United States | |
|---|---|---|
| Now married | 47.0% ±0.5% , number 1,462,359 ±16,090 | 47.9% ±0.1% , number 135,567,564 ±223,300 |
| Never married | 36.5% ±0.4% , number 1,135,215 ±13,970 | 34.8% ±0.1% , number 98,647,238 ±152,600 |
| Divorced | 10.3% ±0.4% , number 319,921 ±11,000 | 10.2% ±<0.1% , number 28,879,967 ±112,900 |
| Widowed | 5.0% ±0.2% , number 156,344 ±6,502 | 5.5% ±<0.1% , number 15,599,094 ±69,430 |
| Separated | 1.1% ±0.1% , number 34,682 ±4,615 | 1.6% ±<0.1% , number 4,441,399 ±49,160 |
Embed
Where people lived a year ago
Source: ACS 2025 1-year, table A08001.
Show data
| Connecticut | United States | |
|---|---|---|
| Same home | 90.7% ±0.5% , number 3,313,776 ±17,950 | 88.4% ±0.1% , number 298,889,697 ±214,800 |
| Same county | 4.9% ±0.4% , number 177,771 ±14,470 | 6.0% ±<0.1% , number 20,202,671 ±166,300 |
| Another county in the state | 2.0% ±0.3% , number 72,773 ±11,090 | 3.0% ±<0.1% , number 10,168,097 ±89,190 |
| Another state | 1.9% ±0.2% , number 70,877 ±7,380 | 2.1% ±<0.1% , number 7,025,589 ±81,660 |
| Another country | 0.5% ±0.1% , number 18,023 ±4,120 | 0.6% ±<0.1% , number 1,984,943 ±47,210 |
Embed
Top countries of birth, among those born abroad
Source: ACS 2025 1-year, table A07001.
Show data
| Connecticut | |
|---|---|
| Jamaica | 8.0% , number 46,654 |
| India | 6.8% , number 39,694 |
| Dominican Republic | 6.2% , number 35,845 |
| Ecuador | 4.8% , number 27,795 |
| China, Excluding Hong Kong and Taiwan | 4.2% , number 24,228 |
| Brazil | 3.8% , number 22,262 |
Embed
All the numbers
| Indicator | Connecticut | US | Rank among states* | Table |
|---|---|---|---|---|
| Population | 3,688,496 | 341,784,859 | 29th | A00001 |
| People per square mile | 762 | 97 | 5th | A00002 |
| Land area (square miles) | 4,843 | – | – | A00002 |
| Median age | 41.6 ±0.3 | 39.5 ±0.1 | 7th | A01004 |
| Under 18 | 19.4% ±0.3% , number 714,345 ±10,620 | 21.0% ±<0.1% , number 71,689,151 ±111,800 | 42nd | B02002 |
| 65 and over | 20.5% ±0.4% , number 754,553 ±13,020 | 19.0% ±<0.1% , number 64,775,018 ±120,300 | 18th | B02002 |
| Born outside the US | 15.7% ±0.5% , number 580,312 ±17,490 | 14.7% ±0.1% , number 50,409,320 ±204,800 | 10th | A06001 |
| Speak a language other than English at home | 23.5% ±0.6% , number 823,268 ±22,770 | 22.9% ±0.1% , number 74,190,755 ±244,000 | 12th | C16001 |
| Veterans (adults) | 4.5% ±0.2% , number 134,586 ±6,890 | 5.9% ±<0.1% , number 15,746,228 ±85,320 | 45th | A16002 |
| Living with a disability | 12.6% ±0.4% , number 458,327 ±13,490 | 13.7% ±<0.1% , number 46,271,455 ±126,000 | 42nd | B18101 |
| Women 15–50 who had a baby in the past year | 4.6% ±0.5% , number 38,802 ±4,288 | 5.0% ±0.1% , number 4,016,759 ±44,040 | 44th | B13002 |
| Lived in the same home a year ago | 90.7% ±0.5% , number 3,313,776 ±17,950 | 88.4% ±0.1% , number 298,889,697 ±214,800 | 8th | A08001 |
| White, not Hispanic | 59.2% ±0.2% , number 2,183,301 ±6,531 | 55.0% ±<0.1% , number 187,959,031 ±58,340 | 32nd | A04001 |
| Hispanic or Latino | 19.9% , number 733,560 | 20.5% ±<0.1% , number 69,975,516 ±13,270 | 11th | A04001 |
| Black, not Hispanic | 10.0% ±0.2% , number 368,093 ±8,343 | 11.7% ±<0.1% , number 40,096,453 ±106,200 | 22nd | A04001 |
| Asian, not Hispanic | 5.1% ±0.1% , number 186,900 ±5,368 | 6.5% ±<0.1% , number 22,096,709 ±58,340 | 14th | A04001 |
*1 is the highest. Population is ranked among all states, and the rest among those of 1,000 people or more, whose figures can be ranked. Ranks use 5-year estimates, the only ones covering every state, so they can differ slightly from the figures here.
Income and work
Higher incomes than the US
The median household income is $100,056, higher than the US ($84,780). 9.1% of people live in poverty, and 5.2% have no health insurance, lower than the US (8.4%).
Household income
Source: ACS 2025 1-year, table A14001.
Show data
| Connecticut | United States | |
|---|---|---|
| Under $25,000 | 11.6% ±0.6% , number 169,604 ±9,277 | 14.0% ±0.1% , number 18,727,548 ±88,990 |
| $25,000 to $49,999 | 13.2% ±0.7% , number 193,036 ±10,050 | 15.4% ±0.1% , number 20,665,585 ±101,400 |
| $50,000 to $74,999 | 13.6% ±0.6% , number 198,118 ±8,794 | 15.3% ±0.1% , number 20,513,565 ±88,500 |
| $75,000 to $99,999 | 11.5% ±0.5% , number 167,173 ±7,484 | 12.5% ±0.1% , number 16,814,245 ±87,520 |
| $100,000 to $149,999 | 18.0% ±0.6% , number 262,115 ±9,109 | 17.9% ±0.1% , number 24,018,984 ±99,670 |
| $150,000 to $199,999 | 11.5% ±0.5% , number 167,979 ±7,020 | 10.1% ±0.1% , number 13,521,827 ±70,660 |
| $200,000 or more | 20.5% ±0.5% , number 298,890 ±8,155 | 14.8% ±0.1% , number 19,801,668 ±84,120 |
Embed
What residents do for work
Source: ACS 2025 1-year, table A17004.
Show data
| Connecticut | United States | |
|---|---|---|
| Education and health care | 29.1% ±0.8% , number 550,674 ±15,080 | 24.4% ±0.1% , number 40,862,193 ±140,800 |
| Professional and business services | 11.9% ±0.5% , number 225,782 ±9,236 | 12.8% ±0.1% , number 21,375,231 ±87,110 |
| Manufacturing | 10.5% ±0.5% , number 198,912 ±8,994 | 9.6% ±0.1% , number 16,064,394 ±91,270 |
| Retail trade | 10.0% ±0.5% , number 189,525 ±10,210 | 10.6% ±0.1% , number 17,781,181 ±96,660 |
| Finance, insurance and real estate | 8.9% ±0.4% , number 168,142 ±7,257 | 6.6% ±<0.1% , number 11,025,569 ±68,570 |
| Arts, food and lodging | 7.6% ±0.4% , number 143,093 ±8,567 | 8.9% ±0.1% , number 14,811,502 ±87,840 |
| Construction | 5.6% ±0.3% , number 106,825 ±6,011 | 6.7% ±<0.1% , number 11,254,981 ±79,620 |
| Transportation and warehousing | 4.9% ±0.4% , number 93,714 ±6,783 | 5.9% ±<0.1% , number 9,832,211 ±73,020 |
Embed
Where workers come from and go
Connecticut has 1,644,216 jobs and 1,699,284 employed residents. 132,337 people commute in to work and 187,405 commute out, while 1,511,879 both live and work here. The most commuters come from New York.
Most commuters come from
- New York: 64,401
- Massachusetts: 34,682
- Rhode Island: 10,471
Most residents commute to
- New York: 106,891
- Massachusetts: 45,419
- Rhode Island: 11,847
Show data
| Connecticut | |
|---|---|
| Live and work here | 1,511,879 |
| Work here, live elsewhere | 132,337 |
| Live here, work elsewhere | 187,405 |
Embed
All the numbers
| Indicator | Connecticut | US | Rank among states* | Table |
|---|---|---|---|---|
| Median household income | $100,056 ±$1,570 | $84,780 ±$215 | 9th | A14006 |
| Income per person | $58,121 ±$1,033 | $47,171 ±$115 | 3rd | A14024 |
| Income inequality (Gini index) | 0.495 ±0.007 | 0.482 ±0.001 | 3rd | A14028 |
| Living in poverty | 9.1% ±0.6% , number 326,434 ±21,610 | 11.8% ±0.1% , number 39,264,183 ±277,400 | 43rd | A13004 |
| Unemployment rate | 5.6% ±0.4% , number 112,572 ±7,724 | 4.9% ±<0.1% , number 8,574,594 ±64,350 | 13th | A17005 |
| No health insurance | 5.2% ±0.3% , number 188,792 ±11,080 | 8.4% ±<0.1% , number 28,323,306 ±152,000 | 40th | A20001 |
*1 is the highest. Population is ranked among all states, and the rest among those of 1,000 people or more, whose figures can be ranked. Ranks use 5-year estimates, the only ones covering every state, so they can differ slightly from the figures here.
Education
More college degrees than the US
43.6% of adults 25 and over have a bachelor’s degree or more, higher than the US (37.4%).
Highest level of education
Source: ACS 2025 1-year, table A12001.
Show data
| Connecticut | United States | |
|---|---|---|
| Less than high school | 7.7% ±0.4% , number 201,268 ±10,690 | 9.4% ±0.1% , number 22,321,002 ±120,500 |
| High school only | 25.3% ±0.7% , number 664,006 ±18,310 | 25.6% ±0.1% , number 61,096,726 ±203,400 |
| Some college | 23.4% ±0.6% , number 615,315 ±15,730 | 27.7% ±0.1% , number 65,920,977 ±173,500 |
| Bachelor’s degree | 23.8% ±0.6% , number 623,960 ±15,480 | 22.3% ±0.1% , number 53,224,312 ±196,700 |
| Graduate degree | 19.8% ±0.5% , number 520,236 ±12,350 | 15.0% ±0.1% , number 35,816,011 ±159,400 |
Embed
All the numbers
| Indicator | Connecticut | US | Rank among states* | Table |
|---|---|---|---|---|
| Bachelor’s degree or more | 43.6% ±0.8% , number 1,144,196 ±19,800 | 37.4% ±0.1% , number 89,040,323 ±253,200 | 7th | A12001 |
| High school graduate or more | 92.3% ±1.2% , number 2,423,517 ±31,220 | 90.6% ±0.2% , number 216,058,026 ±368,200 | 27th | A12001 |
*1 is the highest. Population is ranked among all states, and the rest among those of 1,000 people or more, whose figures can be ranked. Ranks use 5-year estimates, the only ones covering every state, so they can differ slightly from the figures here.
Housing
Home values outran incomes
33.4% of households rent, lower than the US (34.7%). The median home is worth $423,900 and the median rent is $1,679. After inflation, home values rose 14% from 2015 to 2025, while household income rose 2%.
Housing costs and income, 2015 to 2025, after inflation
Source: ACS 1-year, table A10036, A18009, A14006.
Show data
| Connecticut | United States | |
|---|---|---|
| Median home value | +14.2% | +39.3% |
| Median rent | +10.6% | +18.5% |
| Median household income | +2.4% | +10.9% |
Embed
Types of homes
Source: ACS 2025 1-year, table A10032.
Show data
| Connecticut | United States | |
|---|---|---|
| Single-family, detached | 59.0% ±0.7% , number 920,080 ±11,530 | 60.9% ±0.1% , number 90,335,844 ±173,300 |
| Single-family, attached | 6.4% ±0.4% , number 99,064 ±6,792 | 6.4% ±<0.1% , number 9,527,703 ±51,230 |
| 2 to 4 units | 15.1% ±0.7% , number 234,694 ±11,120 | 7.5% ±0.1% , number 11,109,005 ±75,790 |
| 5 to 19 units | 8.3% ±0.5% , number 129,844 ±8,179 | 8.7% ±0.1% , number 12,829,882 ±97,590 |
| 20 or more units | 10.6% ±0.6% , number 164,505 ±8,761 | 11.1% ±0.1% , number 16,381,450 ±92,310 |
| Mobile homes and other | 0.6% ±0.1% , number 10,047 ±1,780 | 5.4% ±<0.1% , number 8,045,083 ±53,680 |
Embed
When homes were built
Source: ACS 2025 1-year, table A10055.
Show data
| Connecticut | United States | |
|---|---|---|
| 2010 or later | 6.7% ±0.4% , number 97,891 ±6,185 | 15.1% ±0.1% , number 20,257,912 ±101,300 |
| 2000 to 2009 | 8.0% ±0.5% , number 115,846 ±6,832 | 13.8% ±0.1% , number 18,535,840 ±92,260 |
| 1980 to 1999 | 20.4% ±0.7% , number 297,455 ±10,460 | 24.1% ±0.1% , number 32,332,570 ±118,900 |
| 1960 to 1979 | 26.4% ±0.8% , number 384,002 ±11,210 | 22.9% ±0.1% , number 30,726,302 ±110,000 |
| Before 1960 | 38.6% ±1.0% , number 561,721 ±14,600 | 24.0% ±0.1% , number 32,210,798 ±121,500 |
Embed
All the numbers
| Indicator | Connecticut | US | Rank among states* | Table |
|---|---|---|---|---|
| Housing units | 1,558,234 | – | – | A10001 |
| Households | 1,456,915 ±7,398 | – | – | A10008 |
| People per household | 2.45 ±0.01 | 2.49 ±0.01 | 22nd | A10003 |
| Households that rent | 33.4% ±0.7% , number 486,030 ±10,560 | 34.7% ±0.1% , number 46,551,688 ±193,200 | 17th | A10060 |
| Vacant homes | 6.5% ±0.5% , number 101,319 ±7,496 | 9.6% ±0.1% , number 14,165,545 ±137,100 | 51st | A10047, A10060 |
| Median gross rent | $1,679 ±$26 | $1,557 ±$4 | 17th | A18009 |
| Median home value | $423,900 ±$4,096 | $371,100 ±$646 | 19th | A10036 |
| Renters paying 30% or more of income | 52.4% ±2.3% , number 254,715 ±12,580 | 48.3% ±0.2% , number 22,486,693 ±122,100 | 7th | A18002 |
| Owners paying 30% or more of income | 26.5% ±1.0% , number 257,248 ±10,130 | 24.2% ±0.1% , number 21,201,943 ±93,050 | 7th | A10040 |
| Homes built before 1960 | 38.6% ±1.0% , number 561,721 ±14,600 | 24.0% ±0.1% , number 32,210,798 ±121,500 | 6th | A10055 |
*1 is the highest. Population is ranked among all states, and the rest among those of 1,000 people or more, whose figures can be ranked. Ranks use 5-year estimates, the only ones covering every state, so they can differ slightly from the figures here.
Getting around
A driving state
71.3% of workers drive alone and 12.4% work from home. 38.0% of those who travel to work spend 30 minutes or more getting there, and 9.2% of households have no vehicle.
How people get to work
Source: ACS 2025 1-year, table A09005.
Show data
| Connecticut | United States | |
|---|---|---|
| Drive alone | 71.3% ±0.7% , number 1,324,455 ±18,120 | 69.8% ±0.1% , number 115,297,377 ±192,900 |
| Carpool | 7.6% ±0.5% , number 141,248 ±9,668 | 8.9% ±0.1% , number 14,712,170 ±97,240 |
| Public transit | 5.0% ±0.4% , number 92,807 ±6,839 | 4.3% ±<0.1% , number 7,100,386 ±63,330 |
| Walk | 2.4% ±0.3% , number 43,819 ±4,730 | 2.4% ±<0.1% , number 4,016,469 ±41,070 |
| Work from home | 12.4% ±0.5% , number 230,008 ±9,113 | 12.9% ±0.1% , number 21,288,393 ±105,700 |
| Other | 1.3% ±0.2% , number 24,694 ±4,015 | 1.7% ±<0.1% , number 2,799,658 ±41,510 |
Embed
Time spent getting to work
Source: ACS 2025 1-year, table B09001.
Show data
| Connecticut | United States | |
|---|---|---|
| Under 10 minutes | 11.0% ±0.5% , number 178,894 ±9,145 | 12.0% ±0.1% , number 17,199,225 ±93,440 |
| 10 to 19 minutes | 29.2% ±0.8% , number 475,673 ±14,360 | 27.8% ±0.1% , number 40,059,540 ±137,700 |
| 20 to 29 minutes | 21.7% ±0.8% , number 353,645 ±14,050 | 21.0% ±0.1% , number 30,221,743 ±111,100 |
| 30 to 39 minutes | 16.1% ±0.6% , number 261,694 ±10,580 | 17.1% ±0.1% , number 24,659,138 ±103,800 |
| 40 to 59 minutes | 12.1% ±0.5% , number 197,619 ±8,402 | 12.6% ±0.1% , number 18,104,709 ±97,070 |
| 60 minutes or more | 9.8% ±0.5% , number 159,498 ±8,641 | 9.5% ±0.1% , number 13,681,705 ±84,440 |
Embed
Vehicles per household
Source: ACS 2025 1-year, table A10030.
Show data
| Connecticut | United States | |
|---|---|---|
| None | 9.2% ±0.5% , number 134,694 ±7,349 | 8.8% ±0.1% , number 11,781,997 ±77,240 |
| One | 33.2% ±0.8% , number 484,153 ±12,580 | 33.1% ±0.1% , number 44,424,682 ±160,700 |
| Two | 36.6% ±0.8% , number 533,850 ±11,420 | 36.0% ±0.1% , number 48,200,889 ±176,800 |
| Three or more | 20.9% ±0.7% , number 304,218 ±10,590 | 22.1% ±0.1% , number 29,655,854 ±113,300 |
Embed
All the numbers
| Indicator | Connecticut | US | Rank among states* | Table |
|---|---|---|---|---|
| Drive to work alone | 71.3% ±0.7% , number 1,324,455 ±18,120 | 69.8% ±0.1% , number 115,297,377 ±192,900 | 34th | A09005 |
| Take public transit | 5.0% ±0.4% , number 92,807 ±6,839 | 4.3% ±<0.1% , number 7,100,386 ±63,330 | 9th | A09005 |
| Work from home | 12.4% ±0.5% , number 230,008 ±9,113 | 12.9% ±0.1% , number 21,288,393 ±105,700 | 16th | A09005 |
| Commute 30 minutes or more | 38.0% ±0.9% , number 618,811 ±16,040 | 39.2% ±0.1% , number 56,445,552 ±165,300 | 21st | B09001 |
| Households with no vehicle | 9.2% ±0.5% , number 134,694 ±7,868 | 8.8% ±<0.1% , number 11,781,997 ±64,240 | 10th | A10030 |
*1 is the highest. Population is ranked among all states, and the rest among those of 1,000 people or more, whose figures can be ranked. Ranks use 5-year estimates, the only ones covering every state, so they can differ slightly from the figures here.
Places
The largest cities in Connecticut
Population, from the latest estimates available. Figures cover the whole of each place.
Largest cities
- Bridgeport: 152,278
- Stamford: 139,529
- New Haven: 138,770
- Hartford: 122,011
- Waterbury: 115,764
- Norwalk: 94,506
- Danbury: 89,037
- New Britain: 76,282
States like this one
- Virginia: 8,705,170
- Washington: 7,816,116
- Massachusetts: 7,044,056
- Maryland: 6,206,011
States at least a third this size, with the closest income, education, age, housing and origins.
Every planning region and place in Connecticut
Find any county, city, town, metro area, ZIP code, school district or district in Connecticut.
Planning regions
Each of the 9 planning regions with its population, from ACS 2020–2024 5-year estimates. The Census Bureau now reports Connecticut by planning region rather than its eight former counties.
- Capitol Planning Region977,290
- Greater Bridgeport Planning Region329,259
- Lower Connecticut River Valley Planning Region175,822
- Naugatuck Valley Planning Region454,969
- Northeastern Connecticut Planning Region96,312
- Northwest Hills Planning Region113,216
- South Central Connecticut Planning Region570,598
- Southeastern Connecticut Planning Region279,971
- Western Connecticut Planning Region627,071
Cities, towns and other places
Each of the 214 with its population, from ACS 2020–2024 5-year estimates. Census-designated places are communities without a local government of their own, drawn by the Census Bureau so they can be counted.
- Ansonia19,033
- Ball Pond2,627
- Baltic1,157
- Bantam810
- Bethel11,404
- Bethlehem Village2,195
- Bigelow Corners884
- Blue Hills1,676
- Bogus Hill80
- Botsford635
- Branchville88
- Branford Center6,305
- Bridgeport149,153
- Bridgewater130
- Bristol61,462
- Broad Brook3,609
- Brookfield Center248
- Brooklyn986
- Byram4,633
- Canaan961
- Candlewood Isle633
- Candlewood Knolls224
- Candlewood Lake Club255
- Candlewood Orchards900
- Candlewood Shores525
- Cannondale758
- Canton Valley1,186
- Cheshire Village6,172
- Chester Center2,026
- Chimney Point117
- Clinton3,465
- Colchester4,692
- Coleytown3,472
- Collinsville3,963
- Compo3,410
- Conning Towers-Nautilus Park8,460
- Cornwall84
- Cornwall Bridge248
- Cos Cob7,546
- Coventry Lake2,647
- Crystal Lake2,024
- Danbury87,263
- Daniels Farm5,976
- Danielson4,209
- Darien Downtown1,242
- Dayville452
- Deep River Center2,407
- Derby12,487
- Dodgingtown285
- Durham3,347
- East Brooklyn2,377
- East Hampton3,347
- East Hartford50,918
- East Haven27,806
- East Village3,998
- Essex Village2,705
- Fairfield University2,939
- Falls Village410
- Fenwick49
- Gales Ferry1,141
- Gaylordsville740
- Georgetown1,932
- Glastonbury Center7,266
- Glenville2,656
- Greens Farms3,229
- Greenwich14,792
- Groton9,490
- Groton Long Point546
- Guilford Center2,263
- Hartford121,127
- Hawleyville164
- Hazardville6,022
- Heritage Village4,968
- Higganum1,742
- Indian Field716
- Inglenook1,056
- Jewett City3,429
- Kellogg Point22
- Kensington9,962
- Knollcrest266
- Lake Bungee543
- Lake Chaffee235
- Lake Pocotopaug4,875
- Lakes East1,227
- Lakes West1,395
- Lakeside Woods363
- Lakeville510
- Litchfield1,251
- Long Hill (Greater Bridgeport County)8,681
- Long Hill (Southeastern Connecticut County)4,399
- Lordship3,669
- Madison Center1,981
- Mamanasco Lake499
- Manchester36,759
- Mansfield Center785
- Mashantucket86
- Mechanicsville721
- Meriden60,545
- Middletown47,958
- Milford51,023
- Mill Plain2,033
- Moodus2,042
- Moosup2,885
- Murray503
- Mystic4,483
- Naugatuck31,800
- New Britain74,223
- New Canaan6,896
- New Hartford Center1,373
- New Haven134,349
- New London27,625
- New Milford8,188
- New Preston1,146
- Newington30,896
- Newtown1,898
- Niantic3,123
- Noank1,859
- Norfolk523
- Noroton5,539
- Noroton Heights2,782
- North Granby1,451
- North Grosvenor Dale1,212
- North Haven24,336
- Northford6,186
- Northwest Harwinton3,088
- Norwalk92,187
- Norwich39,973
- Oakville9,276
- Old Greenwich6,936
- Old Hill2,990
- Old Mystic3,340
- Old Saybrook Center1,659
- Orange14,315
- Oronoque4,116
- Oxoboxo River2,782
- Pawcatuck5,577
- Pemberwick3,665
- Plainfield Village2,316
- Plantsville2,220
- Plattsville910
- Pleasant Valley219
- Poplar Plains1,141
- Poquonock Bridge1,105
- Portland5,944
- Putnam7,120
- Quasset Lake361
- Quinebaug1,193
- Quinnipiac University4,311
- Redding Center262
- Ridgebury2,060
- Ridgefield6,970
- Riverside8,954
- Riverton318
- Rock Ridge482
- Rockville7,072
- Route 7 Gateway1,108
- Sacred Heart University1,436
- Sail Harbor120
- Salmon Brook2,343
- Sandy Hook9,863
- Saugatuck2,925
- Saybrook Manor1,358
- Sharon631
- Shelton41,889
- Sherwood Manor5,706
- Simsbury Center6,198
- Somers2,056
- South Coventry1,434
- South Wilton1,444
- South Windham1,281
- South Woodstock1,340
- Southport1,568
- Southwood Acres8,115
- Stafford Springs4,649
- Stamford137,144
- Staples7,340
- Stepney3,979
- Stonington934
- Storrs15,207
- Stratford Downtown1,662
- Suffield Depot2,006
- Tariffville1,419
- Tashua3,771
- Taylor Corners481
- Terramuggus968
- Terryville5,461
- Thomaston1,988
- Thompsonville7,927
- Tokeneke2,951
- Topstone122
- Torrington35,547
- Trumbull Center10,264
- Wallingford Center18,208
- Waterbury114,869
- Waterford3,304
- Watertown3,897
- Wauregan1,049
- Weatogue2,672
- West Cornwall70
- West Hartford63,620
- West Haven55,351
- West Mountain387
- West Simsbury3,000
- Westbrook Center2,501
- Weston966
- Westport Village3,021
- Wethersfield27,250
- Willimantic18,096
- Wilton Center1,682
- Windsor Locks12,579
- Winsted6,977
- Witches Woods382
- Woodbury Center1,606
- Woodmont1,661
Metro and micro areas
Each of the 7 that reach into Connecticut, with its whole population, from ACS 2020–2024 5-year estimates. Metro and micro areas are counties tied together by commuting, drawn by the Office of Management and Budget.
ZIP codes
Each of the 286 with people in it, by the town it's centered in, from ACS 2020–2024 5-year estimates. These are the Census Bureau's ZIP Code Tabulation Areas, which follow the Postal Service's ZIP codes as closely as census blocks allow.
- 06001Canton Valley19,153
- 06002Blue Hills21,865
- 06010Bristol61,684
- 06013Bristol9,680
- 06016Broad Brook6,959
- 06018Canaan2,587
- 06019Canton Valley9,742
- 06021Riverton1,494
- 06022New Hartford Center100
- 06023Kensington1,196
- 06024Canaan634
- 06026Tariffville5,196
- 06027North Granby1,193
- 06029Rockville16,238
- 06031Falls Village1,520
- 06032New Britain19,135
- 06033Glastonbury Center29,921
- 06035Salmon Brook7,817
- 06037Kensington19,173
- 06039Lakeville1,918
- 06040Manchester35,813
- 06042Manchester23,822
- 06043Manchester4,853
- 06051New Britain29,548
- 06052New Britain7,916
- 06053New Britain36,774
- 06057New Hartford Center6,363
- 06058Norfolk1,793
- 06059West Simsbury302
- 06060North Granby2,273
- 06061New Hartford Center312
- 06062New Britain17,555
- 06063Pleasant Valley3,328
- 06065Riverton712
- 06066Rockville30,577
- 06067Wethersfield20,872
- 06068Lakeville2,034
- 06069Sharon2,601
- 06070Simsbury Center15,254
- 06071Somers10,723
- 06073Glastonbury Center5,372
- 06074Manchester26,907
- 06076Stafford Springs11,953
- 06078Suffield Depot10,562
- 06079Canaan19
- 06080Windsor Locks1,616
- 06081Tariffville1,419
- 06082Hazardville41,090
- 06084Crystal Lake14,823
- 06085Collinsville7,608
- 06088Broad Brook4,254
- 06089Weatogue3,728
- 06090Salmon Brook1,136
- 06091Riverton253
- 06092West Simsbury4,665
- 06093Suffield Depot3,524
- 06095Windsor Locks29,670
- 06096Windsor Locks12,579
- 06098Winsted10,263
- 06103Hartford2,949
- 06105Hartford19,174
- 06106Hartford36,322
- 06107West Hartford19,891
- 06108East Hartford23,499
- 06109Wethersfield27,250
- 06110West Hartford12,641
- 06111Newington30,896
- 06112Hartford22,333
- 06114Hartford26,458
- 06117West Hartford16,116
- 06118East Hartford27,419
- 06119West Hartford14,793
- 06120Hartford13,926
- 06226Willimantic19,344
- 06231Colchester3,648
- 06232Coventry Lake3,152
- 06234Brooklyn8,517
- 06235Mansfield Center2,018
- 06237South Coventry5,300
- 06238Coventry Lake12,326
- 06239Danielson11,185
- 06241Dayville6,585
- 06242Witches Woods1,290
- 06243Dayville83
- 06247Mansfield Center2,412
- 06248Terramuggus5,509
- 06249South Windham7,116
- 06250Mansfield Center5,437
- 06254Baltic2,004
- 06255North Grosvenor Dale4,494
- 06256Mansfield Center1,704
- 06258Quasset Lake114
- 06259Quasset Lake4,568
- 06260Putnam9,266
- 06262Quinebaug813
- 06263Dayville498
- 06264South Windham139
- 06266South Windham222
- 06268Storrs11,772
- 06269Storrs7,970
- 06277Mechanicsville4,004
- 06278Lake Chaffee4,337
- 06279Lake Chaffee5,575
- 06280South Windham3,110
- 06281Lake Bungee7,237
- 06282Witches Woods1,134
- 06320New London27,703
- 06330Baltic3,327
- 06331Plainfield Village5,145
- 06332Moosup1,015
- 06333Niantic7,389
- 06334Norwich2,249
- 06335Gales Ferry6,307
- 06336Norwich44
- 06338Mashantucket27
- 06339Mashantucket9,113
- 06340Long Hill29,863
- 06350Baltic121
- 06351Jewett City15,760
- 06353Oxoboxo River439
- 06354Moosup6,031
- 06355Mystic12,173
- 06357Niantic11,332
- 06359Mashantucket5,160
- 06360Norwich37,216
- 06365Mashantucket4,807
- 06370Oxoboxo River7,327
- 06371Essex Village9,828
- 06373Moosup219
- 06374Plainfield Village7,838
- 06375Gales Ferry3,670
- 06376Niantic89
- 06377Moosup2,927
- 06378Pawcatuck5,555
- 06379Pawcatuck9,017
- 06380Norwich2,757
- 06382Oxoboxo River10,143
- 06384Jewett City2,663
- 06385Waterford15,966
- 06387Wauregan178
- 06390Groton Long Point72
- 06401Ansonia19,315
- 06403Naugatuck6,147
- 06405Branford Center28,217
- 06409Deep River Center701
- 06410Cheshire Village28,904
- 06412Chester Center3,825
- 06413Clinton13,377
- 06414Lake Pocotopaug302
- 06415Colchester16,038
- 06416Portland14,334
- 06417Deep River Center4,458
- 06418Derby12,205
- 06419Chester Center6,240
- 06420Colchester4,368
- 06422Durham7,208
- 06423Moodus5,182
- 06424East Hampton12,751
- 06426Essex Village3,267
- 06437Guilford Center22,067
- 06438Higganum2,887
- 06439Chester Center65
- 06441Higganum5,348
- 06442Essex Village2,826
- 06443Madison Center17,657
- 06444Plantsville180
- 06447Terramuggus6,130
- 06450Meriden35,694
- 06451Meriden24,851
- 06455Durham2,480
- 06456Higganum281
- 06457Middletown46,720
- 06459Middletown1,238
- 06460Milford37,649
- 06461Milford15,035
- 06467Plantsville405
- 06468East Village18,949
- 06469Moodus3,311
- 06470Newtown15,593
- 06471Northford7,140
- 06472Northford6,363
- 06473North Haven24,743
- 06475Saybrook Manor10,575
- 06477Orange14,315
- 06478Heritage Village12,991
- 06479Plantsville10,286
- 06480Portland9,434
- 06481Middletown1,763
- 06482Sandy Hook12,000
- 06483Ansonia16,889
- 06484Shelton41,889
- 06488Heritage Village20,071
- 06489Plantsville32,706
- 06492Wallingford Center44,498
- 06498Westbrook Center6,856
- 06510New Haven4,584
- 06511New Haven54,730
- 06512East Haven28,830
- 06513New Haven38,888
- 06514Quinnipiac University26,803
- 06515New Haven19,006
- 06516West Haven55,351
- 06517New Haven14,221
- 06518Quinnipiac University20,126
- 06519New Haven15,605
- 06524Quinnipiac University5,288
- 06525Ansonia9,073
- 06604Bridgeport31,771
- 06605Bridgeport25,929
- 06606Bridgeport49,308
- 06607Bridgeport7,979
- 06608Bridgeport12,146
- 06610Bridgeport22,020
- 06611Daniels Farm37,281
- 06612Tashua7,670
- 06614Stratford Downtown35,654
- 06615Lordship17,136
- 06702Waterbury2,946
- 06704Waterbury31,713
- 06705Waterbury25,266
- 06706Waterbury15,551
- 06708Waterbury29,594
- 06710Waterbury9,942
- 06712Naugatuck9,458
- 06716Plantsville16,113
- 06750Bantam1,387
- 06751Bethlehem Village3,423
- 06752Bridgewater1,658
- 06753Cornwall91
- 06754Cornwall Bridge1,656
- 06755Gaylordsville1,238
- 06756Cornwall3,037
- 06757Cornwall Bridge2,125
- 06758Bethlehem Village13
- 06759Litchfield5,442
- 06762Woodbury Center7,807
- 06763Bantam2,151
- 06770Naugatuck31,823
- 06776New Milford27,010
- 06777New Preston1,771
- 06778Thomaston1,574
- 06779Oakville8,364
- 06782Terryville1,978
- 06783Bridgewater2,185
- 06784Lakeside Woods3,583
- 06785Gaylordsville818
- 06786Terryville9,768
- 06787Thomaston7,509
- 06790Torrington35,566
- 06791Northwest Harwinton5,602
- 06793Bethlehem Village1,031
- 06794New Preston1,282
- 06795Watertown13,889
- 06796West Cornwall821
- 06798Woodbury Center9,833
- 06801Bethel20,796
- 06804Brookfield Center17,908
- 06807Cos Cob7,650
- 06810Danbury55,833
- 06811Danbury31,228
- 06812Candlewood Knolls13,584
- 06820Darien Downtown21,936
- 06824Mill Plain36,716
- 06825Sacred Heart University21,982
- 06830Greenwich24,880
- 06831Glenville15,210
- 06840New Canaan20,870
- 06850Norwalk19,692
- 06851Norwalk27,865
- 06853Norwalk3,171
- 06854Norwalk32,118
- 06855Norwalk9,351
- 06870Old Greenwich7,864
- 06877Lakes East25,110
- 06878Riverside8,328
- 06880Staples27,583
- 06883Weston10,396
- 06890Southport4,653
- 06896Redding Center8,779
- 06897Cannondale18,777
- 06901Stamford11,037
- 06902Stamford73,392
- 06903Stamford14,010
- 06905Stamford20,725
- 06906Stamford9,199
- 06907Stamford8,705
Towns and townships
Each of the 169 with people in it, from ACS 2020–2024 5-year estimates: the county subdivisions that are governments of their own. A city, borough or village that is one too is listed with the places above.
- Andover town3,152
- Ansonia town19,033
- Ashford town4,226
- Avon town18,946
- Barkhamsted town3,678
- Beacon Falls town6,147
- Berlin town20,361
- Bethany town5,288
- Bethel town20,796
- Bethlehem town3,423
- Bloomfield town21,754
- Bolton town4,853
- Bozrah town2,293
- Branford town28,217
- Bridgeport town149,153
- Bridgewater town1,658
- Bristol town61,462
- Brookfield town17,706
- Brooklyn town8,517
- Burlington town9,680
- Canaan town1,175
- Canterbury town5,124
- Canton town10,144
- Chaplin town2,070
- Cheshire town29,040
- Chester town3,825
- Clinton town13,377
- Colchester town15,648
- Colebrook town1,494
- Columbia town5,300
- Cornwall town1,425
- Coventry town12,326
- Cromwell town14,334
- Danbury town87,263
- Darien town21,936
- Deep River town4,458
- Derby town12,487
- Durham town7,208
- East Granby town5,238
- East Haddam town8,969
- East Hampton town12,925
- East Hartford town50,918
- East Haven town27,806
- East Lyme town18,721
- East Windsor town11,213
- Eastford town1,679
- Easton town7,670
- Ellington town16,455
- Enfield town41,090
- Essex town6,794
- Fairfield town63,416
- Farmington town27,134
- Franklin town2,004
- Glastonbury town35,293
- Goshen town3,196
- Granby town11,184
- Greenwich town63,856
- Griswold town11,530
- Groton town38,130
- Guilford town22,108
- Haddam town8,644
- Hamden town61,045
- Hampton town1,647
- Hartford town121,127
- Hartland town1,840
- Harwinton town5,575
- Hebron town9,157
- Kent town3,056
- Killingly town17,867
- Killingworth town6,240
- Lebanon town7,116
- Ledyard town15,433
- Lisbon town4,211
- Litchfield town8,260
- Lyme town2,303
- Madison town17,616
- Manchester town59,635
- Mansfield town25,358
- Marlborough town6,130
- Meriden town60,545
- Middlebury town7,807
- Middlefield town4,243
- Middletown town47,958
- Milford town52,684
- Monroe town18,949
- Montville town17,950
- Morris town2,164
- Naugatuck town31,800
- New Britain town74,223
- New Canaan town20,870
- New Fairfield town13,584
- New Hartford town6,675
- New Haven town134,349
- New London town27,625
- New Milford town28,334
- Newington town30,896
- Newtown town27,593
- Norfolk town1,723
- North Branford town13,503
- North Canaan town3,221
- North Haven town24,336
- North Stonington town5,160
- Norwalk town92,187
- Norwich town39,973
- Old Lyme town7,679
- Old Saybrook town10,575
- Orange town14,315
- Oxford town12,991
- Plainfield town15,141
- Plainville town17,551
- Plymouth town11,746
- Pomfret town4,317
- Portland town9,434
- Preston town4,821
- Prospect town9,458
- Putnam town9,292
- Redding town8,780
- Ridgefield town25,109
- Rocky Hill town20,880
- Roxbury town2,185
- Salem town4,282
- Salisbury town4,224
- Scotland town1,599
- Seymour town16,889
- Sharon town2,723
- Shelton town41,889
- Sherman town3,554
- Simsbury town25,066
- Somers town10,308
- South Windsor town26,907
- Southbury town20,071
- Southington town43,803
- Sprague town2,962
- Stafford town11,511
- Stamford town137,144
- Sterling town3,629
- Stonington town18,478
- Stratford town52,790
- Suffield town15,702
- Thomaston town7,492
- Thompson town9,337
- Tolland town14,606
- Torrington town35,547
- Trumbull town37,281
- Union town944
- Vernon town30,577
- Voluntown town2,604
- Wallingford town44,362
- Warren town1,415
- Washington town3,676
- Waterbury town114,869
- Waterford town19,673
- Watertown town22,253
- West Hartford town63,620
- West Haven town55,351
- Westbrook town6,856
- Weston town10,396
- Westport town27,528
- Wethersfield town27,250
- Willington town5,575
- Wilton town18,777
- Winchester town10,284
- Windham town23,961
- Windsor Locks town12,579
- Windsor town29,468
- Wolcott town16,279
- Woodbridge town9,073
- Woodbury town9,833
- Woodstock town8,319
Consolidated cities
A city and county governed as one, with the towns inside it that keep governments of their own.
- Milford city52,684
School districts
Each of the 166 with people in it, from ACS 2020–2024 5-year estimates. Elementary districts teach the lower grades and secondary districts the upper ones, under them; the rest are unified, teaching every grade.
- Andover School Districtelementary3,152
- Ansonia School District19,033
- Ashford School Districtelementary4,226
- Avon School District18,946
- Barkhamsted School Districtelementary3,678
- Berlin School District20,361
- Bethany School Districtelementary5,288
- Bethel School District20,796
- Bloomfield School District21,754
- Bolton School District4,853
- Bozrah School Districtelementary2,293
- Branford School District28,217
- Bridgeport School District149,153
- Bristol School District61,462
- Brookfield School District17,706
- Brooklyn School Districtelementary8,517
- Canaan School Districtelementary1,175
- Canterbury School Districtelementary5,124
- Canton School District10,144
- Chaplin School Districtelementary2,070
- Cheshire School District29,040
- Chester School Districtelementary3,825
- Clinton School District13,377
- Colchester School District15,648
- Colebrook School Districtelementary1,494
- Columbia School Districtelementary5,300
- Cornwall School Districtelementary1,425
- Coventry School District12,326
- Cromwell School District14,334
- Danbury School District87,263
- Darien School District21,936
- Deep River School Districtelementary4,458
- Derby School District12,487
- East Granby School District5,238
- East Haddam School District8,969
- East Hampton School District12,925
- East Hartford School District50,918
- East Haven School District27,806
- East Lyme School District18,721
- East Windsor School District11,213
- Eastford School Districtelementary1,679
- Easton School Districtelementary7,670
- Ellington School District16,455
- Enfield School District41,090
- Essex School Districtelementary6,794
- Fairfield School District63,416
- Farmington School District27,134
- Franklin School Districtelementary2,004
- Glastonbury School District35,293
- Granby School District11,184
- Greenwich School District63,856
- Griswold School District11,530
- Groton School District38,130
- Guilford School District22,108
- Hamden School District61,045
- Hampton School Districtelementary1,647
- Hartford School District121,127
- Hartland School Districtelementary1,840
- Hebron School Districtelementary9,157
- Kent School Districtelementary3,056
- Killingly School District17,867
- Lebanon School District7,116
- Ledyard School District15,433
- Lisbon School Districtelementary4,211
- Litchfield School District8,260
- Madison School District17,616
- Manchester School District59,635
- Mansfield School Districtelementary25,358
- Marlborough School Districtelementary6,130
- Meriden School District60,545
- Middletown School District47,958
- Milford School District52,684
- Monroe School District18,949
- Montville School District17,950
- Naugatuck School District31,800
- New Britain School District74,223
- New Canaan School District20,870
- New Fairfield School District13,584
- New Hartford School Districtelementary6,675
- New Haven School District134,349
- New London School District27,625
- New Milford School District28,334
- Newington School District30,896
- Newtown School District27,593
- Norfolk School Districtelementary1,723
- North Branford School District13,503
- North Canaan School Districtelementary3,221
- North Haven School District24,336
- North Stonington School District5,160
- Norwalk School District92,187
- Norwich School District39,973
- Old Saybrook School District10,575
- Orange School Districtelementary14,315
- Oxford School District12,991
- Plainfield School District15,141
- Plainville School District17,551
- Plymouth School District11,746
- Pomfret School Districtelementary4,317
- Portland School District9,434
- Preston School Districtelementary4,821
- Putnam School District9,292
- Redding School Districtelementary8,780
- Regional High School District 01secondary15,824
- Regional High School District 04secondary15,077
- Regional High School District 05secondary28,676
- Regional High School District 07secondary13,570
- Regional High School District 08secondary18,439
- Regional High School District 09secondary16,450
- Regional High School District 11secondary5,316
- Regional High School District 19secondary35,159
- Regional School District 066,775
- Regional School District 1015,255
- Regional School District 127,519
- Regional School District 1311,451
- Regional School District 1413,256
- Regional School District 1527,878
- Regional School District 1615,605
- Regional School District 1714,884
- Regional School District 189,982
- Ridgefield School District25,109
- Rocky Hill School District20,880
- Salem School Districtelementary4,282
- Salisbury School Districtelementary4,224
- Scotland School Districtelementary1,599
- Seymour School District16,889
- Sharon School Districtelementary2,723
- Shelton School District41,889
- Sherman School Districtelementary3,554
- Simsbury School District25,066
- Somers School District10,308
- South Windsor School District26,907
- Southington School District43,803
- Sprague School Districtelementary2,962
- Stafford School District11,511
- Stamford School District137,144
- Sterling School Districtelementary3,629
- Stonington School District18,478
- Stratford School District52,790
- Suffield School District15,702
- Thomaston School District7,492
- Thompson School District9,337
- Tolland School District14,606
- Torrington School District35,547
- Trumbull School District37,281
- Union School Districtelementary944
- Vernon School District30,577
- Voluntown School Districtelementary2,604
- Wallingford School District44,362
- Waterbury School District114,869
- Waterford School District19,673
- Watertown School District22,253
- West Hartford School District63,620
- West Haven School District55,351
- Westbrook School District6,856
- Weston School District10,396
- Westport School District27,528
- Wethersfield School District27,250
- Willington School Districtelementary5,575
- Wilton School District18,777
- Winchester School District10,284
- Windham School District23,961
- Windsor Locks School District12,579
- Windsor School District29,468
- Wolcott School District16,279
- Woodbridge School Districtelementary9,073
- Woodstock School Districtelementary8,319
Congressional districts
As drawn for the 119th Congress (2025–2027).
- Congressional District 1721,392
- Congressional District 2722,183
- Congressional District 3724,297
- Congressional District 4728,656
- Congressional District 5727,980
State senate districts
The upper chamber’s districts, as drawn in 2024.
- State Senate District 193,795
- State Senate District 296,832
- State Senate District 3100,456
- State Senate District 4102,933
- State Senate District 599,500
- State Senate District 697,797
- State Senate District 7100,153
- State Senate District 898,790
- State Senate District 9101,870
- State Senate District 1098,139
- State Senate District 1195,654
- State Senate District 1296,947
- State Senate District 1397,886
- State Senate District 1494,956
- State Senate District 15104,447
- State Senate District 16102,293
- State Senate District 17101,298
- State Senate District 1899,493
- State Senate District 1998,504
- State Senate District 2095,968
- State Senate District 21106,954
- State Senate District 22104,558
- State Senate District 2394,522
- State Senate District 24104,391
- State Senate District 25102,757
- State Senate District 26101,992
- State Senate District 27108,587
- State Senate District 28107,350
- State Senate District 29103,943
- State Senate District 30106,451
- State Senate District 31100,475
- State Senate District 32105,841
- State Senate District 3399,845
- State Senate District 3497,222
- State Senate District 3598,359
- State Senate District 36103,550
State house districts
The lower chamber’s districts, as drawn in 2024.
- State House District 121,469
- State House District 224,170
- State House District 322,586
- State House District 423,195
- State House District 524,797
- State House District 623,331
- State House District 723,832
- State House District 823,662
- State House District 924,474
- State House District 1022,706
- State House District 1124,721
- State House District 1222,981
- State House District 1322,620
- State House District 1423,677
- State House District 1523,173
- State House District 1625,066
- State House District 1724,475
- State House District 1824,750
- State House District 1924,694
- State House District 2024,168
- State House District 2125,184
- State House District 2223,281
- State House District 2323,649
- State House District 2424,424
- State House District 2523,101
- State House District 2623,693
- State House District 2724,861
- State House District 2823,945
- State House District 2924,185
- State House District 3022,365
- State House District 3124,737
- State House District 3223,768
- State House District 3324,637
- State House District 3423,157
- State House District 3523,381
- State House District 3623,721
- State House District 3725,631
- State House District 3825,141
- State House District 3924,114
- State House District 4024,405
- State House District 4124,063
- State House District 4223,409
- State House District 4324,832
- State House District 4425,981
- State House District 4524,562
- State House District 4623,775
- State House District 4725,075
- State House District 4824,713
- State House District 4923,961
- State House District 5025,819
- State House District 5124,127
- State House District 5226,118
- State House District 5323,563
- State House District 5422,828
- State House District 5524,514
- State House District 5623,637
- State House District 5723,407
- State House District 5822,630
- State House District 5924,976
- State House District 6024,608
- State House District 6125,770
- State House District 6223,377
- State House District 6323,346
- State House District 6424,419
- State House District 6523,979
- State House District 6623,547
- State House District 6723,888
- State House District 6824,027
- State House District 6923,875
- State House District 7024,020
- State House District 7123,155
- State House District 7226,522
- State House District 7324,296
- State House District 7422,663
- State House District 7522,520
- State House District 7624,295
- State House District 7724,325
- State House District 7824,638
- State House District 7924,245
- State House District 8023,253
- State House District 8124,122
- State House District 8223,323
- State House District 8325,204
- State House District 8422,674
- State House District 8522,909
- State House District 8623,315
- State House District 8724,336
- State House District 8825,163
- State House District 8923,816
- State House District 9023,268
- State House District 9121,336
- State House District 9223,909
- State House District 9323,918
- State House District 9423,328
- State House District 9523,508
- State House District 9624,767
- State House District 9724,240
- State House District 9823,607
- State House District 9923,429
- State House District 10023,321
- State House District 10122,609
- State House District 10223,498
- State House District 10323,840
- State House District 10424,360
- State House District 10523,428
- State House District 10625,838
- State House District 10724,676
- State House District 10825,464
- State House District 10924,030
- State House District 11024,924
- State House District 11123,506
- State House District 11224,558
- State House District 11326,334
- State House District 11423,467
- State House District 11523,166
- State House District 11622,191
- State House District 11724,316
- State House District 11822,964
- State House District 11923,883
- State House District 12024,614
- State House District 12122,765
- State House District 12223,881
- State House District 12324,407
- State House District 12422,189
- State House District 12523,400
- State House District 12622,771
- State House District 12726,547
- State House District 12821,504
- State House District 12927,439
- State House District 13023,189
- State House District 13122,834
- State House District 13225,535
- State House District 13324,798
- State House District 13425,899
- State House District 13523,894
- State House District 13623,963
- State House District 13725,469
- State House District 13823,816
- State House District 13924,704
- State House District 14024,167
- State House District 14123,889
- State House District 14223,353
- State House District 14322,795
- State House District 14423,038
- State House District 14527,269
- State House District 14626,303
- State House District 14722,544
- State House District 14822,956
- State House District 14923,414
- State House District 15023,721
- State House District 15124,211
PUMAs
Public Use Microdata Areas: areas of 100,000 people or more that the state draws from census tracts, for the Census Bureau’s microdata.
- Bridgeport Suburban PUMA180,106
- Bridgeport Town PUMA149,153
- Capitol East PUMA113,220
- Capitol West PUMA161,332
- Connecticut River North PUMA158,713
- East Hartford, Manchester & Vernon Towns PUMA141,130
- Glastonbury, Wethersfield, Rocky Hill & Newington Towns PUMA114,319
- Hartford Town PUMA121,127
- Inland Southeastern PUMA157,344
- Lower Connecticut River Valley PUMA175,822
- Naugatuck Valley North PUMA178,793
- Naugatuck Valley South PUMA161,307
- New Britain, Southington, Berlin & Plainville Towns PUMA155,938
- New Haven Town PUMA134,349
- Northeastern Planning Region & Stafford Town PUMA107,823
- Northwest Hills PUMA113,216
- Norwalk & Westport Towns PUMA119,715
- Shoreline Southeastern PUMA122,627
- South Central East PUMA133,630
- South Central North PUMA165,908
- South Central West PUMA136,711
- Stamford & Greenwich Towns PUMA201,000
- Waterbury Town PUMA114,869
- Western Central PUMA105,868
- Western North PUMA200,488
Urban areas
Each that reaches into Connecticut, with its whole population. Urban areas are the densely settled land the Census Bureau draws after each census, whatever the city lines.
- Bridgeport–Stamford, CT–NY924,041
- Colchester, CT5,592
- Danbury, CT–NY172,957
- Hartford, CT978,030
- Jewett City, CT4,849
- Lake Pocotopaug, CT8,064
- New Haven, CT560,329
- Norwich–New London, CT165,768
- Putnam–Killingly, CT35,921
- Ridgefield, CT25,355
- Springfield, MA–CT439,257
- Stafford Springs, CT5,068
- Storrs, CT16,724
- Torrington, CT35,596
- Waterbury, CT200,025
- Westerly, RI–CT31,732
- Willimantic, CT24,201
- Winsted, CT7,886
- Worcester, MA–CT485,823
Tribal areas
Each that reaches into Connecticut, with its whole population.
Turn Connecticut into your planning report.
Social Explorer Studio builds an editable profile of any place, with tables and charts beside the county and state, and exports to Word, PDF and Excel.
Questions about Connecticut
What is the population of Connecticut?
3,688,496 people, according to the ACS 2025 1-year estimates, which the Census Bureau adjusts to match its own population estimate. That’s the 29th largest of the 50 states and DC.
What is the FIPS code for Connecticut?
09. Every county’s and place’s FIPS code in Connecticut starts with it. The Census Bureau’s full geographic identifier (GEOID) is 0400000US09.
What is the largest city in Connecticut?
Bridgeport, with 152,278 people. Other large cities here include Stamford, New Haven and Hartford.
What is the median household income in Connecticut?
$100,056 (±$1,570), according to the ACS 2025 1-year estimates, higher than the US ($84,780).
What is the median age in Connecticut?
41.6 years (±0.3), according to the ACS 2025 1-year estimates, higher than the US (39.5).
How much does housing cost in Connecticut?
Connecticut’s median home value is $423,900 (±$4,096) and its median gross rent is $1,679 (±$26) a month, according to the ACS 2025 1-year estimates. 52.4% (±2.3%) of its renters pay 30% or more of their income on rent.
Is Connecticut growing?
Connecticut’s population grew 2.7%, from 3,590,886 in 2015 to 3,688,496 in 2025, according to the ACS 1-year estimates.
Where do people who work in Connecticut live?
1,511,879 of its 1,644,216 jobs are held by people who live here. Of those who commute in, the most come from New York, Massachusetts, Rhode Island.
Where does this census data come from?
The U.S. Census Bureau’s American Community Survey, through Social Explorer’s tables: the latest 1-year estimates where they exist, for the most recent numbers, and 5-year estimates otherwise. Each table lists its code, so you can find it again.
Is this data free to use?
Yes. You can read it, cite it, download the CSV and embed the charts, with no account. To map other variables, compare your own areas or build a report, see Social Explorer’s plans in a live demo.
Sources and how to cite
American Community Survey 2025 1-year estimates, or 2020–2024 5-year estimates where noted, U.S. Census Bureau, from Social Explorer’s tables A00001, A00002, A01004, A04001, A06001, A08001, A09005, A10001, A10003, A10008, A10030, A10036, A10040, A10047, A10055, A10060, A12001, A13004, A14006, A14024, A14028, A16002, A17005, A18002, A18009, A20001, B02002, B09001, B13002, B18101, C16001. Maps by census tract use 2020–2024 5-year estimates, since the 1-year survey doesn’t cover tracts. Commuting: LEHD LODES 2023. These are estimates from a sample, each with its margin of error. Data retrieved November 14, 2026. How these profiles are made.
U.S. Census Bureau, American Community Survey 2025 1-year estimates, or 2020–2024 5-year estimates where noted, via Social Explorer. “Connecticut.” https://www.socialexplorer.com/places/connecticut. Accessed November 14, 2026.