

From a question to an interactive population map people can explore
Social Explorer turns census and other public data into interactive population maps and slide-based stories your audience can explore, so they see the insight, not the spreadsheet. Anyone can open a story you share, with no account needed.
How do you build an interactive population map?
-
1
Map types
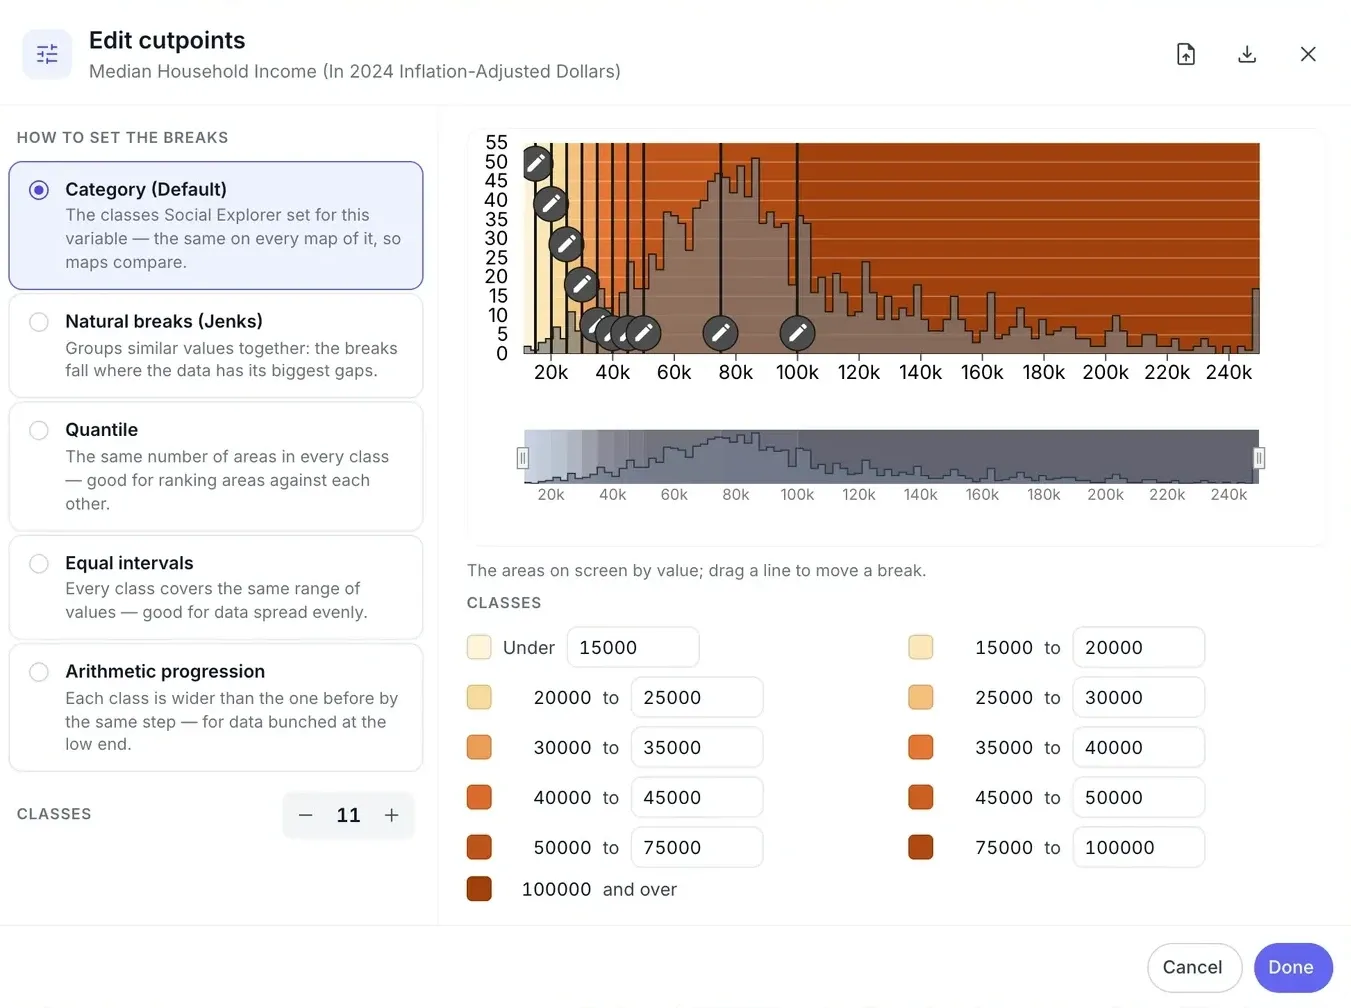
Shaded area, bubble or dot density maps, with your own color palettes and cutpoints.
-
2
Annotate map
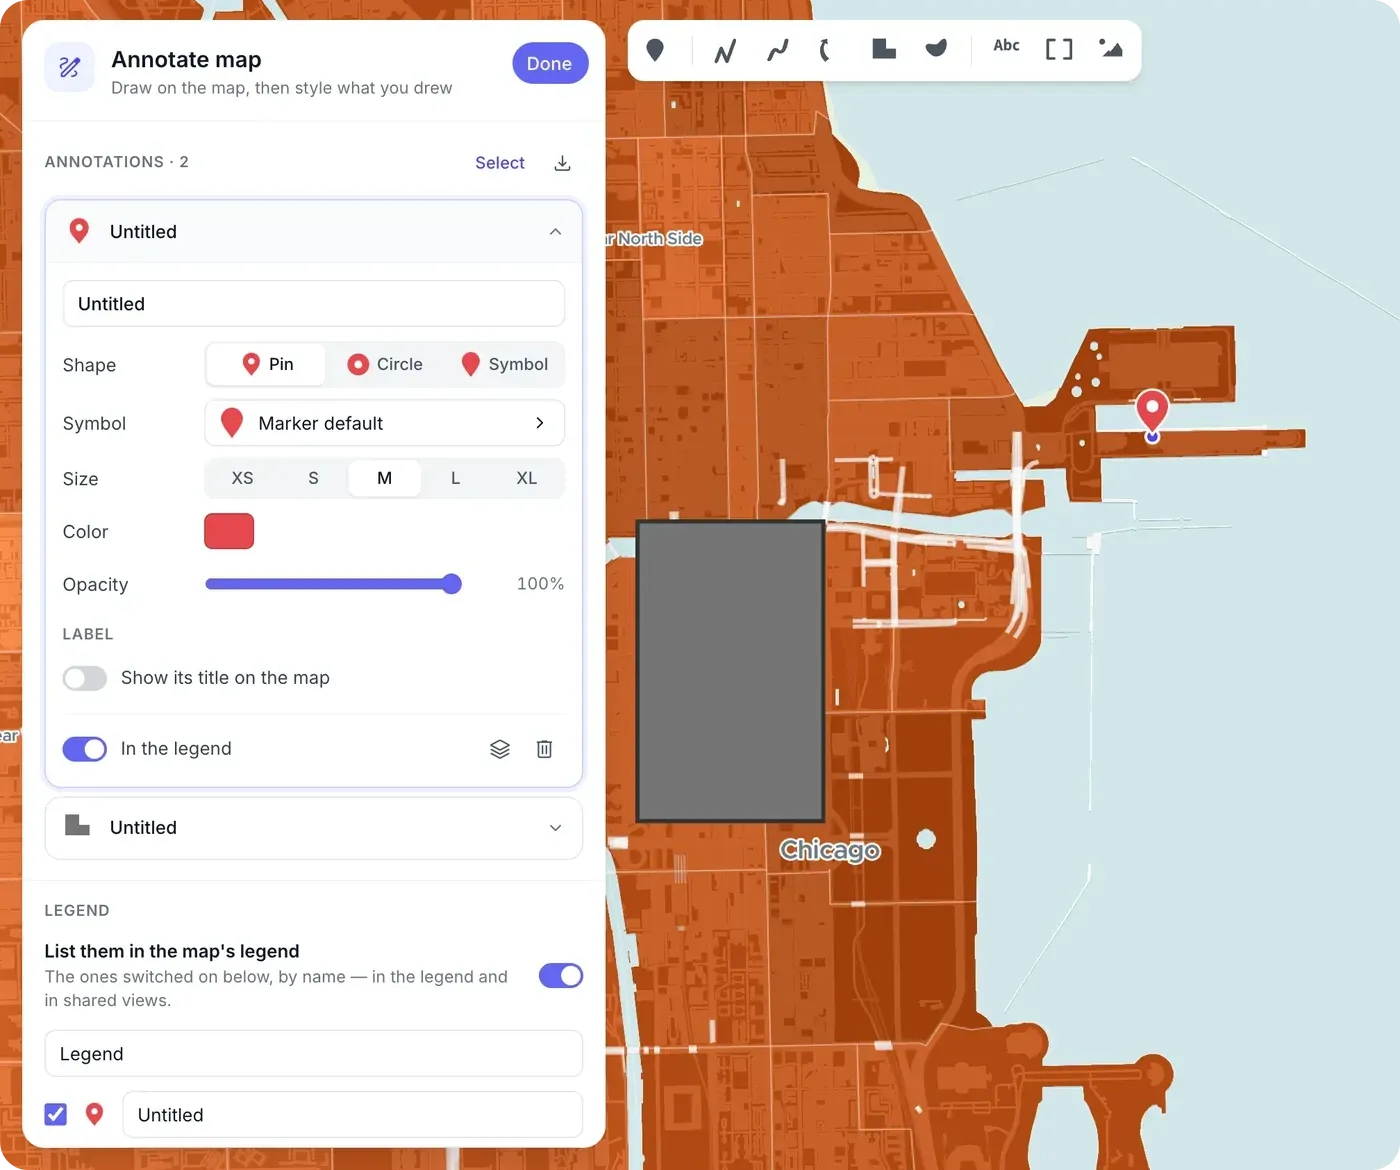
Nine annotation types, from markers, lines and arrows to labels, hotspots and images. Annotations appear in the legend and export as GeoJSON or KML.
-
3
Story editor
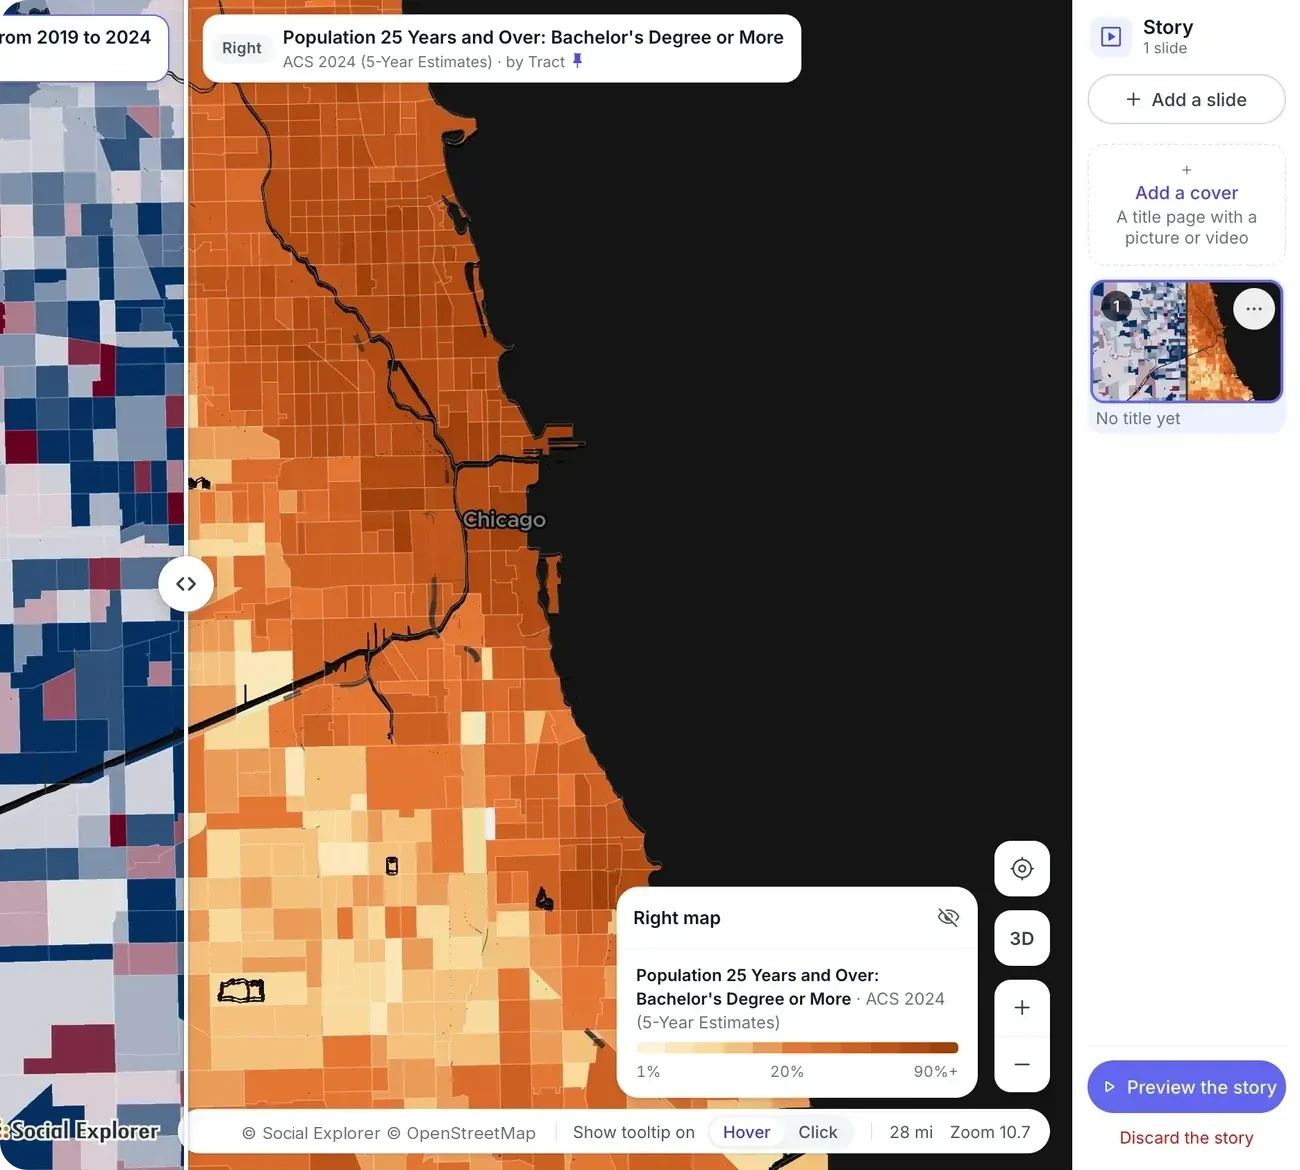
Build a story slide by slide, as you would a presentation. Each slide can hold a map, a side-by-side view or a swipe, with your text alongside. The cover slide can use a background image or a video link.
-
4
Share and embed
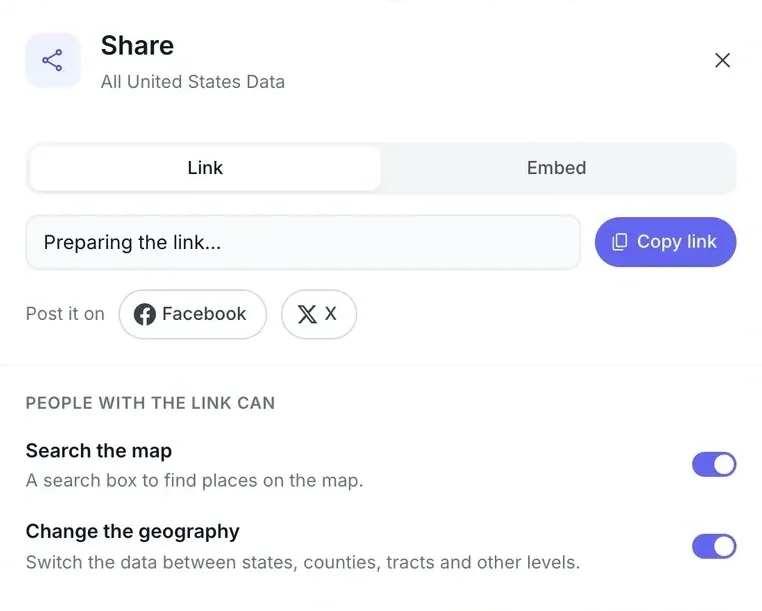
Story links open fully interactive for people without an account. Embedded maps and stories keep their layers and filters, on your site, Medium or other blogging platforms.
-
5
Export
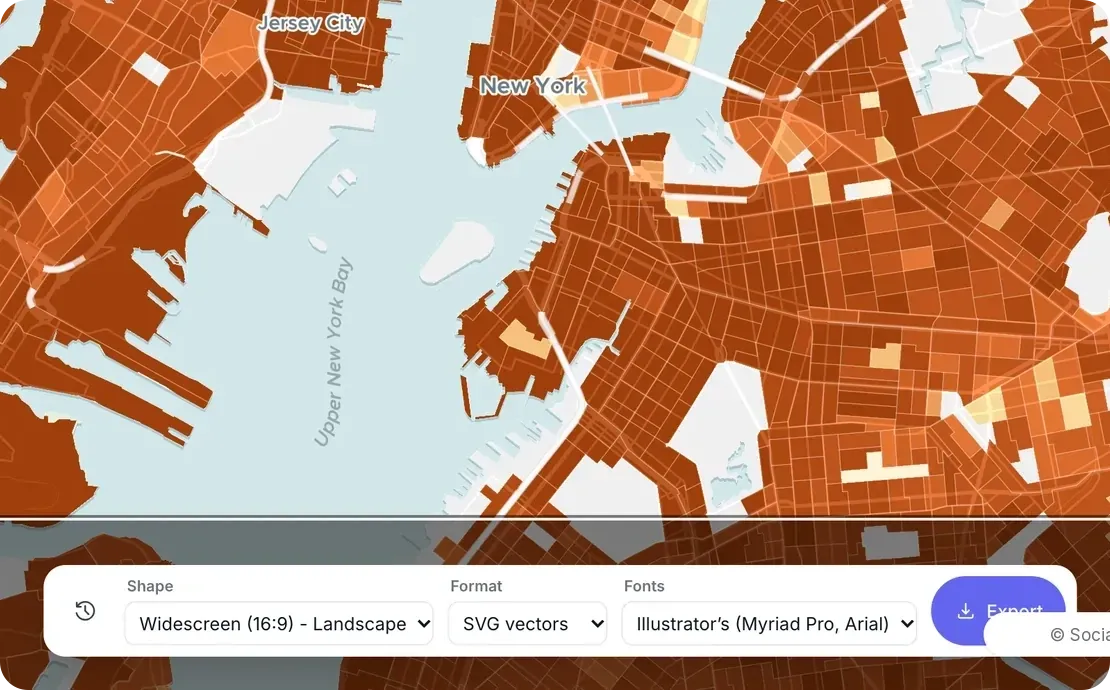
Export a story to PowerPoint for meetings. Export a map as a PNG at 96, 192 or 288 DPI, or as a ZIP with the map, legend and scale bar as separate files for print.
-
6
Collaborators
Invite people by email to co-edit and save a story with you.
The data behind it
Part of a library of 610,000+ variables, each one with its source.
- Decennial Census 1790 to 2020
- American Community Survey, 5-year estimates Down to census tract and block group
- County Health Rankings Health outcomes and factors by county
- FBI Uniform Crime Report Reported crime
- Religion census (RCMS) Congregations and adherents
- International data World Bank, Eurostat, and UK and Canadian census
-
Your own locations CSV uploads, geocoded from US addresses
Good to know
- Interactive means viewers can pan, zoom, explore and swipe. Maps and stories don’t animate, and there is no time slider or video export.
- Collaborators can co-edit stories. Maps and reports aren’t co-edited.
Tools for this work
Questions about interactive population maps
What is data storytelling?
Data storytelling explains what data means by pairing it with a narrative and visuals, so an audience understands the point, not just the numbers. In Social Explorer, a story is a set of slides, each with a live map, a side-by-side view or a swipe and your text, that anyone can open and explore.
How do I make an interactive population map?
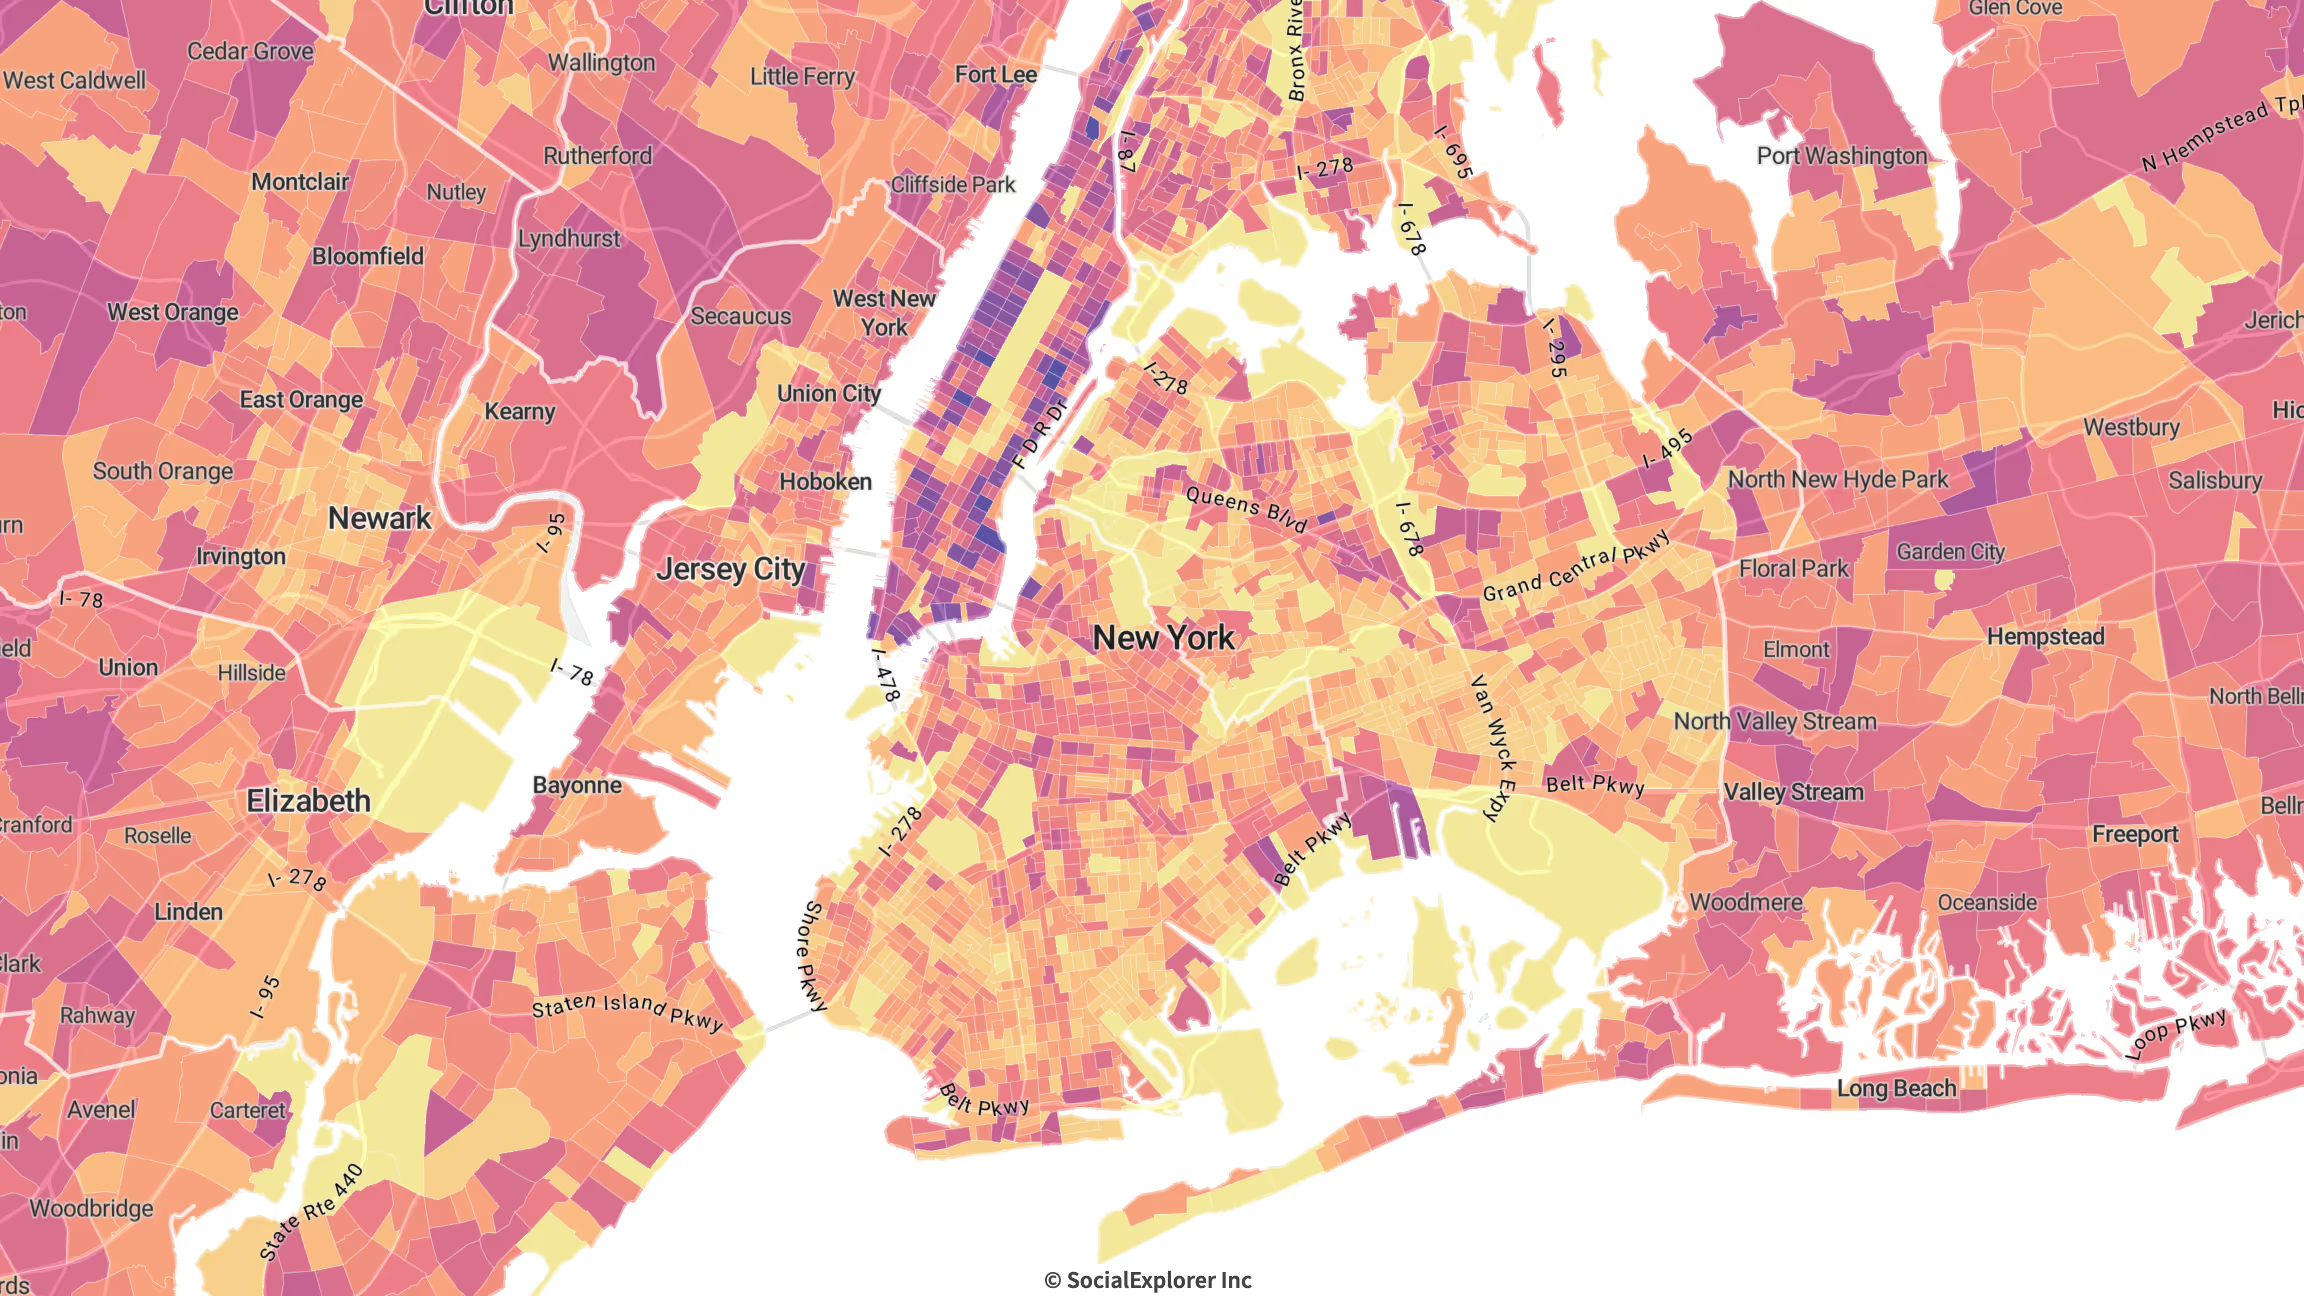
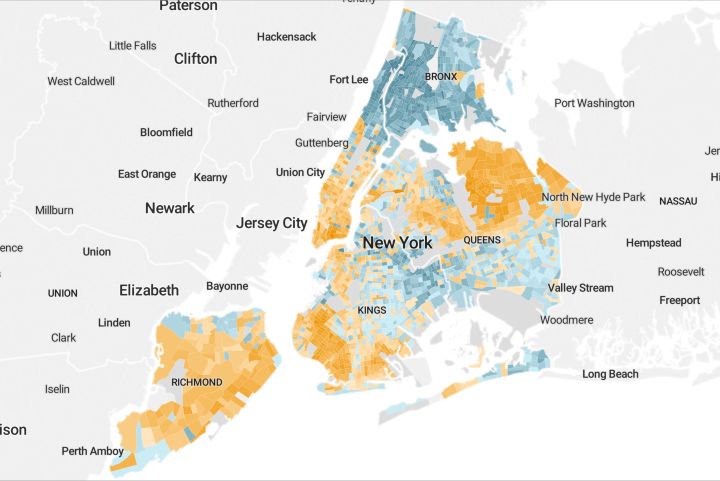
In Social Explorer Maps, search for a place, choose a variable such as population or population density, and show it as shaded areas, dot density or, for counts, bubbles, with your own colors and cutpoints. Add annotations, then share the map as a link or embed it. Viewers can pan, zoom and explore it.
Can I embed an interactive map on my website?
Yes. In Social Explorer, copy the embed code for a map or a story and paste it into your website or blog, at any size. Embedded maps and stories keep their layers and filters, and you choose whether viewers can search the map or change its geography.
Can I animate a map or export a video?
No. Social Explorer maps and stories are interactive, not animated: viewers can pan, zoom, explore and swipe, but there’s no time slider or video export. To show change, swipe between two years or map change over time, then export a story to PowerPoint or a map as a PNG or a print-ready ZIP.
Other solutions
- Site selection Compare candidate areas on the demographics that drive your business.
- Market analysis Trade area analysis: size a market and track how it is changing.
- Community needs & grants Build citable evidence of need for a grant or program.
- Equity analysis See which communities carry the heaviest burdens.
- Planning & policy Understand who lives where and how that is changing.
- Community change Show how a place has changed, with comparable data across decades.
- Census data Every census since 1790 and the latest American Community Survey, ready to map and analyze.
Try it on a place you know
In a live demo, we’ll show you how it fits your team or campus.