

North Dakota: Population, demographics and census data
Home to 799,358 people, the 47th largest of the 50 states and DC, anchored by Fargo and Bismarck. It grew 5.6% between 2015 and 2025.
- Population
- 799,358. Census Bureau estimate · Rank 47 of the 50 states and DC
- Median household income
- $81,545 ±$2,073. US $84,780
- Median age
- 37.4 ±0.5. US 39.5
ACS 2025 1-year estimates, U.S. Census Bureau
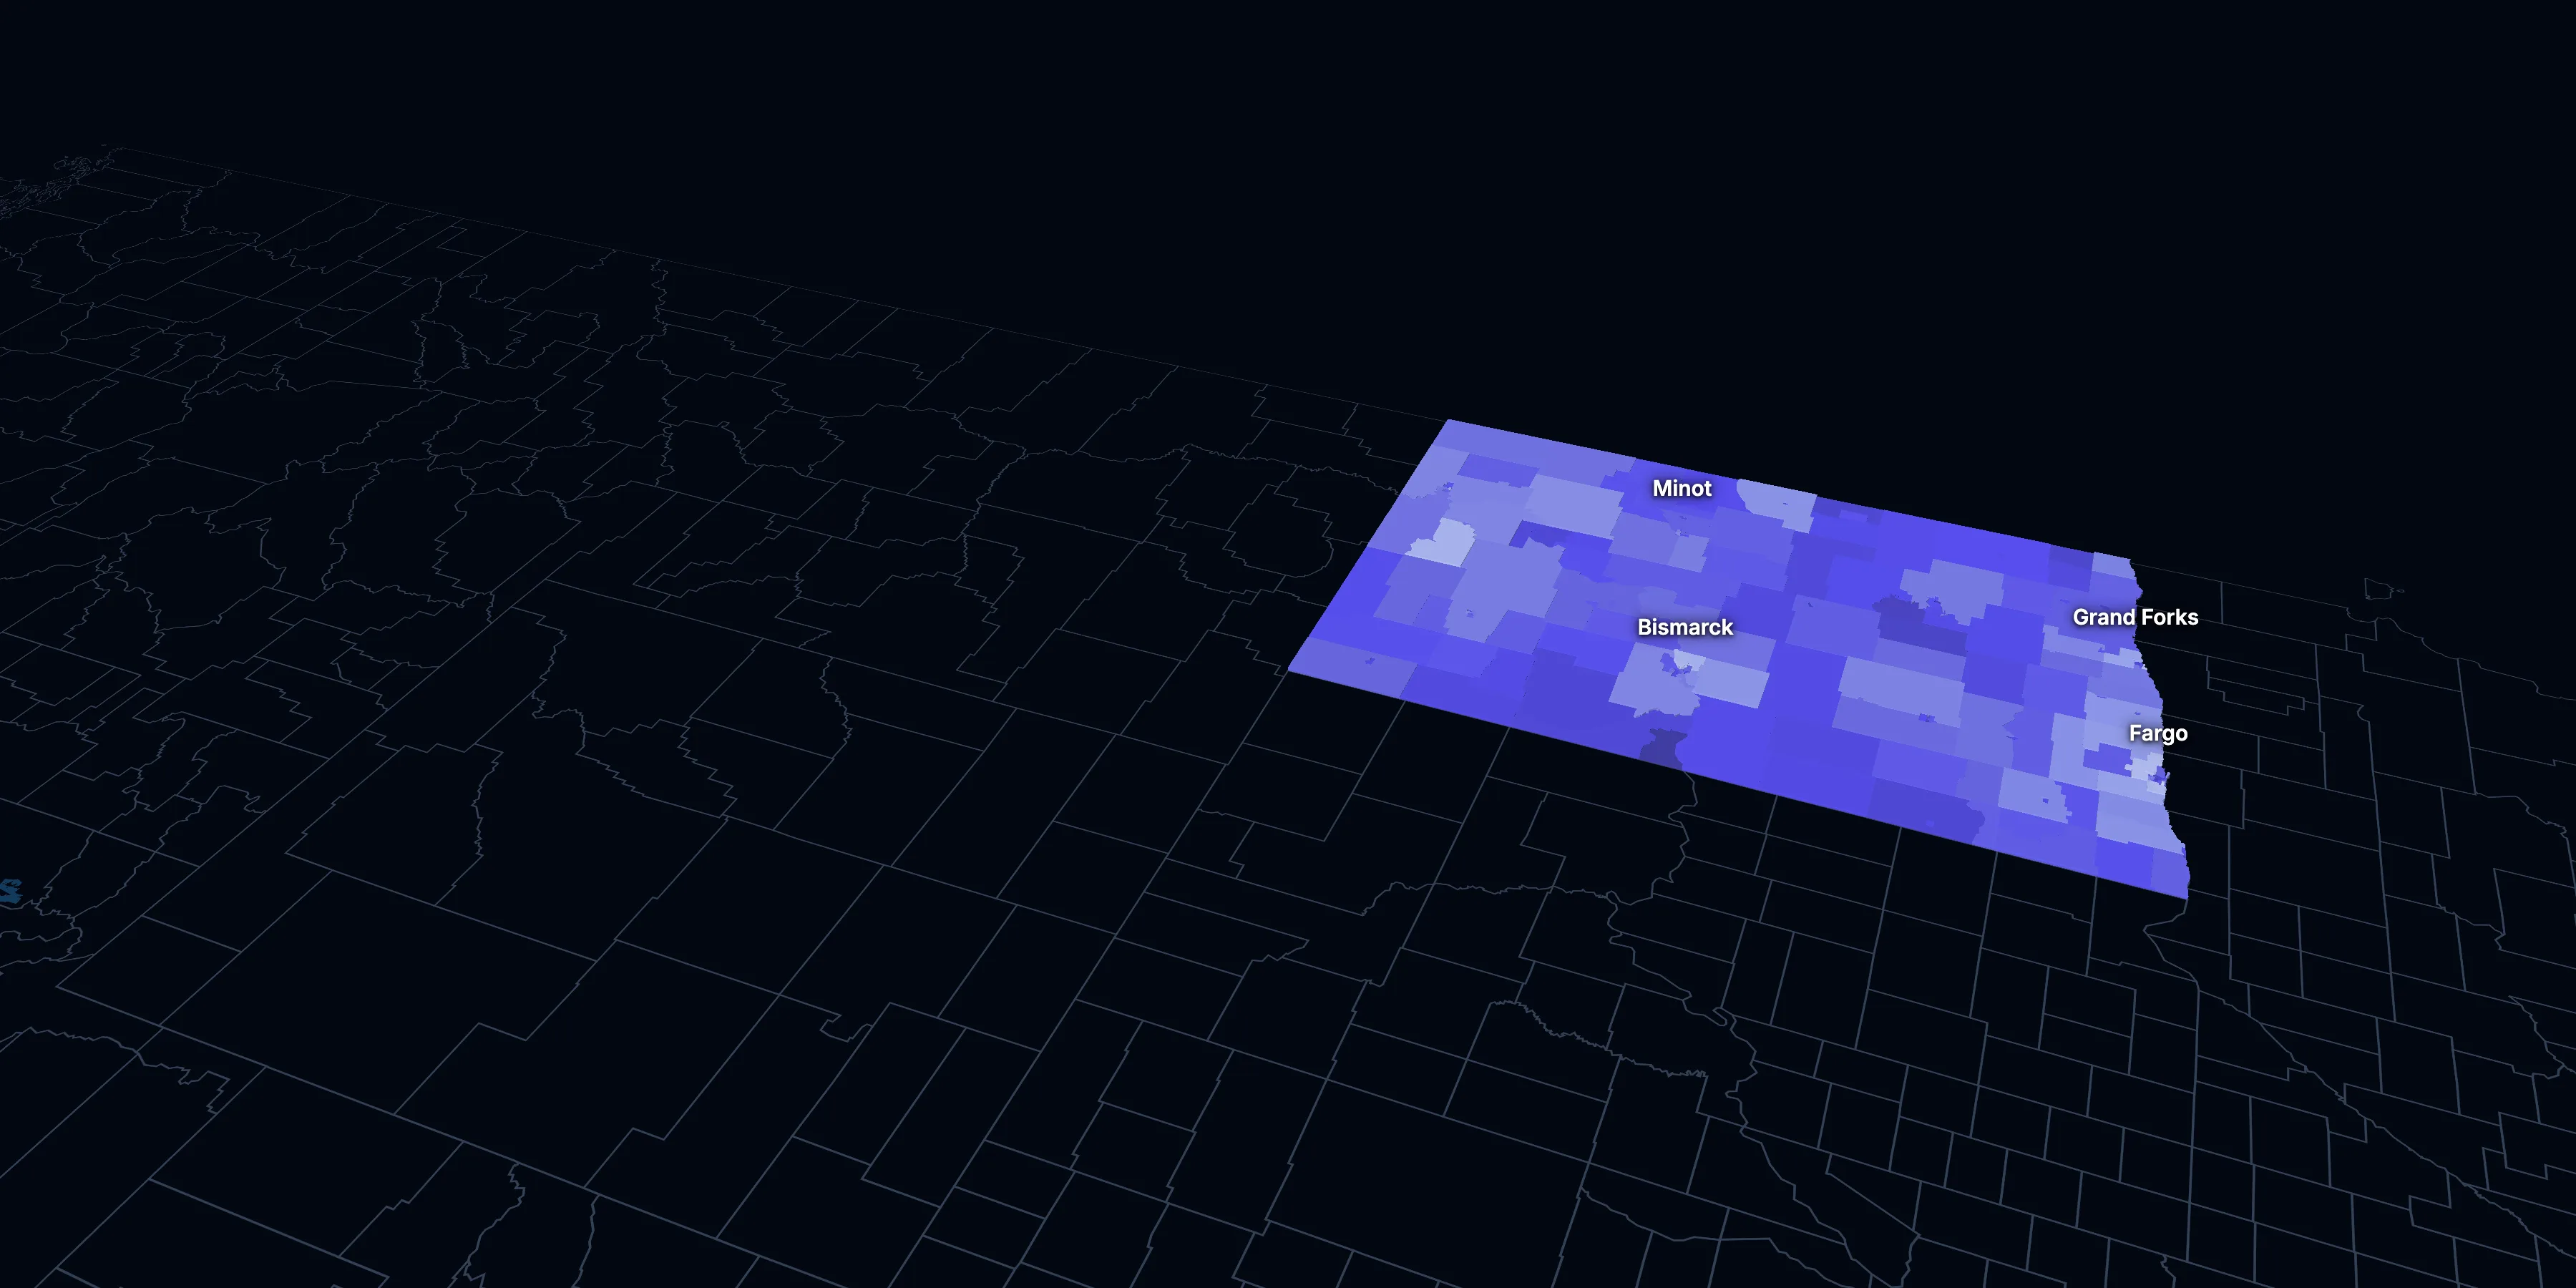
Taller, lighter tracts have higher household incomes
About North Dakota
North Dakota’s median household income is $81,545 (±$2,073), lower than the US ($84,780), and its median age is 37.4 (±0.5), according to the ACS 2025 1-year estimates. Its largest city is Fargo.
± is each figure’s margin of error, at 90% confidence, and † marks one too uncertain to lean on. Under each percentage in the tables is the number it counts. How the margins are worked out.
FIPS code 38
Highlights
What stands out in North Dakota
The numbers where North Dakota sits furthest from the nation, or past a recognized policy benchmark.
Furthest from the national picture
14.7%
Lowest among statesCommute 30 minutes or more
That’s lower than the US (39.2%). It’s the lowest of the 50 states and DC.
2.18
Lower than the USPeople per household
That’s lower than the US (2.49). It’s the 4th lowest of the 50 states and DC.
7.9%
Very lowSpeak a language other than English at home
That’s lower than the US (22.9%).
$1,071
Lower than the USMedian gross rent
That’s lower than the US ($1,557). It’s the 5th lowest of the 50 states and DC.
6.3%
3rd lowest among statesWork from home
That’s lower than the US (12.9%). It’s the 3rd lowest of the 50 states and DC.
6.0%
Very lowBorn outside the US
That’s lower than the US (14.7%).
2015 to 2025
How North Dakota changed in ten years
The state added 42,430 people. It got older, more foreign-born and better educated, and poverty fell 2.0 points.
Population, change since 2015
+5.6% in the state and +6.3% in the US.
Source: ACS 1-year, 2015 to 2025, table A00001.
Show data
| North Dakota | United States | |
|---|---|---|
| 2015 | 0.0% | 0.0% |
| 2016 | +0.1% | +0.5% |
| 2017 | −0.2% | +1.3% |
| 2018 | +0.4% | +1.8% |
| 2019 | +0.7% | +2.1% |
| 2021 | +2.4% | +3.3% |
| 2022 | +3.0% | +3.7% |
| 2023 | +3.6% | +4.2% |
| 2024 | +5.2% | +5.8% |
| 2025 | +5.6% | +6.3% |
Embed
Median household income, in 2025 dollars
−1.7% in the state and +10.9% in the US.
Source: ACS 1-year, 2015 to 2025, table A14006.
Show data
| North Dakota | United States | |
|---|---|---|
| 2015 | $82,964 | $76,413 |
| 2016 | $82,042 | $77,931 |
| 2017 | $81,886 | $79,891 |
| 2018 | $82,515 | $80,059 |
| 2019 | $81,986 | $83,427 |
| 2021 | $79,689 | $83,521 |
| 2022 | $79,726 | $82,811 |
| 2023 | $81,413 | $82,683 |
| 2024 | $80,481 | $84,339 |
| 2025 | $81,545 | $84,780 |
Embed
Living in poverty
−2.0 points in the state and −3.0 points in the US.
Source: ACS 1-year, 2015 to 2025, table A13004.
Show data
| North Dakota | United States | |
|---|---|---|
| 2015 | 11.0% | 14.7% |
| 2016 | 10.7% | 14.0% |
| 2017 | 10.3% | 13.4% |
| 2018 | 10.7% | 13.1% |
| 2019 | 10.6% | 12.3% |
| 2021 | 11.1% | 12.8% |
| 2022 | 11.5% | 12.6% |
| 2023 | 9.8% | 12.5% |
| 2024 | 11.1% | 12.1% |
| 2025 | 9.0% | 11.8% |
Embed
Bachelor’s degree or more
+5.1 points in the state and +6.7 points in the US.
Source: ACS 1-year, 2015 to 2025, table A12001.
Show data
| North Dakota | United States | |
|---|---|---|
| 2015 | 29.1% | 30.6% |
| 2016 | 29.6% | 31.3% |
| 2017 | 30.7% | 32.0% |
| 2018 | 29.7% | 32.6% |
| 2019 | 30.4% | 33.1% |
| 2021 | 31.7% | 35.0% |
| 2022 | 31.8% | 35.7% |
| 2023 | 33.6% | 36.2% |
| 2024 | 34.0% | 36.8% |
| 2025 | 34.3% | 37.4% |
Embed
Median gross rent, in 2025 dollars
+0.8% in the state and +18.5% in the US.
Source: ACS 1-year, 2015 to 2025, table A18009.
Show data
| North Dakota | United States | |
|---|---|---|
| 2015 | $1,062 | $1,314 |
| 2016 | $1,050 | $1,327 |
| 2017 | $1,039 | $1,340 |
| 2018 | $1,044 | $1,368 |
| 2019 | $1,021 | $1,393 |
| 2021 | $1,005 | $1,427 |
| 2022 | $956 | $1,440 |
| 2023 | $975 | $1,496 |
| 2024 | $1,013 | $1,537 |
| 2025 | $1,071 | $1,557 |
Embed
Median home value, in 2025 dollars
+13.7% in the state and +39.3% in the US.
Source: ACS 1-year, 2015 to 2025, table A10036.
Show data
| North Dakota | United States | |
|---|---|---|
| 2015 | $247,837 | $266,469 |
| 2016 | $249,009 | $277,278 |
| 2017 | $257,802 | $288,124 |
| 2018 | $256,838 | $296,908 |
| 2019 | $260,773 | $305,336 |
| 2021 | $268,830 | $337,116 |
| 2022 | $269,297 | $355,481 |
| 2023 | $262,458 | $361,931 |
| 2024 | $275,018 | $372,685 |
| 2025 | $281,700 | $371,100 |
Embed
ACS 1-year estimates. The dotted stretch of each line spans 2020, when the Census Bureau released no standard 1-year estimates. Dollar values are in 2025 dollars.
| Indicator | 2015 | 2025 | Change |
|---|---|---|---|
| Population | 756,928 | 799,358 | +5.6% |
| Median age | 34.9 | 37.4 | +2.5 years |
| 65 and over | 14.2% | 18.1% | +3.9 points |
| Born outside the US | 3.8% | 6.0% | +2.3 points |
| Hispanic or Latino | 3.4% | 5.4% | +2.0 points |
| Median household income | $82,964 | $81,545 | −1.7% |
| Living in poverty | 11.0% | 9.0% | −2.0 points |
| Bachelor’s degree or more | 29.1% | 34.3% | +5.1 points |
| Households that rent | 38.3% | 38.2% | −0.1 points |
| Median gross rent | $1,062 | $1,071 | +0.8% |
| Median home value | $247,837 | $281,700 | +13.7% |
228 census tracts
North Dakota, tract by tract
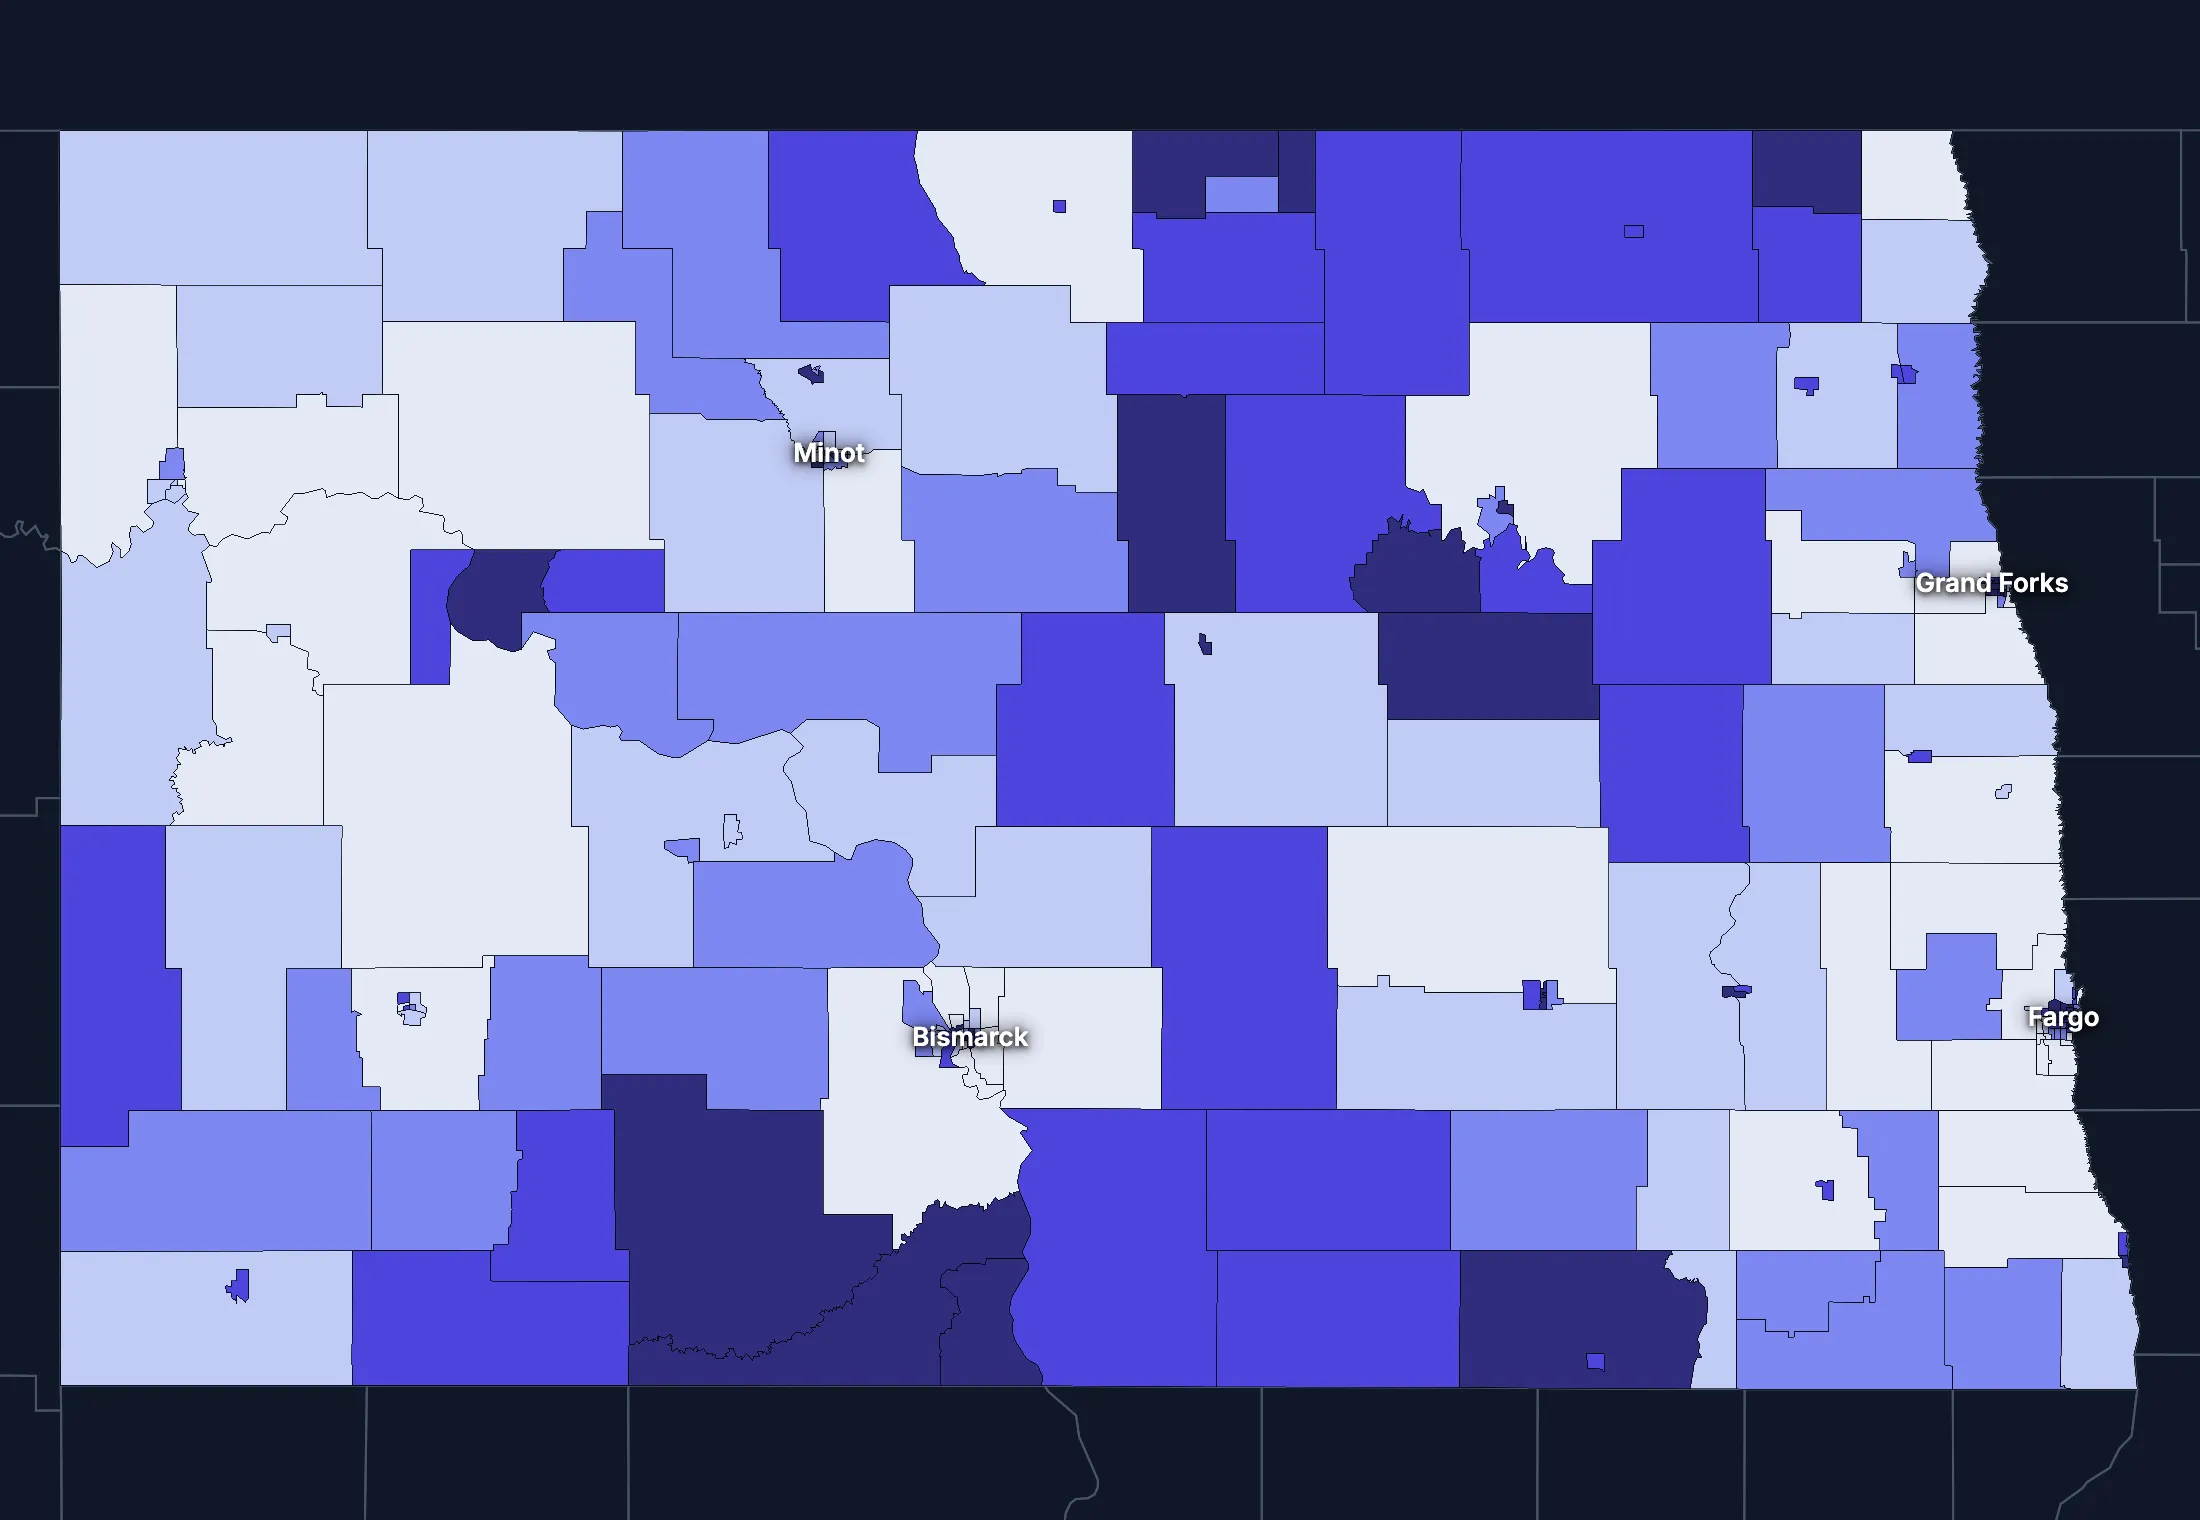
State averages hide a lot. These census tracts are the closest the census comes to neighborhoods.
Where the state’s average misleads
Each tick is one census tract, and the dark line marks the state. Hover over a tick or tap it to see the tract.
Poverty
44 of 228 tracts are at least 1.5 times the state’s overall 10.8%, and 52 are at two-thirds of it or less.
Highest: Tract 103.01, 63.0%. Lowest: Tract 405.06, 0.4%.
Renters paying 30% or more of income
12 of 221 tracts are at least 1.5 times the state’s overall 36.4%, and 79 are at two-thirds of it or less.
Highest: Tract 103.01, 78.2%. Lowest: Tract 110.02, 0.0%.
Adults with a bachelor’s degree
18 of 228 tracts are at least 1.5 times the state’s overall 32.7%, and 47 are at two-thirds of it or less.
Highest: Tract 103.02, 73.1%. Lowest: Tract 9579, 10.2%.
Median household income
14 of 228 tracts are at least 1.5 times the typical tract’s $75,541, and 20 are at two-thirds of it or less.
Highest: Tract 103.07, $162,000. Lowest: Tract 103.02, $23,636.
American Community Survey 2020–2024 5-year estimates, by census tract. Income is capped at $250,000+ by the Census Bureau.
People
Who lives in North Dakota
Its median age of 37.4 is lower than the US (39.5). 6.0% of residents were born outside the US, and 7.9% speak a language other than English at home.
Age
Source: ACS 2025 1-year, table A01001.
Show data
| North Dakota | United States | |
|---|---|---|
| Under 18 | 21.9% ±0.7% , number 175,350 ±5,698 | 21.0% ±<0.1% , number 71,689,151 ±111,800 |
| 18 to 24 | 10.9% ±0.7% , number 86,822 ±5,643 | 9.3% ±<0.1% , number 31,716,680 ±98,660 |
| 25 to 34 | 13.7% ±0.5% , number 109,373 ±4,245 | 13.6% ±<0.1% , number 46,357,354 ±55,690 |
| 35 to 44 | 14.1% ±0.6% , number 112,540 ±5,171 | 13.4% ±<0.1% , number 45,746,189 ±105,700 |
| 45 to 54 | 10.7% ±0.4% , number 85,175 ±3,482 | 11.8% ±<0.1% , number 40,257,563 ±53,540 |
| 55 to 64 | 10.7% ±0.5% , number 85,339 ±4,201 | 12.1% ±<0.1% , number 41,242,904 ±104,700 |
| 65 to 74 | 10.5% ±0.5% , number 83,829 ±3,783 | 10.8% ±<0.1% , number 36,895,650 ±91,520 |
| 75 and over | 7.6% ±0.4% , number 60,930 ±3,098 | 8.2% ±<0.1% , number 27,879,368 ±78,140 |
Embed
Race and ethnicity
Source: ACS 2025 1-year, table A04001.
Show data
| North Dakota | United States | |
|---|---|---|
| White, not Hispanic | 78.9% ±0.2% , number 630,759 ±1,951 | 55.0% ±<0.1% , number 187,959,031 ±58,340 |
| Hispanic or Latino | 5.4% ±0.2% , number 43,268 ±1,218 | 20.5% ±<0.1% , number 69,975,516 ±13,270 |
| Black, not Hispanic | 3.6% ±0.4% , number 28,777 ±3,368 | 11.7% ±<0.1% , number 40,096,453 ±106,200 |
| Asian, not Hispanic | 2.1% ±0.3% , number 16,685 ±2,586 | 6.5% ±<0.1% , number 22,096,709 ±58,340 |
| Other or multiracial | 10.0% ±0.8% , number 79,869 ±6,409 | 6.3% ±<0.1% , number 21,657,150 ±150,100 |
Embed
Language spoken at home
Source: ACS 2025 1-year, table C16001.
Show data
| North Dakota | United States | |
|---|---|---|
| English only | 92.1% ±0.8% , number 696,166 ±6,461 | 77.1% ±0.1% , number 249,390,588 ±275,300 |
| Spanish | 2.6% ±0.5% , number 20,021 ±3,434 | 13.9% ±0.1% , number 44,921,985 ±177,800 |
| Other Indo-European | 2.3% ±0.5% , number 17,206 ±3,964 | 4.0% ±<0.1% , number 12,862,980 ±113,500 |
| Asian and Pacific Island | 1.3% ±0.4% , number 10,060 ±2,880 | 3.8% ±<0.1% , number 12,288,841 ±99,740 |
| Arabic and other | 1.7% ±0.5% , number 12,678 ±4,010 | 1.3% ±<0.1% , number 4,116,949 ±71,480 |
Embed
Marital status
Source: ACS 2025 1-year, table A11001.
Show data
| North Dakota | United States | |
|---|---|---|
| Now married | 50.6% ±1.2% , number 331,458 ±8,274 | 47.9% ±0.1% , number 135,567,564 ±223,300 |
| Never married | 33.6% ±1.1% , number 220,376 ±7,229 | 34.8% ±0.1% , number 98,647,238 ±152,600 |
| Divorced | 9.0% ±0.7% , number 59,211 ±4,528 | 10.2% ±<0.1% , number 28,879,967 ±112,900 |
| Widowed | 5.6% ±0.4% , number 36,971 ±2,910 | 5.5% ±<0.1% , number 15,599,094 ±69,430 |
| Separated | 1.1% ±0.3% , number 7,056 ±1,644 | 1.6% ±<0.1% , number 4,441,399 ±49,160 |
Embed
Where people lived a year ago
Source: ACS 2025 1-year, table A08001.
Show data
| North Dakota | United States | |
|---|---|---|
| Same home | 86.0% ±1.2% , number 680,931 ±9,298 | 88.4% ±0.1% , number 298,889,697 ±214,800 |
| Same county | 6.9% ±0.9% , number 54,933 ±7,166 | 6.0% ±<0.1% , number 20,202,671 ±166,300 |
| Another county in the state | 2.9% ±0.4% , number 22,727 ±2,921 | 3.0% ±<0.1% , number 10,168,097 ±89,190 |
| Another state | 3.5% ±0.5% , number 27,560 ±4,331 | 2.1% ±<0.1% , number 7,025,589 ±81,660 |
| Another country | 0.7% ±0.2% , number 5,217 ±1,852 | 0.6% ±<0.1% , number 1,984,943 ±47,210 |
Embed
Top countries of birth, among those born abroad
Source: ACS 2020–2024 5-year, table A07001.
Show data
| North Dakota | |
|---|---|
| Mexico | 9.6% , number 3,543 |
| Philippines | 8.1% , number 2,985 |
| Canada | 7.8% , number 2,865 |
| Liberia | 7.6% , number 2,792 |
| India | 4.6% , number 1,707 |
| Middle Africa | 3.3% , number 1,203 |
Embed
All the numbers
| Indicator | North Dakota | US | Rank among states* | Table |
|---|---|---|---|---|
| Population | 799,358 | 341,784,859 | 47th | A00001 |
| People per square mile | 12 | 97 | 48th | A00002 |
| Land area (square miles) | 68,994 | – | – | A00002 |
| Median age | 37.4 ±0.5 | 39.5 ±0.1 | 47th | A01004 |
| Under 18 | 21.9% ±0.7% , number 175,350 ±5,698 | 21.0% ±<0.1% , number 71,689,151 ±111,800 | 9th | B02002 |
| 65 and over | 18.1% ±0.6% , number 144,759 ±4,890 | 19.0% ±<0.1% , number 64,775,018 ±120,300 | 43rd | B02002 |
| Born outside the US | 6.0% ±0.8% , number 48,267 ±6,043 | 14.7% ±0.1% , number 50,409,320 ±204,800 | 41st | A06001 |
| Speak a language other than English at home | 7.9% ±0.8% , number 59,965 ±7,203 | 22.9% ±0.1% , number 74,190,755 ±244,000 | 44th | C16001 |
| Veterans (adults) | 6.4% ±0.5% , number 39,118 ±3,153 | 5.9% ±<0.1% , number 15,746,228 ±85,320 | 27th | A16002 |
| Living with a disability | 12.0% ±0.7% , number 93,417 ±5,458 | 13.7% ±<0.1% , number 46,271,455 ±126,000 | 44th | B18101 |
| Women 15–50 who had a baby in the past year | 5.4% ±0.9% , number 10,151 ±1,627 | 5.0% ±0.1% , number 4,016,759 ±44,040 | 2nd | B13002 |
| Lived in the same home a year ago | 86.0% ±1.2% , number 680,931 ±9,298 | 88.4% ±0.1% , number 298,889,697 ±214,800 | 49th | A08001 |
| White, not Hispanic | 78.9% ±0.2% , number 630,759 ±1,951 | 55.0% ±<0.1% , number 187,959,031 ±58,340 | 7th | A04001 |
| Hispanic or Latino | 5.4% ±0.2% , number 43,268 ±1,218 | 20.5% ±<0.1% , number 69,975,516 ±13,270 | 46th | A04001 |
| Black, not Hispanic | 3.6% ±0.4% , number 28,777 ±3,368 | 11.7% ±<0.1% , number 40,096,453 ±106,200 | 38th | A04001 |
| Asian, not Hispanic | 2.1% ±0.3% , number 16,685 ±2,586 | 6.5% ±<0.1% , number 22,096,709 ±58,340 | 40th | A04001 |
*1 is the highest. Population is ranked among all states, and the rest among those of 1,000 people or more, whose figures can be ranked. Ranks use 5-year estimates, the only ones covering every state, so they can differ slightly from the figures here.
Income and work
Lower incomes than the US
The median household income is $81,545, lower than the US ($84,780). 9.0% of people live in poverty, and 8.0% have no health insurance, about the same as the US (8.4%).
Household income
Source: ACS 2025 1-year, table A14001.
Show data
| North Dakota | United States | |
|---|---|---|
| Under $25,000 | 13.0% ±1.2% , number 45,816 ±4,083 | 14.0% ±0.1% , number 18,727,548 ±88,990 |
| $25,000 to $49,999 | 14.7% ±1.2% , number 51,831 ±4,160 | 15.4% ±0.1% , number 20,665,585 ±101,400 |
| $50,000 to $74,999 | 18.5% ±1.4% , number 65,202 ±5,000 | 15.3% ±0.1% , number 20,513,565 ±88,500 |
| $75,000 to $99,999 | 14.0% ±1.1% , number 49,407 ±3,799 | 12.5% ±0.1% , number 16,814,245 ±87,520 |
| $100,000 to $149,999 | 19.3% ±1.3% , number 67,957 ±4,544 | 17.9% ±0.1% , number 24,018,984 ±99,670 |
| $150,000 to $199,999 | 9.6% ±0.9% , number 33,767 ±3,167 | 10.1% ±0.1% , number 13,521,827 ±70,660 |
| $200,000 or more | 10.8% ±0.8% , number 38,033 ±2,989 | 14.8% ±0.1% , number 19,801,668 ±84,120 |
Embed
What residents do for work
Source: ACS 2025 1-year, table A17004.
Show data
| North Dakota | United States | |
|---|---|---|
| Education and health care | 26.0% ±1.6% , number 110,388 ±6,824 | 24.4% ±0.1% , number 40,862,193 ±140,800 |
| Retail trade | 11.7% ±0.9% , number 49,633 ±4,095 | 10.6% ±0.1% , number 17,781,181 ±96,660 |
| Arts, food and lodging | 8.7% ±1.1% , number 36,751 ±4,665 | 8.9% ±0.1% , number 14,811,502 ±87,840 |
| Manufacturing | 7.9% ±0.9% , number 33,459 ±4,004 | 9.6% ±0.1% , number 16,064,394 ±91,270 |
| Agriculture and mining | 7.4% ±0.6% , number 31,363 ±2,414 | 1.4% ±<0.1% , number 2,287,596 ±30,080 |
| Construction | 7.1% ±0.8% , number 30,174 ±3,397 | 6.7% ±<0.1% , number 11,254,981 ±79,620 |
| Professional and business services | 6.9% ±0.8% , number 29,252 ±3,212 | 12.8% ±0.1% , number 21,375,231 ±87,110 |
| Finance, insurance and real estate | 6.0% ±0.6% , number 25,618 ±2,396 | 6.6% ±<0.1% , number 11,025,569 ±68,570 |
Embed
Where workers come from and go
North Dakota has 416,442 jobs and 383,234 employed residents. 52,237 people commute in to work and 19,029 commute out, while 364,205 both live and work here. The most commuters come from Minnesota.
Most commuters come from
- Minnesota: 38,406
- Montana: 3,886
- South Dakota: 3,052
Most residents commute to
- Minnesota: 13,875
- South Dakota: 1,753
- Montana: 1,164
Show data
| North Dakota | |
|---|---|
| Live and work here | 364,205 |
| Work here, live elsewhere | 52,237 |
| Live here, work elsewhere | 19,029 |
Embed
All the numbers
| Indicator | North Dakota | US | Rank among states* | Table |
|---|---|---|---|---|
| Median household income | $81,545 ±$2,073 | $84,780 ±$215 | 28th | A14006 |
| Income per person | $46,860 ±$1,343 | $47,171 ±$115 | 22nd | A14024 |
| Income inequality (Gini index) | 0.444 ±0.011 | 0.482 ±0.001 | 35th | A14028 |
| Living in poverty | 9.0% ±0.9% , number 69,137 ±7,056 | 11.8% ±0.1% , number 39,264,183 ±277,400 | 32nd | A13004 |
| Unemployment rate | 2.0% ±0.4% , number 8,723 ±1,769 | 4.9% ±<0.1% , number 8,574,594 ±64,350 | 51st | A17005 |
| No health insurance | 8.0% ±0.7% , number 62,266 ±5,686 | 8.4% ±<0.1% , number 28,323,306 ±152,000 | 30th | A20001 |
*1 is the highest. Population is ranked among all states, and the rest among those of 1,000 people or more, whose figures can be ranked. Ranks use 5-year estimates, the only ones covering every state, so they can differ slightly from the figures here.
Education
Fewer college degrees than the US
34.3% of adults 25 and over have a bachelor’s degree or more, lower than the US (37.4%).
Highest level of education
Source: ACS 2025 1-year, table A12001.
Show data
| North Dakota | United States | |
|---|---|---|
| Less than high school | 5.8% ±0.6% , number 30,935 ±3,167 | 9.4% ±0.1% , number 22,321,002 ±120,500 |
| High school only | 25.2% ±1.3% , number 135,398 ±7,029 | 25.6% ±0.1% , number 61,096,726 ±203,400 |
| Some college | 34.8% ±1.3% , number 186,677 ±7,368 | 27.7% ±0.1% , number 65,920,977 ±173,500 |
| Bachelor’s degree | 23.8% ±1.0% , number 127,936 ±5,706 | 22.3% ±0.1% , number 53,224,312 ±196,700 |
| Graduate degree | 10.5% ±0.8% , number 56,240 ±4,268 | 15.0% ±0.1% , number 35,816,011 ±159,400 |
Embed
All the numbers
| Indicator | North Dakota | US | Rank among states* | Table |
|---|---|---|---|---|
| Bachelor’s degree or more | 34.3% ±1.3% , number 184,176 ±7,126 | 37.4% ±0.1% , number 89,040,323 ±253,200 | 31st | A12001 |
| High school graduate or more | 94.2% ±2.2% , number 506,251 ±12,430 | 90.6% ±0.2% , number 216,058,026 ±368,200 | 6th | A12001 |
*1 is the highest. Population is ranked among all states, and the rest among those of 1,000 people or more, whose figures can be ranked. Ranks use 5-year estimates, the only ones covering every state, so they can differ slightly from the figures here.
Housing
Home values outran incomes
38.2% of households rent, higher than the US (34.7%). The median home is worth $281,700 and the median rent is $1,071. After inflation, home values rose 14% from 2015 to 2025, while household income fell 2%.
Housing costs and income, 2015 to 2025, after inflation
Source: ACS 1-year, table A10036, A18009, A14006.
Show data
| North Dakota | United States | |
|---|---|---|
| Median home value | +13.7% | +39.3% |
| Median rent | +0.8% | +18.5% |
| Median household income | −1.7% | +10.9% |
Embed
Types of homes
Source: ACS 2025 1-year, table A10032.
Show data
| North Dakota | United States | |
|---|---|---|
| Single-family, detached | 56.6% ±1.5% , number 217,473 ±5,660 | 60.9% ±0.1% , number 90,335,844 ±173,300 |
| Single-family, attached | 6.3% ±0.7% , number 24,334 ±2,603 | 6.4% ±<0.1% , number 9,527,703 ±51,230 |
| 2 to 4 units | 4.8% ±0.7% , number 18,606 ±2,764 | 7.5% ±0.1% , number 11,109,005 ±75,790 |
| 5 to 19 units | 8.5% ±0.9% , number 32,607 ±3,275 | 8.7% ±0.1% , number 12,829,882 ±97,590 |
| 20 or more units | 18.4% ±1.5% , number 70,781 ±5,629 | 11.1% ±0.1% , number 16,381,450 ±92,310 |
| Mobile homes and other | 5.3% ±0.6% , number 20,446 ±2,326 | 5.4% ±<0.1% , number 8,045,083 ±53,680 |
Embed
When homes were built
Source: ACS 2025 1-year, table A10055.
Show data
| North Dakota | United States | |
|---|---|---|
| 2010 or later | 23.6% ±1.5% , number 83,008 ±5,301 | 15.1% ±0.1% , number 20,257,912 ±101,300 |
| 2000 to 2009 | 12.6% ±1.0% , number 44,289 ±3,673 | 13.8% ±0.1% , number 18,535,840 ±92,260 |
| 1980 to 1999 | 20.3% ±1.4% , number 71,586 ±4,948 | 24.1% ±0.1% , number 32,332,570 ±118,900 |
| 1960 to 1979 | 23.0% ±1.4% , number 80,870 ±4,896 | 22.9% ±0.1% , number 30,726,302 ±110,000 |
| Before 1960 | 20.5% ±1.2% , number 72,260 ±4,362 | 24.0% ±0.1% , number 32,210,798 ±121,500 |
Embed
All the numbers
| Indicator | North Dakota | US | Rank among states* | Table |
|---|---|---|---|---|
| Housing units | 384,247 ±873 | – | – | A10001 |
| Households | 352,013 ±3,073 | – | – | A10008 |
| People per household | 2.18 ±0.02 | 2.49 ±0.01 | 48th | A10003 |
| Households that rent | 38.2% ±1.5% , number 134,608 ±5,333 | 34.7% ±0.1% , number 46,551,688 ±193,200 | 7th | A10060 |
| Vacant homes | 8.4% ±0.8% , number 32,234 ±3,145 | 9.6% ±0.1% , number 14,165,545 ±137,100 | 17th | A10047, A10060 |
| Median gross rent | $1,071 ±$32 | $1,557 ±$4 | 47th | A18009 |
| Median home value | $281,700 ±$6,105 | $371,100 ±$646 | 36th | A10036 |
| Renters paying 30% or more of income | 32.3% ±3.3% , number 43,523 ±4,768 | 48.3% ±0.2% , number 22,486,693 ±122,100 | 51st | A18002 |
| Owners paying 30% or more of income | 15.6% ±1.5% , number 33,873 ±3,293 | 24.2% ±0.1% , number 21,201,943 ±93,050 | 50th | A10040 |
| Homes built before 1960 | 20.5% ±1.2% , number 72,260 ±4,362 | 24.0% ±0.1% , number 32,210,798 ±121,500 | 28th | A10055 |
*1 is the highest. Population is ranked among all states, and the rest among those of 1,000 people or more, whose figures can be ranked. Ranks use 5-year estimates, the only ones covering every state, so they can differ slightly from the figures here.
Getting around
A driving state with short commutes
78.7% of workers drive alone and 6.3% work from home. 14.7% of those who travel to work spend 30 minutes or more getting there, and 6.2% of households have no vehicle.
How people get to work
Source: ACS 2025 1-year, table A09005.
Show data
| North Dakota | United States | |
|---|---|---|
| Drive alone | 78.7% ±1.4% , number 335,922 ±7,617 | 69.8% ±0.1% , number 115,297,377 ±192,900 |
| Carpool | 9.5% ±1.1% , number 40,491 ±4,786 | 8.9% ±0.1% , number 14,712,170 ±97,240 |
| Public transit | 0.6% ±0.2% , number 2,589 ±1,065 | 4.3% ±<0.1% , number 7,100,386 ±63,330 |
| Walk | 3.3% ±0.5% , number 13,954 ±2,206 | 2.4% ±<0.1% , number 4,016,469 ±41,070 |
| Work from home | 6.3% ±0.7% , number 26,812 ±2,865 | 12.9% ±0.1% , number 21,288,393 ±105,700 |
| Other | 1.6% ±0.4% , number 6,818 ±1,795 | 1.7% ±<0.1% , number 2,799,658 ±41,510 |
Embed
Time spent getting to work
Source: ACS 2025 1-year, table B09001.
Show data
| North Dakota | United States | |
|---|---|---|
| Under 10 minutes | 27.7% ±1.5% , number 110,622 ±6,233 | 12.0% ±0.1% , number 17,199,225 ±93,440 |
| 10 to 19 minutes | 43.1% ±2.0% , number 172,475 ±8,418 | 27.8% ±0.1% , number 40,059,540 ±137,700 |
| 20 to 29 minutes | 14.5% ±1.0% , number 57,940 ±4,289 | 21.0% ±0.1% , number 30,221,743 ±111,100 |
| 30 to 39 minutes | 5.6% ±0.6% , number 22,320 ±2,533 | 17.1% ±0.1% , number 24,659,138 ±103,800 |
| 40 to 59 minutes | 3.9% ±0.5% , number 15,538 ±2,159 | 12.6% ±0.1% , number 18,104,709 ±97,070 |
| 60 minutes or more | 5.2% ±0.7% , number 20,879 ±2,923 | 9.5% ±0.1% , number 13,681,705 ±84,440 |
Embed
Vehicles per household
Source: ACS 2025 1-year, table A10030.
Show data
| North Dakota | United States | |
|---|---|---|
| None | 6.2% ±1.0% , number 21,934 ±3,411 | 8.8% ±0.1% , number 11,781,997 ±77,240 |
| One | 31.0% ±1.7% , number 109,227 ±6,204 | 33.1% ±0.1% , number 44,424,682 ±160,700 |
| Two | 34.8% ±1.7% , number 122,478 ±6,115 | 36.0% ±0.1% , number 48,200,889 ±176,800 |
| Three or more | 27.9% ±1.3% , number 98,374 ±4,630 | 22.1% ±0.1% , number 29,655,854 ±113,300 |
Embed
All the numbers
| Indicator | North Dakota | US | Rank among states* | Table |
|---|---|---|---|---|
| Drive to work alone | 78.7% ±1.4% , number 335,922 ±7,617 | 69.8% ±0.1% , number 115,297,377 ±192,900 | 6th | A09005 |
| Take public transit | 0.6% ±0.2% , number 2,589 ±1,065 | 4.3% ±<0.1% , number 7,100,386 ±63,330 | 47th | A09005 |
| Work from home | 6.3% ±0.7% , number 26,812 ±2,865 | 12.9% ±0.1% , number 21,288,393 ±105,700 | 49th | A09005 |
| Commute 30 minutes or more | 14.7% ±1.1% , number 58,737 ±4,429 | 39.2% ±0.1% , number 56,445,552 ±165,300 | 51st | B09001 |
| Households with no vehicle | 6.2% ±1.0% , number 21,934 ±3,428 | 8.8% ±<0.1% , number 11,781,997 ±64,240 | 32nd | A10030 |
*1 is the highest. Population is ranked among all states, and the rest among those of 1,000 people or more, whose figures can be ranked. Ranks use 5-year estimates, the only ones covering every state, so they can differ slightly from the figures here.
Places
The largest cities in North Dakota
Population, from the latest estimates available. Figures cover the whole of each place.
Largest cities
- Fargo: 136,295
- Bismarck: 77,966
- Grand Forks: 59,042
- Minot: 47,791
- West Fargo: 40,094
- Williston: 28,056
- Dickinson: 25,357
- Mandan: 24,522
States like this one
- Kansas: 2,947,197
- Nebraska: 1,978,707
- South Dakota: 907,428
- Alaska: 735,706
States at least a third this size, with the closest income, education, age, housing and origins.
Every county and place in North Dakota
Find any county, city, town, metro area, ZIP code, school district or district in North Dakota.
Counties
Each of the 53 counties with its population, from ACS 2020–2024 5-year estimates.
- Adams County2,145
- Barnes County10,773
- Benson County5,808
- Billings County1,024
- Bottineau County6,378
- Bowman County2,906
- Burke County2,156
- Burleigh County100,600
- Cass County193,400
- Cavalier County3,633
- Dickey County4,935
- Divide County2,167
- Dunn County4,040
- Eddy County2,307
- Emmons County3,254
- Foster County3,358
- Golden Valley County1,653
- Grand Forks County72,923
- Grant County2,269
- Griggs County2,245
- Hettinger County2,432
- Kidder County2,377
- LaMoure County4,118
- Logan County1,819
- McHenry County5,207
- McIntosh County2,497
- McKenzie County14,321
- McLean County9,823
- Mercer County8,337
- Morton County33,777
- Mountrail County9,507
- Nelson County3,016
- Oliver County1,839
- Pembina County6,727
- Pierce County3,928
- Ramsey County11,556
- Ransom County5,643
- Renville County2,304
- Richland County16,584
- Rolette County11,924
- Sargent County3,804
- Sheridan County1,303
- Sioux County3,740
- Slope County766
- Stark County33,302
- Steele County1,804
- Stutsman County21,549
- Towner County2,079
- Traill County7,970
- Walsh County10,396
- Ward County68,973
- Wells County3,890
- Williams County39,555
Cities, towns and other places
Each of the 402 with its population, from ACS 2020–2024 5-year estimates. Census-designated places are communities without a local government of their own, drawn by the Census Bureau so they can be counted.
- Abercrombie232
- Adams121
- Alamo47
- Alexander255
- Alice18
- Almont183
- Alsen39
- Ambrose33
- Amenia135
- Amidon6
- Anamoose309
- Aneta157
- Antler15
- Apple Valley279
- Ardoch22
- Argusville584
- Arnegard201
- Arthur392
- Ashley599
- Auburn28
- Ayr14
- Balfour3
- Balta52
- Bantry5
- Barney42
- Bathgate56
- Beach899
- Belcourt1,547
- Belfield685
- Benedict227
- Bergen1
- Berlin50
- Berthold415
- Beulah3,040
- Binford168
- Bisbee85
- Bismarck75,556
- Blacktail93
- Bottineau2,205
- Bowbells355
- Bowdon90
- Bowman1,499
- Braddock13
- Briarwood60
- Brinsmade21
- Brocket43
- Brooktree Park23
- Buchanan130
- Bucyrus22
- Buffalo180
- Burlington1,067
- Butte68
- Buxton360
- Caledonia74
- Calio14
- Calvin5
- Cando1,164
- Cannon Ball748
- Canton City (Hensel)28
- Carpio184
- Carrington2,168
- Carson316
- Casselton2,953
- Cathay17
- Cavalier1,426
- Cayuga30
- Center562
- Christine255
- Churchs Ferry4
- Cleveland107
- Clifford54
- Cogswell110
- Coleharbor66
- Colfax272
- Columbus67
- Conway11
- Cooperstown918
- Courtenay29
- Crary114
- Crosby1,065
- Crystal103
- Dahlen20
- Davenport245
- Dawson72
- Dazey62
- De Lamere10
- Deering68
- Denhoff11
- Des Lacs163
- Devils Lake7,308
- Dickey66
- Dickinson25,357
- Dodge109
- Donnybrook74
- Douglas94
- Drake300
- Drayton763
- Driscoll59
- Dunn Center329
- Dunseith818
- Dwight47
- East Dunseith450
- East Fairview137
- Edgeley666
- Edinburg196
- Edmore240
- Egeland81
- Elgin585
- Ellendale1,033
- Elliott33
- Embden41
- Emerado346
- Enderlin985
- Englevale11
- Epping124
- Erie58
- Esmond78
- Fairdale16
- Fairmount292
- Fargo131,627
- Fessenden433
- Fingal174
- Finley329
- Flasher222
- Flaxton16
- Forbes30
- Fordville212
- Forest River87
- Forman617
- Fort Ransom106
- Fort Totten1,038
- Fort Yates107
- Fortuna41
- Four Bears Village154
- Foxholm34
- Fredonia46
- Frontier169
- Fullerton65
- Gackle284
- Galesburg44
- Gardena37
- Gardner125
- Garrison1,397
- Gascoyne28
- Gilby322
- Gladstone230
- Glen Ullin701
- Glenburn461
- Glenfield63
- Golden Valley258
- Golva97
- Goodrich85
- Grace City61
- Grafton4,102
- Grand Forks59,042
- Grand Forks AFB1,987
- Grandin119
- Grano3
- Granville278
- Great Bend37
- Green Acres994
- Grenora408
- Gwinner859
- Hague78
- Halliday389
- Hamberg3
- Hamilton39
- Hampden21
- Hankinson804
- Hannaford77
- Hannah4
- Hansboro5
- Harmon198
- Harvey1,679
- Harwood819
- Hatton608
- Havana86
- Haynes23
- Hazelton206
- Hazen2,453
- Hebron677
- Heil8
- Heimdal40
- Hettinger1,250
- Hillsboro1,704
- Hoople228
- Hope339
- Horace4,588
- Hunter292
- Hurdsfield35
- Inkster27
- Jamestown15,787
- Jessie8
- Jud42
- Karlsruhe62
- Kathryn77
- Kenmare1,002
- Kensal233
- Killdeer985
- Kindred996
- Knox18
- Kramer21
- Kulm474
- Lakota784
- LaMoure658
- Landa52
- Langdon1,782
- Lankin109
- Lansford216
- Larimore1,240
- Larson10
- Lawton21
- Leal23
- Leeds503
- Lehr66
- Leith30
- Leonard248
- Lidgerwood719
- Lignite167
- Lincoln4,381
- Linton904
- Lisbon2,259
- Litchville185
- Logan70
- Loma6
- Long Creek38
- Loraine18
- Ludden22
- Luverne52
- Maddock474
- Makoti84
- Mandan24,522
- Mandaree620
- Manning43
- Mantador37
- Manvel368
- Mapleton1,352
- Marion176
- Marmarth100
- Martin80
- Max358
- Maxbass56
- Mayville1,976
- McClusky327
- McGregor108
- McHenry66
- McLeod129
- McVille365
- Medina255
- Medora198
- Menoken102
- Mercer66
- Michigan City277
- Milnor648
- Milton43
- Minnewaukan191
- Minot47,791
- Minot AFB4,878
- Minto718
- Mohall634
- Monango18
- Montpelier99
- Mooreton175
- Mott742
- Mountain100
- Munich257
- Mylo8
- Napoleon765
- Nash7
- Neche398
- Nekoma22
- New England564
- New Leipzig181
- New Rockford1,260
- New Salem780
- New Town2,721
- Newburg67
- Niagara24
- Nome49
- Noonan163
- North River70
- Northwood1,046
- Oakes1,858
- Oberon39
- Oriska231
- Osnabrock115
- Overly10
- Oxbow491
- Page165
- Palermo129
- Park River1,458
- Parshall922
- Pekin62
- Pembina625
- Perth6
- Petersburg120
- Pettibone65
- Pick City144
- Pillsbury10
- Pingree61
- Pisek91
- Plaza350
- Porcupine138
- Portal129
- Portland549
- Powers Lake301
- Prairie Rose43
- Raleigh20
- Ray714
- Reeder125
- Regan85
- Regent181
- Reile's Acres1,032
- Reynolds349
- Rhame184
- Richardton768
- Riverdale187
- Robinson50
- Rocklake102
- Rogers26
- Rolette363
- Rolla1,039
- Ross156
- Rugby2,481
- Ruso4
- Ruthville104
- Rutland103
- Ryder100
- Sanborn103
- Sarles19
- Sawyer353
- Scranton387
- Selfridge198
- Selz30
- Sentinel Butte57
- Sharon101
- Sheldon89
- Shell Valley1,243
- Sherwood244
- Sheyenne198
- Sibley20
- Solen105
- Souris38
- South Heart503
- Spiritwood46
- Spiritwood Lake177
- Springbrook27
- St. John286
- St. Thomas306
- Stanley2,097
- Stanton470
- Starkweather50
- Steele757
- Strasburg534
- Streeter98
- Surrey1,721
- Sutton16
- Sykeston114
- Tappen295
- Taylor179
- Thompson1,138
- Tioga1,657
- Tolley35
- Tolna124
- Tower City304
- Towner467
- Trenton406
- Turtle Lake500
- Tuttle70
- Underwood699
- Upham102
- Valley City6,541
- Velva1,083
- Venturia75
- Verona116
- Voltaire43
- Wahpeton8,010
- Walcott272
- Wales2
- Walhalla865
- Warwick83
- Washburn1,507
- Watford City6,039
- West Fargo40,094
- Westhope435
- Wheatland70
- White Earth63
- White Shield246
- Wildrose260
- Williston28,056
- Willow City238
- Wilton607
- Wimbledon159
- Wing207
- Wishek849
- Wolford26
- Woodworth69
- Wyndmere509
- York6
- Ypsilanti55
- Zap200
- Zeeland96
Metro and micro areas
Each of the 8 that reach into North Dakota, with its whole population, from ACS 2020–2024 5-year estimates. Metro and micro areas are counties tied together by commuting, drawn by the Office of Management and Budget.
- Bismarck, ND Metro Area136,216
- Dickinson, ND Micro Area38,366
- Fargo, ND-MN Metro Area259,459
- Grand Forks, ND-MN Metro Area103,628
- Jamestown, ND Micro Area21,549
- Minot, ND Metro Area76,484
- Wahpeton, ND-MN Micro Area22,955
- Williston, ND Micro Area39,555
ZIP codes
Each of the 387 with people in it, by the town it's centered in, from ACS 2020–2024 5-year estimates. These are the Census Bureau's ZIP Code Tabulation Areas, which follow the Postal Service's ZIP codes as closely as census blocks allow.
- 58001Abercrombie232
- 58002Wheatland17
- 58004Amenia241
- 58005Argusville898
- 58006Arthur573
- 58007Ayr81
- 58008Barney188
- 58009Clifford48
- 58011Buffalo449
- 58012Casselton3,049
- 58013Cayuga43
- 58015Christine343
- 58016Clifford178
- 58017Cogswell296
- 58018Colfax428
- 58021Davenport584
- 58027Enderlin1,530
- 58029Erie88
- 58030Fairmount593
- 58031Alice301
- 58032Forman769
- 58033Englevale393
- 58035Galesburg212
- 58036Gardner360
- 58038Grandin179
- 58040Gwinner1,030
- 58041Hankinson1,389
- 58042Brooktree Park1,344
- 58043Havana168
- 58045Hillsboro2,239
- 58046Hope645
- 58047Horace5,636
- 58048Hunter505
- 58049Kathryn248
- 58051Kindred1,980
- 58052Leonard529
- 58053Lidgerwood1,409
- 58054Lisbon3,400
- 58056Luverne212
- 58057McLeod226
- 58058Mantador115
- 58059Casselton1,670
- 58060Milnor1,149
- 58061Mooreton369
- 58062Nome102
- 58063Oriska365
- 58064Page332
- 58065Pillsbury10
- 58067Rutland277
- 58068Sheldon134
- 58069Gwinner151
- 58071Tower City486
- 58072Valley City7,863
- 58074Mooreton63
- 58075Dwight9,046
- 58076Wahpeton427
- 58077Walcott684
- 58078West Fargo40,631
- 58079Wheatland504
- 58081Wyndmere876
- 58102Fargo32,912
- 58103Fargo48,796
- 58104Frontier49,168
- 58105Fargo2,825
- 58201Grand Forks42,373
- 58202Grand Forks2,865
- 58203Grand Forks16,478
- 58204Grand Forks AFB1,834
- 58205Grand Forks AFB153
- 58210Adams246
- 58212Aneta312
- 58214Grand Forks AFB387
- 58216Bathgate161
- 58218Buxton873
- 58219Caledonia175
- 58220Cavalier2,268
- 58222Crystal234
- 58223Buxton172
- 58224Dahlen28
- 58225Drayton1,053
- 58227Edinburg481
- 58228Emerado640
- 58229Fairdale97
- 58230Finley595
- 58231Fordville461
- 58233Forest River265
- 58235Gilby513
- 58236Hamilton31
- 58237Grafton4,994
- 58238Hamilton114
- 58239Hannah58
- 58240Hatton991
- 58241Canton City137
- 58243Hoople502
- 58244Inkster50
- 58249Langdon2,217
- 58250Lankin191
- 58251Larimore2,016
- 58254McVille588
- 58256Manvel705
- 58257Mayville2,180
- 58258Grand Forks AFB261
- 58259Michigan City393
- 58260Milton256
- 58261Ardoch1,442
- 58262Mountain125
- 58265Neche528
- 58266Niagara74
- 58267Northwood1,569
- 58269Osnabrock139
- 58270Park River1,816
- 58271Pembina654
- 58272Petersburg177
- 58273Pisek139
- 58274Portland930
- 58275Reynolds713
- 58276St. Thomas429
- 58277Sharon195
- 58278Thompson2,168
- 58281Wales57
- 58282Walhalla1,321
- 58301Devils Lake10,100
- 58310Mylo17
- 58311Loma60
- 58313Balta48
- 58316Belcourt5,865
- 58317Bisbee187
- 58318Bottineau3,792
- 58321Brocket140
- 58323Calvin72
- 58324Cando1,320
- 58325Churchs Ferry102
- 58327Crary414
- 58329East Dunseith2,769
- 58330Edmore437
- 58331Egeland139
- 58332Esmond182
- 58335Fort Totten1,177
- 58338Hampden106
- 58339Hansboro10
- 58341Harvey2,572
- 58343Knox67
- 58344Lakota1,115
- 58345Lawton120
- 58346Leeds606
- 58348Maddock793
- 58351Minnewaukan380
- 58352Munich436
- 58353Mylo76
- 58355Nekoma22
- 58356New Rockford1,627
- 58357Oberon440
- 58361Pekin220
- 58362Churchs Ferry13
- 58363Perth73
- 58365Rocklake157
- 58366Rolette738
- 58367Rolla1,453
- 58368Balta3,415
- 58369St. John1,069
- 58370Fort Totten1,108
- 58372Sarles122
- 58374Sheyenne703
- 58377Starkweather177
- 58379Warwick247
- 58380Tolna423
- 58381Warwick482
- 58382108
- 58384Willow City438
- 58385Wolford180
- 58386York64
- 58401Jamestown17,189
- 58402Jamestown91
- 58405Jamestown718
- 58413Ashley966
- 58415Berlin206
- 58416Binford384
- 58418Bowdon259
- 58420Buchanan449
- 58421Carrington2,969
- 58422Cathay174
- 58423Hurdsfield201
- 58424Cleveland453
- 58425Cooperstown1,384
- 58426Courtenay170
- 58428Dawson266
- 58429Dazey319
- 58430Denhoff49
- 58431Dickey101
- 58433Edgeley1,159
- 58436Ellendale1,697
- 58438Fessenden679
- 58439Forbes385
- 58440Fredonia205
- 58441Fullerton394
- 58442Gackle441
- 58443Glenfield152
- 58444Goodrich174
- 58445Grace City145
- 58448Hannaford290
- 58451Hurdsfield51
- 58452Jessie8
- 58454Jud414
- 58455Kensal336
- 58456Kulm703
- 58458LaMoure1,000
- 58460Lehr122
- 58461Litchville423
- 58463McClusky582
- 58464McHenry270
- 58466Marion486
- 58467Medina497
- 58472Montpelier527
- 58474Oakes2,656
- 58475Pettibone75
- 58476Pingree502
- 58477Regan145
- 58478Robinson148
- 58479Rogers194
- 58480Sanborn198
- 58481Spiritwood165
- 58482Steele960
- 58483Streeter281
- 58484Sutton93
- 58486Sykeston178
- 58487Tappen455
- 58488Tuttle172
- 58490Verona265
- 58492Wimbledon362
- 58494Wing431
- 58495Wishek1,129
- 58496Woodworth204
- 58497Ypsilanti255
- 58501Lincoln29,405
- 58503Bismarck37,683
- 58504Lincoln30,212
- 58505Bismarck22
- 58520Almont272
- 58521722
- 58523Beulah3,280
- 58524Braddock84
- 58528Cannon Ball677
- 58529Leith721
- 58530Center1,144
- 58531Coleharbor303
- 58532Driscoll199
- 58533Elgin830
- 58535Flasher500
- 58538Fort Yates2,171
- 58540White Shield2,634
- 58541Golden Valley467
- 58542Hague215
- 58544Hazelton549
- 58545Hazen3,313
- 58549Napoleon165
- 58552Linton1,531
- 58554Mandan29,479
- 58558Menoken899
- 58559Mercer411
- 58560297
- 58561Napoleon1,017
- 58562New Leipzig400
- 58563New Salem1,961
- 58564Raleigh102
- 58565Riverdale187
- 58566272
- 58568Selfridge544
- 58569Porcupine89
- 58570Solen437
- 58571Stanton754
- 58572316
- 58573Strasburg715
- 58575Turtle Lake910
- 58576Underwood1,063
- 58577Washburn1,954
- 58579Wilton1,001
- 58580Zap566
- 58581Zeeland263
- 58601Dickinson29,916
- 58620Amidon154
- 586211,161
- 58622Belfield1,653
- 58623Bowman1,953
- 58625Dodge231
- 58626Dunn Center482
- 58627189
- 58630Gladstone367
- 58631Glen Ullin953
- 58632Golva268
- 58634402
- 58636Halliday918
- 58638Hebron874
- 58639Hettinger1,762
- 586401,369
- 5864137
- 58642Manning422
- 58643Marmarth119
- 5864419
- 58645Medora320
- 58646Mott1,161
- 58647New England1,053
- 58649Reeder354
- 58650Regent434
- 58651Rhame513
- 58652Richardton1,244
- 58653Gascoyne700
- 58654Golva244
- 58655South Heart575
- 58656Taylor393
- 58701Minot33,086
- 58703Ruthville22,139
- 58704Minot AFB4,616
- 58705Minot AFB262
- 58707Minot500
- 58710Anamoose498
- 58711Antler137
- 58712Balfour61
- 58713Bantry181
- 58716Benedict308
- 58718Berthold886
- 58721Bowbells517
- 58722Des Lacs1,366
- 58723Butte244
- 58725Carpio419
- 58727Columbus168
- 58730Crosby1,306
- 58731Deering271
- 58733Des Lacs331
- 58734Donnybrook202
- 58735Douglas565
- 58736Drake475
- 58737Flaxton107
- 58740Glenburn669
- 58741Granville615
- 58744Karlsruhe87
- 58746Kenmare1,556
- 58748Kramer138
- 58750Lansford606
- 58752Lignite292
- 58755McGregor133
- 58756Makoti165
- 58757Mandaree986
- 58758Martin303
- 58759Max756
- 58760Maxbass239
- 58761Mohall893
- 58762Newburg193
- 58763Four Bears Village4,426
- 58765Noonan459
- 58768Surrey241
- 58769Palermo154
- 58770Parshall1,369
- 58771Plaza585
- 58772Portal154
- 58773Powers Lake1,036
- 58775White Shield218
- 58776Ross264
- 58778Ruso187
- 58779Ryder343
- 58781Sawyer773
- 58782Sherwood499
- 58783Souris294
- 58784Stanley2,756
- 58785Surrey1,816
- 58787Tolley83
- 58788Towner884
- 58789Upham472
- 58790Velva1,638
- 58792Bergen243
- 58793Westhope605
- 58794White Earth148
- 58795Wildrose414
- 58801Williston34,277
- 58830Alamo66
- 58831Alexander1,089
- 58833Ambrose67
- 58835Arnegard839
- 58838East Fairview252
- 58843Epping676
- 58844Fortuna81
- 58845Grenora584
- 58847209
- 58849Ray1,101
- 58852Tioga2,087
- 58853Trenton354
- 58854Watford City9,368
- 58856211
Towns and townships
Each of the 1,170 with people in it, from ACS 2020–2024 5-year estimates: the county subdivisions that are governments of their own. A city, borough or village that is one too is listed with the places above.
- Abercrombie township401
- Acme township16
- Acton township114
- Ada township77
- Adams township18
- Addie township67
- Addison township103
- Adler township7
- Adrian township169
- Advance township200
- Afton township800
- Agnes township24
- Akra township193
- Albert township27
- Albertha township1
- Albion township46
- Alex township343
- Alexander township6
- Alexandria township3
- Alexanter township43
- Alger township113
- Aliceton township133
- Alleghany township31
- Allen township42
- Allendale township595
- Alma township38
- Alta township103
- Ambrose township34
- Amenia township68
- Americus township130
- Amity township38
- Amundsville township36
- Anamoose township62
- Anderson township11
- Andrews township116
- Anna township51
- Antelope Creek township69
- Antelope Lake township40
- Antelope township115
- Antler township41
- Apple Creek township3,490
- Ardoch township79
- Armourdale township1
- Arne township22
- Arthur township44
- Arvilla township188
- Ashby township6
- Ashland township59
- Ashtabula township43
- Athens township12
- Aurora township20
- Avon township159
- Ayr township67
- Baden township18
- Badger township94
- Baer township64
- Baker township3
- Bale township63
- Balfour township21
- Ball Hill township75
- Banner township (Cavalier County)4
- Banner township (Mountrail County)78
- Bantry township25
- Barney township111
- Barr Butte township12
- Barrie township262
- Bartlett township68
- Bartley township44
- Bathgate township48
- Battleview township83
- Beach township266
- Bear Creek township178
- Beaulieu township136
- Beaver Creek township104
- Beaver township6
- Beery township2
- Beisigl township31
- Belford township145
- Bell township40
- Belmont township160
- Bentinck township29
- Bentru township41
- Bergen township129
- Berlin township (Cass County)138
- Berlin township (Sheridan County)70
- Berlin township (Wells County)59
- Berthold township101
- Bicker township89
- Big Bend township (Mountrail County)81
- Big Bend township (Ransom County)265
- Billings township28
- Bilodeau township26
- Bingham township44
- Binghampton township15
- Bjornson township89
- Black Butte township5
- Black Loam township10
- Blacktail township93
- Blackwater township79
- Blaine township79
- Blanchard township85
- Bloom township362
- Bloomenfield township15
- Bloomfield township64
- Blooming Prairie township6
- Blooming township235
- Blooming Valley township97
- Blue Butte township69
- Blue Ridge township13
- Bluebird township29
- Bohnsack township39
- Bonetraill township5
- Boone township25
- Border township77
- Bordulac township2
- Bowbells township38
- Bowen township52
- Bowman township193
- Boyd township81
- Boyesen township51
- Brampton township34
- Brandenburg township88
- Brander township36
- Brandon township16
- Bremen township27
- Brenna township929
- Brightwood township117
- Brillian township117
- Brimer township10
- Brittian township9
- Broadlawn township45
- Broadview township43
- Broe township31
- Brookbank township171
- Brooklyn township47
- Brown township30
- Bruce township10
- Bryan township26
- Bucephalia township33
- Buchanan township79
- Buckeye township39
- Bucklin township9
- Bucyrus township35
- Buena Vista township33
- Buffalo township92
- Buford township104
- Bull Moose township1
- Bullion township39
- Bunker township30
- Burke township8
- Burlington township240
- Burt township60
- Bush township63
- Butte Valley township33
- Buxton township129
- Byersville township40
- Byron township15
- Caledonia township225
- Callahan township6
- Cameron township285
- Campbell township (Emmons County)26
- Campbell township (Hettinger County)35
- Cando township90
- Canfield township9
- Captain's Landing township29
- Carbondale township40
- Carlisle township95
- Carpenter township53
- Carpio township40
- Carrington township278
- Carroll township18
- Casey township157
- Cash township39
- Casselton township37
- Castle Rock township33
- Cathay township60
- Cato township14
- Cavalier township426
- Cedar Creek township62
- Center township324
- Central township27
- Chain Lakes township64
- Champion township16
- Chaseley township13
- Chatfield township18
- Cherry Lake township66
- Chester township75
- Chicago township42
- Christiania township45
- Clara township7
- Clay township75
- Clayton township29
- Clear Lake township (Burleigh County)18
- Clear Lake township (Kidder County)38
- Clearfield township9
- Cleary township31
- Clement township95
- Clermont township12
- Cleveland township129
- Clifton township58
- Climax township73
- Coalfield township3
- Coburn township30
- Colfax township147
- Colgate township20
- Colquhoun township107
- Colville township113
- Colvin township79
- Connor township41
- Coolin township26
- Cooperstown township78
- Corinne township51
- Cornell township61
- Corwin township62
- Cottonwood Lake township10
- Cottonwood township6
- Coulee township4
- Courtenay township9
- Crane Creek township122
- Crawford township74
- Creel township1,556
- Crocus township30
- Crofte township152
- Cromwell township16
- Crown Hill township18
- Crystal Lake township13
- Crystal Springs township85
- Crystal township67
- Cuba township50
- Cusator township124
- Cypress township34
- Dahlen township43
- Dale township2
- Dalen township73
- Daneville township19
- Danton township100
- Darling Springs township18
- Dash township69
- Davenport township213
- Dayton township104
- Dazey township104
- De Groat township25
- Dean township137
- Debing township28
- Deep River township68
- Deepwater township22
- Deer Lake township22
- Deering township150
- Delger township24
- Delhi township38
- Denbigh township8
- Denhoff township11
- Denmark township17
- Denver township36
- Des Lacs township158
- Devillo township57
- Dewey township22
- Dexter township100
- Dimond township2
- Divide township143
- Dodds township70
- Dogden township54
- Dover township56
- Dows township3
- Drayton township2
- Dresden township52
- Driscoll township109
- Dry Lake township13
- Dublin township55
- Duck Creek township38
- Duerr township141
- Dunbar township92
- Dundee township124
- Durbin township61
- Durham township66
- Dwight township430
- Eagle township113
- East Alma township9
- East Fork township32
- Eastman township28
- Easton township53
- Eckelson township58
- Ecklund township121
- Eddy township42
- Eden township26
- Eden Valley township28
- Edendale township24
- Edgemont township56
- Edmunds township141
- Edna township96
- Egan township117
- Egg Creek township57
- Eidsvold township10
- Elden township25
- Eldon township48
- Eldorado township105
- Eldred township65
- Eldridge township84
- Elgin township141
- Elkhorn township9
- Elkmount township37
- Ellendale township246
- Elling township15
- Elliott township57
- Ellsbury township144
- Elm Grove township100
- Elm township (Dickey County)73
- Elm township (Grant County)67
- Elm Tree township126
- Elma township90
- Elmdale township62
- Elms township136
- Elora township37
- Elverum township38
- Elysian township46
- Empire township57
- Enger township71
- Ensign township83
- Enterprise township6
- Equality township19
- Erie township80
- Ervin township165
- Esmond township7
- Estabrook township138
- Estherville township54
- Eureka township109
- Everest township98
- Excelsior township45
- Fairbanks township27
- Fairfield township280
- Fairmount township76
- Fairview township2
- Fairville township15
- Falconer township203
- Fancher township25
- Farina township56
- Farmington township94
- Farmvale township83
- Fay township8
- Felson township68
- Ferry township237
- Fertile township (Mountrail County)50
- Fertile township (Walsh County)135
- Fertile Valley township7
- Field township40
- Fillmore township17
- Finley township15
- Fischbein township17
- Fisher township11
- Flint township63
- Florance township14
- Foothills township6
- Forest River township48
- Forman township26
- Fort Ransom township157
- Forthun township6
- Forward township217
- Foxholm township39
- Fram township83
- Francis township40
- Franklin township7
- Frazier township100
- Freda township48
- Frederick township6
- Freeborn township88
- Freedom township121
- Freeman township30
- Fremont township189
- Freshwater township25
- Fried township117
- Galesburg township137
- Garborg township44
- Gardar township35
- Gardner township120
- Garfield township142
- Garner township10
- Garness township98
- Gascoyne township48
- Gasman township48
- Gate township85
- Gates township20
- Gerber township25
- Germantown township15
- Getchell township24
- Ghylin township39
- Gibbs township2,836
- Gilby township87
- Gill township131
- Gilmore township28
- Gilstrap township16
- Glacier township5
- Gladstone township122
- Glen township42
- Glendale township101
- Glenfield township68
- Glenila township3
- Glenmore township17
- Glenview township193
- Glenwood township179
- Golden Glen township161
- Golden Lake township122
- Golden township47
- Goldfield township19
- Good Luck township13
- Gordon township9
- Grace township77
- Graf township7
- Grafton township213
- Grail township133
- Grainfield township14
- Grand Forks township590
- Grand Harbor township116
- Grand Prairie township45
- Grand Rapids township59
- Grand Valley township21
- Grandfield township60
- Grandview township19
- Grant township154
- Granville township47
- Grass Lake township7
- Grassland township43
- Gray township4
- Greatstone township16
- Greely township7
- Green township137
- Greenbush township14
- Greendale township162
- Greene township28
- Greenfield township (Griggs County)80
- Greenfield township (Traill County)101
- Greenland township120
- Greenview township135
- Greenville township84
- Grenora township9
- Grey township75
- Griffin township177
- Grilley township33
- Gunkel township156
- Gutschmidt township20
- Haaland township28
- Hagel township149
- Haley township11
- Hall township123
- Hamburg township55
- Hamilton township44
- Hamlet township40
- Hamlin township11
- Hammer township65
- Hanson township11
- Haram township92
- Harding township17
- Hardscrabble township19
- Harlem township119
- Harmonious township52
- Harmony township61
- Harriet-Lein township44
- Harrison township2,189
- Harriston township171
- Harvey township42
- Harwood township289
- Hastings township91
- Haven township3
- Hawkeye township (Divide County)8
- Hawkeye township (McKenzie County)14
- Hawksnest township51
- Hay Creek township4,348
- Hay township15
- Haynes township43
- Hazel Grove township9
- Hazel township12
- Hebron township65
- Hegton township371
- Heimdal township46
- Helena township22
- Helendale township76
- Hemen township44
- Henderson township55
- Hendrickson township21
- Henrietta township65
- Henry township15
- Herberg township47
- Herman township10
- Hesper township69
- Hettinger township136
- Hidden township65
- Hiddenwood township11
- Highland Center township83
- Highland township (Cass County)89
- Highland township (Hettinger County)9
- Highland township (Sheridan County)17
- Hill township97
- Hillsboro township84
- Hillsdale township (Eddy County)42
- Hillsdale township (Wells County)32
- Hilton township107
- Hobart township187
- Homen township69
- Homer township336
- Homestead township100
- Hope township14
- Horseshoe Valley township6
- Howe township10
- Howell township21
- Howes township49
- Howie township79
- Hudson township76
- Hugo township8
- Hume township16
- Hunter township64
- Hurley township64
- Huron township33
- Ibsen township70
- Idaho township230
- Illinois township32
- Impark township12
- Inkster township85
- Iosco township5
- Iota Flat township50
- Isabel township2
- Island Park township273
- Isley township35
- Ivanhoe township13
- Jackson township22
- Janke township14
- Jefferson township186
- Jim River Valley township198
- Johnson township38
- Johnstown township99
- Joliette township21
- Judson township577
- Kandiyohi township51
- Kane township92
- Karlsruhe township5
- Keene township25
- Keller township25
- Kelso township140
- Kenmare township212
- Kennedy township39
- Kennison township118
- Kensal township12
- Kensington township206
- Kent township18
- Kentner township139
- Kern township22
- Keystone township21
- Kickapoo township15
- Kingsley township28
- Kingston township61
- Kinloss township33
- Kinyon township121
- Kirkelie township344
- Klingstrup township9
- Knife River township88
- Knox township37
- Kohlmeier township12
- Kottke Valley township35
- Kunze township83
- La Moure township48
- Lake George township18
- Lake Hester township21
- Lake Ibsen township4
- Lake Town township80
- Lake township10
- Lake Washington township56
- Lake Williams township (Kidder County)34
- Lake Williams township (McLean County)85
- Lakeview township4
- Lakeville township149
- Lakota township35
- Lallie township388
- LaMars township155
- Lampton township155
- Land township34
- Langberg township20
- Langdon township4
- Lansford township89
- Lansing township1
- Larimore township63
- Lark township72
- Larrabee township37
- Latona township5
- Lawton township9
- Layton township261
- Lebanon township58
- Lee township96
- Leeds township24
- Leipzig township13
- Lenora township55
- Lenton township39
- Leonard township47
- Leval township35
- Levant township125
- Lewis township31
- Liberty Grove township133
- Liberty township (Mountrail County)40
- Liberty township (Ransom County)128
- Lillehoff township43
- Lincoln Dale township21
- Lincoln township25
- Lincoln Valley township37
- Lind township22
- Lindaas township44
- Lindahl township53
- Linden township15
- Linton township21
- Lippert township50
- Litchville township28
- Little Deep township15
- Loam township36
- Lockwood township39
- Lodema township108
- Logan Center township83
- Logan township3
- Lohnes township172
- Lone Tree township182
- Long Creek township114
- Long Lake township121
- Longfellow township191
- Longview township146
- Loquemont township82
- Loretta township24
- Lorraine township3
- Lovell township41
- Lowland township30
- Lucy township143
- Lund township109
- Lyon township7
- Mabel township71
- Madison township67
- Maine township6
- Malcolm township34
- Mandan township38
- Manfred township85
- Manilla township34
- Manitou township32
- Manning township70
- Manns township52
- Mansfield township19
- Maple River township92
- Maple township48
- Mapleton township250
- Marboe township5
- Margaret township98
- Marion township8
- Marsh township123
- Marshall township56
- Marstonmoor township19
- Martin township (Sheridan County)118
- Martin township (Walsh County)90
- Maryland township33
- Mauch township14
- Mayland township77
- Mayville township134
- Maza township4
- McClellan township12
- McClusky township79
- McGahan township36
- McGinnis township171
- McHenry township37
- McKenzie township79
- McKinley township155
- McKinney township46
- McKinnon township27
- Meadow Lake township155
- Meadow township106
- Medford township47
- Medicine Hill township33
- Mekinock township2,221
- Melrose township31
- Melville township78
- Menoken township246
- Mentor township5
- Menz township17
- Mercer township19
- Merkel township226
- Merrill township12
- Meyer township155
- Michigan township (Grand Forks County)209
- Michigan township (Nelson County)83
- Midland township47
- Midway township563
- Mikkelson township87
- Milnor township79
- Minco township55
- Mineral Springs township9
- Minnesota township51
- Minnewaukan township233
- Minnie Lake township18
- Minnie township45
- Mission township943
- Missouri Ridge township1,199
- Missouri township186
- Model township67
- Monroe township15
- Montpelier township92
- Montrose township8
- Moon Lake township73
- Moord township6
- Moore township128
- Mooreton township135
- Moraine township124
- Moran township34
- Morgan township119
- Morton township157
- Mott township101
- Mound township47
- Mount Carmel township37
- Mount Rose township13
- Mount View township45
- Mountrail township15
- Munster township70
- Myrtle township18
- Nansen township41
- Nash township25
- Naughton township161
- Nebo township72
- Neche township26
- Nedrose township2,196
- Nelson township50
- Nesheim township90
- Ness township63
- Nesson Valley township46
- New City township58
- New England township79
- New Germantown/Schiller township66
- New Prairie township911
- New Rockford township38
- Newborg township42
- Newbre township45
- Newburgh township60
- Newbury township50
- Newland township19
- Newman township122
- Newport township64
- Niagara township59
- Noble township45
- Nogosek township34
- Noltimier township79
- Noonan township18
- Nora township63
- Norden township84
- Nordmore township23
- Norma township17
- Normal township42
- Normania township40
- Normanna township490
- North Creel township434
- North Loma township21
- North Olga township17
- North Prairie township83
- North Star township34
- North Viking township34
- Northfield township42
- Northland township45
- Northwest township (Dickey County)107
- Northwest township (Kidder County)8
- Northwood township74
- Norton township45
- Norway Lake township75
- Norway township93
- Norwich township103
- Oakhill township57
- Oakville township132
- Oakwood township194
- Oberon township64
- Odessa township (Hettinger County)8
- Odessa township (Ramsey County)5
- Odin township30
- Oliver township26
- Olivia township97
- Ontario township105
- Ops township63
- Ora township54
- Orange township26
- Oriska township96
- Orlien township23
- Osago township26
- Osborn township117
- Osford township153
- Oshkosh township51
- Osloe township37
- Osnabrock township38
- Ostby township50
- Otis township101
- Overland township54
- Ovid township24
- Page township100
- Painted Woods township144
- Palmer township142
- Paradise township16
- Paris township8
- Park township41
- Parshall township87
- Paulson township7
- Peace township13
- Peaceful Valley township13
- Pearl Lake township68
- Pearl township10
- Pelican township21
- Pembina township30
- Perry township29
- Perth township13
- Petersburg township10
- Peterson township15
- Pettibone township10
- Pherrin township572
- Pickering township80
- Picton township48
- Pierce township114
- Pingree township92
- Pipestem Valley township37
- Plain township104
- Plainview township34
- Plaza township49
- Pleasant Lake township23
- Pleasant Prairie township8
- Pleasant township452
- Pleasant Valley township77
- Pleasant View township78
- Plymouth township14
- Pontiac township86
- Poplar Grove township261
- Port Emma township43
- Portal township49
- Porter township25
- Potsdam township28
- Potter township6
- Powers Lake township152
- Powers township45
- Prairie Centre township50
- Prairie township61
- Pratt township38
- Prescott township2
- Preston township60
- Pretty Rock township7
- Primrose township42
- Progress township15
- Prophets township33
- Prospect township11
- Prosperity township120
- Pulaski township52
- Purcell township23
- Rainy Butte township26
- Raleigh township26
- Randolph township9
- Ransom township123
- Raritan township96
- Ray township44
- Raymond township171
- Red Lake township28
- Redmond township43
- Ree township5
- Reed township1,009
- Reeder township59
- Renville township21
- Rexine township9
- Rhame township4
- Rice Lake township40
- Rich township42
- Rich Valley township49
- Richburg township4
- Richland township45
- Richmond township38
- Rifle township101
- Riga township93
- Riggin township38
- Riverdale township40
- Riverside township9
- Robinson township7
- Rochester township45
- Rock Hill township4
- Rock Lake township17
- Rock township (Benson County)43
- Rock township (Grant County)21
- Rockford township45
- Rogers township37
- Roland township777
- Rolling Green township69
- Rolling Prairie township26
- Roloff township13
- Romness township6
- Roscoe township9
- Rose Hill township (Foster County)62
- Rose Hill township (McHenry County)60
- Rose township32
- Rosebud township34
- Rosefield township85
- Roseglen township58
- Roseland township26
- Rosemeade township70
- Rosemont township16
- Rosendal township16
- Rosenfield township12
- Roseville township89
- Round Lake township15
- Round Prairie township95
- Round Top township4
- Royal township5
- Rubin township8
- Rugh township17
- Rush Lake township27
- Rush River township50
- Rushford township55
- Rushville township37
- Russell township38
- Rutland township35
- Ryan township47
- Ryder township52
- Rye township472
- Saddle Butte township21
- Saline township40
- Sand Creek township51
- Sandoun township136
- Saratoga township9
- Sargent township18
- Sarnia township29
- Sauk Prairie township39
- Sauk Valley township132
- Sauter township17
- Sawyer township241
- Scandia township35
- Schiller township8
- Schrunk-Steiber township18
- Scorio township144
- Scotia township62
- Scranton township66
- Sealy township25
- Seivert township6
- Sentinel township7
- Sergius township30
- Severn township65
- Sharlow township58
- Sharon township27
- Shealy township19
- Sheets township6
- Sheldon township23
- Shell township58
- Shell Valley township481
- Shenford township100
- Shepherd township49
- Sherbrooke township50
- Sheridan township20
- Sherman township41
- Sheyenne township90
- Short Creek township24
- Shuman township32
- Sibley Butte township3
- Sibley township55
- Sibley Trail township84
- Sidney township35
- Sikes township123
- Silver Lake township6
- Silvesta township79
- Sinclair township33
- Sioux township221
- Sioux Trail township42
- Skandia township8
- Smoky Butte township18
- Snow township83
- Solon township32
- Soo township35
- Sorenson township22
- Sorkness township55
- South Cottonwood township57
- South Dresden township29
- South Fork township13
- South Minnewaukan township82
- South Olga township46
- South Valley township23
- South Viking township56
- Southwest township18
- Speedwell township15
- Spencer township42
- Sperry/Goodrich township29
- Spiritwood township46
- Spring Coulee township39
- Spring Creek township68
- Spring Grove township34
- Spring Lake township2
- Springbrook township166
- Springer township105
- Springfield township18
- Springvale township12
- St. Andrews township61
- St. Croix township7
- St. Joseph township62
- St. Mary township168
- St. Marys township6
- St. Paul township26
- St. Thomas township106
- Stanley township276
- Star township26
- Starbuck township9
- Stavanger township92
- Steiner township13
- Sterling township151
- Stevens township171
- Stewart township62
- Stillwater township35
- Stirton township47
- Stone Creek township20
- Stony Creek township727
- Storlie township19
- Strabane township55
- Strandahl township75
- Strassburg township28
- Streeter township37
- Strege township100
- Strehlow township11
- Strong township32
- Sullivan township20
- Summit township202
- Sundre township727
- Sunny Slope township10
- Superior township11
- Surrey township395
- Svea township6
- Sverdrup township57
- Swede township12
- Sydna township76
- Sydney township67
- Sykeston township9
- Tacoma township125
- Taft township36
- Talbot township90
- Tanner township6
- Tappen township21
- Tatman township2,730
- Taylor Butte township10
- Taylor township23
- Teddy township8
- Telfer township98
- Tepee Butte township98
- Tewaukon township53
- Thelma township8
- Thingvalla township113
- Thordenskjold township22
- Thorson township18
- Tiber township71
- Tiffany township82
- Tioga township49
- Tolgen township11
- Torgerson township84
- Torning township30
- Tower township96
- Trenton township590
- Tri township238
- Trier township36
- Triumph township30
- Troy township110
- Truax township217
- Trygg township14
- Tuller township88
- Turtle Lake township32
- Turtle River township155
- Tuscarora township80
- Tuttle township56
- Twelve Mile township80
- Twin Hill township21
- Twin Lake township9
- Twin Tree township88
- Twin Valley township185
- Tyrol township156
- Union township143
- Uxbridge township70
- Vale township84
- Valhalla township10
- Valley Spring township13
- Valley township (Barnes County)589
- Valley township (Dickey County)101
- Valley township (Kidder County)47
- Van Buren township17
- Van Hook township296
- Van Meter township141
- Vanville township42
- Velva township227
- Verner township39
- Vernon township (Kidder County)71
- Vernon township (Walsh County)3
- Vesta township11
- Victor township7
- Victoria township33
- View township66
- Viking township (Richland County)16
- Viking township (Traill County)134
- Villard township10
- Virginia township6
- Vivian township93
- Voltaire township26
- Wadsworth township27
- Wagendorf township2
- Walburg township207
- Walcott township431
- Waldo township67
- Walhalla township40
- Walker township23
- Walle township352
- Walsh Centre township214
- Walshville township113
- Walters township61
- Wamduska township114
- Wano township28
- Ward township15
- Warren township116
- Warwick township108
- Washburn township132
- Washington township111
- Waterford township2,302
- Waterloo township49
- Watson township42
- Wayne township21
- Weber township52
- Webster township53
- Weimer township20
- Weiser township23
- Weld township184
- Wellington township52
- Wells township106
- West Antelope township20
- West Bank township75
- West Bay township55
- West End township29
- West Norway township73
- West Ontario township20
- Westby township11
- Western township126
- Westfield township55
- Wheatfield township47
- Wheatland township150
- Wheaton township56
- Wheelock township34
- White Ash township34
- White Earth township26
- White Lake township9
- White township65
- Whitestone Hill township33
- Whiting township52
- Whitteron township570
- Wild Rose township18
- Willey township173
- Williams township29
- Willis township155
- Williston township2,430
- Willow Creek township22
- Willow Lake township52
- Willow township61
- Willowbank township122
- Wilson township3
- Windsor township129
- Winfield township93
- Wing township20
- Winner township4
- Winona township2
- Wise township113
- Wiser township42
- Wold township70
- Wolf Butte township25
- Wood Lake township537
- Woodberry township16
- Woodbury township172
- Woodlawn township62
- Woodward township68
- Wright township121
- Wyndmere township95
- Yellowstone township474
- York township16
- Yorktown township48
- Young township4
- Ypsilanti township66
- Zion township69
School districts
Each of the 169 with people in it, from ACS 2020–2024 5-year estimates. Elementary districts teach the lower grades and secondary districts the upper ones, under them; the rest are unified, teaching every grade.
- Alexander Public School District 21,000
- Anamoose Public School District 14553
- Apple Creek Public School District 39elementary1,244
- Ashley Public School District 9924
- Bakker Public School District 10elementary177
- Barnes County North Public School District 71,520
- Beach Public School District 31,325
- Belcourt Public School District 75,306
- Belfield Public School District 131,171
- Beulah Public School District 274,509
- Billings County Public School District 1elementary1,024
- Bismarck Public School District 196,672
- Bottineau Public School District 14,041
- Bowbells Public School District 14542
- Bowman County Public School District 12,510
- Burke Central Public School District 36641
- Carrington Public School District 493,438
- Cavalier Public School District 62,456
- Center-Stanton Public School District 12,132
- Central Cass Public School District 174,084
- Central Valley Public School District 31,674
- Dakota Prairie Public School District 12,114
- Devils Lake Public School District 111,125
- Dickinson Public School District 128,887
- Divide County Public School District 12,128
- Drake Public School District 57617
- Drayton Public School District 19930
- Dunseith Public School District 12,871
- Earl Public School District 18elementary108
- Edgeley Public School District 31,389
- Edmore Public School District 2646
- Eight Mile Public School District 6732
- Elgin-New Leipzig Public School District 491,237
- Ellendale Public School District 401,996
- Emerado Public School District 127elementary760
- Enderlin Area Public School District 241,909
- Fairmount Public School District 18441
- Fargo Public School District 198,826
- Fessenden-Bowdon Public School District 251,047
- Finley-Sharon Public School District 19823
- Flasher Public School District 39773
- Fordville-Lankin Public School District 5550
- Fort Ransom Public School District 6elementary357
- Fort Totten Public School District 301,599
- Fort Yates Public School District 42,409
- Gackle-Streeter Public School District 56973
- Garrison Public School District 512,445
- Glen Ullin Public School District 48988
- Glenburn Public School District 261,029
- Grafton Public School District 185,347
- Grand Forks Public School District 162,532
- Grenora Public School District 99996
- Griggs County Central School District 181,725
- Hankinson Public School District 81,661
- Harvey Public School District 382,876
- Hatton-Eielson Public School District 7996
- Hazelton-Moffit-Braddock Public School District 6906
- Hazen Public School District 33,075
- Hebron Public School District 13886
- Hettinger Public School District 131,979
- Hillsboro Public School District 92,507
- Hope-Page Public School District 851,194
- Horse Creek Public School District 32elementary149
- Jamestown Public School District 118,017
- Kenmare Public School District 281,734
- Kensal Public School District 19338
- Kidder County School District 12,388
- Killdeer Public School District 162,739
- Kindred Public School District 24,351
- Kulm Public School District 71,000
- Lakota Public School District 661,323
- LaMoure Public School District 81,597
- Langdon Area Public School District 232,817
- Larimore Public School District 442,534
- Leeds Public School District 6706
- Lewis and Clark Public School District 1611,915
- Lidgerwood Public School District 281,286
- Linton Public School District 361,509
- Lisbon Public School District 193,636
- Litchville-Marion Public School District 461,111
- Little Heart Public School District 4elementary353
- Lone Tree Public School District 6elementary328
- Maddock Public School District 9917
- Mandan Public School District 129,306
- Mandaree Public School District 36915
- Manning Public School District 45elementary186
- Manvel Public School District 125elementary1,272
- Maple Valley Public School District 41,694
- Mapleton Public School District 7elementary1,645
- Marmarth Public School District 12elementary148
- Max Public School District 501,617
- May-Port CG Public School District 143,548
- McClusky-Goodrich Public School District 29874
- McKenzie County Public School District 111,189
- Medina Public School District 3847
- Menoken Public School District 33elementary435
- Midkota Public School District 7996
- Midway Public School District 1281,262
- Milnor Public School District 21,058
- Minnewaukan Public School District 5422
- Minot Public School District 154,390
- Minto Public School District 201,328
- Mohall-Lansford-Sherwood Public School District 12,005
- Montpelier Public School District 14566
- Mott-Regent Public School District 11,588
- Mount Pleasant Public School District 41,745
- Munich Public School District 19555
- Napoleon Public School District 21,324
- Naughton Public School District 25elementary74
- Nedrose Public School District 44,178
- Nesson Public School District 21,830
- New England Public School District 91,610
- New Rockford-Sheyenne Public School District 22,129
- New Salem-Almont School District1,885
- New Town Public School District 14,251
- Newburg United Public School District 54674
- North Border School District 1002,765
- North Sargent Public School District 31,116
- North Star School District1,796
- Northern Cass Public School District 972,486
- Northwood Public School District 1291,717
- Oakes Public School District 412,767
- Oberon Public School District 16elementary179
- Park River Area Public School District 82,362
- Parshall Public School District 31,452
- Pingree-Buchanan Public School District 10920
- Powers Lake Public School District 271,116
- Richardton-Taylor Public School District 341,689
- Richland Public School District 441,579
- Rolette Public School District 29938
- Roosevelt Public School District 18elementary765
- Rugby Public School District 53,689
- Sargent Central Public School District 61,566
- Sawyer Public School District 16983
- Scranton Public School District 33930
- Selfridge Public School District 8392
- Solen Public School District 3982
- South Heart Public School District 91,656
- South Prairie Public School District 70965
- St. John Public School District 31,374
- Stanley Public School District 23,189
- Starkweather Public School District 44249
- Sterling Public School District 35elementary396
- Strasburg Public School District 15829
- Surrey Public School District 412,376
- Sweet Briar Public School District 17elementary143
- TGU Public School District 602,517
- Thompson Public School District 612,516
- Tioga Public School District 152,342
- Turtle Lake-Mercer Public School District 721,351
- Twin Buttes Public School District 37elementary334
- Underwood Public School District 81,604
- United Public School District 72,614
- Valley City Public School District 27,959
- Valley-Edinburg Public School District 1181,353
- Velva Public School District 12,202
- Wahpeton Public School District 379,471
- Warwick Public School District 291,323
- Washburn Public School District 42,131
- West Fargo Public School District 681,521
- Westhope Public School District 17728
- White Shield Public School District 85527
- Williston Basin Public School District 734,018
- Wilton Public School District 11,407
- Wing Public School District 28486
- Wishek Public School District 191,246
- Wyndmere Public School District 421,244
- Yellowstone Public School District 14elementary695
- Zeeland Public School District 4260
State senate districts
The upper chamber’s districts, as drawn in 2024.
- State Senate District 115,583
- State Senate District 214,488
- State Senate District 315,622
- State Senate District 415,256
- State Senate District 516,629
- State Senate District 617,675
- State Senate District 717,402
- State Senate District 818,000
- State Senate District 917,058
- State Senate District 1018,857
- State Senate District 1117,151
- State Senate District 1215,271
- State Senate District 1317,635
- State Senate District 1415,825
- State Senate District 1516,592
- State Senate District 1616,233
- State Senate District 1716,289
- State Senate District 1816,065
- State Senate District 1917,116
- State Senate District 2016,967
- State Senate District 2117,489
- State Senate District 2216,974
- State Senate District 2316,776
- State Senate District 2416,416
- State Senate District 2516,642
- State Senate District 2616,099
- State Senate District 2718,767
- State Senate District 2817,115
- State Senate District 2916,701
- State Senate District 3015,984
- State Senate District 3115,065
- State Senate District 3217,642
- State Senate District 3317,816
- State Senate District 3418,172
- State Senate District 3518,323
- State Senate District 3615,064
- State Senate District 3716,126
- State Senate District 3816,296
- State Senate District 3915,706
- State Senate District 4015,756
- State Senate District 4117,159
- State Senate District 4216,889
- State Senate District 4315,359
- State Senate District 4418,698
- State Senate District 4517,225
- State Senate District 4617,212
- State Senate District 4715,656
State house districts
The lower chamber’s districts, as drawn in 2024.
- State House District 115,583
- State House District 214,488
- State House District 315,622
- State House District 4A7,267
- State House District 4B7,989
- State House District 516,629
- State House District 617,675
- State House District 717,402
- State House District 818,000
- State House District 917,058
- State House District 1018,857
- State House District 1117,151
- State House District 1215,271
- State House District 1317,635
- State House District 1415,825
- State House District 1516,592
- State House District 1616,233
- State House District 1716,289
- State House District 1816,065
- State House District 1917,116
- State House District 2016,967
- State House District 2117,489
- State House District 2216,974
- State House District 2316,776
- State House District 2416,416
- State House District 2516,642
- State House District 2616,099
- State House District 2718,767
- State House District 2817,115
- State House District 2916,701
- State House District 3015,984
- State House District 3115,065
- State House District 3217,642
- State House District 3317,816
- State House District 3418,172
- State House District 3518,323
- State House District 3615,064
- State House District 3716,126
- State House District 3816,296
- State House District 3915,706
- State House District 4015,756
- State House District 4117,159
- State House District 4216,889
- State House District 4315,359
- State House District 4418,698
- State House District 4517,225
- State House District 4617,212
- State House District 4715,656
PUMAs
Public Use Microdata Areas: areas of 100,000 people or more that the state draws from census tracts, for the Census Bureau’s microdata.
Urban areas
Each that reaches into North Dakota, with its whole population. Urban areas are the densely settled land the Census Bureau draws after each census, whatever the city lines.
- Bismarck, ND99,813
- Devils Lake, ND7,632
- Dickinson, ND25,207
- Fargo, ND–MN224,096
- Grand Forks, ND–MN67,973
- Jamestown, ND15,203
- Minot, ND50,688
- Valley City, ND6,541
- Wahpeton, ND–MN11,292
- Watford City, ND5,882
- Williston, ND28,145
Tribal areas
Each that reaches into North Dakota, with its whole population.
Turn North Dakota into your planning report.
Social Explorer Studio builds an editable profile of any place, with tables and charts beside the county and state, and exports to Word, PDF and Excel.
Questions about North Dakota
What is the population of North Dakota?
799,358 people, according to the ACS 2025 1-year estimates, which the Census Bureau adjusts to match its own population estimate. That’s the 47th largest of the 50 states and DC.
What is the FIPS code for North Dakota?
38. Every county’s and place’s FIPS code in North Dakota starts with it. The Census Bureau’s full geographic identifier (GEOID) is 0400000US38.
What is the largest city in North Dakota?
Fargo, with 136,295 people. Other large cities here include Bismarck, Grand Forks and Minot.
What is the median household income in North Dakota?
$81,545 (±$2,073), according to the ACS 2025 1-year estimates, lower than the US ($84,780).
What is the median age in North Dakota?
37.4 years (±0.5), according to the ACS 2025 1-year estimates, lower than the US (39.5).
How much does housing cost in North Dakota?
North Dakota’s median home value is $281,700 (±$6,105) and its median gross rent is $1,071 (±$32) a month, according to the ACS 2025 1-year estimates. 32.3% (±3.3%) of its renters pay 30% or more of their income on rent.
Is North Dakota growing?
North Dakota’s population grew 5.6%, from 756,928 in 2015 to 799,358 in 2025, according to the ACS 1-year estimates.
Where do people who work in North Dakota live?
364,205 of its 416,442 jobs are held by people who live here. Of those who commute in, the most come from Minnesota, Montana, South Dakota.
Where does this census data come from?
The U.S. Census Bureau’s American Community Survey, through Social Explorer’s tables: the latest 1-year estimates where they exist, for the most recent numbers, and 5-year estimates otherwise. Each table lists its code, so you can find it again.
Is this data free to use?
Yes. You can read it, cite it, download the CSV and embed the charts, with no account. To map other variables, compare your own areas or build a report, see Social Explorer’s plans in a live demo.
Sources and how to cite
American Community Survey 2025 1-year estimates, or 2020–2024 5-year estimates where noted, U.S. Census Bureau, from Social Explorer’s tables A00001, A00002, A01004, A04001, A06001, A08001, A09005, A10001, A10003, A10008, A10030, A10036, A10040, A10047, A10055, A10060, A12001, A13004, A14006, A14024, A14028, A16002, A17005, A18002, A18009, A20001, B02002, B09001, B13002, B18101, C16001. Maps by census tract use 2020–2024 5-year estimates, since the 1-year survey doesn’t cover tracts. Commuting: LEHD LODES 2023. These are estimates from a sample, each with its margin of error. Data retrieved November 14, 2026. How these profiles are made.
U.S. Census Bureau, American Community Survey 2025 1-year estimates, or 2020–2024 5-year estimates where noted, via Social Explorer. “North Dakota.” https://www.socialexplorer.com/places/north-dakota. Accessed November 14, 2026.