

Oregon: Population, demographics and census data
Home to 4,273,586 people, the 27th largest of the 50 states and DC, anchored by Portland. It grew 6.1% between 2015 and 2025.
- Population
- 4.27M. Census Bureau estimate · Rank 27 of the 50 states and DC
- Median household income
- $86,953 ±$1,920. US $84,780
- Median age
- 41.3 ±0.2. US 39.5
ACS 2025 1-year estimates, U.S. Census Bureau
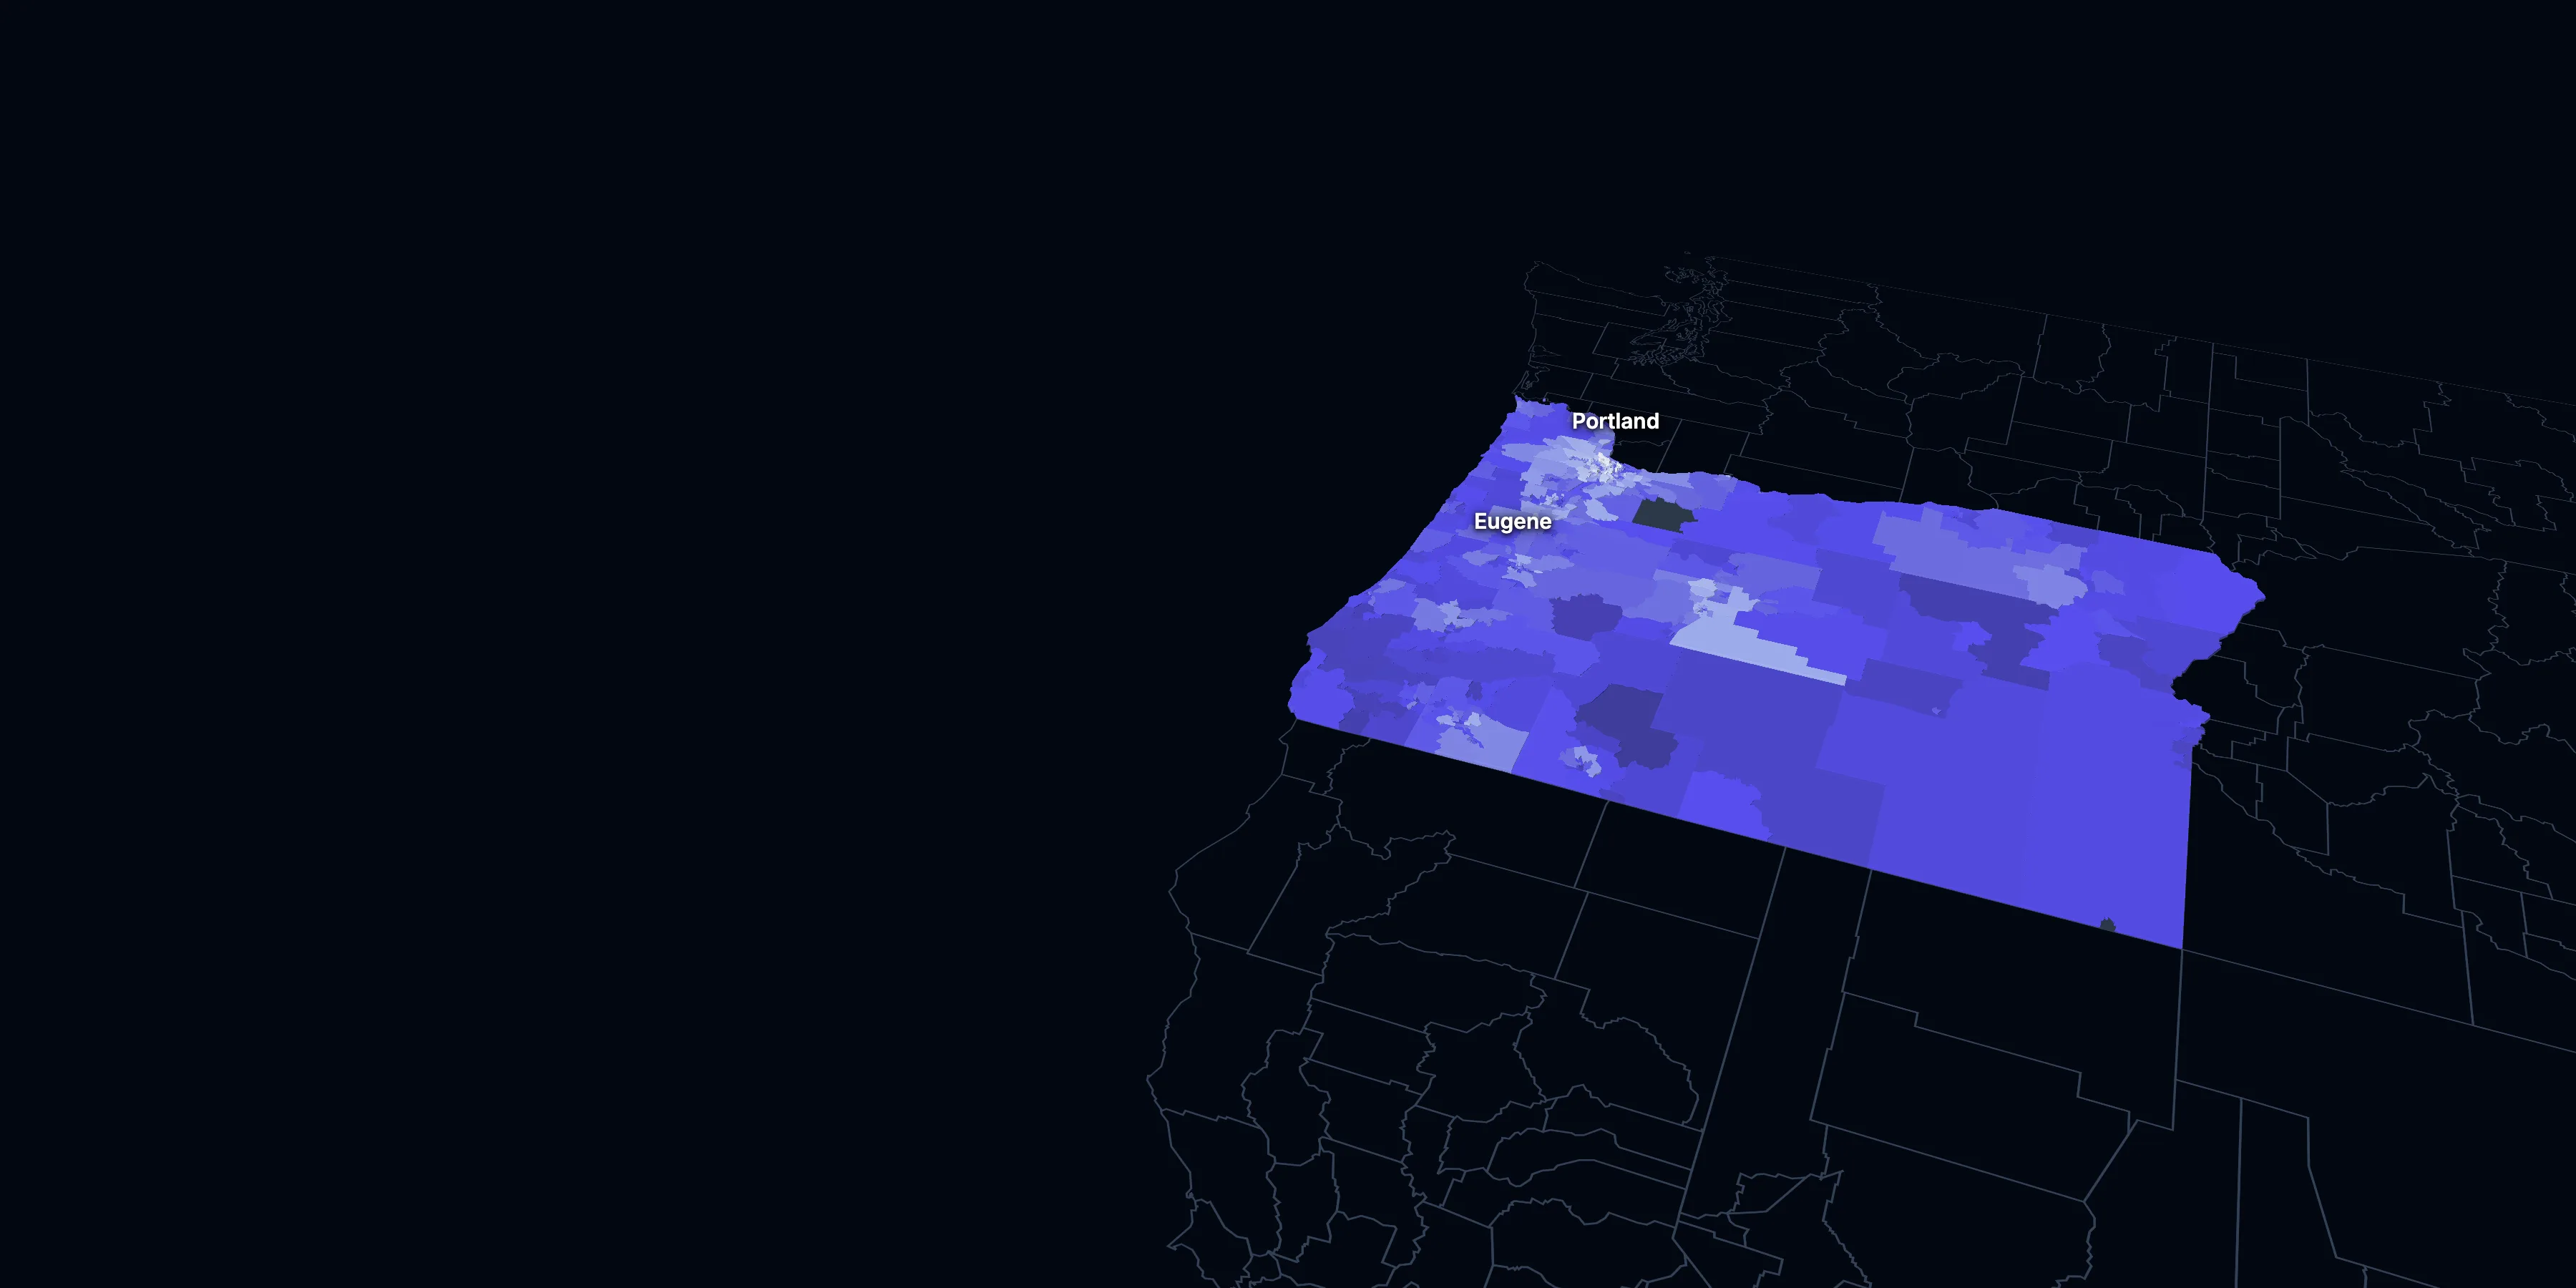
Taller, lighter tracts have higher household incomes
About Oregon
Oregon’s median household income is $86,953 (±$1,920), higher than the US ($84,780), and its median age is 41.3 (±0.2), according to the ACS 2025 1-year estimates. Its largest city is Portland.
± is each figure’s margin of error, at 90% confidence, and † marks one too uncertain to lean on. Under each percentage in the tables is the number it counts. How the margins are worked out.
FIPS code 41
Highlights
What stands out in Oregon
The numbers where Oregon sits furthest from the nation, or past a recognized policy benchmark.
Past a policy benchmark
27.1%
Very highOwners paying 30% or more of income
That’s higher than the US (24.2%). HUD’s 30% standard, applied to homeowners.
5.4%
ElevatedUnemployment rate
That’s higher than the US (4.9%). The Department of Labor uses 6% as its floor for a labor surplus area.
+9 points
ElevatedRent growth ahead of income
After inflation, rent grew 26% from 2015 to 2025, and household income 17%. The dots show rent growth.
Furthest from the national picture
15.9%
Higher than the USLiving with a disability
That’s higher than the US (13.7%).
18.9%
Lower than the USUnder 18
That’s lower than the US (21.0%).
5.4%
Lower than the USNo health insurance
That’s lower than the US (8.4%).
2015 to 2025
How Oregon changed in ten years
The state added 244,609 people. It got older and better educated, and poverty fell 3.7 points.
Population, change since 2015
+6.1% in the state and +6.3% in the US.
Source: ACS 1-year, 2015 to 2025, table A00001.
Show data
| Oregon | United States | |
|---|---|---|
| 2015 | 0.0% | 0.0% |
| 2016 | +1.6% | +0.5% |
| 2017 | +2.8% | +1.3% |
| 2018 | +4.0% | +1.8% |
| 2019 | +4.7% | +2.1% |
| 2021 | +5.4% | +3.3% |
| 2022 | +5.2% | +3.7% |
| 2023 | +5.1% | +4.2% |
| 2024 | +6.0% | +5.8% |
| 2025 | +6.1% | +6.3% |
Embed
Median household income, in 2025 dollars
+17.2% in the state and +10.9% in the US.
Source: ACS 1-year, 2015 to 2025, table A14006.
Show data
| Oregon | United States | |
|---|---|---|
| 2015 | $74,184 | $76,413 |
| 2016 | $77,816 | $77,931 |
| 2017 | $79,727 | $79,891 |
| 2018 | $81,984 | $80,059 |
| 2019 | $85,136 | $83,427 |
| 2021 | $85,731 | $83,521 |
| 2022 | $83,810 | $82,811 |
| 2023 | $85,280 | $82,683 |
| 2024 | $88,076 | $84,339 |
| 2025 | $86,953 | $84,780 |
Embed
Living in poverty
−3.7 points in the state and −3.0 points in the US.
Source: ACS 1-year, 2015 to 2025, table A13004.
Show data
| Oregon | United States | |
|---|---|---|
| 2015 | 15.4% | 14.7% |
| 2016 | 13.3% | 14.0% |
| 2017 | 13.2% | 13.4% |
| 2018 | 12.6% | 13.1% |
| 2019 | 11.4% | 12.3% |
| 2021 | 12.2% | 12.8% |
| 2022 | 12.1% | 12.6% |
| 2023 | 12.2% | 12.5% |
| 2024 | 11.8% | 12.1% |
| 2025 | 11.7% | 11.8% |
Embed
Bachelor’s degree or more
+4.5 points in the state and +6.7 points in the US.
Source: ACS 1-year, 2015 to 2025, table A12001.
Show data
| Oregon | United States | |
|---|---|---|
| 2015 | 32.2% | 30.6% |
| 2016 | 32.7% | 31.3% |
| 2017 | 33.7% | 32.0% |
| 2018 | 34.0% | 32.6% |
| 2019 | 34.5% | 33.1% |
| 2021 | 36.3% | 35.0% |
| 2022 | 36.3% | 35.7% |
| 2023 | 37.7% | 36.2% |
| 2024 | 37.8% | 36.8% |
| 2025 | 36.6% | 37.4% |
Embed
Median gross rent, in 2025 dollars
+26.1% in the state and +18.5% in the US.
Source: ACS 1-year, 2015 to 2025, table A18009.
Show data
| Oregon | United States | |
|---|---|---|
| 2015 | $1,292 | $1,314 |
| 2016 | $1,373 | $1,327 |
| 2017 | $1,429 | $1,340 |
| 2018 | $1,461 | $1,368 |
| 2019 | $1,504 | $1,393 |
| 2021 | $1,536 | $1,427 |
| 2022 | $1,518 | $1,440 |
| 2023 | $1,576 | $1,496 |
| 2024 | $1,651 | $1,537 |
| 2025 | $1,629 | $1,557 |
Embed
Median home value, in 2025 dollars
+40.4% in the state and +39.3% in the US.
Source: ACS 1-year, 2015 to 2025, table A10036.
Show data
| Oregon | United States | |
|---|---|---|
| 2015 | $361,822 | $266,469 |
| 2016 | $388,324 | $277,278 |
| 2017 | $422,653 | $288,124 |
| 2018 | $441,807 | $296,908 |
| 2019 | $450,196 | $305,336 |
| 2021 | $506,392 | $337,116 |
| 2022 | $526,852 | $355,481 |
| 2023 | $515,768 | $361,931 |
| 2024 | $514,173 | $372,685 |
| 2025 | $507,900 | $371,100 |
Embed
ACS 1-year estimates. The dotted stretch of each line spans 2020, when the Census Bureau released no standard 1-year estimates. Dollar values are in 2025 dollars.
| Indicator | 2015 | 2025 | Change |
|---|---|---|---|
| Population | 4,028,977 | 4,273,586 | +6.1% |
| Median age | 39.1 | 41.3 | +2.2 years |
| 65 and over | 16.4% | 20.9% | +4.6 points |
| Born outside the US | 9.9% | 10.0% | +0.2 points |
| Hispanic or Latino | 12.7% | 16.2% | +3.5 points |
| Median household income | $74,184 | $86,953 | +17.2% |
| Living in poverty | 15.4% | 11.7% | −3.7 points |
| Bachelor’s degree or more | 32.2% | 36.6% | +4.5 points |
| Households that rent | 38.9% | 36.9% | −2.0 points |
| Median gross rent | $1,292 | $1,629 | +26.1% |
| Median home value | $361,822 | $507,900 | +40.4% |
1001 census tracts
Oregon, tract by tract
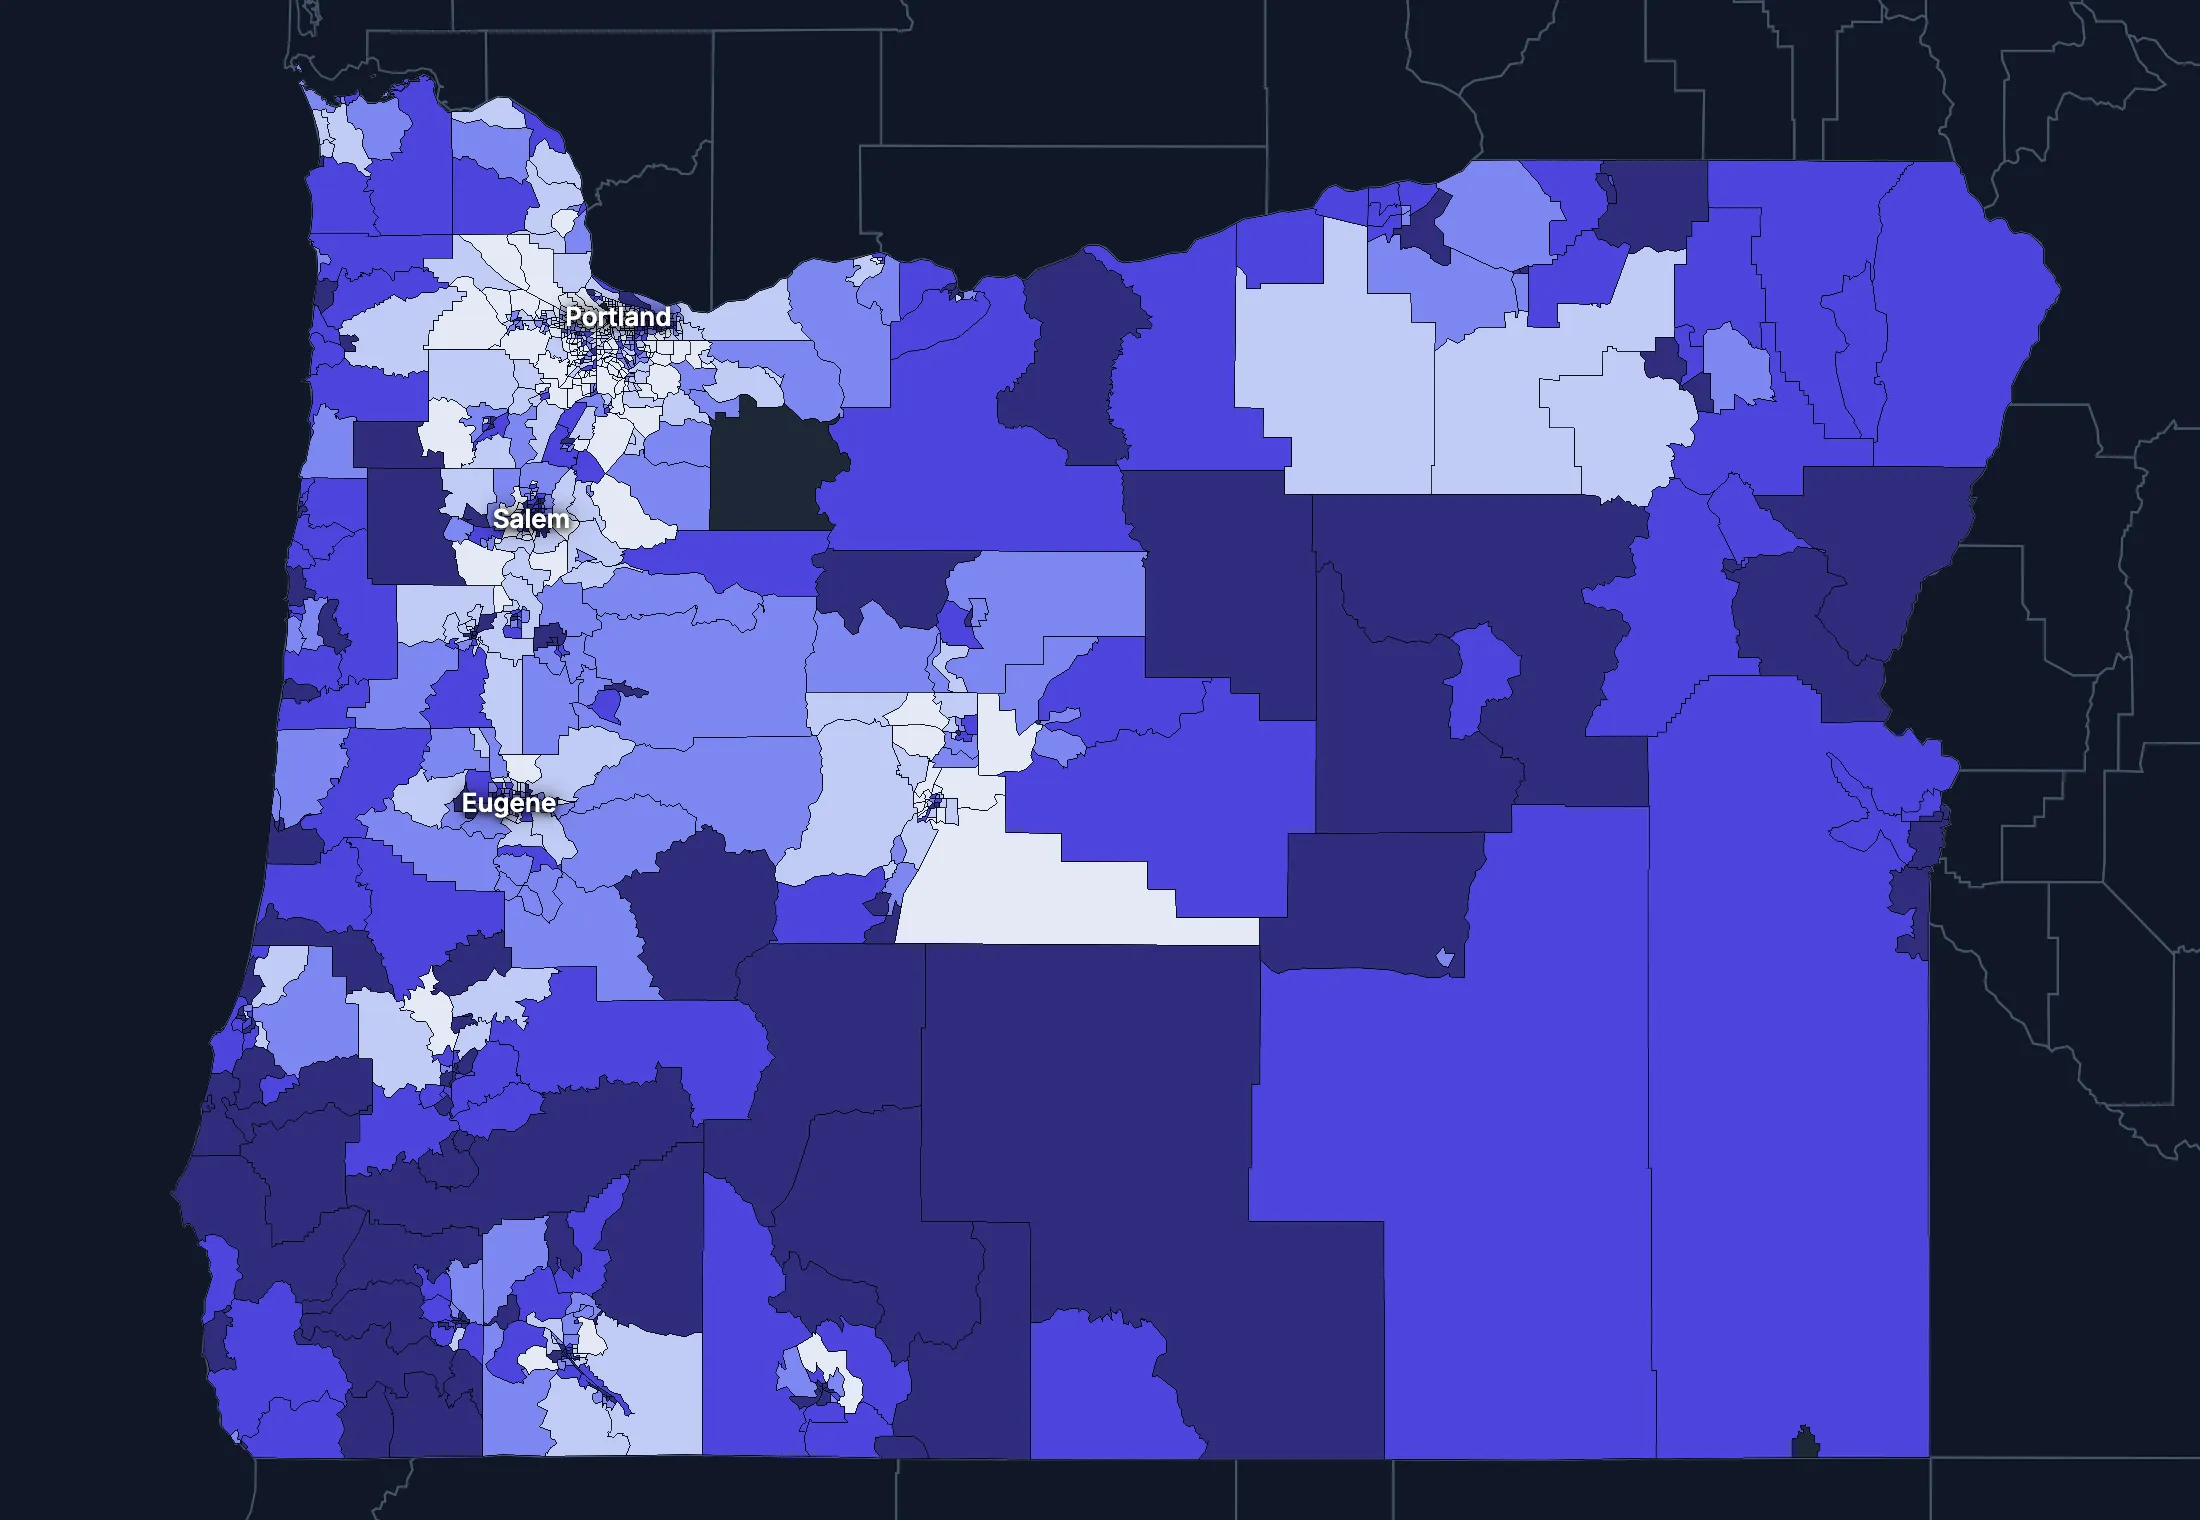
State averages hide a lot. These census tracts are the closest the census comes to neighborhoods.
Where the state’s average misleads
Each tick is one census tract, and the dark line marks the state. Hover over a tick or tap it to see the tract.
Poverty
188 of 992 tracts are at least 1.5 times the state’s overall 11.9%, and 271 are at two-thirds of it or less.
Highest: Tract 38.02, 71.7%. Lowest: Tract 315.18, 0.7%.
Renters paying 30% or more of income
34 of 987 tracts are at least 1.5 times the state’s overall 49.5%, and 186 are at two-thirds of it or less.
Highest: Tract 20.01, 100.0%. Lowest: Tract 6.01, 0.0%.
Adults with a bachelor’s degree
203 of 991 tracts are at least 1.5 times the state’s overall 36.8%, and 315 are at two-thirds of it or less.
Highest: Tract 61, 87.6%. Lowest: Tract 9508, 5.9%.
Median household income
122 of 991 tracts are at least 1.5 times the typical tract’s $81,614, and 120 are at two-thirds of it or less.
Highest: Tract 70.02, $250,000 or more. Lowest: Tract 106.02, $15,653.
American Community Survey 2020–2024 5-year estimates, by census tract. Income is capped at $250,000+ by the Census Bureau.
People
Who lives in Oregon
Its median age of 41.3 is higher than the US (39.5). 10.0% of residents were born outside the US, and 15.8% speak a language other than English at home.
Age
Source: ACS 2025 1-year, table A01001.
Show data
| Oregon | United States | |
|---|---|---|
| Under 18 | 18.9% ±0.3% , number 808,156 ±11,940 | 21.0% ±<0.1% , number 71,689,151 ±111,800 |
| 18 to 24 | 8.6% ±0.3% , number 365,640 ±10,710 | 9.3% ±<0.1% , number 31,716,680 ±98,660 |
| 25 to 34 | 13.7% ±0.1% , number 584,954 ±6,236 | 13.6% ±<0.1% , number 46,357,354 ±55,690 |
| 35 to 44 | 14.2% ±0.3% , number 608,330 ±12,810 | 13.4% ±<0.1% , number 45,746,189 ±105,700 |
| 45 to 54 | 12.2% ±0.1% , number 522,372 ±5,586 | 11.8% ±<0.1% , number 40,257,563 ±53,540 |
| 55 to 64 | 11.4% ±0.2% , number 489,314 ±10,240 | 12.1% ±<0.1% , number 41,242,904 ±104,700 |
| 65 to 74 | 11.7% ±0.2% , number 498,531 ±9,750 | 10.8% ±<0.1% , number 36,895,650 ±91,520 |
| 75 and over | 9.3% ±0.2% , number 396,289 ±9,054 | 8.2% ±<0.1% , number 27,879,368 ±78,140 |
Embed
Race and ethnicity
Source: ACS 2025 1-year, table A04001.
Show data
| Oregon | United States | |
|---|---|---|
| White, not Hispanic | 67.8% ±0.2% , number 2,897,973 ±8,464 | 55.0% ±<0.1% , number 187,959,031 ±58,340 |
| Hispanic or Latino | 16.2% , number 690,999 | 20.5% ±<0.1% , number 69,975,516 ±13,270 |
| Black, not Hispanic | 2.0% ±0.1% , number 84,628 ±5,938 | 11.7% ±<0.1% , number 40,096,453 ±106,200 |
| Asian, not Hispanic | 4.8% ±0.2% , number 203,223 ±7,251 | 6.5% ±<0.1% , number 22,096,709 ±58,340 |
| Other or multiracial | 9.3% ±0.3% , number 396,763 ±14,240 | 6.3% ±<0.1% , number 21,657,150 ±150,100 |
Embed
Language spoken at home
Source: ACS 2025 1-year, table C16001.
Show data
| Oregon | United States | |
|---|---|---|
| English only | 84.2% ±0.5% , number 3,440,802 ±20,760 | 77.1% ±0.1% , number 249,390,588 ±275,300 |
| Spanish | 9.5% ±0.4% , number 388,064 ±16,820 | 13.9% ±0.1% , number 44,921,985 ±177,800 |
| Other Indo-European | 2.4% ±0.2% , number 98,987 ±10,010 | 4.0% ±<0.1% , number 12,862,980 ±113,500 |
| Asian and Pacific Island | 3.2% ±0.2% , number 130,706 ±10,030 | 3.8% ±<0.1% , number 12,288,841 ±99,740 |
| Arabic and other | 0.6% ±0.1% , number 25,676 ±3,661 | 1.3% ±<0.1% , number 4,116,949 ±71,480 |
Embed
Marital status
Source: ACS 2025 1-year, table A11001.
Show data
| Oregon | United States | |
|---|---|---|
| Now married | 47.0% ±0.6% , number 1,701,295 ±22,490 | 47.9% ±0.1% , number 135,567,564 ±223,300 |
| Never married | 34.2% ±0.5% , number 1,239,605 ±16,690 | 34.8% ±0.1% , number 98,647,238 ±152,600 |
| Divorced | 12.1% ±0.3% , number 440,157 ±12,450 | 10.2% ±<0.1% , number 28,879,967 ±112,900 |
| Widowed | 5.3% ±0.2% , number 192,864 ±6,593 | 5.5% ±<0.1% , number 15,599,094 ±69,430 |
| Separated | 1.4% ±0.1% , number 49,038 ±4,584 | 1.6% ±<0.1% , number 4,441,399 ±49,160 |
Embed
Where people lived a year ago
Source: ACS 2025 1-year, table A08001.
Show data
| Oregon | United States | |
|---|---|---|
| Same home | 87.2% ±0.5% , number 3,693,281 ±22,960 | 88.4% ±0.1% , number 298,889,697 ±214,800 |
| Same county | 6.5% ±0.4% , number 274,475 ±15,490 | 6.0% ±<0.1% , number 20,202,671 ±166,300 |
| Another county in the state | 3.3% ±0.3% , number 140,291 ±11,440 | 3.0% ±<0.1% , number 10,168,097 ±89,190 |
| Another state | 2.6% ±0.2% , number 110,629 ±8,600 | 2.1% ±<0.1% , number 7,025,589 ±81,660 |
| Another country | 0.4% ±0.1% , number 15,833 ±3,541 | 0.6% ±<0.1% , number 1,984,943 ±47,210 |
Embed
Top countries of birth, among those born abroad
Source: ACS 2025 1-year, table A07001.
Show data
| Oregon | |
|---|---|
| Mexico | 33.6% , number 144,435 |
| Vietnam | 4.9% , number 20,881 |
| India | 4.5% , number 19,414 |
| Philippines | 4.5% , number 19,414 |
| China, Excluding Hong Kong and Taiwan | 4.2% , number 17,918 |
| Canada | 4.0% , number 17,076 |
Embed
All the numbers
| Indicator | Oregon | US | Rank among states* | Table |
|---|---|---|---|---|
| Population | 4,273,586 | 341,784,859 | 27th | A00001 |
| People per square mile | 45 | 97 | 40th | A00002 |
| Land area (square miles) | 95,997 | – | – | A00002 |
| Median age | 41.3 ±0.2 | 39.5 ±0.1 | 11th | A01004 |
| Under 18 | 18.9% ±0.3% , number 808,156 ±11,940 | 21.0% ±<0.1% , number 71,689,151 ±111,800 | 44th | B02002 |
| 65 and over | 20.9% ±0.3% , number 894,820 ±13,310 | 19.0% ±<0.1% , number 64,775,018 ±120,300 | 11th | B02002 |
| Born outside the US | 10.0% ±0.4% , number 429,361 ±15,010 | 14.7% ±0.1% , number 50,409,320 ±204,800 | 20th | A06001 |
| Speak a language other than English at home | 15.8% ±0.5% , number 643,433 ±22,300 | 22.9% ±0.1% , number 74,190,755 ±244,000 | 21st | C16001 |
| Veterans (adults) | 6.4% ±0.2% , number 222,002 ±8,601 | 5.9% ±<0.1% , number 15,746,228 ±85,320 | 25th | A16002 |
| Living with a disability | 15.9% ±0.3% , number 671,842 ±14,530 | 13.7% ±<0.1% , number 46,271,455 ±126,000 | 10th | B18101 |
| Women 15–50 who had a baby in the past year | 4.2% ±0.4% , number 42,610 ±4,000 | 5.0% ±0.1% , number 4,016,759 ±44,040 | 47th | B13002 |
| Lived in the same home a year ago | 87.2% ±0.5% , number 3,693,281 ±22,960 | 88.4% ±0.1% , number 298,889,697 ±214,800 | 39th | A08001 |
| White, not Hispanic | 67.8% ±0.2% , number 2,897,973 ±8,464 | 55.0% ±<0.1% , number 187,959,031 ±58,340 | 22nd | A04001 |
| Hispanic or Latino | 16.2% , number 690,999 | 20.5% ±<0.1% , number 69,975,516 ±13,270 | 14th | A04001 |
| Black, not Hispanic | 2.0% ±0.1% , number 84,628 ±5,938 | 11.7% ±<0.1% , number 40,096,453 ±106,200 | 42nd | A04001 |
| Asian, not Hispanic | 4.8% ±0.2% , number 203,223 ±7,251 | 6.5% ±<0.1% , number 22,096,709 ±58,340 | 16th | A04001 |
*1 is the highest. Population is ranked among all states, and the rest among those of 1,000 people or more, whose figures can be ranked. Ranks use 5-year estimates, the only ones covering every state, so they can differ slightly from the figures here.
Income and work
Incomes close to the US
The median household income is $86,953, higher than the US ($84,780). 11.7% of people live in poverty, and 5.4% have no health insurance, lower than the US (8.4%).
Household income
Source: ACS 2025 1-year, table A14001.
Show data
| Oregon | United States | |
|---|---|---|
| Under $25,000 | 14.0% ±0.6% , number 243,993 ±10,270 | 14.0% ±0.1% , number 18,727,548 ±88,990 |
| $25,000 to $49,999 | 15.2% ±0.6% , number 265,978 ±10,700 | 15.4% ±0.1% , number 20,665,585 ±101,400 |
| $50,000 to $74,999 | 14.6% ±0.5% , number 254,462 ±9,631 | 15.3% ±0.1% , number 20,513,565 ±88,500 |
| $75,000 to $99,999 | 12.8% ±0.5% , number 223,703 ±9,117 | 12.5% ±0.1% , number 16,814,245 ±87,520 |
| $100,000 to $149,999 | 18.8% ±0.6% , number 327,641 ±10,720 | 17.9% ±0.1% , number 24,018,984 ±99,670 |
| $150,000 to $199,999 | 10.7% ±0.5% , number 187,585 ±7,972 | 10.1% ±0.1% , number 13,521,827 ±70,660 |
| $200,000 or more | 13.9% ±0.5% , number 241,999 ±8,520 | 14.8% ±0.1% , number 19,801,668 ±84,120 |
Embed
What residents do for work
Source: ACS 2025 1-year, table A17004.
Show data
| Oregon | United States | |
|---|---|---|
| Education and health care | 25.3% ±0.6% , number 528,785 ±13,680 | 24.4% ±0.1% , number 40,862,193 ±140,800 |
| Retail trade | 11.6% ±0.4% , number 242,901 ±9,055 | 10.6% ±0.1% , number 17,781,181 ±96,660 |
| Professional and business services | 11.3% ±0.5% , number 236,638 ±10,150 | 12.8% ±0.1% , number 21,375,231 ±87,110 |
| Manufacturing | 10.7% ±0.4% , number 224,346 ±9,380 | 9.6% ±0.1% , number 16,064,394 ±91,270 |
| Arts, food and lodging | 9.6% ±0.5% , number 200,572 ±10,580 | 8.9% ±0.1% , number 14,811,502 ±87,840 |
| Construction | 6.6% ±0.4% , number 137,247 ±7,511 | 6.7% ±<0.1% , number 11,254,981 ±79,620 |
| Finance, insurance and real estate | 5.0% ±0.3% , number 104,563 ±6,825 | 6.6% ±<0.1% , number 11,025,569 ±68,570 |
| Transportation and warehousing | 4.9% ±0.3% , number 102,274 ±6,640 | 5.9% ±<0.1% , number 9,832,211 ±73,020 |
Embed
Where workers come from and go
Oregon has 1,977,253 jobs and 1,920,976 employed residents. 131,257 people commute in to work and 74,980 commute out, while 1,845,996 both live and work here. The most commuters come from Washington.
Most commuters come from
- Washington: 100,677
- California: 10,105
- Idaho: 8,742
Most residents commute to
- Washington: 47,296
- California: 11,125
- Idaho: 5,700
Show data
| Oregon | |
|---|---|
| Live and work here | 1,845,996 |
| Work here, live elsewhere | 131,257 |
| Live here, work elsewhere | 74,980 |
Embed
All the numbers
| Indicator | Oregon | US | Rank among states* | Table |
|---|---|---|---|---|
| Median household income | $86,953 ±$1,920 | $84,780 ±$215 | 19th | A14006 |
| Income per person | $47,424 ±$606 | $47,171 ±$115 | 18th | A14024 |
| Income inequality (Gini index) | 0.461 ±0.005 | 0.482 ±0.001 | 31st | A14028 |
| Living in poverty | 11.7% ±0.6% , number 490,120 ±24,110 | 11.8% ±0.1% , number 39,264,183 ±277,400 | 24th | A13004 |
| Unemployment rate | 5.4% ±0.4% , number 120,342 ±8,928 | 4.9% ±<0.1% , number 8,574,594 ±64,350 | 15th | A17005 |
| No health insurance | 5.4% ±0.3% , number 228,788 ±10,840 | 8.4% ±<0.1% , number 28,323,306 ±152,000 | 38th | A20001 |
*1 is the highest. Population is ranked among all states, and the rest among those of 1,000 people or more, whose figures can be ranked. Ranks use 5-year estimates, the only ones covering every state, so they can differ slightly from the figures here.
Education
College degrees close to the US
36.6% of adults 25 and over have a bachelor’s degree or more, lower than the US (37.4%).
Highest level of education
Source: ACS 2025 1-year, table A12001.
Show data
| Oregon | United States | |
|---|---|---|
| Less than high school | 7.8% ±0.4% , number 242,019 ±11,390 | 9.4% ±0.1% , number 22,321,002 ±120,500 |
| High school only | 23.2% ±0.5% , number 719,406 ±17,040 | 25.6% ±0.1% , number 61,096,726 ±203,400 |
| Some college | 32.4% ±0.6% , number 1,003,228 ±18,680 | 27.7% ±0.1% , number 65,920,977 ±173,500 |
| Bachelor’s degree | 22.2% ±0.5% , number 686,895 ±15,160 | 22.3% ±0.1% , number 53,224,312 ±196,700 |
| Graduate degree | 14.5% ±0.4% , number 448,242 ±12,490 | 15.0% ±0.1% , number 35,816,011 ±159,400 |
Embed
All the numbers
| Indicator | Oregon | US | Rank among states* | Table |
|---|---|---|---|---|
| Bachelor’s degree or more | 36.6% ±0.6% , number 1,135,137 ±19,640 | 37.4% ±0.1% , number 89,040,323 ±253,200 | 17th | A12001 |
| High school graduate or more | 92.2% ±1.0% , number 2,857,771 ±32,020 | 90.6% ±0.2% , number 216,058,026 ±368,200 | 23rd | A12001 |
*1 is the highest. Population is ranked among all states, and the rest among those of 1,000 people or more, whose figures can be ranked. Ranks use 5-year estimates, the only ones covering every state, so they can differ slightly from the figures here.
Housing
Home values outran incomes
36.9% of households rent, higher than the US (34.7%). The median home is worth $507,900 and the median rent is $1,629. After inflation, home values rose 40% from 2015 to 2025, while household income rose 17%.
Housing costs and income, 2015 to 2025, after inflation
Source: ACS 1-year, table A10036, A18009, A14006.
Show data
| Oregon | United States | |
|---|---|---|
| Median home value | +40.4% | +39.3% |
| Median rent | +26.1% | +18.5% |
| Median household income | +17.2% | +10.9% |
Embed
Types of homes
Source: ACS 2025 1-year, table A10032.
Show data
| Oregon | United States | |
|---|---|---|
| Single-family, detached | 61.9% ±0.6% , number 1,181,483 ±11,900 | 60.9% ±0.1% , number 90,335,844 ±173,300 |
| Single-family, attached | 5.2% ±0.3% , number 98,854 ±6,256 | 6.4% ±<0.1% , number 9,527,703 ±51,230 |
| 2 to 4 units | 6.8% ±0.4% , number 130,656 ±7,822 | 7.5% ±0.1% , number 11,109,005 ±75,790 |
| 5 to 19 units | 8.9% ±0.5% , number 170,452 ±8,868 | 8.7% ±0.1% , number 12,829,882 ±97,590 |
| 20 or more units | 10.1% ±0.5% , number 192,816 ±8,880 | 11.1% ±0.1% , number 16,381,450 ±92,310 |
| Mobile homes and other | 7.1% ±0.4% , number 134,941 ±7,303 | 5.4% ±<0.1% , number 8,045,083 ±53,680 |
Embed
When homes were built
Source: ACS 2025 1-year, table A10055.
Show data
| Oregon | United States | |
|---|---|---|
| 2010 or later | 14.6% ±0.6% , number 255,182 ±10,120 | 15.1% ±0.1% , number 20,257,912 ±101,300 |
| 2000 to 2009 | 14.5% ±0.5% , number 252,373 ±9,553 | 13.8% ±0.1% , number 18,535,840 ±92,260 |
| 1980 to 1999 | 24.3% ±0.7% , number 423,857 ±11,950 | 24.1% ±0.1% , number 32,332,570 ±118,900 |
| 1960 to 1979 | 25.1% ±0.7% , number 438,010 ±12,530 | 22.9% ±0.1% , number 30,726,302 ±110,000 |
| Before 1960 | 21.5% ±0.6% , number 375,939 ±11,140 | 24.0% ±0.1% , number 32,210,798 ±121,500 |
Embed
All the numbers
| Indicator | Oregon | US | Rank among states* | Table |
|---|---|---|---|---|
| Housing units | 1,909,202 | – | – | A10001 |
| Households | 1,745,361 ±9,072 | – | – | A10008 |
| People per household | 2.39 ±0.01 | 2.49 ±0.01 | 34th | A10003 |
| Households that rent | 36.9% ±0.8% , number 644,001 ±14,180 | 34.7% ±0.1% , number 46,551,688 ±193,200 | 9th | A10060 |
| Vacant homes | 8.6% ±0.5% , number 163,841 ±9,039 | 9.6% ±0.1% , number 14,165,545 ±137,100 | 47th | A10047, A10060 |
| Median gross rent | $1,629 ±$18 | $1,557 ±$4 | 14th | A18009 |
| Median home value | $507,900 ±$4,066 | $371,100 ±$646 | 8th | A10036 |
| Renters paying 30% or more of income | 50.0% ±1.8% , number 322,060 ±13,540 | 48.3% ±0.2% , number 22,486,693 ±122,100 | 6th | A18002 |
| Owners paying 30% or more of income | 27.1% ±0.9% , number 298,255 ±10,190 | 24.2% ±0.1% , number 21,201,943 ±93,050 | 9th | A10040 |
| Homes built before 1960 | 21.5% ±0.6% , number 375,939 ±11,140 | 24.0% ±0.1% , number 32,210,798 ±121,500 | 26th | A10055 |
*1 is the highest. Population is ranked among all states, and the rest among those of 1,000 people or more, whose figures can be ranked. Ranks use 5-year estimates, the only ones covering every state, so they can differ slightly from the figures here.
Getting around
How people get around
67.3% of workers drive alone and 15.1% work from home. 30.8% of those who travel to work spend 30 minutes or more getting there, and 7.6% of households have no vehicle.
How people get to work
Source: ACS 2025 1-year, table A09005.
Show data
| Oregon | United States | |
|---|---|---|
| Drive alone | 67.3% ±0.7% , number 1,372,287 ±19,010 | 69.8% ±0.1% , number 115,297,377 ±192,900 |
| Carpool | 8.4% ±0.5% , number 172,116 ±10,720 | 8.9% ±0.1% , number 14,712,170 ±97,240 |
| Public transit | 3.1% ±0.3% , number 62,821 ±6,043 | 4.3% ±<0.1% , number 7,100,386 ±63,330 |
| Walk | 3.7% ±0.3% , number 74,647 ±6,265 | 2.4% ±<0.1% , number 4,016,469 ±41,070 |
| Work from home | 15.1% ±0.5% , number 308,013 ±10,690 | 12.9% ±0.1% , number 21,288,393 ±105,700 |
| Other | 2.4% ±0.2% , number 48,062 ±4,682 | 1.7% ±<0.1% , number 2,799,658 ±41,510 |
Embed
Time spent getting to work
Source: ACS 2025 1-year, table B09001.
Show data
| Oregon | United States | |
|---|---|---|
| Under 10 minutes | 15.0% ±0.6% , number 260,279 ±10,020 | 12.0% ±0.1% , number 17,199,225 ±93,440 |
| 10 to 19 minutes | 32.9% ±0.9% , number 569,729 ±15,980 | 27.8% ±0.1% , number 40,059,540 ±137,700 |
| 20 to 29 minutes | 21.2% ±0.7% , number 366,679 ±12,170 | 21.0% ±0.1% , number 30,221,743 ±111,100 |
| 30 to 39 minutes | 15.0% ±0.6% , number 259,652 ±10,590 | 17.1% ±0.1% , number 24,659,138 ±103,800 |
| 40 to 59 minutes | 9.4% ±0.5% , number 162,862 ±8,583 | 12.6% ±0.1% , number 18,104,709 ±97,070 |
| 60 minutes or more | 6.4% ±0.4% , number 110,732 ±7,376 | 9.5% ±0.1% , number 13,681,705 ±84,440 |
Embed
Vehicles per household
Source: ACS 2025 1-year, table A10030.
Show data
| Oregon | United States | |
|---|---|---|
| None | 7.6% ±0.4% , number 132,943 ±7,272 | 8.8% ±0.1% , number 11,781,997 ±77,240 |
| One | 32.9% ±0.9% , number 574,211 ±15,190 | 33.1% ±0.1% , number 44,424,682 ±160,700 |
| Two | 36.0% ±0.7% , number 628,865 ±13,040 | 36.0% ±0.1% , number 48,200,889 ±176,800 |
| Three or more | 23.5% ±0.7% , number 409,342 ±12,550 | 22.1% ±0.1% , number 29,655,854 ±113,300 |
Embed
All the numbers
| Indicator | Oregon | US | Rank among states* | Table |
|---|---|---|---|---|
| Drive to work alone | 67.3% ±0.7% , number 1,372,287 ±19,010 | 69.8% ±0.1% , number 115,297,377 ±192,900 | 46th | A09005 |
| Take public transit | 3.1% ±0.3% , number 62,821 ±6,043 | 4.3% ±<0.1% , number 7,100,386 ±63,330 | 14th | A09005 |
| Work from home | 15.1% ±0.5% , number 308,013 ±10,690 | 12.9% ±0.1% , number 21,288,393 ±105,700 | 5th | A09005 |
| Commute 30 minutes or more | 30.8% ±0.8% , number 533,246 ±15,500 | 39.2% ±0.1% , number 56,445,552 ±165,300 | 36th | B09001 |
| Households with no vehicle | 7.6% ±0.4% , number 132,943 ±6,538 | 8.8% ±<0.1% , number 11,781,997 ±64,240 | 15th | A10030 |
*1 is the highest. Population is ranked among all states, and the rest among those of 1,000 people or more, whose figures can be ranked. Ranks use 5-year estimates, the only ones covering every state, so they can differ slightly from the figures here.
Places
The largest cities in Oregon
Population, from the latest estimates available. Figures cover the whole of each place.
Largest cities
States like this one
- Pennsylvania: 13,018,639
- Illinois: 12,694,798
- North Carolina: 10,730,404
- Wisconsin: 5,914,872
States at least a third this size, with the closest income, education, age, housing and origins.
Every county and place in Oregon
Find any county, city, town, metro area, ZIP code, school district or district in Oregon.
Counties
Each of the 36 counties with its population, from ACS 2020–2024 5-year estimates.
- Baker County16,840
- Benton County96,303
- Clackamas County423,975
- Clatsop County41,363
- Columbia County53,493
- Coos County64,827
- Crook County26,277
- Curry County23,381
- Deschutes County206,334
- Douglas County112,072
- Gilliam County1,971
- Grant County7,209
- Harney County7,499
- Hood River County23,905
- Jackson County222,645
- Jefferson County25,203
- Josephine County88,179
- Klamath County70,247
- Lake County8,267
- Lane County384,207
- Lincoln County50,964
- Linn County130,706
- Malheur County31,954
- Marion County349,244
- Morrow County12,300
- Multnomah County801,477
- Polk County89,662
- Sherman County1,938
- Tillamook County27,496
- Umatilla County79,940
- Union County26,144
- Wallowa County7,553
- Wasco County26,552
- Washington County603,947
- Wheeler County1,485
- Yamhill County108,734
Cities, towns and other places
Each of the 420 with its population, from ACS 2020–2024 5-year estimates. Census-designated places are communities without a local government of their own, drawn by the Census Bureau so they can be counted.
- Adair Village1,233
- Adams292
- Adrian299
- Albany56,839
- Aloha52,389
- Alpine240
- Alsea201
- Altamont19,927
- Amity2,089
- Annex340
- Antelope68
- Arlington690
- Ashland21,259
- Astoria10,109
- Athena1,377
- Aumsville4,230
- Aurora1,030
- Baker City10,210
- Bandon3,330
- Banks2,156
- Barlow105
- Barnesdale208
- Barview1,684
- Bay City1,875
- Bayshore925
- Bayside Gardens1,128
- Beatty97
- Beaver276
- Beaver Marsh96
- Beavercreek4,894
- Beaverton97,812
- Bellfountain66
- Bend103,390
- Bethany33,106
- Black Butte Ranch115
- Bly150
- Boardman4,064
- Bonanza632
- Boring1,869
- Brogan38
- Brookings6,703
- Brooks664
- Brownsville1,912
- Bull Mountain9,865
- Bunker Hill1,626
- Burns2,723
- Butte Falls364
- Butteville226
- Camp Sherman298
- Canby18,134
- Cannon Beach1,361
- Canyon City900
- Canyonville1,920
- Cape Meares225
- Carlton2,759
- Cascade Locks1,378
- Cascadia136
- Cave Junction1,691
- Cayuse44
- Cedar Hills8,388
- Cedar Mill19,471
- Central Point19,216
- Chemult21
- Chenoweth1,445
- Cherry Grove335
- Cheshire296
- Chiloquin465
- Clatskanie2,364
- Cloverdale143
- Coburg1,626
- Columbia City2,006
- Condon623
- Coos Bay15,925
- Coquille4,002
- Cornelius14,255
- Corvallis59,960
- Cottage Grove10,698
- Cove651
- Crabtree602
- Crane136
- Crawfordsville588
- Crescent363
- Crescent Lake154
- Creswell5,621
- Crooked River Ranch5,160
- Culver2,254
- Dallas17,531
- Damascus11,437
- Days Creek270
- Dayton2,675
- Dayville206
- Deer Island199
- Depoe Bay1,782
- Deschutes River Woods5,797
- Detroit111
- Dexter865
- Dillard500
- Dilley200
- Donald1,133
- Drain1,078
- Dufur952
- Dundee3,213
- Dunes City1,357
- Dunthorpe1,875
- Durham1,983
- Eagle Crest2,677
- Eagle Point9,839
- Echo494
- Elgin1,549
- Elkton150
- Elmira319
- Enterprise2,131
- Estacada5,152
- Eugene179,591
- Fair Oaks233
- Fairview CDP526
- Fairview city10,735
- Falcon Heights837
- Falls City1,222
- Florence9,482
- Foots Creek1,110
- Forest Grove26,529
- Fort Hill123
- Fort Klamath155
- Fossil535
- Four Corners16,275
- Garden Home-Whitford6,979
- Gardiner199
- Garibaldi796
- Gaston605
- Gates452
- Gearhart1,978
- Gervais2,581
- Gilchrist291
- Gladstone11,977
- Glasgow697
- Glendale981
- Glide1,823
- Gold Beach2,466
- Gold Hill1,288
- Gopher Flats382
- Government Camp147
- Grand Ronde1,549
- Granite93
- Grants Pass39,311
- Grass Valley261
- Green7,541
- Green Meadows584
- Gresham112,378
- Haines209
- Halfway312
- Halsey1,491
- Happy Valley26,738
- Harbor2,437
- Harper219
- Harrisburg3,681
- Hayesville21,246
- Hebo311
- Heceta Beach2,651
- Helix471
- Heppner1,277
- Hermiston19,546
- Hillsboro108,231
- Hines1,604
- Holley211
- Hood River8,361
- Hubbard3,406
- Huntington739
- Idanha201
- Idaville132
- Imbler189
- Independence10,199
- Ione456
- Irrigon2,120
- Island City1,145
- Jacksonville2,991
- Jasper493
- Jeffers Gardens235
- Jefferson3,301
- Jennings Lodge7,971
- John Day1,609
- Johnson City499
- Jordan Valley180
- Joseph1,054
- Junction City6,947
- Juniper Canyon2,666
- Juntura18
- Keizer39,082
- Keno1,651
- Kerby187
- King City5,073
- Kings Valley17
- Kirkpatrick258
- Klamath Falls22,115
- Knappa806
- La Grande13,058
- La Pine2,547
- Labish Village238
- Lacomb691
- Lafayette4,490
- Lake Oswego40,381
- Lakeside1,870
- Lakeview3,270
- Langlois286
- Lebanon19,344
- Lexington83
- Lincoln Beach2,434
- Lincoln City9,968
- Lonerock36
- Long Creek200
- Lookingglass963
- Lostine255
- Lowell1,228
- Lyons1,139
- Madras7,676
- Malin799
- Manzanita568
- Mapleton503
- Marcola407
- Marion154
- Marlene Village5,439
- Maupin465
- Maywood Park987
- McKay74
- McMinnville34,596
- Meacham32
- Medford86,315
- Mehama425
- Melrose964
- Merlin1,617
- Merrill819
- Metolius1,137
- Metzger3,714
- Mill City1,920
- Millersburg3,366
- Milton-Freewater7,036
- Milwaukie21,392
- Mission878
- Mitchell127
- Molalla10,186
- Monmouth11,428
- Monroe1,102
- Monument185
- Moro392
- Mosier714
- Mount Angel3,393
- Mount Hood191
- Mount Hood Villages4,703
- Mount Vernon364
- Mulino2,229
- Myrtle Creek3,500
- Myrtle Point2,684
- Neahkahnie219
- Nehalem235
- Neotsu872
- Nesika Beach465
- Neskowin290
- Netarts1,022
- New Hope1,296
- New Pine Creek125
- Newberg26,066
- Newport10,583
- North Bend10,171
- North Plains3,433
- North Powder563
- Nyssa3,240
- O'Brien379
- Oak Grove16,796
- Oak Hills11,131
- Oakland1,048
- Oakridge3,184
- Oatfield13,294
- Oceanside430
- Ochoco West319
- Odell2,218
- Ontario11,842
- Oregon City37,755
- Oregon Shores428
- Orient481
- Pacific City1,303
- Paisley249
- Parkdale319
- Pendleton16,950
- Peoria130
- Philomath5,642
- Phoenix4,390
- Pilot Rock1,283
- Pine Grove208
- Pine Hollow561
- Pleasant Valley486
- Plush59
- Port Orford986
- Portland641,165
- Powers613
- Prairie City615
- Prescott34
- Prineville11,470
- Prineville Lake Acres1,497
- Pronghorn257
- Prospect723
- Rainier2,130
- Raleigh Hills6,744
- Redmond36,092
- Redwood3,721
- Reedsport4,317
- Rhododendron214
- Richland197
- Rickreall52
- Riddle955
- River Point475
- River Road8,862
- Rivergrove657
- Riverside362
- Rockaway Beach1,562
- Rockcreek9,223
- Rocky Point478
- Rogue River2,238
- Rose Lodge1,381
- Roseburg23,778
- Roseburg North4,601
- Rowena181
- Ruch1,151
- Rufus212
- Running Y Ranch607
- Salem178,865
- San Marine506
- Sandy12,854
- Santa Clara10,551
- Saunders Lake1,338
- Scappoose8,179
- Scio930
- Scotts Mills337
- Seaside7,192
- Selma520
- Seneca109
- Seventh Mountain335
- Shady Cove3,076
- Shaniko14
- Shedd78
- Sheridan6,339
- Sherwood20,307
- Siletz1,119
- Silver Lake206
- Silverton10,456
- Sisters3,022
- Sodaville309
- South Lebanon939
- Sportsmans Park67
- Spray89
- Springfield61,499
- St. Helens14,258
- St. Paul469
- Stafford1,600
- Stanfield1,902
- Stayton8,292
- Sublimity2,919
- Summerville106
- Summit134
- Sumpter197
- Sunriver1,488
- Sutherlin8,599
- Svensen784
- Sweet Home10,078
- Takilma658
- Talent6,254
- Tangent1,290
- Terrebonne1,602
- Tetherow765
- The Dalles15,917
- Three Rivers3,995
- Tigard56,011
- Tillamook5,218
- Toledo3,546
- Trail769
- Trent407
- Tri-City4,234
- Troutdale15,923
- Tualatin27,763
- Tumalo662
- Turner2,792
- Tutuilla365
- Tygh Valley118
- Ukiah177
- Umapine1,215
- Umatilla7,508
- Union2,290
- Unity27
- Vale2,348
- Veneta5,200
- Vernonia2,786
- Waldport2,177
- Wallowa633
- Wallowa Lake105
- Wamic117
- Warm Springs2,480
- Warren1,637
- Warrenton6,327
- Wasco455
- Waterloo229
- Wedderburn206
- West Haven-Sylvan7,674
- West Linn26,935
- West Scio38
- West Slope6,582
- Westfir253
- Weston443
- Westport263
- Wheeler448
- White City10,750
- Willamina2,193
- Williams760
- Wilsonville26,974
- Wimer421
- Winchester Bay191
- Winston5,690
- Wood Village4,696
- Woodburn27,875
- Yachats979
- Yamhill1,273
- Yoncalla971
Metro and micro areas
Each of the 20 that reach into Oregon, with its whole population, from ACS 2020–2024 5-year estimates. Metro and micro areas are counties tied together by commuting, drawn by the Office of Management and Budget.
- Albany, OR Metro Area130,706
- Astoria, OR Micro Area41,363
- Baker City, OR Micro Area16,840
- Bend, OR Metro Area257,814
- Brookings, OR Micro Area23,381
- Coos Bay-North Bend, OR Micro Area64,827
- Corvallis, OR Metro Area96,303
- Eugene-Springfield, OR Metro Area384,207
- Grants Pass, OR Metro Area88,179
- Hermiston-Pendleton, OR Micro Area92,240
- Hood River, OR Micro Area23,905
- Klamath Falls, OR Micro Area70,247
- La Grande, OR Micro Area26,144
- Medford, OR Metro Area222,645
- Newport, OR Micro Area50,964
- Ontario, OR-ID Micro Area58,725
- Portland-Vancouver-Hillsboro, OR-WA Metro Area2.52M
- Roseburg, OR Micro Area112,072
- Salem, OR Metro Area438,906
- The Dalles, OR Micro Area26,552
ZIP codes
Each of the 421 with people in it, by the town it's centered in, from ACS 2020–2024 5-year estimates. These are the Census Bureau's ZIP Code Tabulation Areas, which follow the Postal Service's ZIP codes as closely as census blocks allow.
- 97001Shaniko353
- 97002Aurora6,358
- 97003Aloha27,811
- 97004Beavercreek4,496
- 97005Beaverton28,311
- 97006Beaverton46,463
- 97007Bull Mountain47,895
- 97008Beaverton28,611
- 97009Boring8,336
- 97011Mount Hood Villages620
- 97013Canby24,293
- 97014Cascade Locks1,459
- 97015Happy Valley24,433
- 97016Clatskanie6,573
- 97017Estacada3,427
- 97018Columbia City2,006
- 97019Sandy3,233
- 97020Donald1,133
- 97021Dufur1,608
- 97022Estacada3,319
- 97023Estacada12,111
- 97024Fairview city12,007
- 97026Gervais3,959
- 97027Gladstone12,347
- 97028Rhododendron230
- 97029Grass Valley442
- 97030Gresham37,708
- 97031Odell19,138
- 97032Hubbard5,044
- 97033111
- 97034Lake Oswego21,331
- 97035Lake Oswego25,911
- 97037Maupin931
- 97038Molalla16,440
- 97039Moro413
- 97040Mosier1,842
- 97041Parkdale3,389
- 97042Mulino3,361
- 97045Beavercreek57,526
- 97048Rainier7,099
- 97049Rhododendron1,896
- 97050Rufus212
- 97051Deer Island17,347
- 97053Warren3,634
- 97054Deer Island1,494
- 97055Sandy19,786
- 97056Warren12,795
- 97057Shaniko14
- 97058The Dalles20,360
- 97060Troutdale21,649
- 97062Tualatin28,930
- 97063Wamic1,081
- 97064Vernonia3,855
- 97065Wasco760
- 97067Mount Hood Villages2,125
- 97068West Linn30,161
- 97070Wilsonville26,902
- 97071Woodburn33,123
- 97078Aloha25,662
- 97080Gresham48,411
- 97086Happy Valley34,567
- 97089Damascus15,101
- 97101Amity3,914
- 97102Neahkahnie324
- 97103Svensen17,993
- 97106Banks4,855
- 97107Garibaldi2,166
- 97108Beaver451
- 97109Vernonia730
- 97110Cannon Beach1,135
- 97111Carlton4,890
- 97112Beaver2,296
- 97113Cornelius16,268
- 97114Dayton5,013
- 97115Dundee3,951
- 97116Banks29,800
- 97117982
- 97118Garibaldi796
- 97119Cherry Grove5,233
- 97121Warrenton1,444
- 97122Cloverdale615
- 97123Hillsboro48,410
- 97124North Plains54,357
- 97125Banks248
- 97127Lafayette4,396
- 97128McMinnville38,664
- 97130Manzanita845
- 97131Nehalem2,359
- 97132Newberg32,486
- 97133North Plains5,416
- 97134Oceanside169
- 97135Pacific City1,190
- 97136Rockaway Beach2,302
- 97137St. Paul989
- 9713811,035
- 97140Sherwood27,933
- 97141Fairview CDP13,086
- 9714466
- 97145Cannon Beach367
- 97146Jeffers Gardens8,099
- 97147Wheeler448
- 97148Yamhill2,738
- 97149Neskowin699
- 97201Portland16,887
- 97202Portland43,533
- 97203Portland33,116
- 97204Portland885
- 97205Portland9,121
- 97206Portland49,890
- 97209Portland22,296
- 97210Portland11,324
- 97211Portland33,769
- 97212Portland28,042
- 97213Portland31,408
- 97214Portland27,714
- 97215Portland17,296
- 97216Portland16,638
- 97217Portland35,169
- 97218Portland15,428
- 97219Portland42,430
- 97220Maywood Park27,202
- 97221Raleigh Hills12,915
- 97222Milwaukie36,398
- 97223Tigard50,527
- 97224Tigard36,569
- 97225West Slope25,869
- 97227Portland5,665
- 97229Bethany76,106
- 97230Portland43,553
- 97231Scappoose4,308
- 97232Portland15,615
- 97233Portland36,236
- 97236Portland37,558
- 97239Portland17,804
- 97266Portland35,423
- 97267Oatfield31,311
- 97301Salem57,574
- 97302Salem40,799
- 97303Keizer40,659
- 97304Keizer34,879
- 97305Labish Village45,083
- 97306Independence34,383
- 97310Salem1,379
- 97317Four Corners25,966
- 97321Albany30,672
- 97322Albany36,408
- 97324Alsea1,470
- 97325Aumsville7,252
- 97326Summit759
- 97327Brownsville3,079
- 9732955
- 97330Adair Village43,878
- 97331Corvallis3,693
- 97333Peoria23,934
- 97335Crabtree228
- 97336Crawfordsville95
- 97338Dallas23,419
- 97341Depoe Bay2,972
- 97342173
- 97343484
- 97344Falls City1,534
- 97345Cascadia330
- 97346Gates1,017
- 97347Grand Ronde1,577
- 97348Halsey2,100
- 97350Idanha219
- 97351Independence11,454
- 97352Jefferson6,497
- 97355Waterloo34,292
- 97357Siletz154
- 97358Gates2,356
- 97360Mill City2,040
- 97361Monmouth14,488
- 97362Mount Angel4,110
- 97364Neotsu746
- 97365Newport11,066
- 97366Newport2,356
- 97367Lincoln Beach11,158
- 97368Rose Lodge2,803
- 97369Depoe Bay334
- 97370Philomath9,521
- 97371Rickreall694
- 97373Mount Angel139
- 97374Scio4,859
- 97375Scotts Mills1,346
- 97376Bayshore1,301
- 97377Shedd581
- 97378Sheridan9,178
- 97380Siletz2,360
- 97381Silverton15,405
- 97383Stayton10,310
- 97385Sublimity3,823
- 97386Holley15,225
- 97388Lincoln Beach911
- 97389Tangent1,755
- 97390816
- 97391Toledo5,536
- 97392Marion6,770
- 97394Waldport5,363
- 97396Fort Hill3,446
- 97401Eugene49,437
- 97402River Road53,823
- 97403Eugene15,355
- 97404Santa Clara34,244
- 97405Eugene46,933
- 97406393
- 97408Coburg15,420
- 97410561
- 97411Bandon7,699
- 97412744
- 97413818
- 97414Myrtle Point415
- 97415Harbor14,586
- 97416981
- 97417Canyonville2,330
- 97419Cheshire1,123
- 97420Bunker Hill27,621
- 97423Coquille6,056
- 97424Cottage Grove18,357
- 97426Creswell10,186
- 97429Days Creek985
- 97430367
- 97431Dexter2,366
- 97432Dillard411
- 97434890
- 97435Drain2,412
- 97436Elkton865
- 97437Elmira2,632
- 97438Lowell1,311
- 97439Heceta Beach16,025
- 97441Gardiner199
- 97442Glendale1,742
- 97443Glide3,116
- 97444Wedderburn5,416
- 97446Harrisburg5,449
- 97447610
- 97448Cheshire14,323
- 97449Lakeside2,208
- 97450Langlois845
- 97451531
- 97452Lowell1,703
- 97453Mapleton965
- 97454Marcola1,168
- 97455Jasper2,461
- 97456Alpine3,422
- 97457Myrtle Creek10,360
- 97458Myrtle Point5,164
- 97459Saunders Lake14,835
- 97461Elmira604
- 97462Oakland4,044
- 97463Oakridge3,652
- 97465Port Orford1,811
- 97466Powers842
- 974675,423
- 97469Riddle2,207
- 97470Roseburg North19,711
- 97471Lookingglass32,334
- 97473Reedsport347
- 97476Langlois338
- 97477Springfield37,534
- 97478Marcola39,373
- 97479Fair Oaks10,447
- 97480Mapleton295
- 97481Lookingglass592
- 97484271
- 97486Melrose595
- 97487Veneta8,498
- 97488604
- 97489821
- 97490460
- 97492Westfir981
- 97493Dunes City491
- 97495Roseburg North1,694
- 97496Dillard7,768
- 97497Glendale1,174
- 97498Yachats2,055
- 97499Yoncalla1,828
- 97501Jacksonville44,670
- 97502Central Point29,067
- 97503Shady Cove13,938
- 97504Medford51,089
- 9752026,512
- 97522Prospect443
- 97523O'Brien7,172
- 97524Butte Falls15,078
- 97525Gold Hill5,129
- 97526Merlin36,036
- 97527New Hope37,330
- 97530Ruch8,860
- 97531Kerby187
- 975322,578
- 97534O'Brien892
- 97535Phoenix4,804
- 97536Prospect1,309
- 97537Wimer7,018
- 97538Selma1,865
- 97539Shady Cove3,369
- 97540Talent8,323
- 97541Trail1,523
- 97543Selma598
- 97544Williams1,860
- 97601Rocky Point22,964
- 97603Falcon Heights33,222
- 97620Plush84
- 97621Beatty257
- 97622Bly369
- 97623Bonanza2,813
- 97624Chiloquin3,643
- 97625134
- 97626Fort Klamath251
- 97627Keno229
- 97630Lakeview5,509
- 97632Malin1,600
- 97633Merrill1,246
- 97634Falcon Heights277
- 97635New Pine Creek239
- 97636Paisley406
- 97637Plush117
- 97638Silver Lake373
- 9763915
- 97640159
- 976411,319
- 9770143,293
- 97702Bend54,657
- 97703Tumalo34,108
- 97707Three Rivers6,661
- 9771080
- 9771129
- 9771260
- 97720Burns4,397
- 97721141
- 9772299
- 97730Camp Sherman319
- 97731Beaver Marsh117
- 97732167
- 97733Crescent Lake639
- 97734Culver3,618
- 97735175
- 9773693
- 97737Gilchrist557
- 97738Hines2,236
- 97739La Pine13,183
- 97741Madras13,663
- 97750416
- 9775171
- 977533,067
- 9775422,960
- 97756Redmond44,914
- 9775891
- 97759Camp Sherman7,737
- 97760Crooked River Ranch8,702
- 97761Warm Springs2,955
- 97801Pendleton21,575
- 97810Cayuse759
- 97812932
- 97813Athena1,508
- 97814Baker City12,590
- 9781713
- 97818Boardman5,610
- 9781917
- 978201,568
- 97823Condon1,014
- 97824Cove2,117
- 97825Dayville347
- 97826Echo1,178
- 97827Elgin2,384
- 978283,522
- 97830Fossil800
- 97833Haines863
- 978341,395
- 97835Helix608
- 97836Heppner1,998
- 97837Unity78
- 97838Hermiston28,512
- 97839116
- 97840Halfway107
- 97841Imbler370
- 97842116
- 97843Ione805
- 97844Irrigon3,701
- 97845John Day2,265
- 97846Wallowa Lake2,067
- 97848217
- 97850La Grande16,903
- 97856Long Creek485
- 97857483
- 97859Meacham95
- 97862Milton-Freewater12,313
- 97864Monument316
- 97865Mount Vernon921
- 97867North Powder947
- 97868Pilot Rock1,598
- 97869Prairie City838
- 97870Richland585
- 97873Seneca109
- 97874Spray262
- 97875Stanfield2,410
- 97876Summerville995
- 97877Granite314
- 97880Ukiah248
- 97882Umatilla7,976
- 978832,489
- 97884Unity84
- 97885Wallowa1,365
- 97886Weston1,221
- 97901954
- 9790217
- 97903Brogan48
- 97904155
- 9790563
- 97906360
- 97907Huntington821
- 9790830
- 97909Brogan24
- 97910645
- 97911Juntura42
- 979135,520
- 97914Ontario19,713
- 9791750
- 97918Vale4,567
- 9792034
School districts
Each of the 197 with people in it, from ACS 2020–2024 5-year estimates. Elementary districts teach the lower grades and secondary districts the upper ones, under them; the rest are unified, teaching every grade.
- Adel School District 2168
- Adrian School District 611,518
- Alsea School District 7J1,178
- Amity School District 4J4,492
- Annex School District 29594
- Arlington School District 3900
- Arock School District 81107
- Ashland School District 526,500
- Ashwood School District 839
- Astoria School District 114,409
- Athena-Weston School District 29J2,947
- Baker School District 5J13,677
- Bandon School District 547,021
- Banks School District 136,840
- Beaverton School District 48J294,537
- Bend-La Pine Administrative School District 1139,472
- Bethel School District 5240,249
- Blachly School District 090826
- Black Butte School District 41494
- Brookings-Harbor School District 1714,562
- Burnt River School District 30J212
- Butte Falls School District 911,053
- Camas Valley School District 21J907
- Canby School District 8631,694
- Cascade School District 516,734
- Centennial School District 28J44,056
- Central Curry School District 15,825
- Central Linn School District 5525,620
- Central Point School District 631,973
- Central School District 13J26,019
- Clatskanie School District 6J5,414
- Colton School District 534,711
- Condon School District 25J1,071
- Coos Bay School District 927,454
- Coquille School District 86,131
- Corbett School District 393,804
- Corvallis School District 509J71,540
- Cove School District 152,026
- Creswell School District 409,038
- Crook County School District26,362
- Crow-Applegate-Lorane Sd 662,012
- Culver School District 44,507
- Dallas School District 223,681
- David Douglas School District 4065,004
- Dayton School District 86,093
- Dayville School District 16J542
- Diamond School District 7elementary101
- Double O School District 28elementary15
- Douglas County SD 449,103
- Douglas County SD 151,621
- Drewsey School District 13elementary133
- Dufur School District 292,217
- Eagle Point School District 931,245
- Echo School District 51,078
- Elgin School District 232,390
- Elkton School District 341,470
- Enterprise School District 213,492
- Estacada School District 10815,231
- Eugene School District 4J172,510
- Falls City School District 571,634
- Fern Ridge School District 28J12,309
- Forest Grove School District 1541,939
- Fossil School District 21J734
- Frenchglen School District 16elementary101
- Gaston School District 511J3,327
- Gervais School District 16,313
- Gladstone School District 11511,462
- Glendale School District 772,303
- Glide School District 126,424
- Grants Pass School District 740,813
- Greater Albany School District 8J69,169
- Gresham-Barlow School District 1J82,378
- Harney County School District 36,075
- Harney County School District 4elementary845
- Harney County Union High School District 1Jsecondary1,424
- Harper School District 66364
- Harrisburg School District 7J5,345
- Helix School District 1727
- Hermiston School District 829,550
- Hillsboro School District 1J141,231
- Hood River County School District 123,905
- Huntington School District 16J817
- Imbler School District 111,422
- Ione School District 2784
- Jefferson County School District 509J16,977
- Jefferson School District 14J6,888
- Jewell School District 81,223
- John Day School District 34,690
- Jordan Valley School District 3490
- Joseph School District 62,199
- Junction City School District 6914,672
- Juntura School District 12elementary92
- Klamath County School District46,923
- Klamath Falls City Schools23,324
- Knappa School District 43,595
- La Grande School District 116,916
- Lake Oswego School District 7J45,299
- Lakeview School District 75,634
- Lebanon Community School District 934,227
- Lincoln County School District51,108
- Long Creek School District 17483
- Lowell School District 713,024
- Mapleton School District 321,471
- Marcola School District 79J1,851
- McDermitt School District 5124
- McKenzie School District 681,924
- McMinnville School District 4042,493
- Medford School District 54995,970
- Milton-Freewater School District 712,389
- Mitchell School District 55403
- Molalla River School District 3521,299
- Monroe School District 1J3,731
- Monument School District 8513
- Morrow School District 111,516
- Mount Angel School District 913,979
- Myrtle Point School District 415,627
- Neah-Kah-Nie School District 569,054
- Nestucca Valley School District 101J5,251
- Newberg School District 29J37,611
- North Bend School District 1316,972
- North Clackamas School District 12131,181
- North Douglas School District 222,676
- North Lake School District 141,853
- North Marion School District 1511,521
- North Powder School District 8J953
- North Santiam School District 29J16,826
- North Wasco School District 2121,593
- Nyssa School District 264,956
- Oakland School District 12,871
- Oakridge School District 764,633
- Ontario School District 818,976
- Oregon City School District 6260,656
- Oregon Trail School District 4630,857
- Paisley School District 11579
- Parkrose School District 326,487
- Pendleton School District 1622,063
- Perrydale School District 211,353
- Philomath School District 17J9,780
- Phoenix-Talent School District 422,890
- Pilot Rock School District 21,585
- Pine Creek School District 5elementary22
- Pine-Eagle School District 612,106
- Pinehurst School District 94215
- Pleasant Hill School District 16,567
- Plush School District 18133
- Port Orford-Langlois School District 2J3,738
- Portland School District 1J513,241
- Powers School District 31878
- Prairie City School District 4981
- Prospect School District 591,309
- Rainier School District 137,817
- Redmond School District 2J61,462
- Reedsport School District 1055,777
- Reynolds School District 775,784
- Riddle School District 702,168
- Riverdale School District 51J3,730
- Rogue River School District 359,937
- Salem-Keizer School District 24J273,066
- Santiam Canyon School District 129J3,737
- Scappoose School District 1J15,534
- Scio School District 953,812
- Seaside School District 1013,861
- Sheridan School District 48J8,009
- Sherman School District 11,938
- Sherwood School District 88J33,870
- Silver Falls School District 4J20,317
- Sisters School District 69,175
- Siuslaw School District 97J16,607
- South Harney School District 33elementary116
- South Lane School District 45J19,813
- South Umpqua School District 1912,186
- South Wasco County School District 12,061
- Spray School District 1355
- Springfield School District 1976,622
- St. Helens School District 50222,891
- St. Paul School District 451,028
- Stanfield School District 612,407
- Suntex School District 10elementary91
- Sutherlin School District 13010,667
- Sweet Home School District 5516,313
- Three Rivers School District48,919
- Tigard-Tualatin School District 23J85,054
- Tillamook School District 913,191
- Troy School District 5456
- Ukiah School District 80248
- Umatilla School District 66,946
- Union School District 52,504
- Vale School District 844,794
- Vernonia School District 47J4,099
- Wallowa School District 121,806
- Warrenton-Hammond School District 307,464
- West Linn School District 3J52,142
- Willamina School District 30J5,999
- Winston-Dillard School District 11611,282
- Woodburn School District 10330,684
- Yamhill-Carlton School District 17,539
- Yoncalla School District 322,604
Congressional districts
As drawn for the 119th Congress (2025–2027).
- Congressional District 1707,875
- Congressional District 2708,237
- Congressional District 3699,535
- Congressional District 4710,014
- Congressional District 5714,831
- Congressional District 6713,801
State senate districts
The upper chamber’s districts, as drawn in 2024.
- State Senate District 1143,740
- State Senate District 2141,125
- State Senate District 3142,483
- State Senate District 4146,454
- State Senate District 5142,504
- State Senate District 6142,469
- State Senate District 7139,435
- State Senate District 8141,961
- State Senate District 9143,012
- State Senate District 10142,337
- State Senate District 11144,660
- State Senate District 12143,265
- State Senate District 13140,813
- State Senate District 14140,905
- State Senate District 15141,889
- State Senate District 16143,912
- State Senate District 17136,924
- State Senate District 18143,950
- State Senate District 19139,016
- State Senate District 20145,937
- State Senate District 21139,087
- State Senate District 22142,302
- State Senate District 23137,447
- State Senate District 24136,029
- State Senate District 25138,379
- State Senate District 26139,104
- State Senate District 27148,935
- State Senate District 28140,770
- State Senate District 29140,907
- State Senate District 30144,542
State house districts
The lower chamber’s districts, as drawn in 2024.
- State House District 171,045
- State House District 272,695
- State House District 371,902
- State House District 469,223
- State House District 569,971
- State House District 672,512
- State House District 771,027
- State House District 875,427
- State House District 971,020
- State House District 1071,484
- State House District 1172,764
- State House District 1269,705
- State House District 1371,951
- State House District 1467,484
- State House District 1572,015
- State House District 1669,946
- State House District 1772,697
- State House District 1870,315
- State House District 1969,810
- State House District 2072,527
- State House District 2171,554
- State House District 2273,106
- State House District 2372,305
- State House District 2470,960
- State House District 2571,204
- State House District 2669,609
- State House District 2767,741
- State House District 2873,164
- State House District 2971,088
- State House District 3070,801
- State House District 3172,215
- State House District 3271,697
- State House District 3366,284
- State House District 3470,640
- State House District 3570,429
- State House District 3673,521
- State House District 3769,579
- State House District 3869,437
- State House District 3974,818
- State House District 4071,119
- State House District 4171,085
- State House District 4268,002
- State House District 4371,044
- State House District 4471,258
- State House District 4569,462
- State House District 4667,985
- State House District 4766,727
- State House District 4869,302
- State House District 4968,759
- State House District 5069,620
- State House District 5170,576
- State House District 5268,528
- State House District 5375,317
- State House District 5473,618
- State House District 5569,554
- State House District 5671,216
- State House District 5771,207
- State House District 5869,700
- State House District 5972,688
- State House District 6071,854
PUMAs
Public Use Microdata Areas: areas of 100,000 people or more that the state draws from census tracts, for the Census Bureau’s microdata.
- Benton County & Linn County (South)–Corvallis & Harrisburg Cities PUMA108,445
- Clackamas County (Northwest)–Lake Oswego, West Linn & Wilsonville Cities PUMA107,957
- Clackamas County (Northwest)–Milwaukie & Happy Valley Cities PUMA109,039
- Clackamas County (Northwest)–Oregon City, Gladstone Cities & Oak Grove PUMA100,075
- Clackamas County (South & East)–Canby, Sandy, Estacada & Molalla Cities PUMA106,904
- Columbia, Clatsop & Tillamook Counties PUMA122,352
- Crook & Jefferson & Deschutes (Outside Bend) Counties–Redmond & Prineville Cities PUMA141,159
- Deschutes County (Central)–Bend City PUMA116,655
- Douglas County PUMA112,072
- Jackson County (Central)–Medford & Central Point Cities PUMA113,067
- Jackson County (Outside Medford & Central Point Cities)–Ashland City PUMA109,578
- Josephine, Coos & Curry Counties PUMA176,387
- Klamath, Malheur, Lake & Harney Counties PUMA117,967
- Lane County (East Central)–Eugene (Northeast) & Springfield Cities PUMA114,069
- Lane County (Outside Eugene & Springfield Cities) PUMA112,817
- Lane County (West Central)–Eugene City (West & South) PUMA157,321
- Linn County (North & East)–Albany & Lebanon Cities PUMA118,564
- Marion County (Outside Salem & Keizer Cities)–Woodburn & Silverton Cities PUMA122,997
- Marion County (West Central)–Salem (North), Keizer Cities & Hayesville PUMA111,204
- Marion County (West Central)–Salem City (South) & Four Corners PUMA115,043
- Multnomah County (East)–Gresham & Troutdale Cities PUMA168,800
- Multnomah County–Portland City (Central East) PUMA123,271
- Multnomah County–Portland City (East) PUMA123,103
- Multnomah County–Portland City (North & Northeast) PUMA123,478
- Multnomah County–Portland City (Northwest & Southwest) PUMA147,100
- Multnomah County–Portland City (Southeast) PUMA115,725
- Polk & Lincoln Counties PUMA140,626
- Umatilla (East & South), Union, Baker & Wallowa Counties PUMA101,593
- Umatilla (Northwest) & Grant Counties, Columbia Gorge & Columbia Basin PUMA104,244
- Washington County (Central)–Beaverton City (West) & Aloha PUMA115,816
- Washington County (Central)–Hillsboro City PUMA123,616
- Washington County (Northeast)–Beaverton City (East & Central) & Cedar Mill PUMA115,524
- Washington County (Southeast)–Tigard, Tualatin & Sherwood Cities PUMA123,047
- Washington County (West)–Forest Grove, Cornelius Cities, Bethany & Oak Hills PUMA125,944
- Yamhill County PUMA108,734
Urban areas
Each that reaches into Oregon, with its whole population. Urban areas are the densely settled land the Census Bureau draws after each census, whatever the city lines.
- Albany, OR62,373
- Astoria, OR15,756
- Baker City, OR10,070
- Bandon, OR4,272
- Bayside Gardens–Manzanita, OR2,715
- Bend, OR110,944
- Brookings, OR11,915
- Burns, OR4,127
- Canby, OR18,610
- Coos Bay, OR30,979
- Coquille, OR4,377
- Corvallis, OR66,744
- Cottage Grove, OR11,668
- Creswell, OR5,873
- Dallas, OR18,475
- Estacada, OR6,004
- Eugene, OR272,819
- Florence, OR12,240
- Grants Pass, OR56,171
- Hermiston, OR29,456
- Hood River, OR–WA15,961
- Junction City, OR6,377
- Klamath Falls–Altamont, OR43,916
- La Grande, OR14,843
- Lebanon, OR23,671
- Lincoln Beach, OR4,042
- Lincoln City, OR10,839
- Longview, WA–OR70,885
- Madras, OR7,631
- McMinnville, OR41,772
- Medford, OR173,050
- Milton-Freewater, OR8,071
- Molalla, OR10,186
- Monmouth–Independence, OR21,694
- Newberg, OR30,938
- Newport, OR12,763
- Ontario–Payette, OR–ID28,680
- Pendleton, OR17,414
- Portland, OR–WA2.11M
- Prineville, OR13,285
- Redmond, OR36,115
- Reedsport, OR4,299
- Rockaway Beach, OR2,090
- Roseburg, OR44,177
- Salem, OR271,150
- Sandy, OR12,720
- Scappoose, OR9,631
- Seaside, OR9,365
- Sheridan, OR6,352
- Silverton, OR10,801
- St. Helens, OR20,230
- Stayton, OR11,322
- Sutherlin, OR9,677
- Sweet Home, OR10,330
- The Dalles, OR16,901
- Tillamook, OR5,977
- Tri-City–Myrtle Creek, OR8,790
- Veneta, OR6,259
- Waldport, OR5,195
- Walla Walla, WA–OR49,549
- Weiser, ID–OR5,960
- Woodburn, OR29,575
Tribal areas
Each that reaches into Oregon, with its whole population.
- Burns Paiute Indian Colony and Off-Reservation Trust Land, OR150
- Celilo Village, OR56
- Coos, Lower Umpqua, and Siuslaw Reservation and Off-Reservation Trust Land, OR61
- Coquille Reservation and Off-Reservation Trust Land, OR443
- Cow Creek Reservation, OR171
- Fort McDermitt Indian Reservation, NV–OR286
- Grand Ronde Community and Off-Reservation Trust Land, OR727
- Klamath Reservation, OR49
- Siletz Reservation and Off-Reservation Trust Land, OR654
- Umatilla Reservation and Off-Reservation Trust Land, OR–WA2,840
- Warm Springs Reservation and Off-Reservation Trust Land, OR2,955
Turn Oregon into your planning report.
Social Explorer Studio builds an editable profile of any place, with tables and charts beside the county and state, and exports to Word, PDF and Excel.
Questions about Oregon
What is the population of Oregon?
4,273,586 people, according to the ACS 2025 1-year estimates, which the Census Bureau adjusts to match its own population estimate. That’s the 27th largest of the 50 states and DC.
What is the FIPS code for Oregon?
41. Every county’s and place’s FIPS code in Oregon starts with it. The Census Bureau’s full geographic identifier (GEOID) is 0400000US41.
What is the largest city in Oregon?
Portland, with 633,944 people. Other large cities here include Salem, Eugene and Gresham.
What is the median household income in Oregon?
$86,953 (±$1,920), according to the ACS 2025 1-year estimates, higher than the US ($84,780).
What is the median age in Oregon?
41.3 years (±0.2), according to the ACS 2025 1-year estimates, higher than the US (39.5).
How much does housing cost in Oregon?
Oregon’s median home value is $507,900 (±$4,066) and its median gross rent is $1,629 (±$18) a month, according to the ACS 2025 1-year estimates. 50.0% (±1.8%) of its renters pay 30% or more of their income on rent.
Is Oregon growing?
Oregon’s population grew 6.1%, from 4,028,977 in 2015 to 4,273,586 in 2025, according to the ACS 1-year estimates.
Where do people who work in Oregon live?
1,845,996 of its 1,977,253 jobs are held by people who live here. Of those who commute in, the most come from Washington, California, Idaho.
Where does this census data come from?
The U.S. Census Bureau’s American Community Survey, through Social Explorer’s tables: the latest 1-year estimates where they exist, for the most recent numbers, and 5-year estimates otherwise. Each table lists its code, so you can find it again.
Is this data free to use?
Yes. You can read it, cite it, download the CSV and embed the charts, with no account. To map other variables, compare your own areas or build a report, see Social Explorer’s plans in a live demo.
Sources and how to cite
American Community Survey 2025 1-year estimates, or 2020–2024 5-year estimates where noted, U.S. Census Bureau, from Social Explorer’s tables A00001, A00002, A01004, A04001, A06001, A08001, A09005, A10001, A10003, A10008, A10030, A10036, A10040, A10047, A10055, A10060, A12001, A13004, A14006, A14024, A14028, A16002, A17005, A18002, A18009, A20001, B02002, B09001, B13002, B18101, C16001. Maps by census tract use 2020–2024 5-year estimates, since the 1-year survey doesn’t cover tracts. Commuting: LEHD LODES 2023. These are estimates from a sample, each with its margin of error. Data retrieved November 14, 2026. How these profiles are made.
U.S. Census Bureau, American Community Survey 2025 1-year estimates, or 2020–2024 5-year estimates where noted, via Social Explorer. “Oregon.” https://www.socialexplorer.com/places/oregon. Accessed November 14, 2026.