

Social Explorer Powerful analysis. Made easy.
Social Explorer is an online platform that brings ready-to-use data, mapping and analysis together in one place.
Skip the downloading, cleaning and joining. Explore data from the Census Bureau, the CDC, the FBI and more, compare places and answer complex questions, then create maps, reports and dashboards to share what you find.
- Already use Social Explorer? Login
- Part of a university or library? Check your access
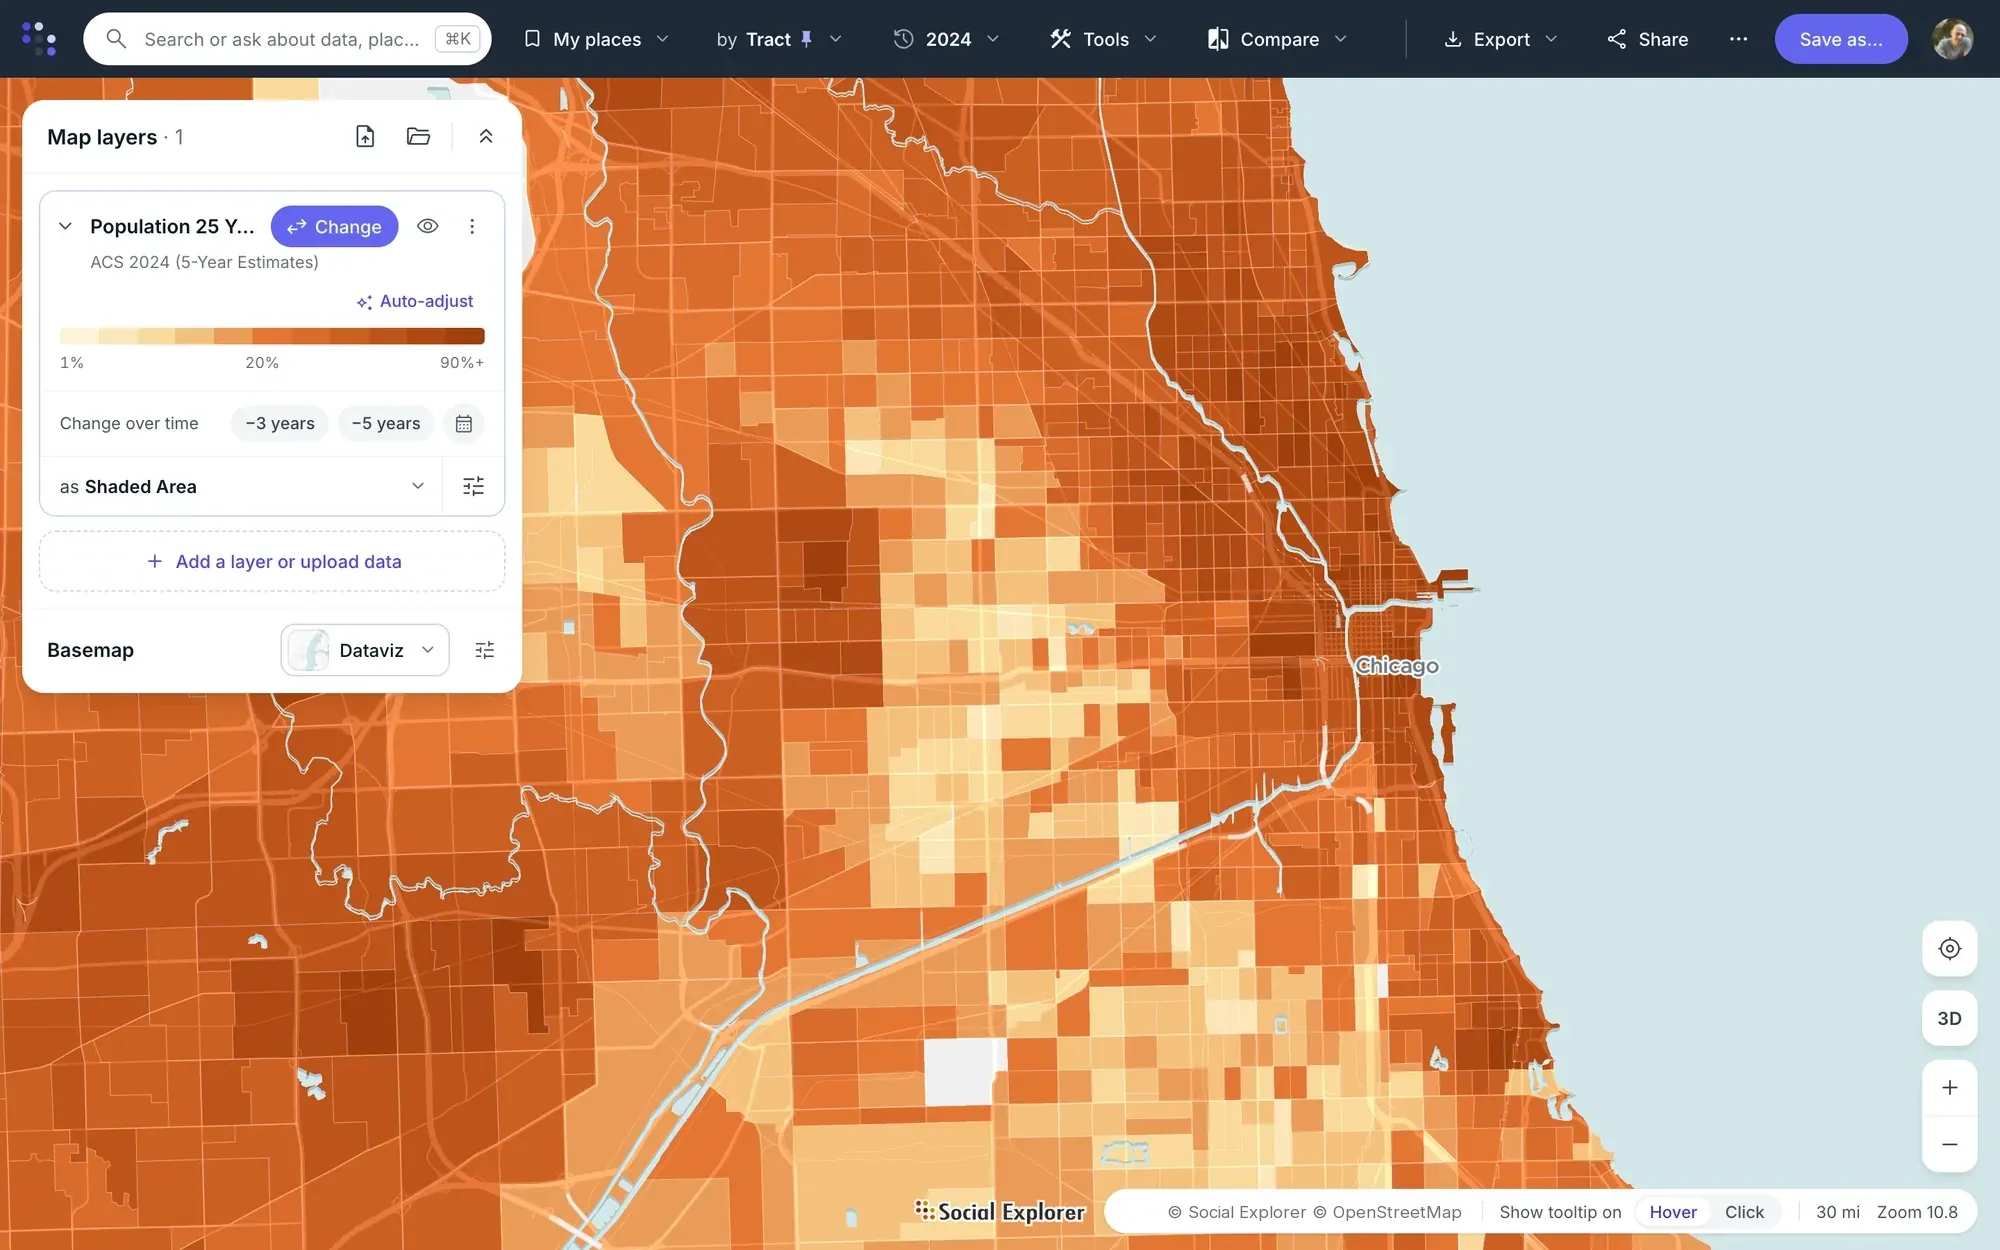
Search for a place, pick a variable from 610,000+, and the map shades every area. Map: adults with a bachelor’s degree in Chicago by census tract.
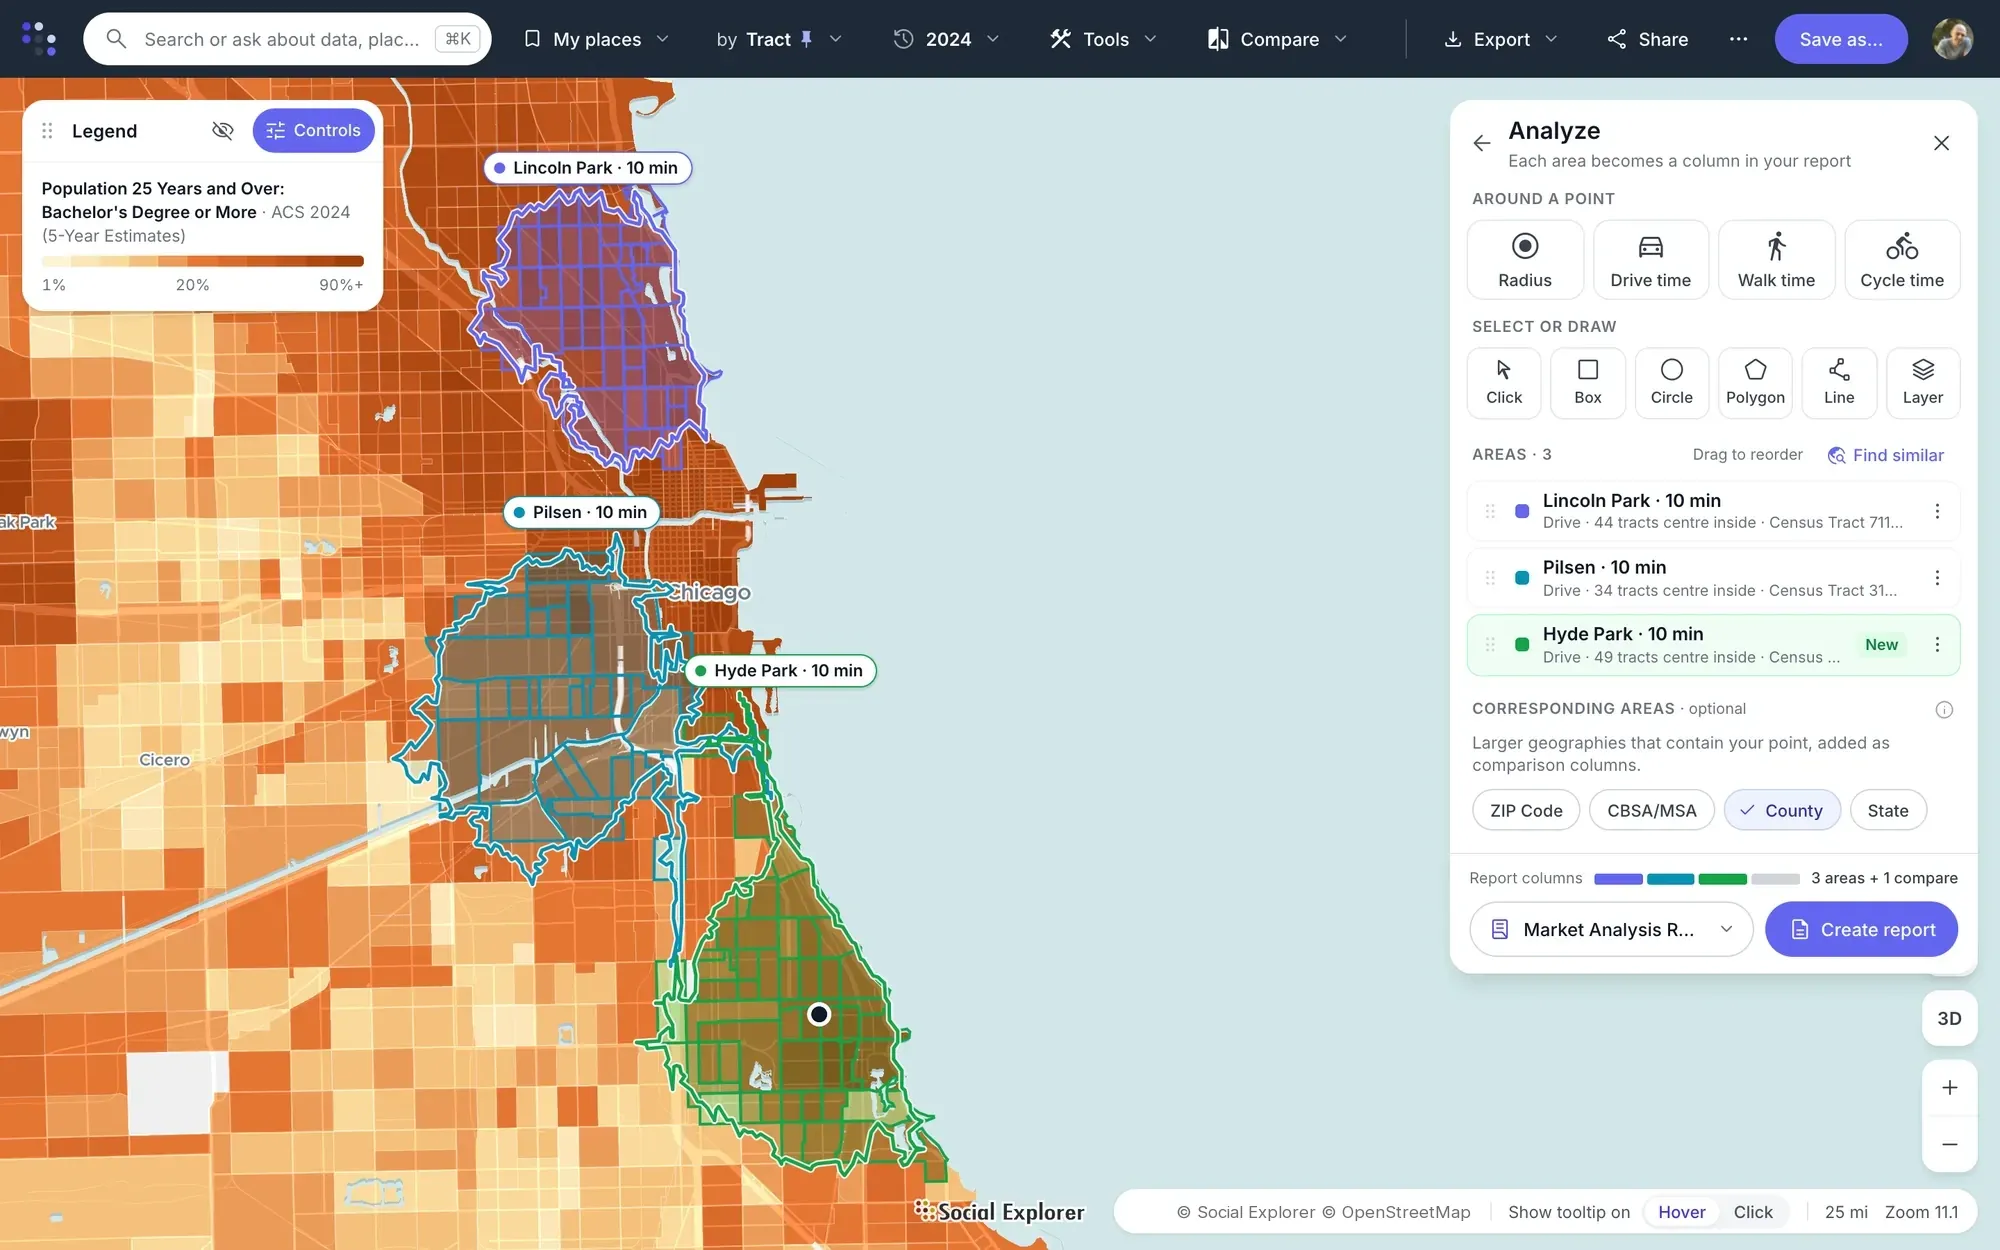
Click a site and choose a drive, walk or cycle time. Each area becomes a column in one report, beside the county.
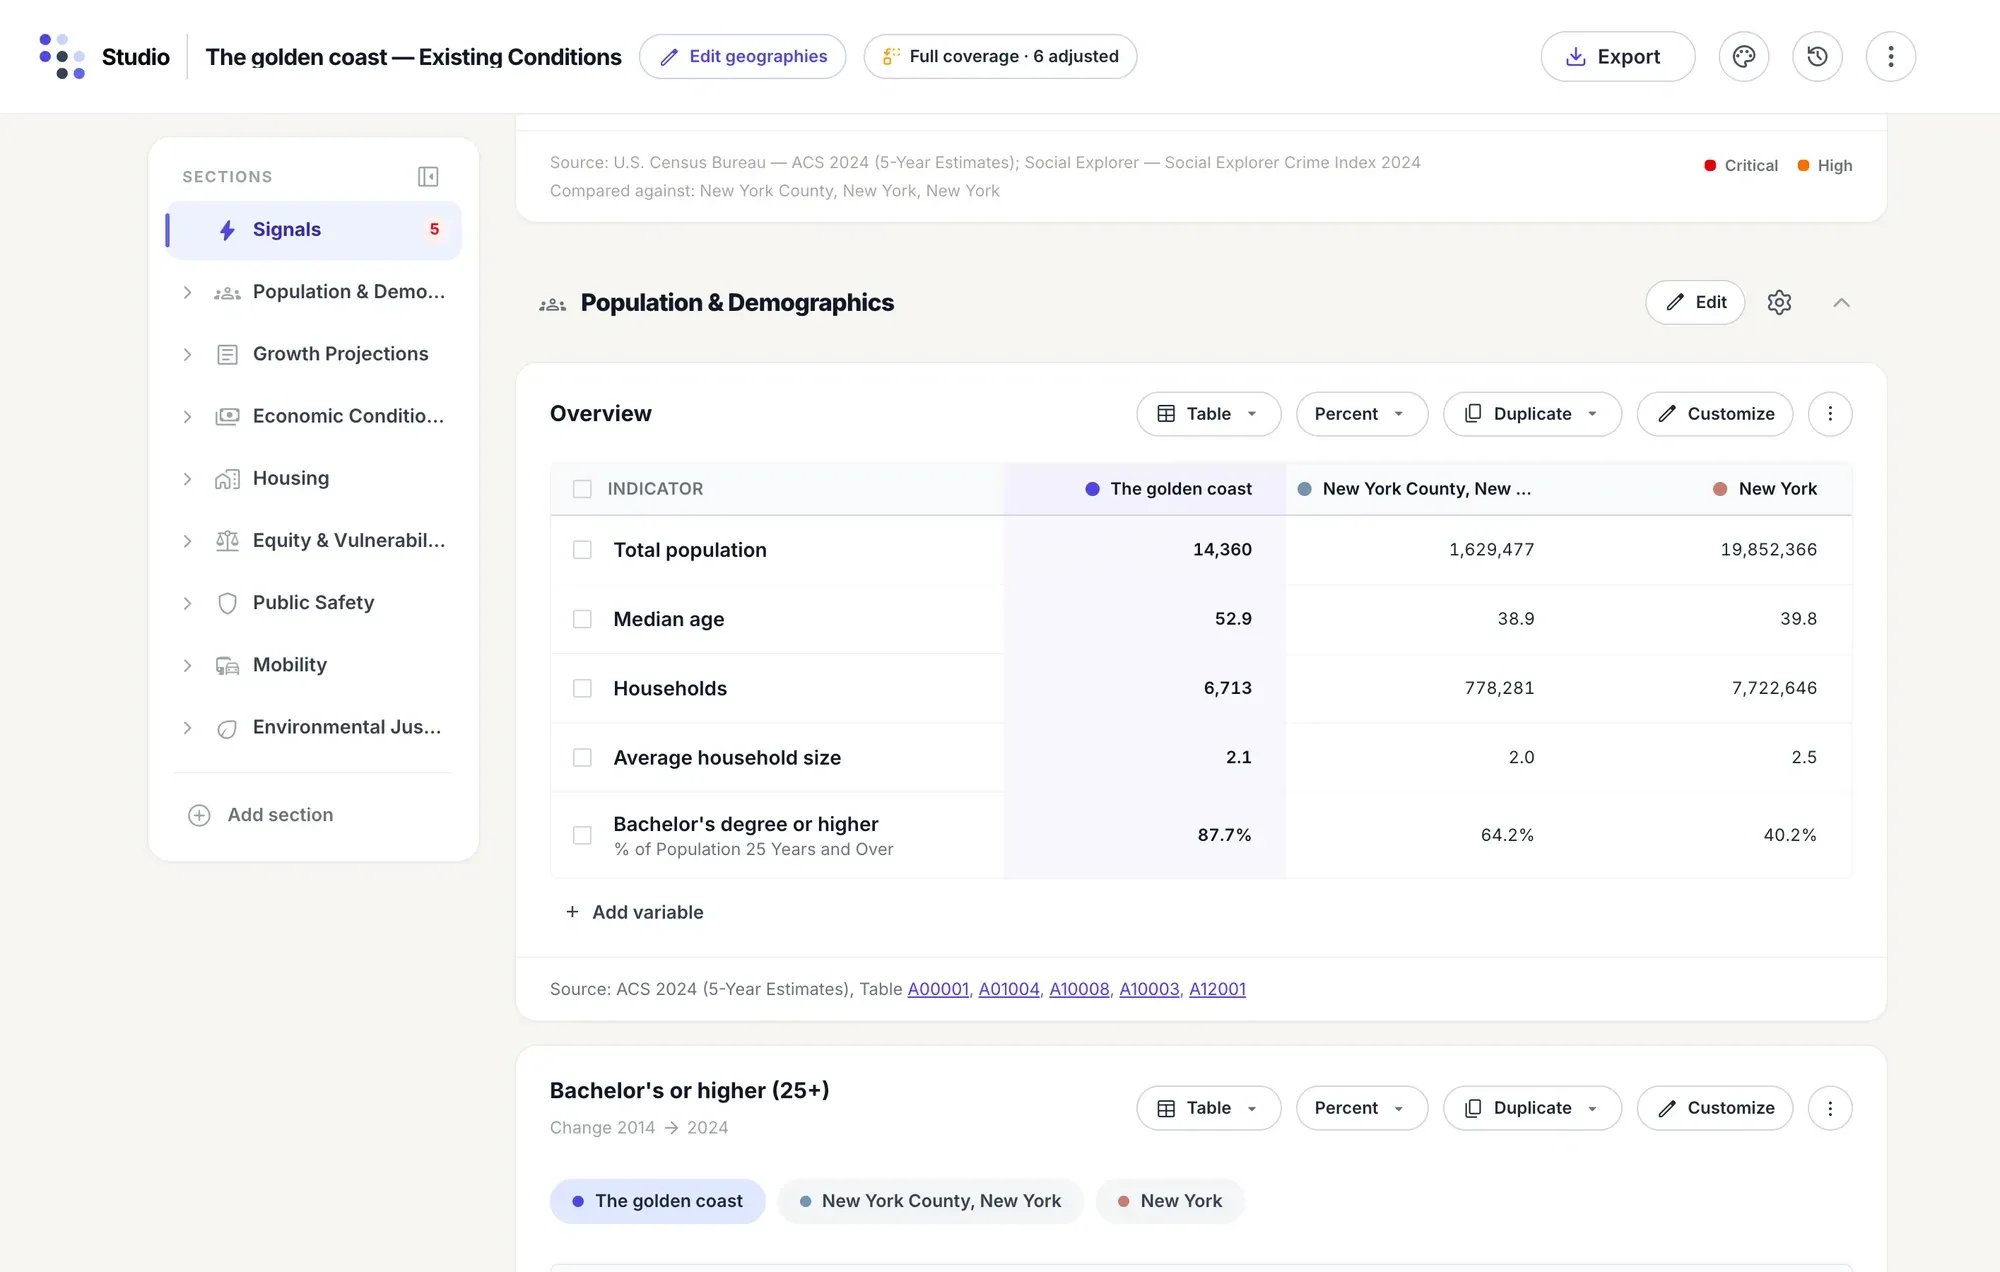
Name a place and pick a report, and Social Explorer Studio builds every section, with tables and charts and options to compare geographies.
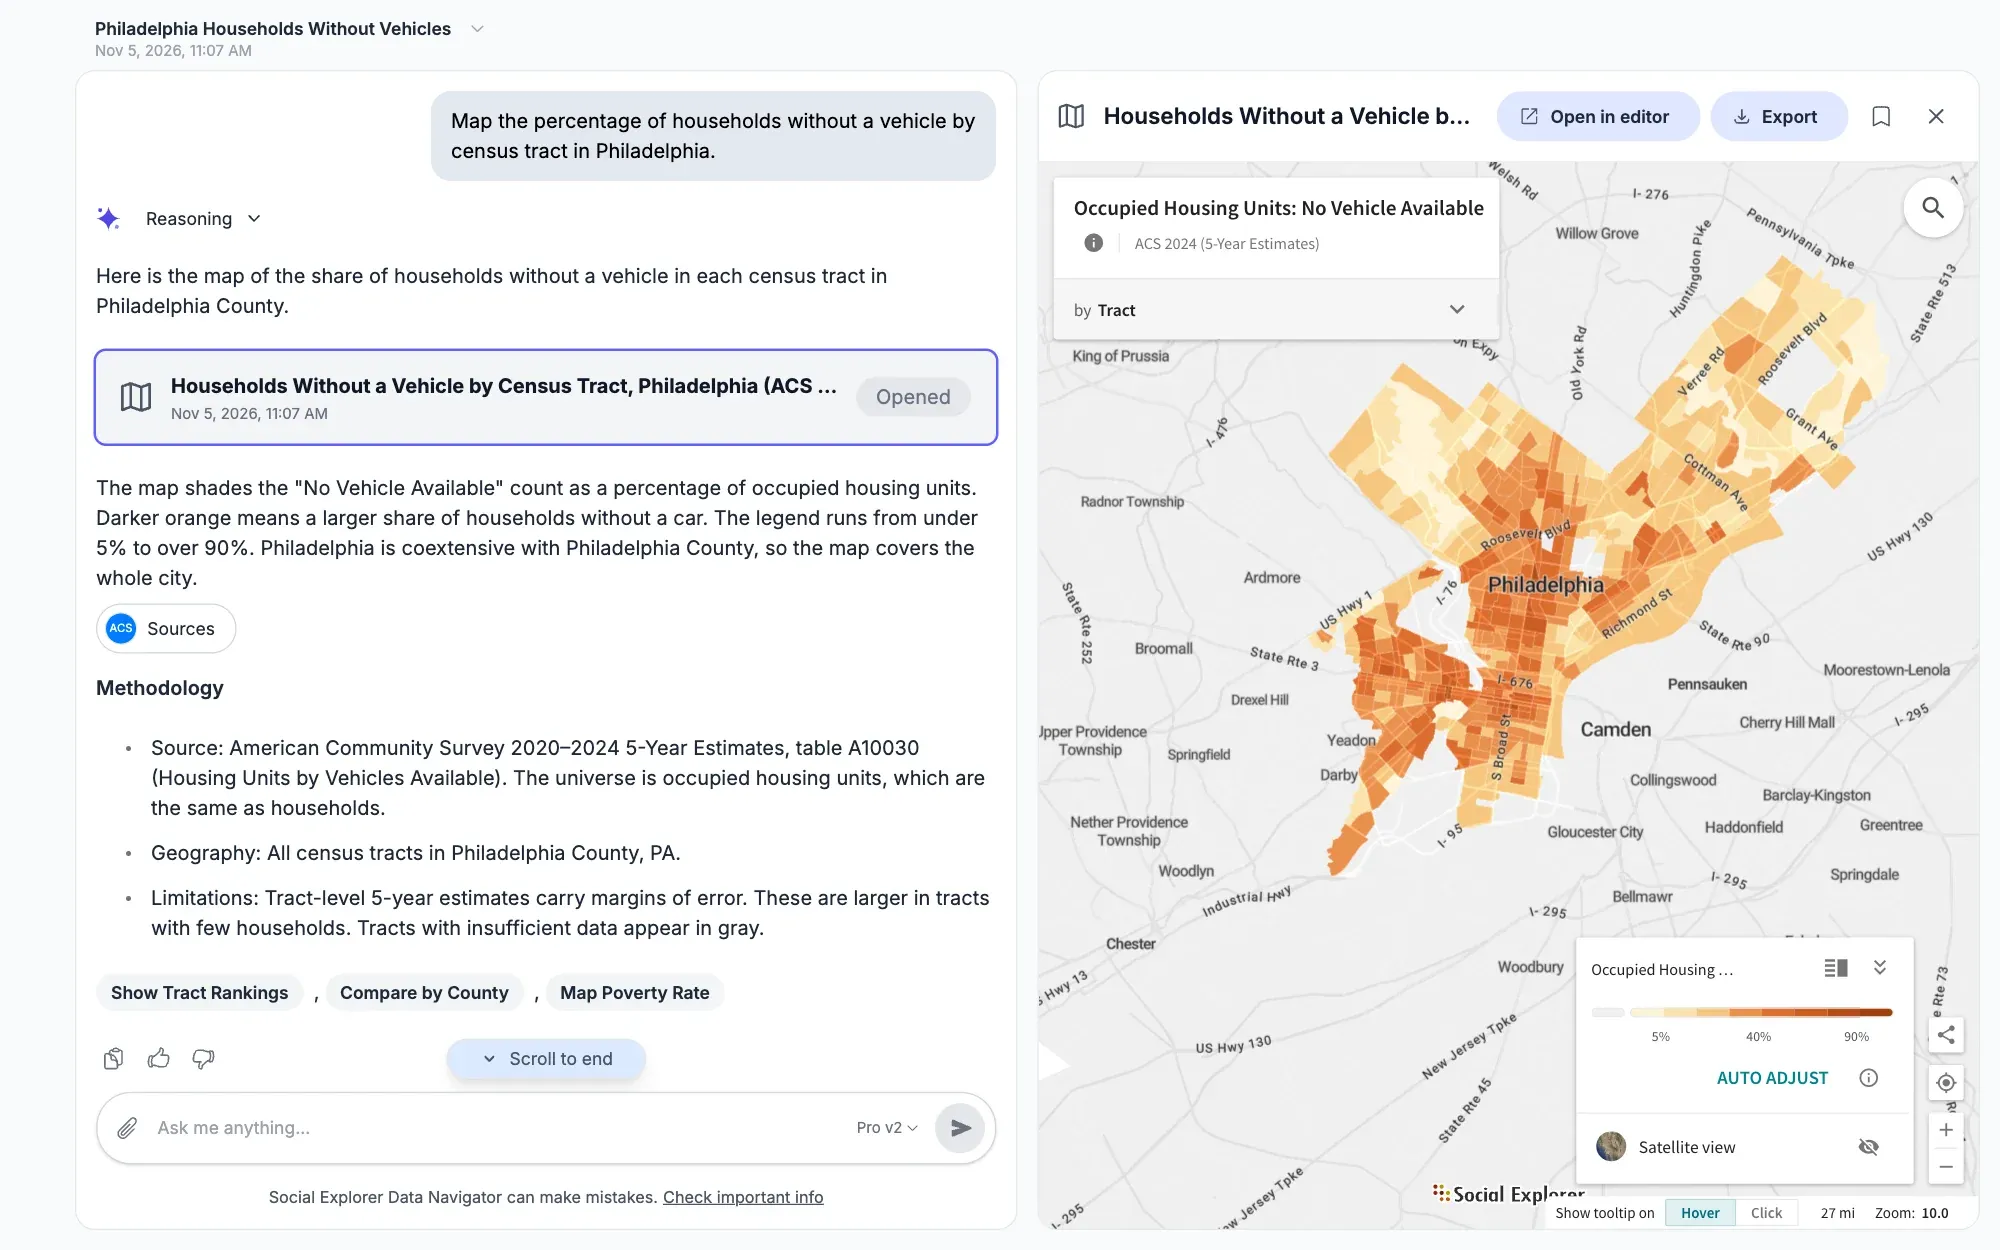
Use natural language prompts with our Data Navigator to explore and analyze data. From simple tables, maps and charts to advanced regression analysis. All answers and methods fully sourced.
From your first map to advanced analysis.
-
Choose a place.
Search for an address, a city, a county or a tract, or click it on the map.
-
Explore the data.
Search for a topic in plain words, or let the topic wizard walk you through it. No GIS skills needed.
-
Share what you find.
Export a report, share a link or an embed, or build a profile people can read.
Trusted by over 2,000 institutions








Data library
Ready-to-use data. Ready when you are.
Map population and income, health and housing, jobs, education, the environment, crime and elections, with data from the Census Bureau, CDC, HUD, EPA, the Bureau of Labor Statistics and many more. Every state and county, down to ZIP codes and neighborhoods, ready to explore the moment you sign in.
- Variables in the latest data from 29 publishers, and 13.6 million+ across all survey years
- 610,000+
- Years covered, from the first US census to projections for 2030
- 1790–2030
- Neighborhood-level detail, in data from the Census Bureau, CDC, EPA, HUD and more
- Block group
Browse by topic
What you can do
What do you want to find out?
Start with a place, a question or your own data: map it, compare locations and build a report, then go further.
First steps
Map and analyze 610,000+ variables, from states down to block groups depending on the dataset.
Explore population mapping in Maps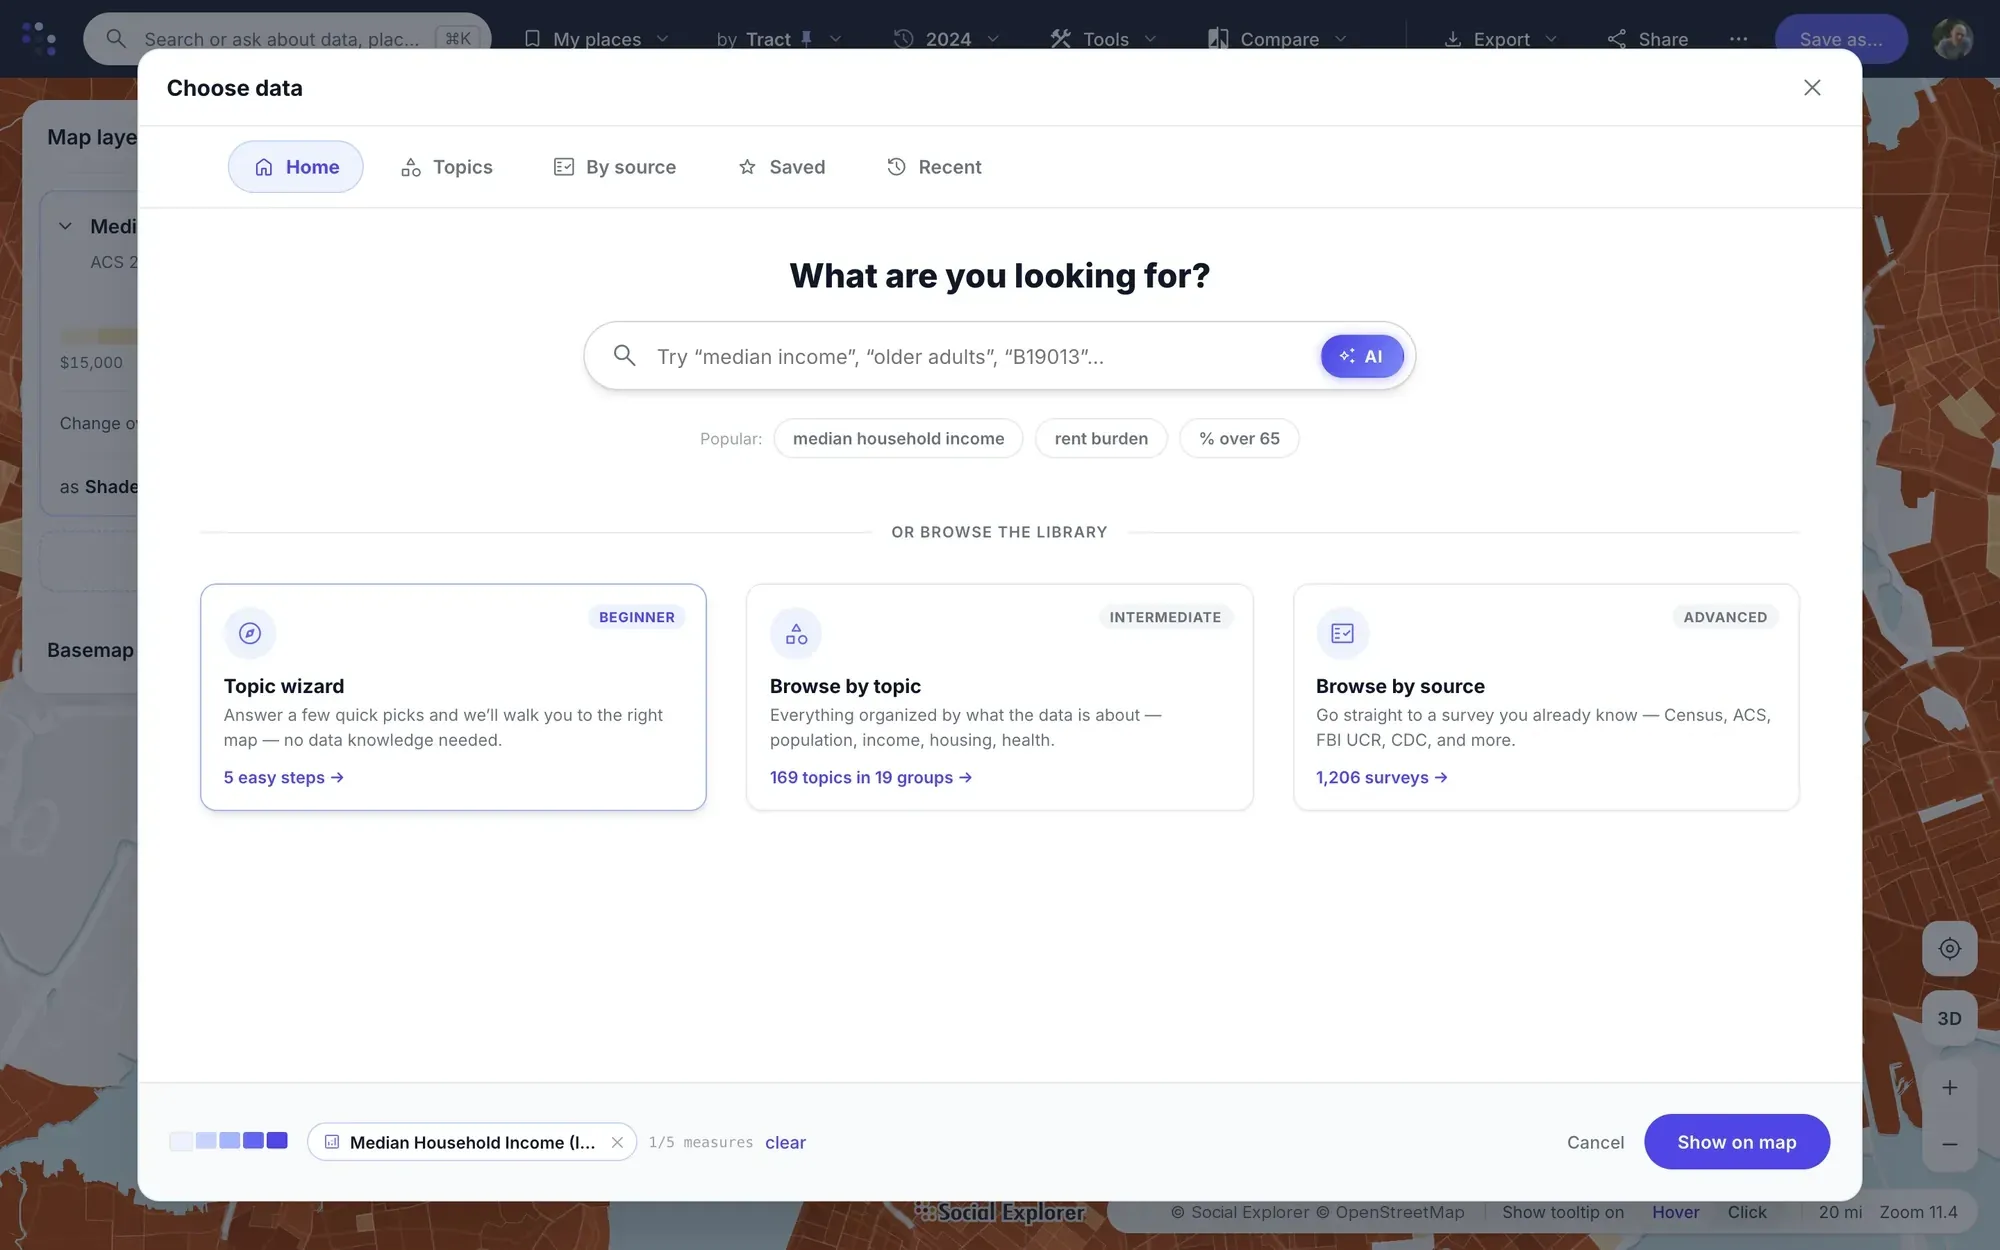
- Search for a place, or click it on the map.
- Pick a topic or a variable, or let the topic wizard walk you through it.
- Every area is shaded, with its legend and source. Click one for its numbers, or switch the year to see what changed.
Draw the area each site serves and compare them side by side.
Compare locations for site selection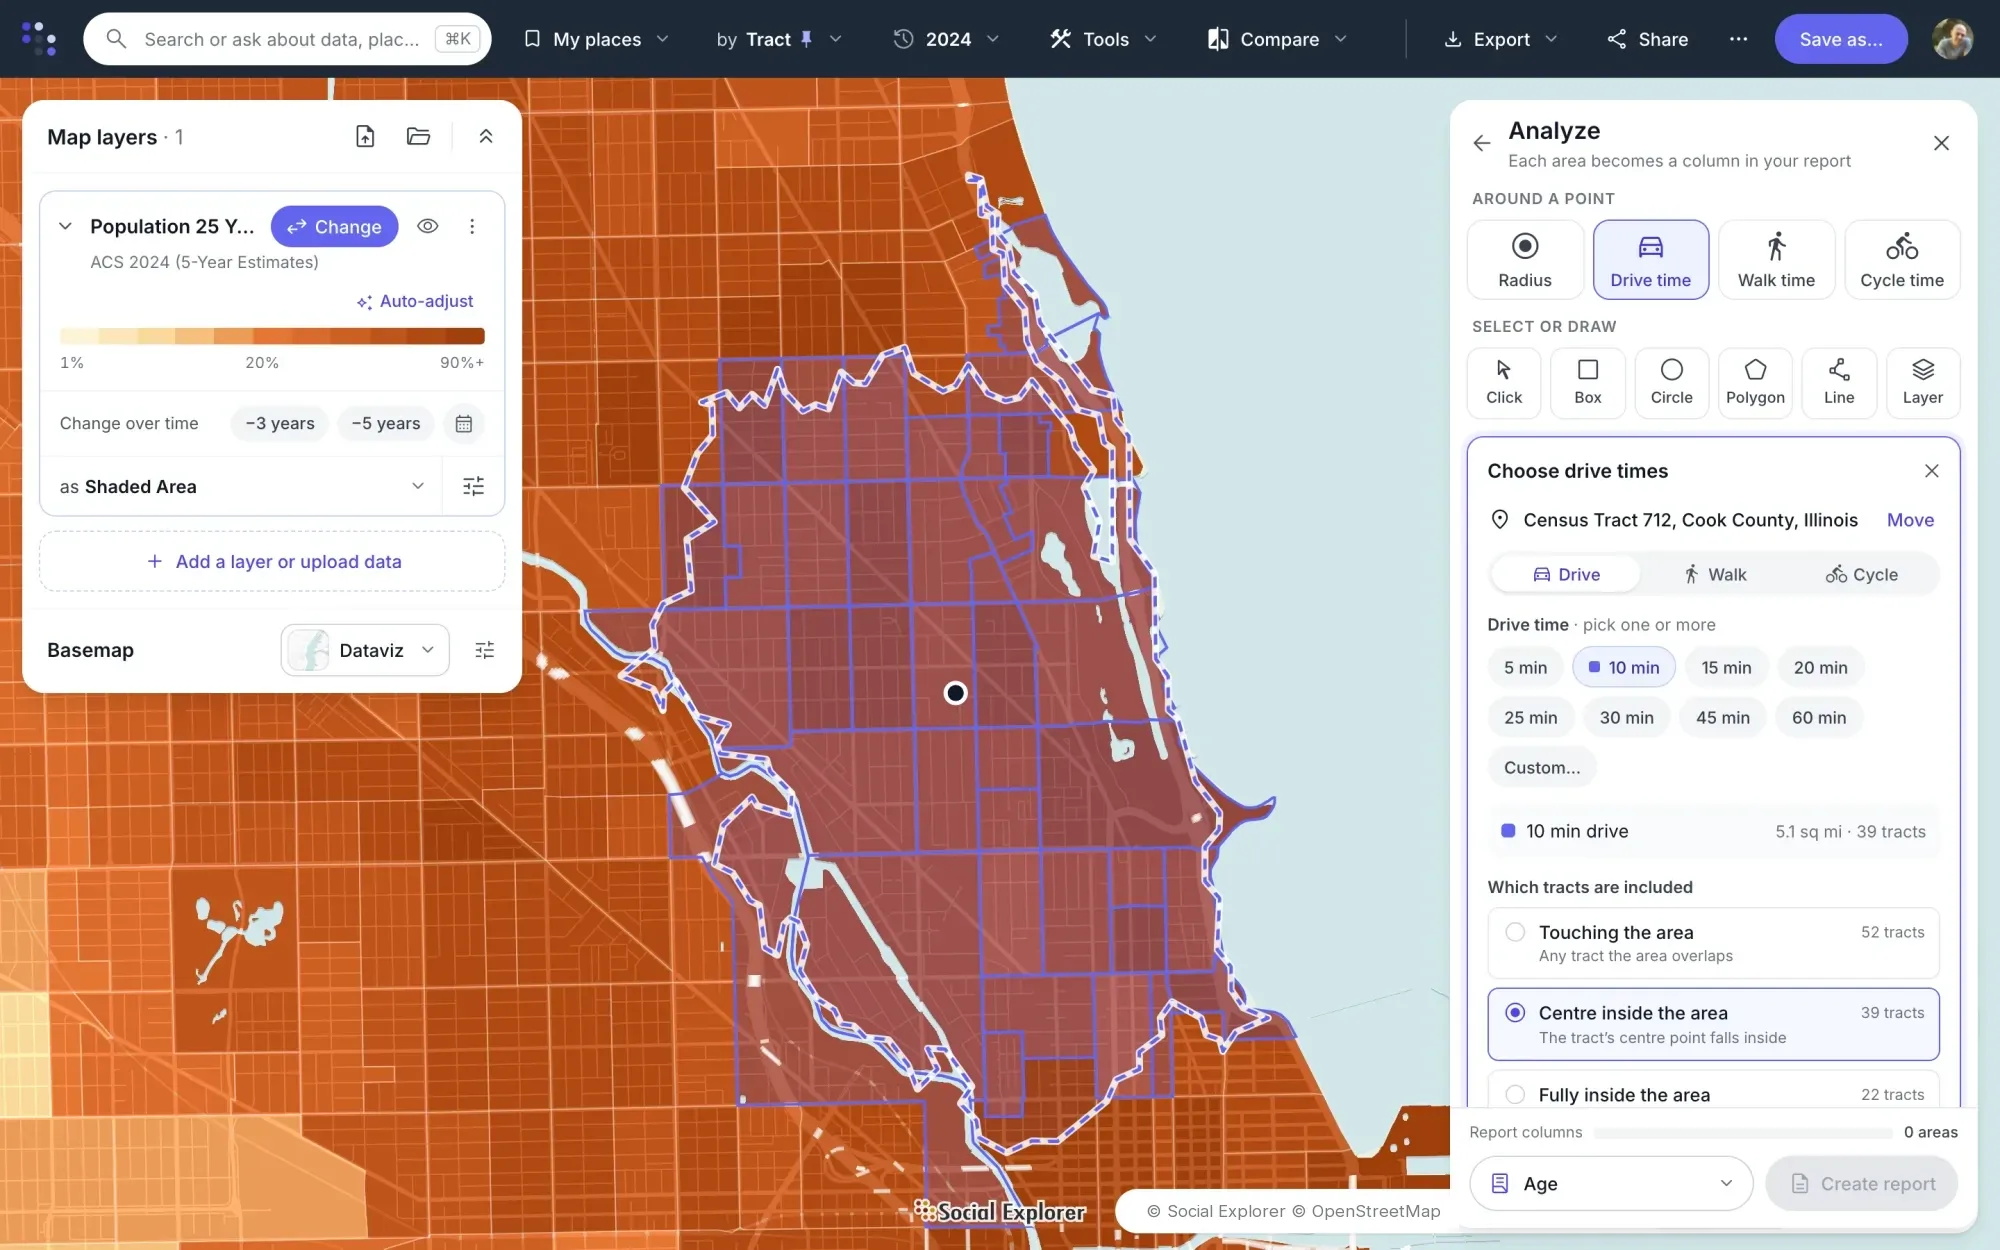
- Click a store, a clinic or a branch, and choose a radius or a drive, walk or cycle time.
- Choose which tracts count: those touching the area, those with their center inside it, or those fully inside.
- Add the next site, and the next. Each area becomes a column in one report, with the county beside them.
Turn any comparison into a report with its sources, and export it the way you need it.
Reports and exports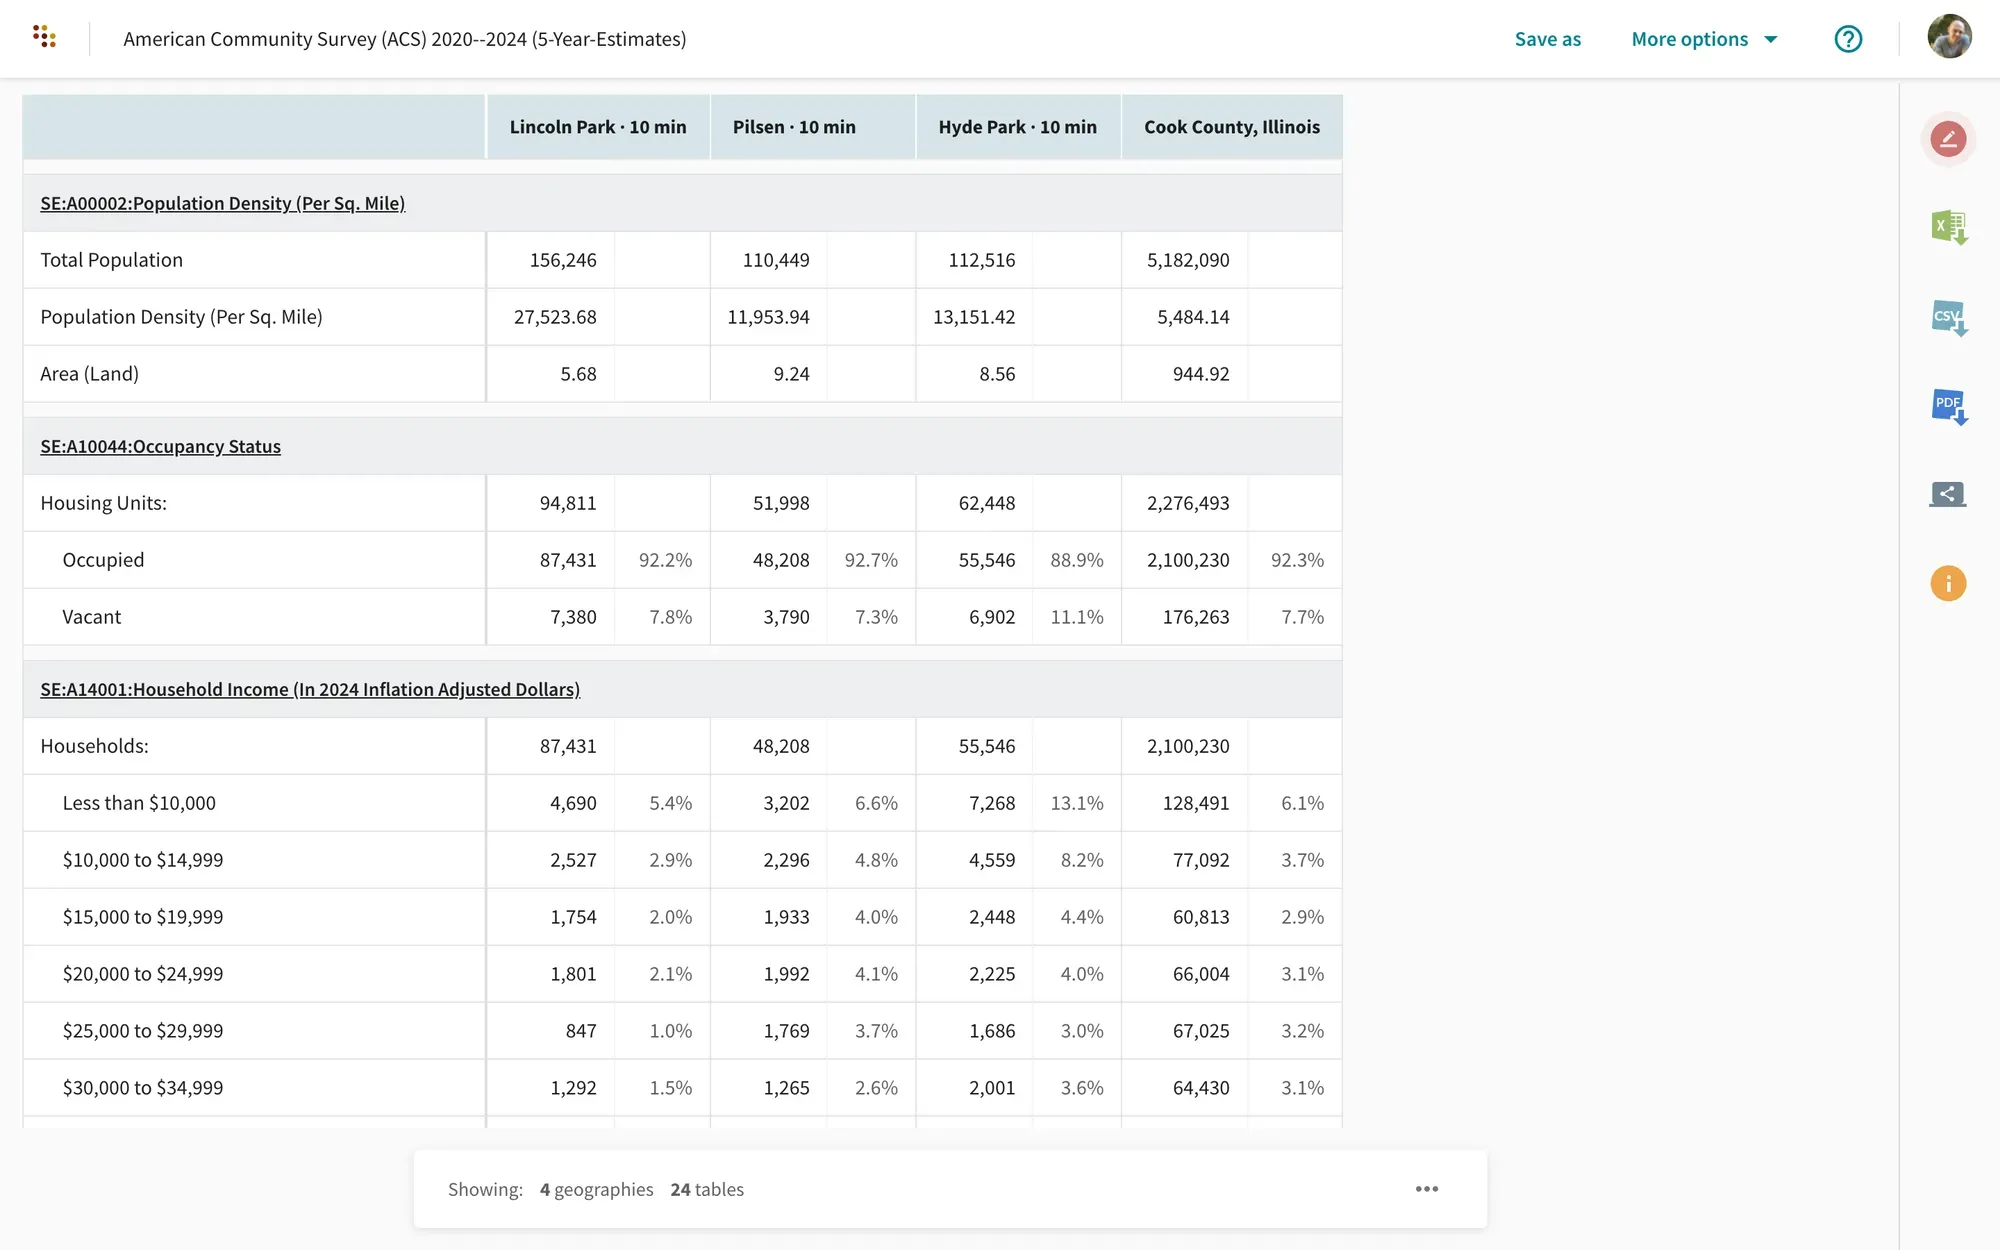
- Open the report for the areas you chose.
- Add up to three years, with dollars adjusted for inflation.
- Export to Excel, CSV, PDF, SAS, SPSS or Stata, and cite it in Chicago, MLA or APA style.
Go further
Find the areas most like the ones that work for you, on the measures you choose.
Find similar areas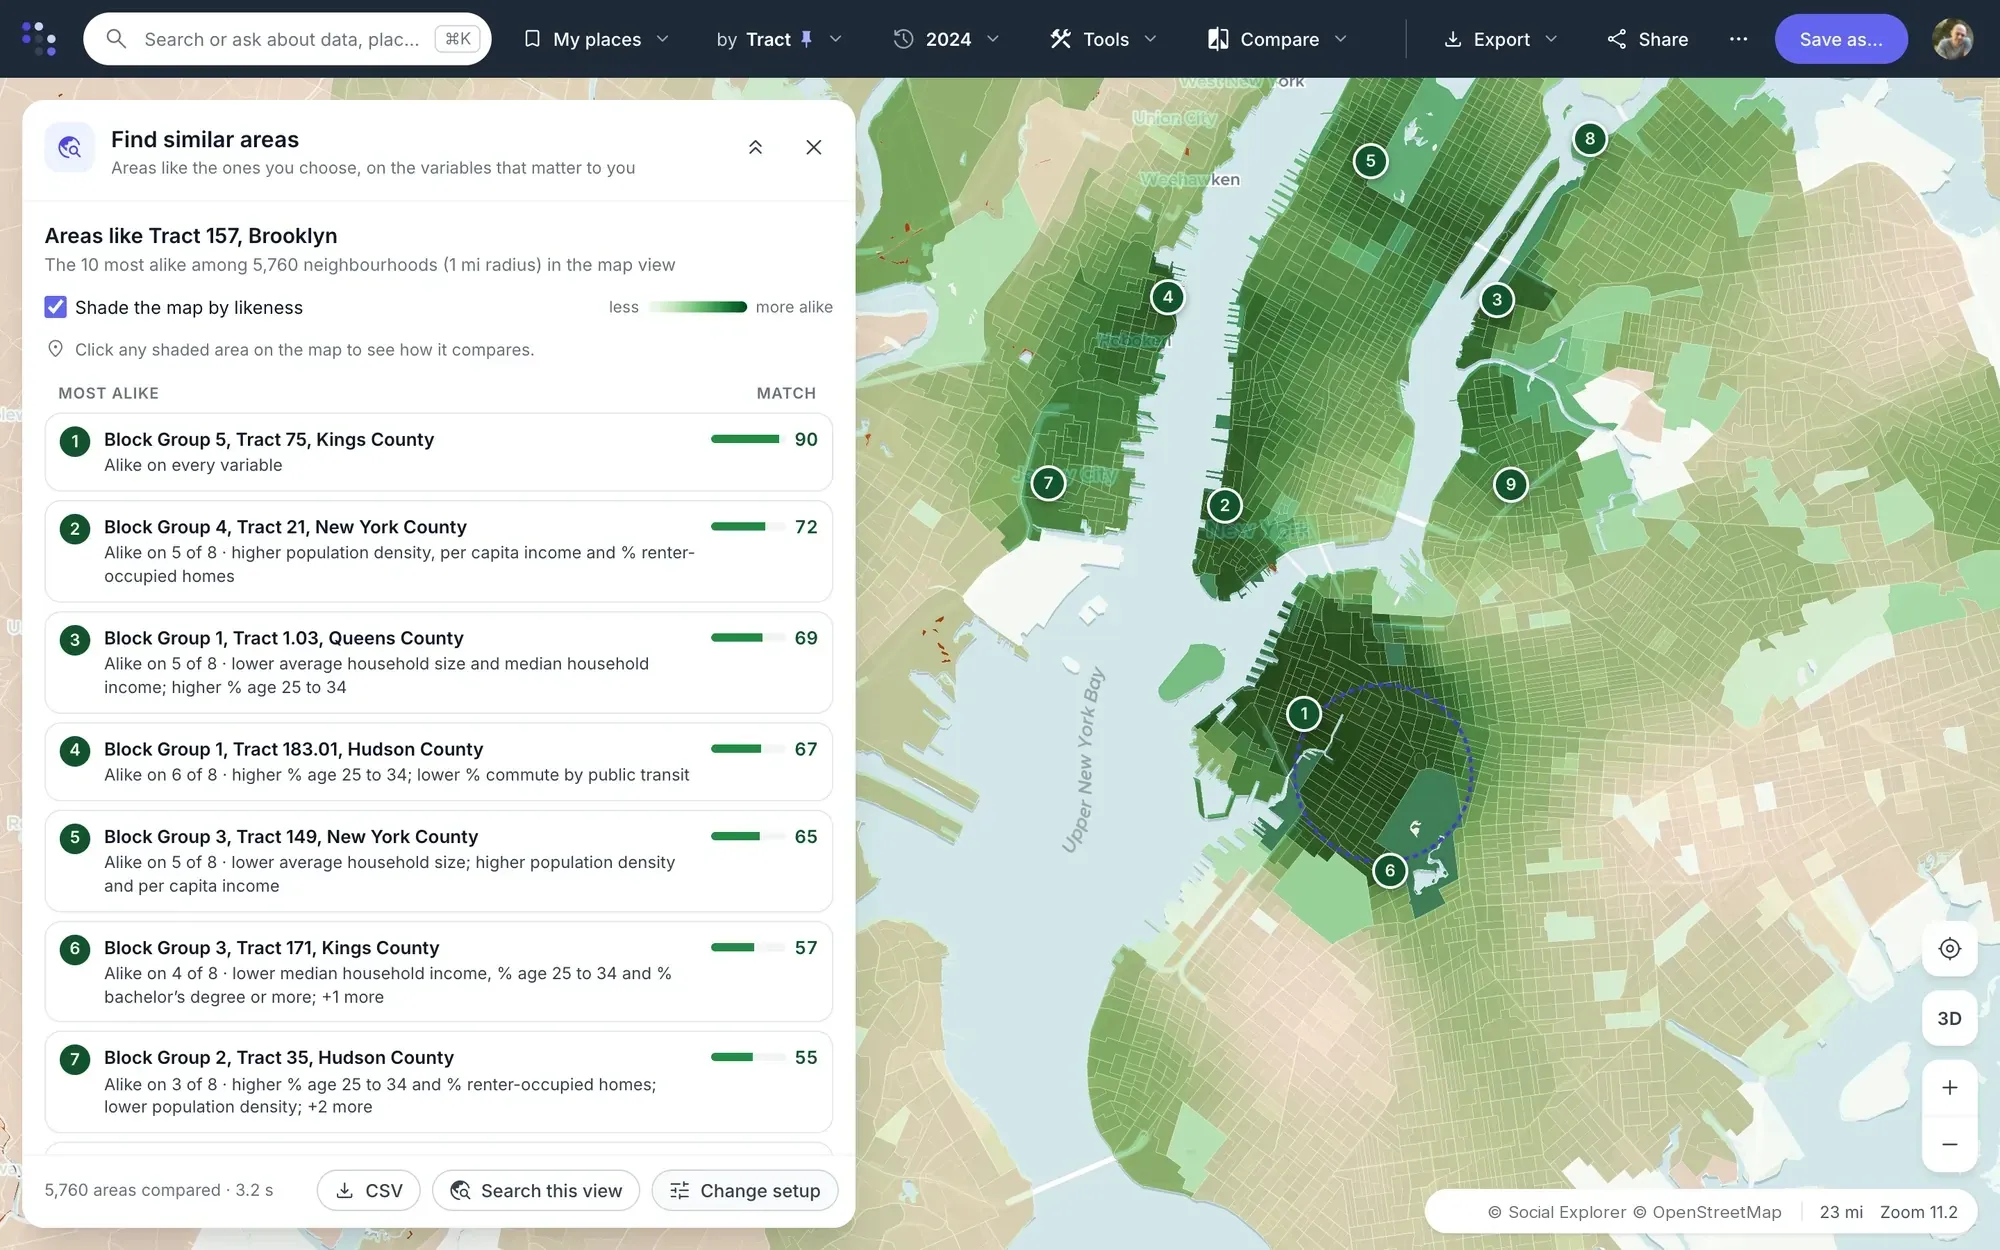
- Start from a store, a site or an area.
- Choose the characteristics that matter to you.
- Every other area is scored by how alike it is, with the ten most alike listed and what each one shares.
Likeness describes the characteristics you chose. It doesn’t predict how a new site will perform.
See how your sales or visits relate to the neighborhoods around each location.
Explore relationships in the data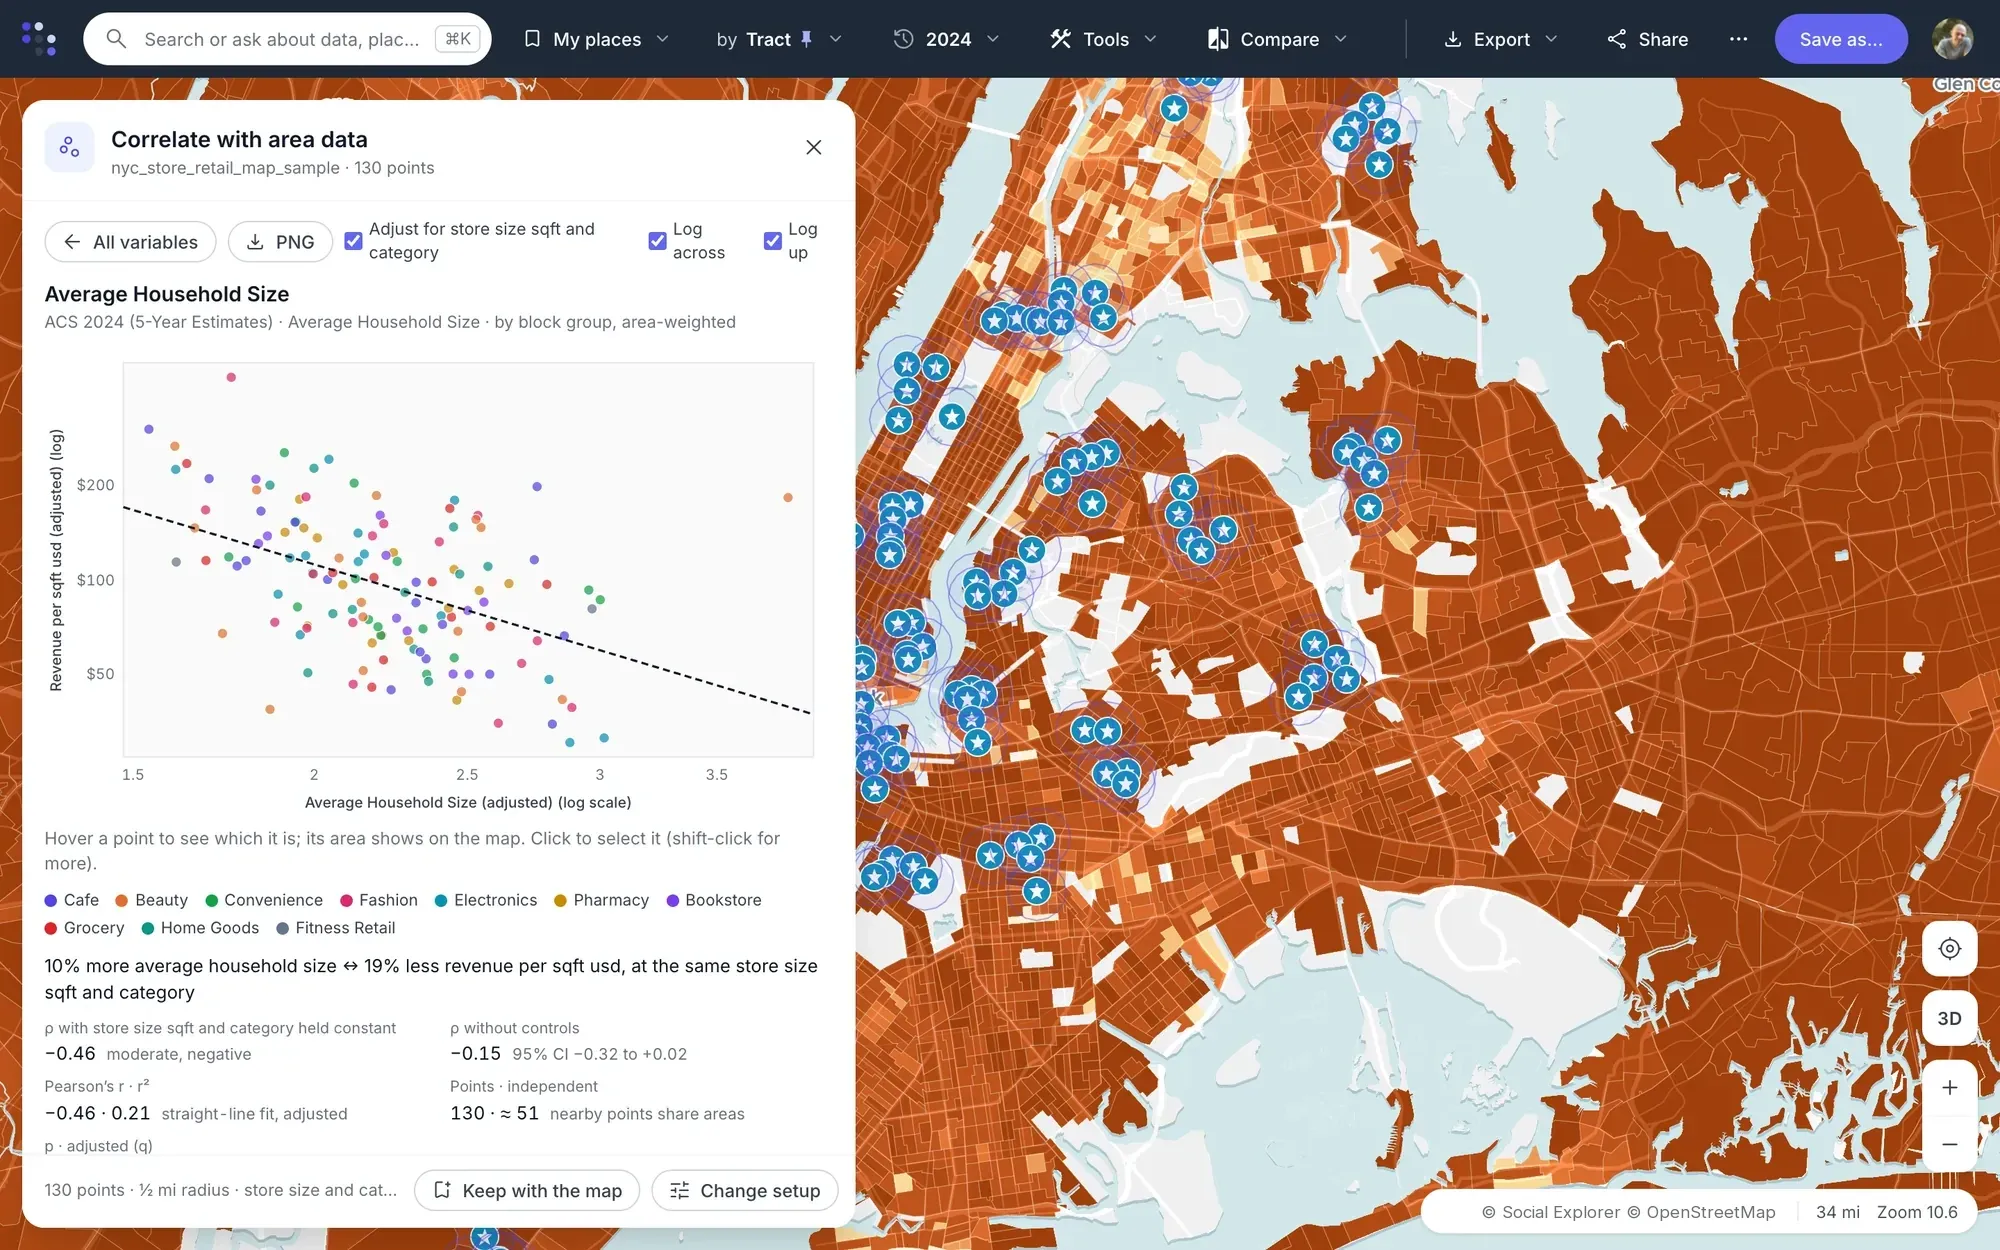
- Upload your locations with a measure, such as sales or visits.
- Choose the neighborhood data to compare it with.
- See the relationship in a scatter plot, explained in a sentence.
A relationship shows what moves together across areas, not what causes what, and describes areas rather than the people in them.
Gather the data about your area into one Studio dashboard, beside benchmark places, then turn it into a report or a presentation.
Build a data dashboard in Studio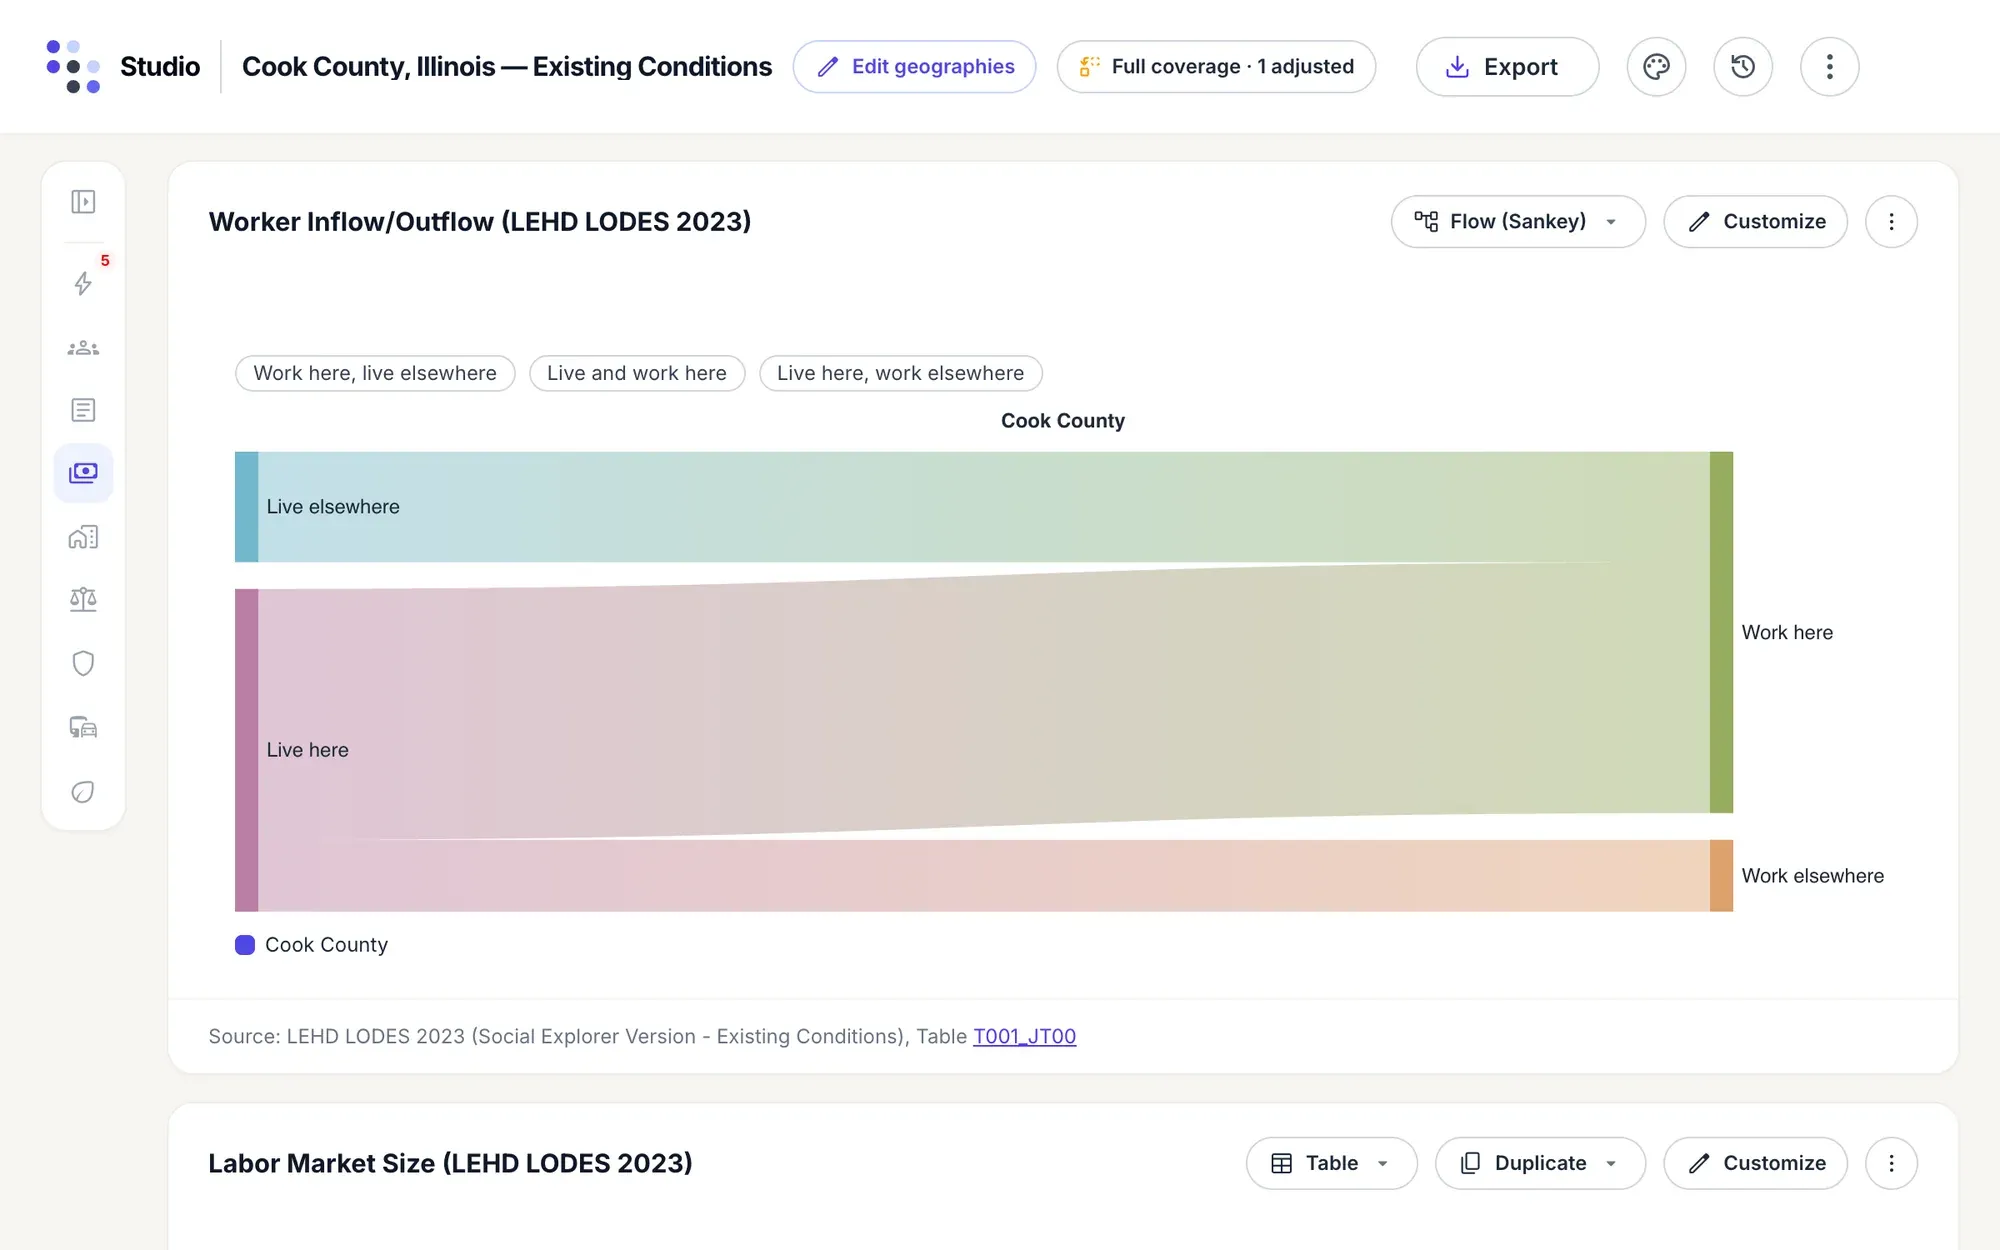
- Choose your place, or build your own area from census tracts, and add benchmarks such as the county and state.
- Pick a report, and Studio fills the dashboard with tables and charts, each showing your area beside its benchmarks. Add any variable from the catalog.
- Export it as a Word report, a print-ready PDF or an Excel workbook, or download any chart or table as a PNG or SVG for your slides.
Studio
Tell the whole story of a place.
Studio turns a place into a community profile people can read and use. Pick a report, and Studio brings tables, charts and findings together, with reference areas for context.
-
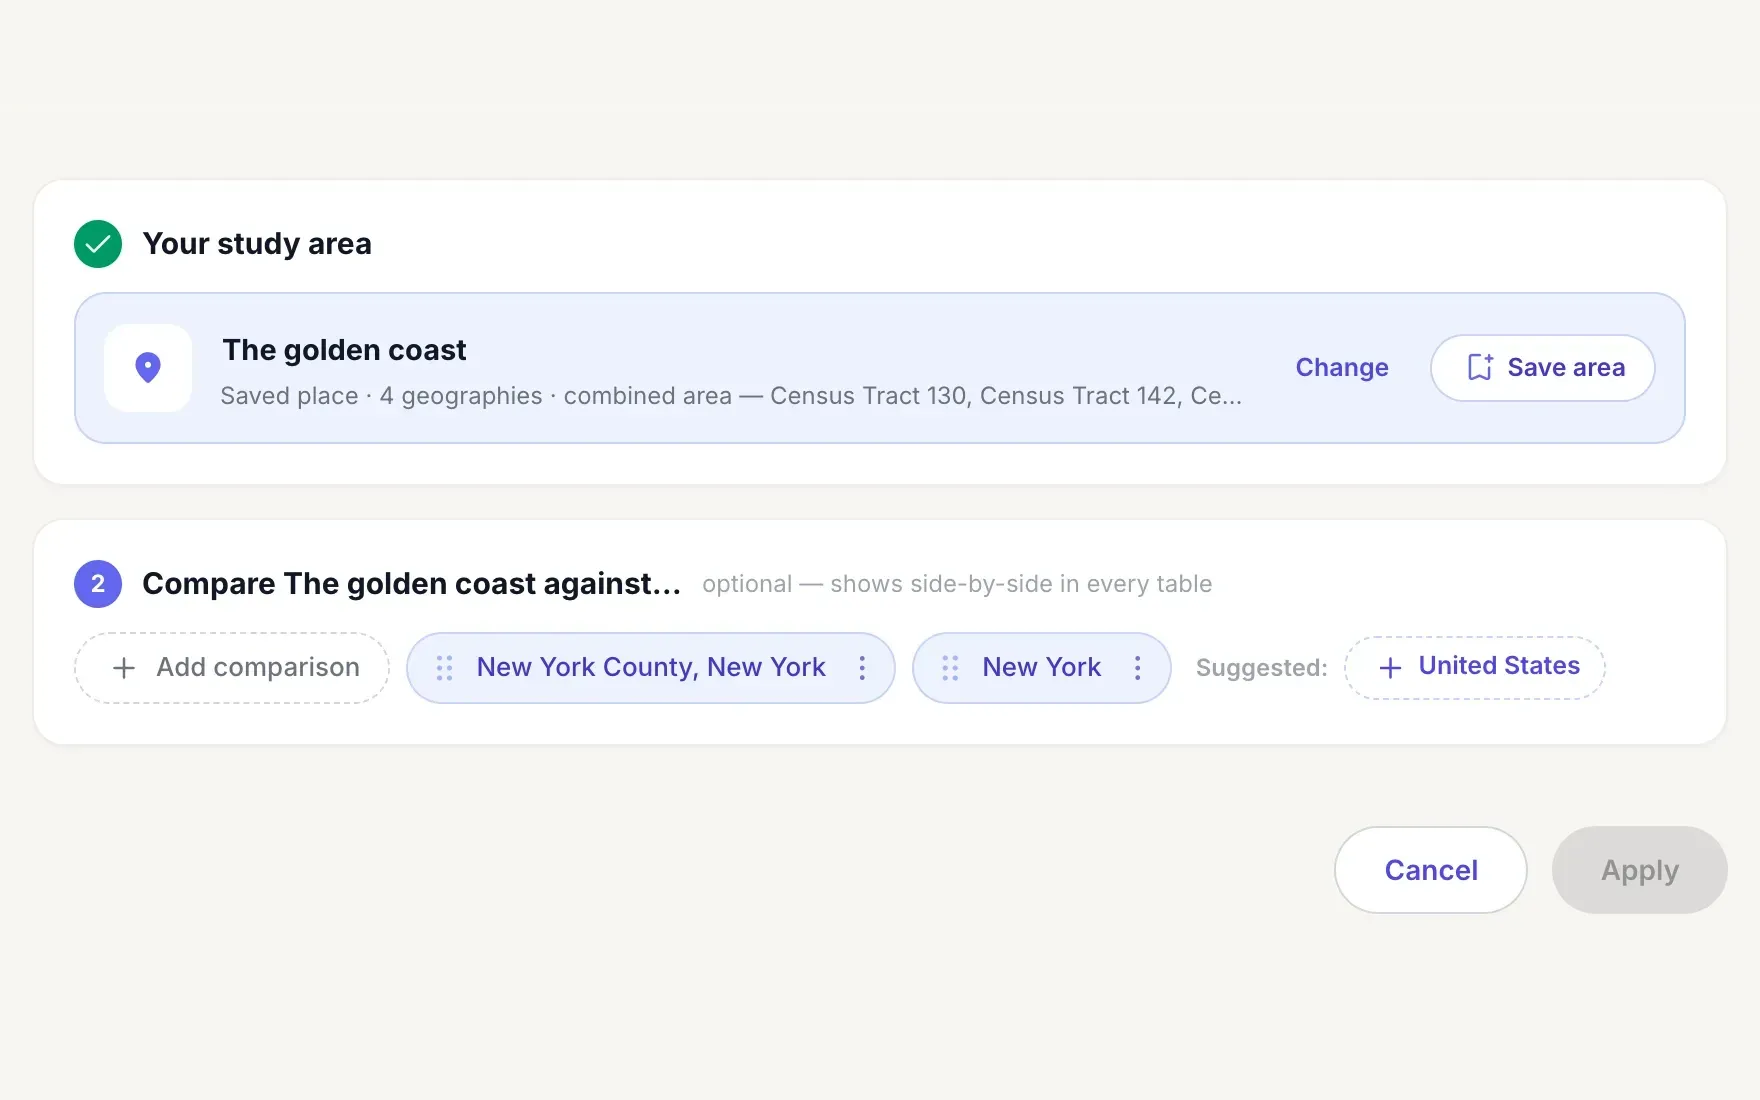
Start with a place. Choose a place, or save your own from census tracts, and add the places to compare it with.
-
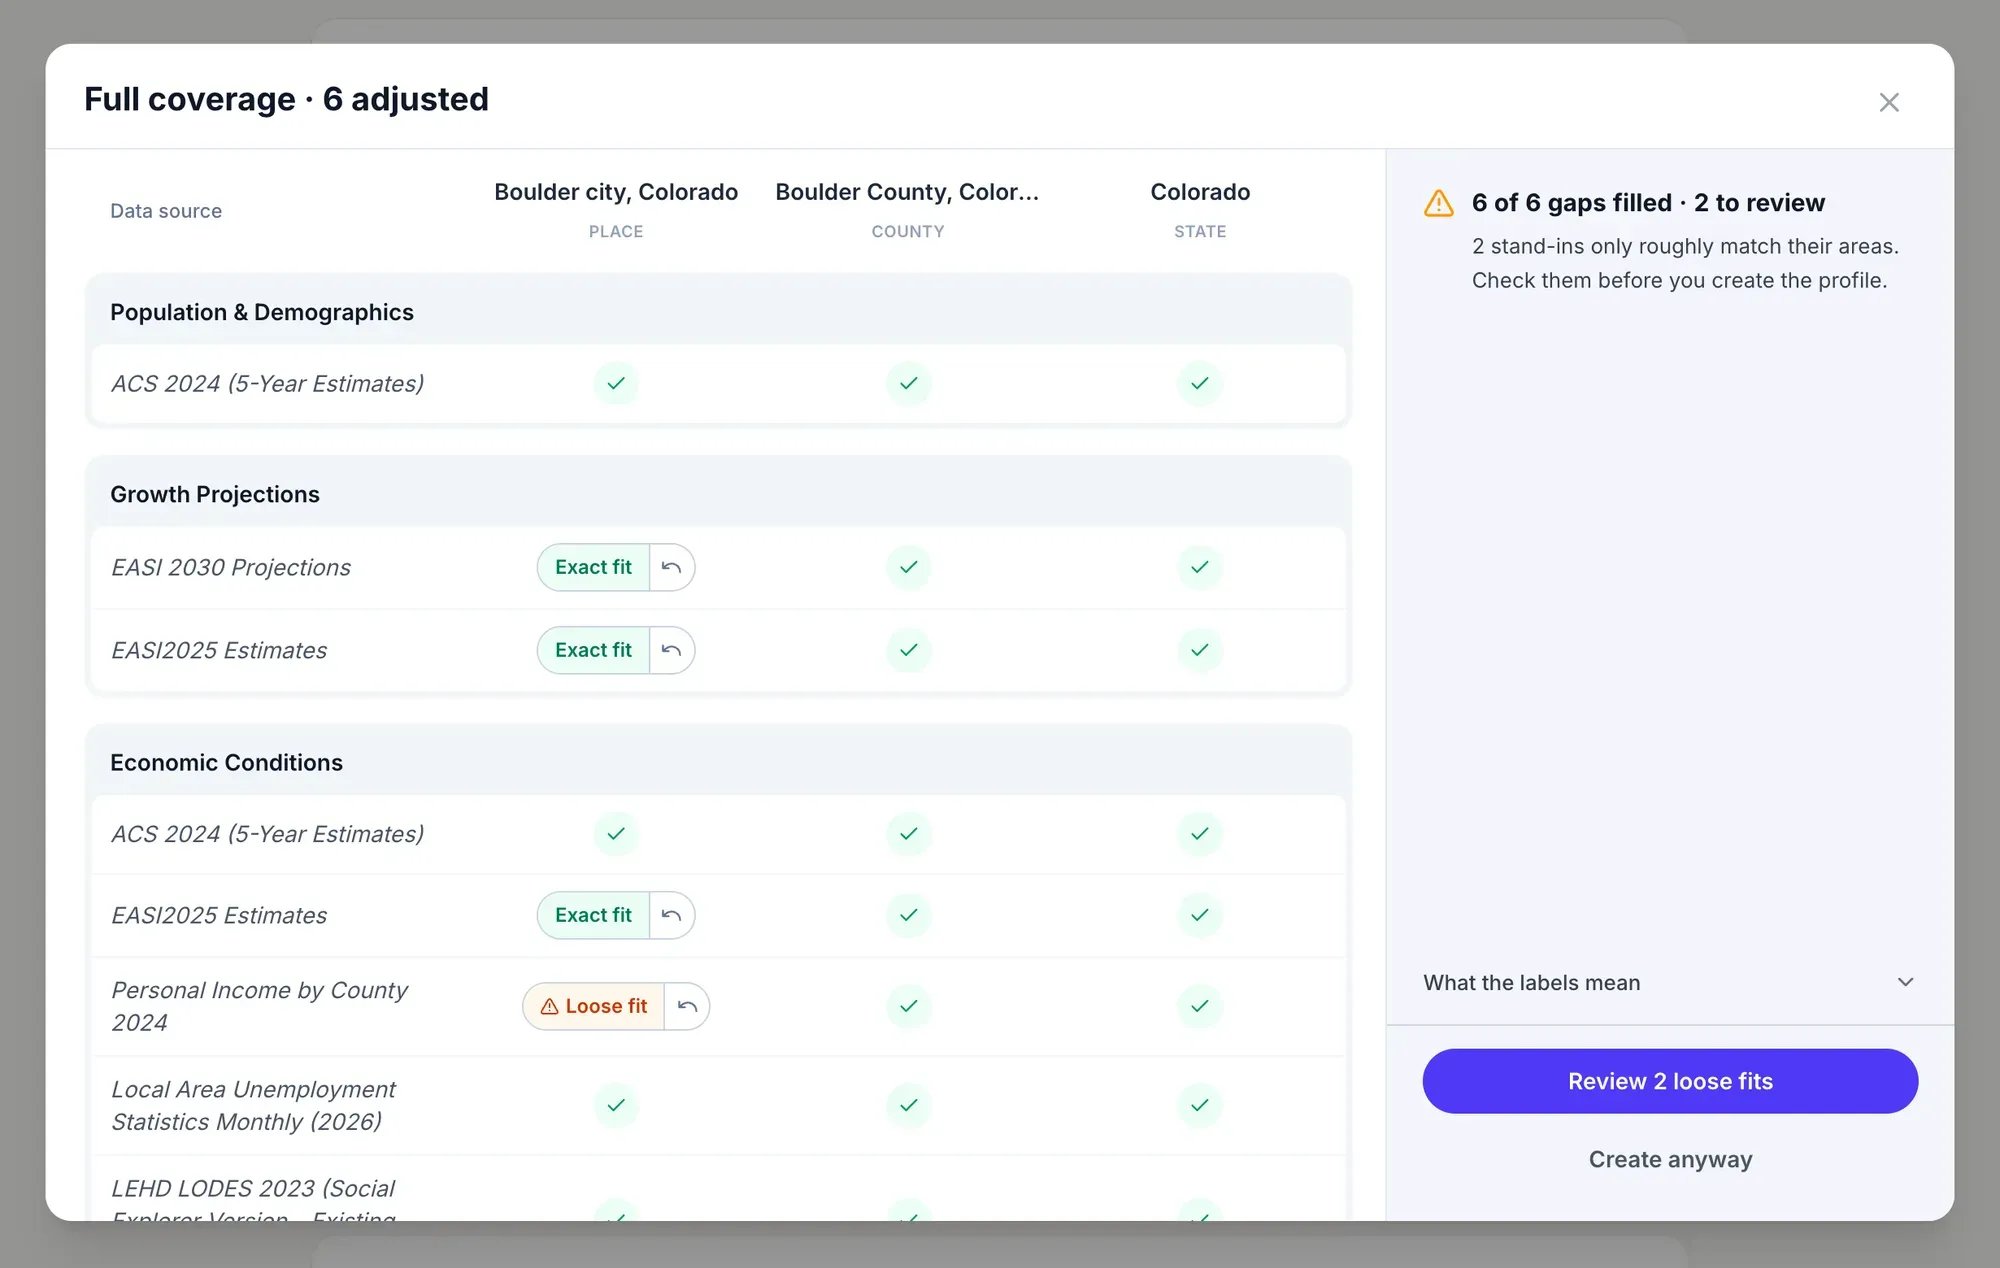
No empty cells. Studio checks every data source against every place, and fills a gap with the closest stand-in, labeled by how well it fits.
-
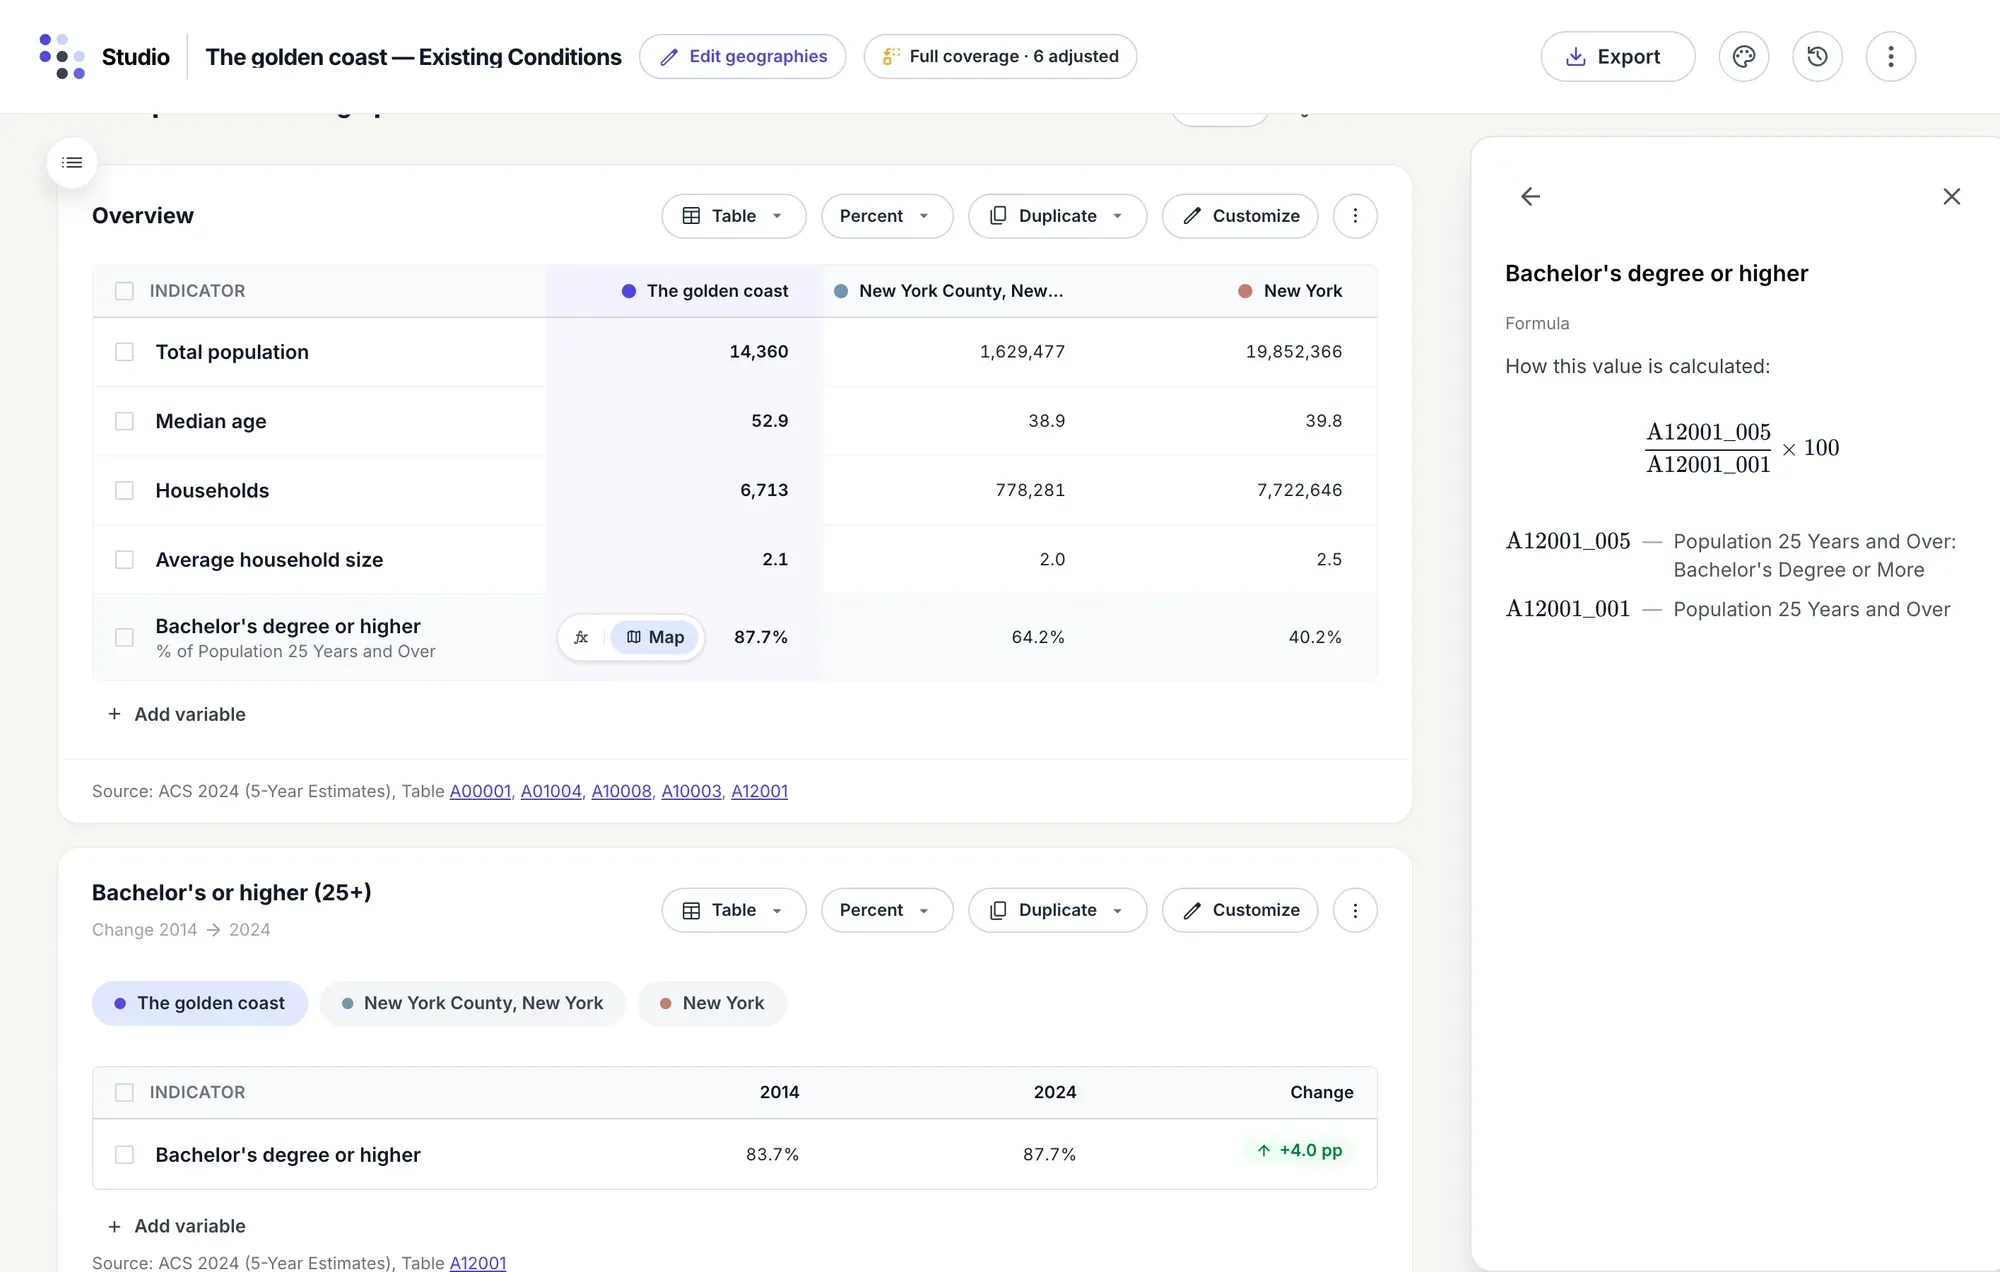
Every number beside its benchmarks. Your area sits in its own column beside the county and the state. Point at a row to see how its value is calculated.
-
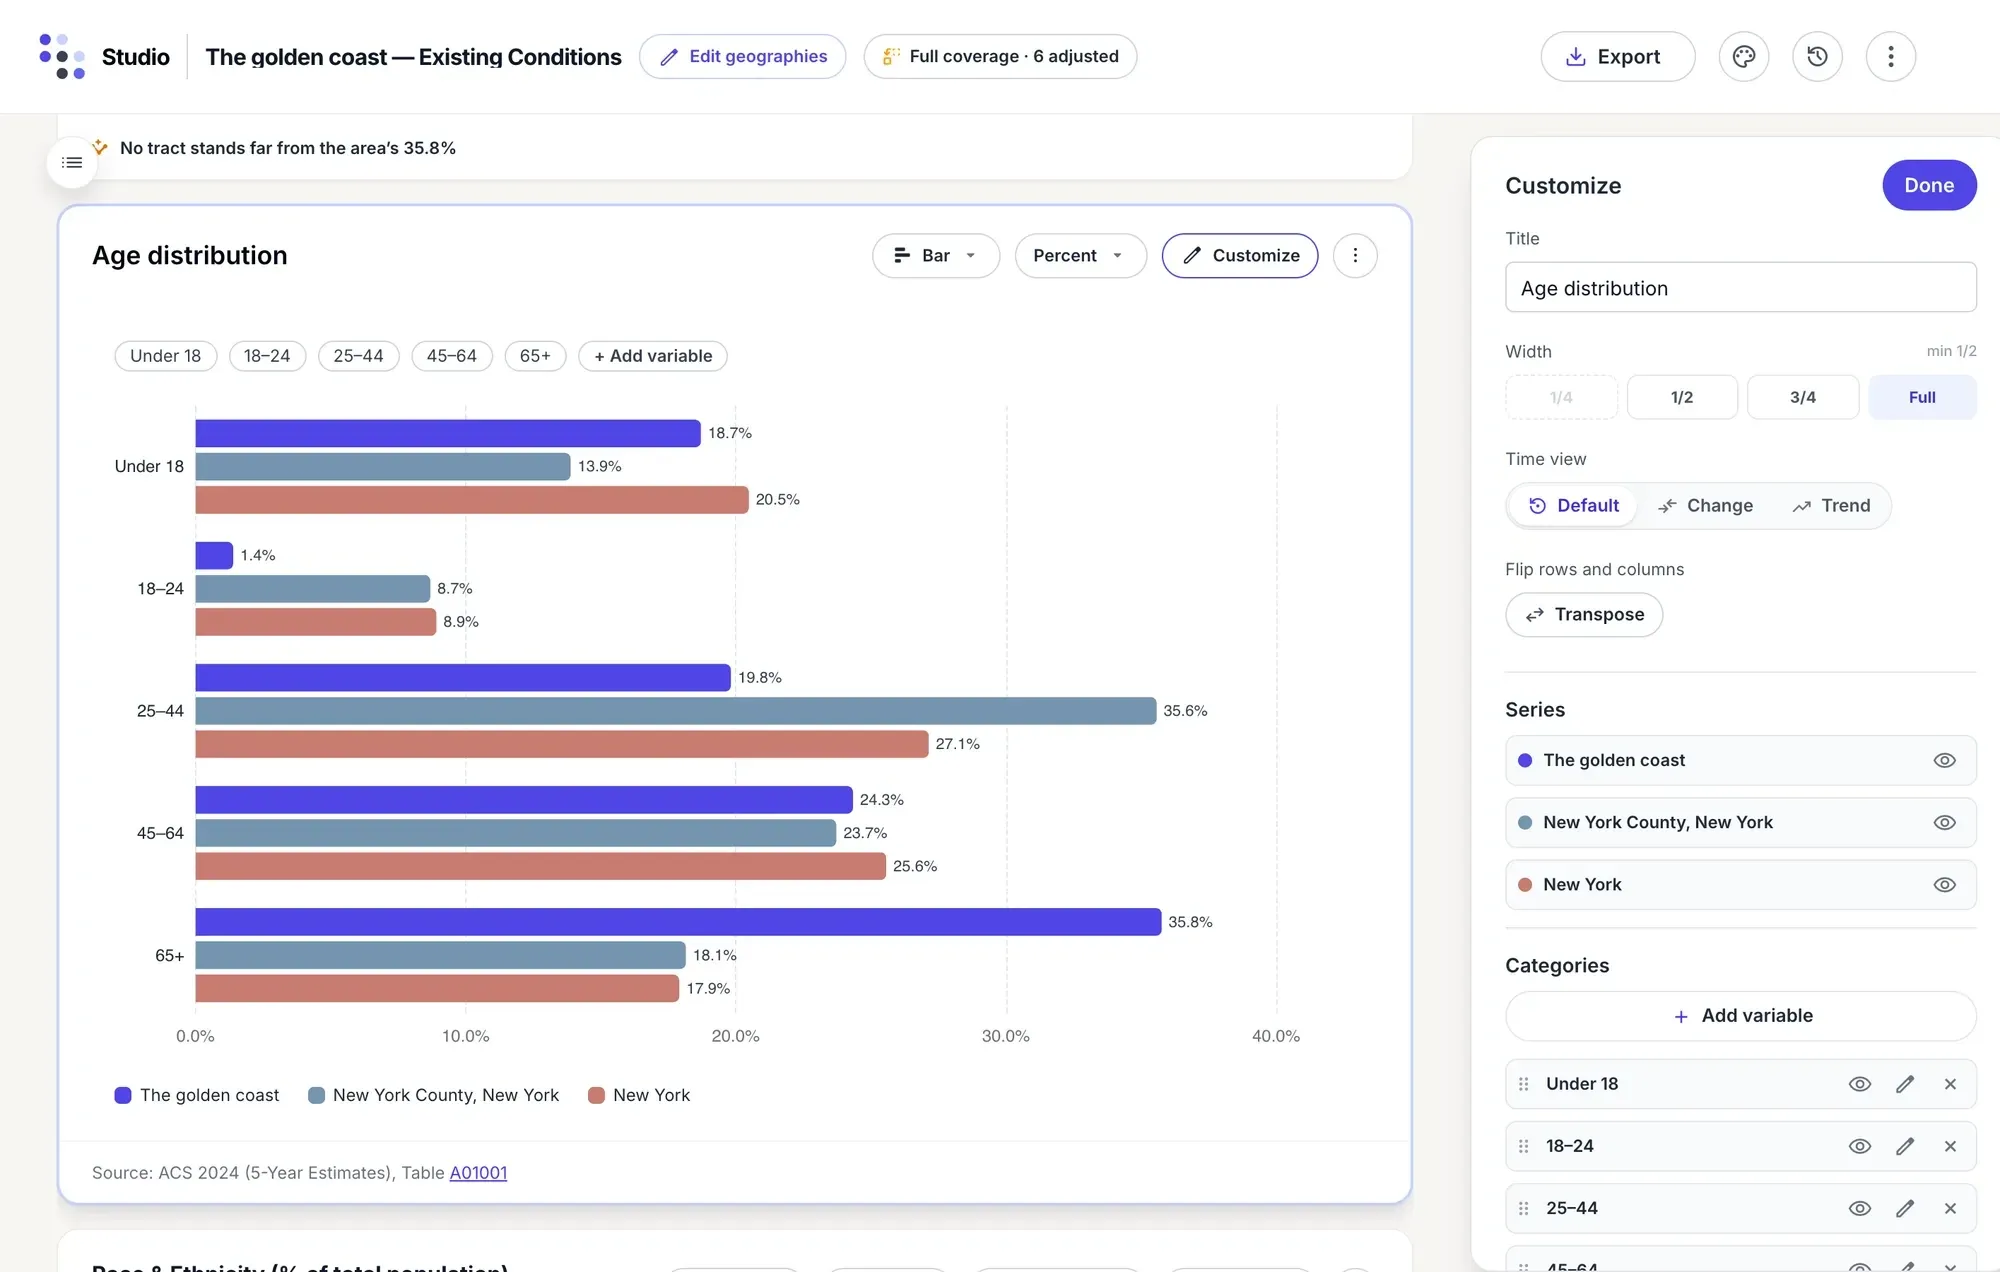
Charts you can shape. Show any table as a chart, then set its title, width, time view, series and categories.
-
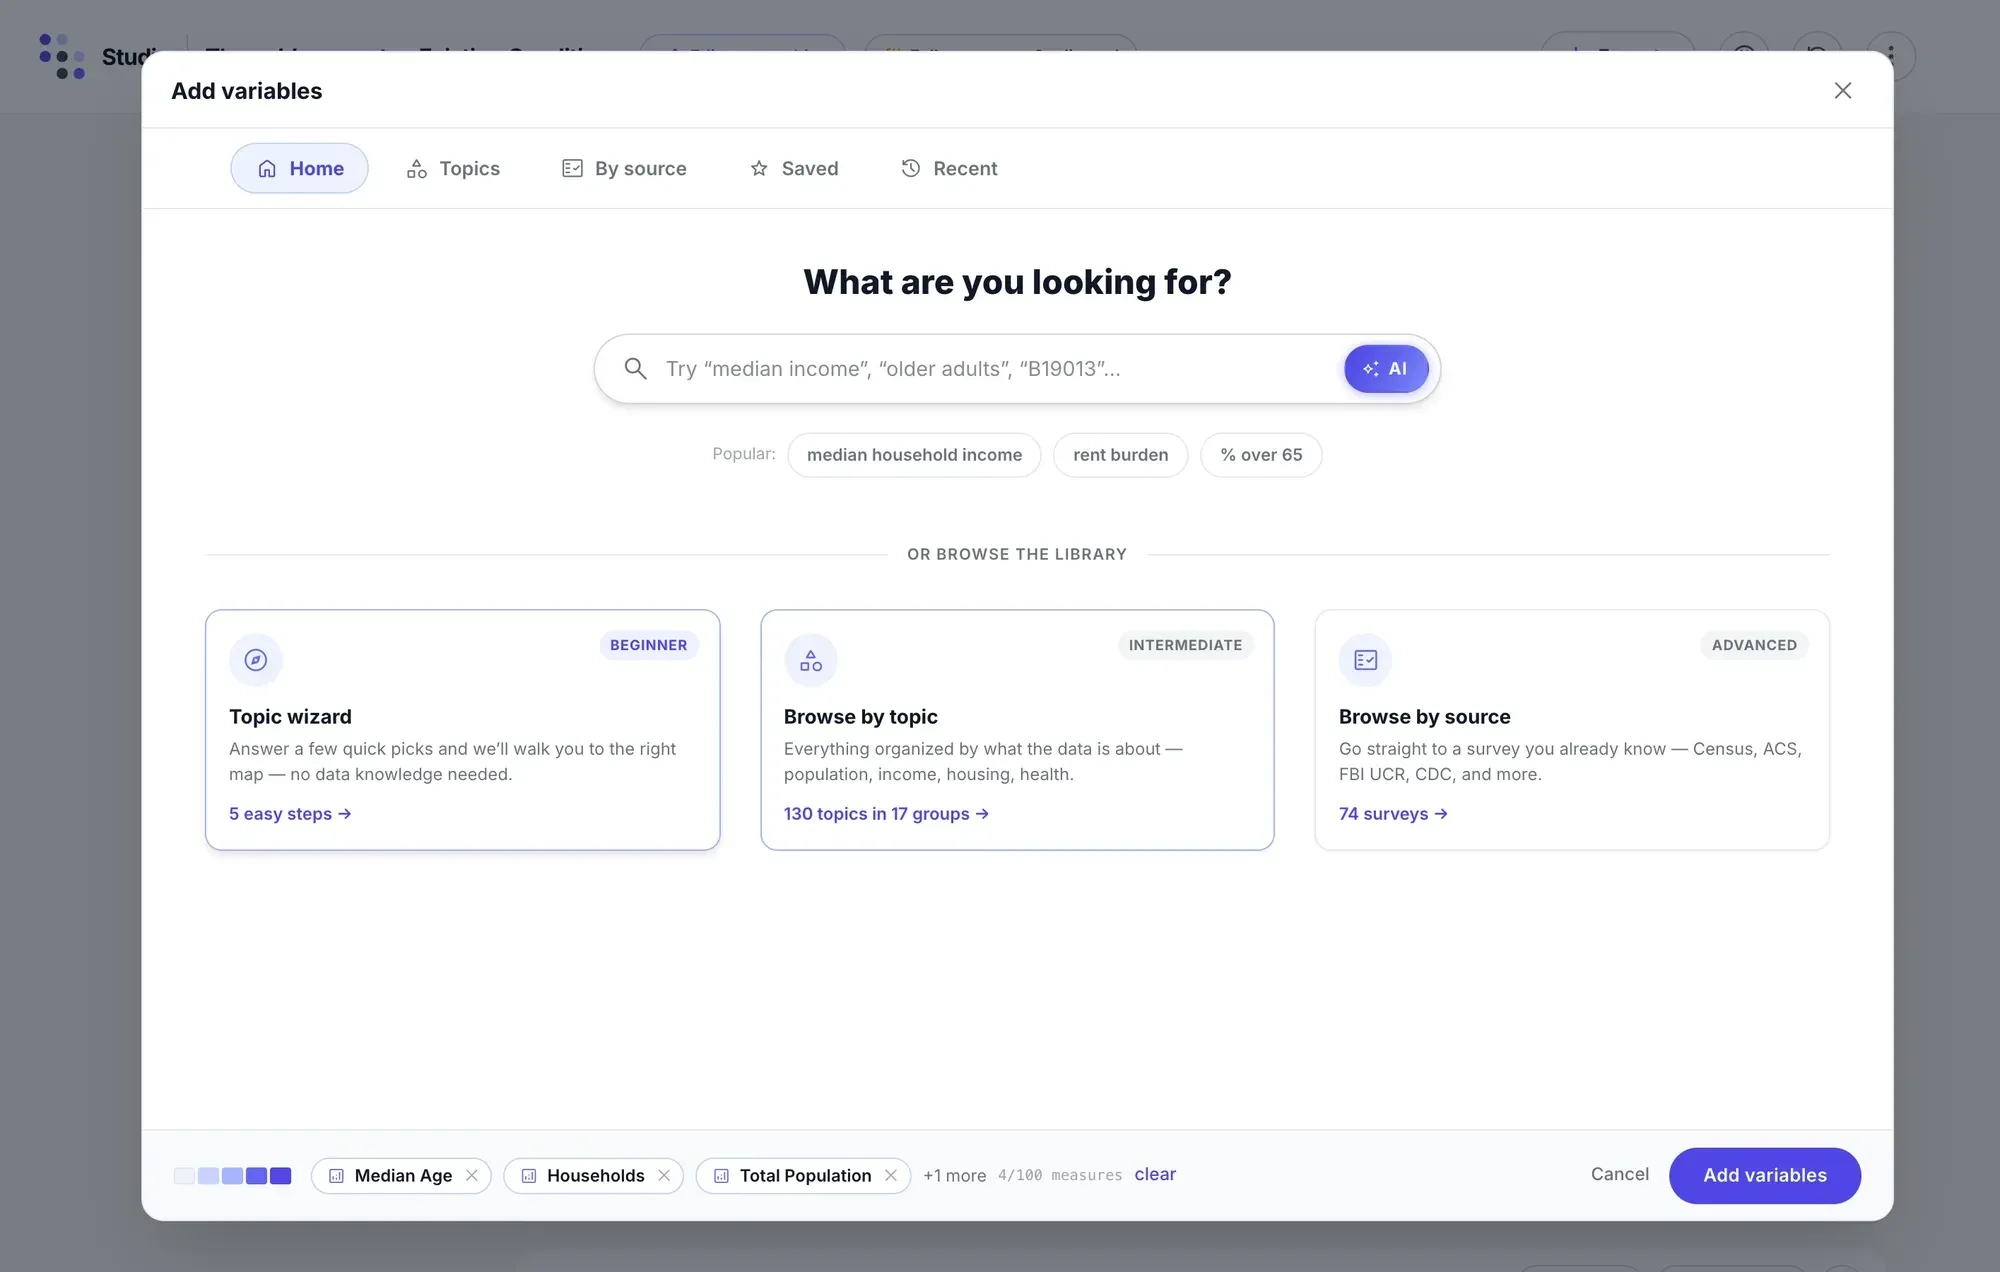
Add any variable. Search the whole Social Explorer catalog in plain words or by table code, or browse it by topic or source.
-
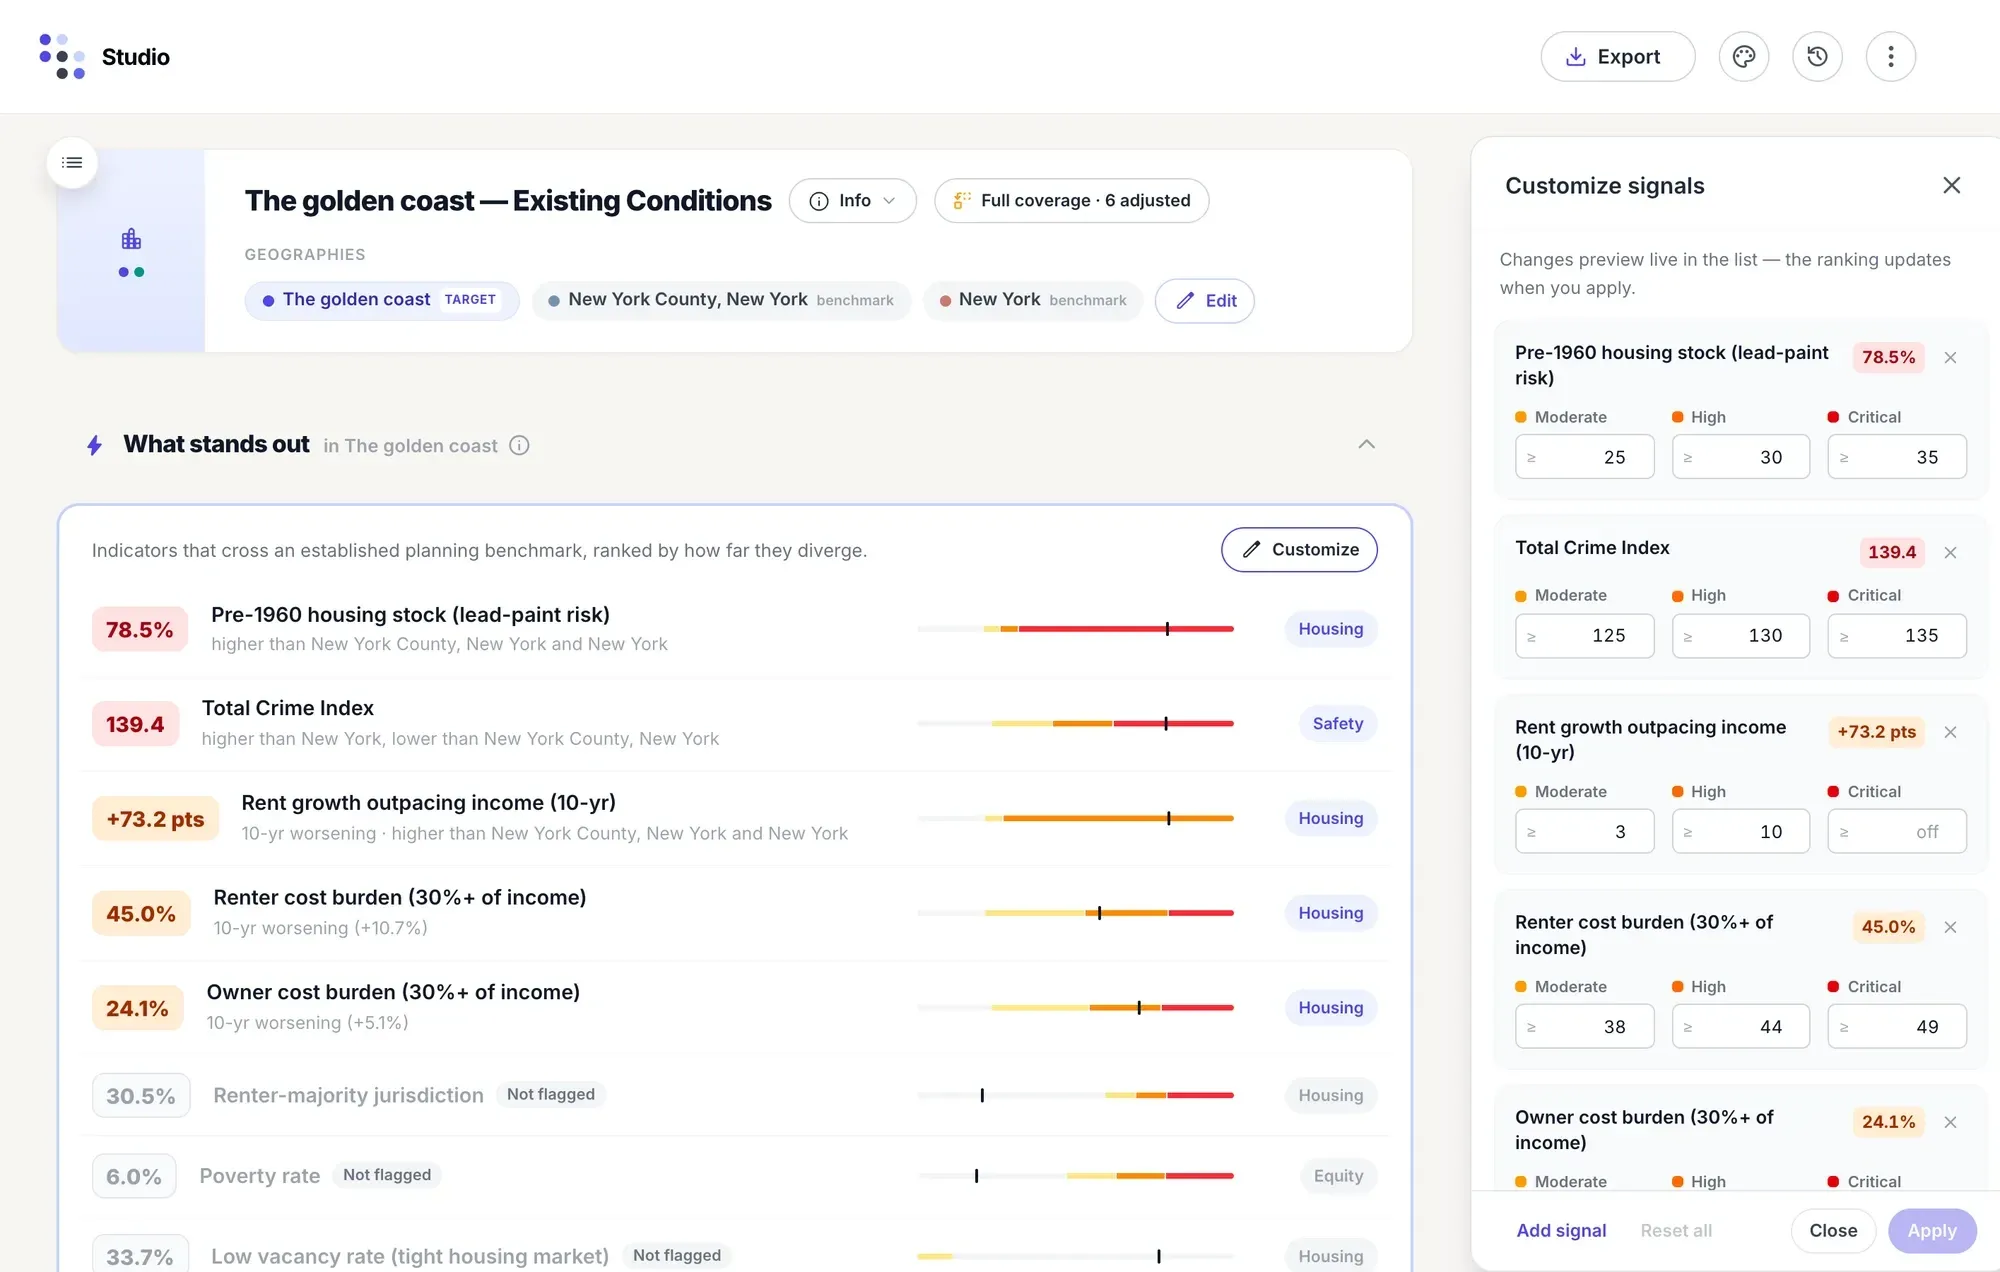
The findings first. Every profile opens with the indicators that cross a planning benchmark, and you can set the cutoffs for each.
-
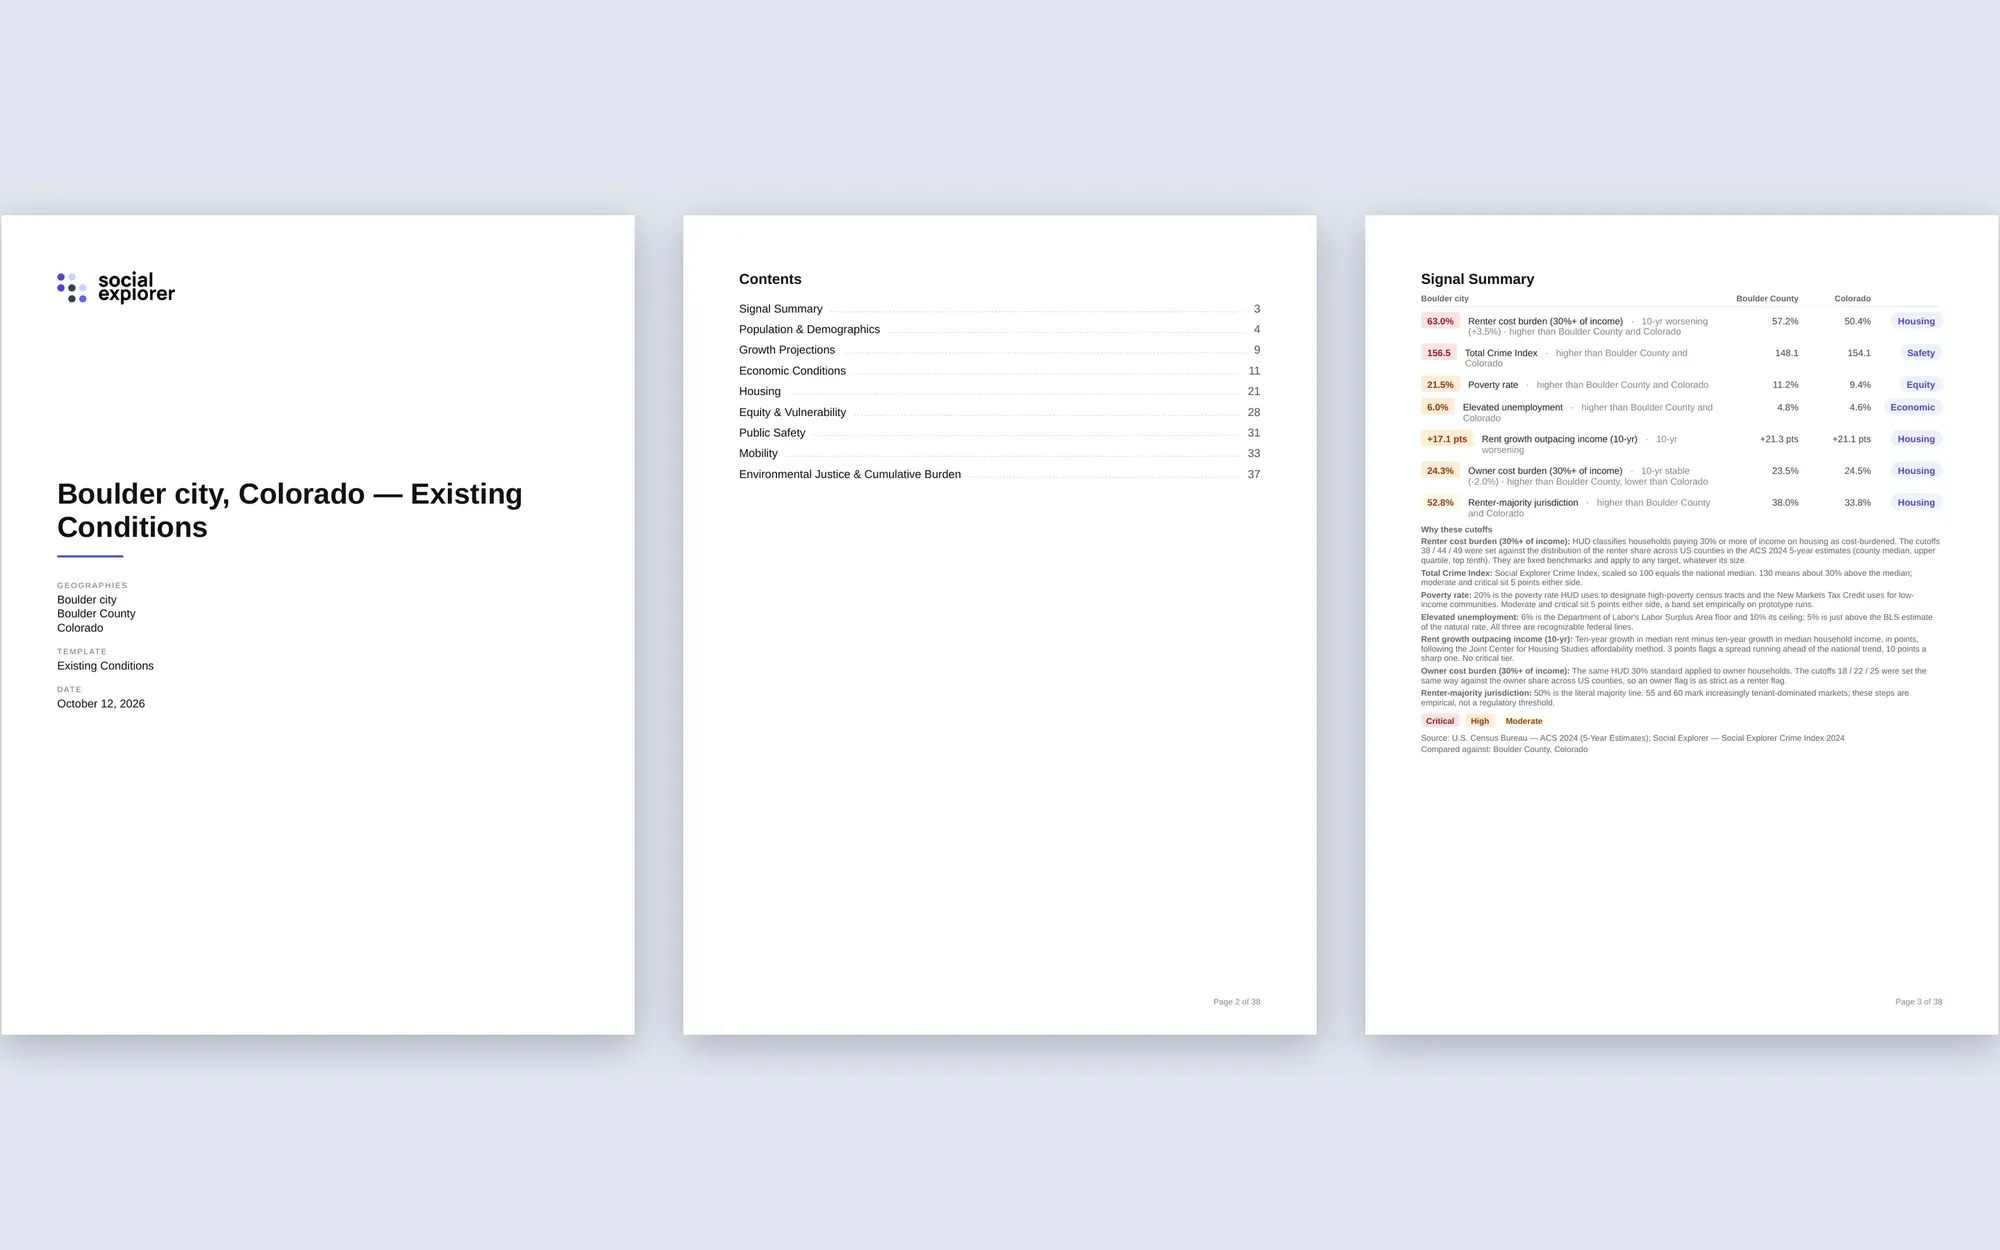
Ready to present. Export a Word report, a print-ready PDF or an Excel workbook, or download any chart or table as a PNG or SVG.
-
Choose your area
Search for a place or save your own, and add the places to compare it with.
-
Pick a report
Existing conditions, a HUD Consolidated Plan, a CEDS or a comprehensive plan update. Studio fills every section.
-
Shape and share
Reorder sections, customize charts, explain what stands out, and export to Word, PDF or Excel.
Data Navigator · our AI Research Assistant
Ask a question. Explore the answer.
Data Navigator answers your questions in everyday language. It guides you through the data library and replies with a map, chart or table, plus documented sources and methods you can review.
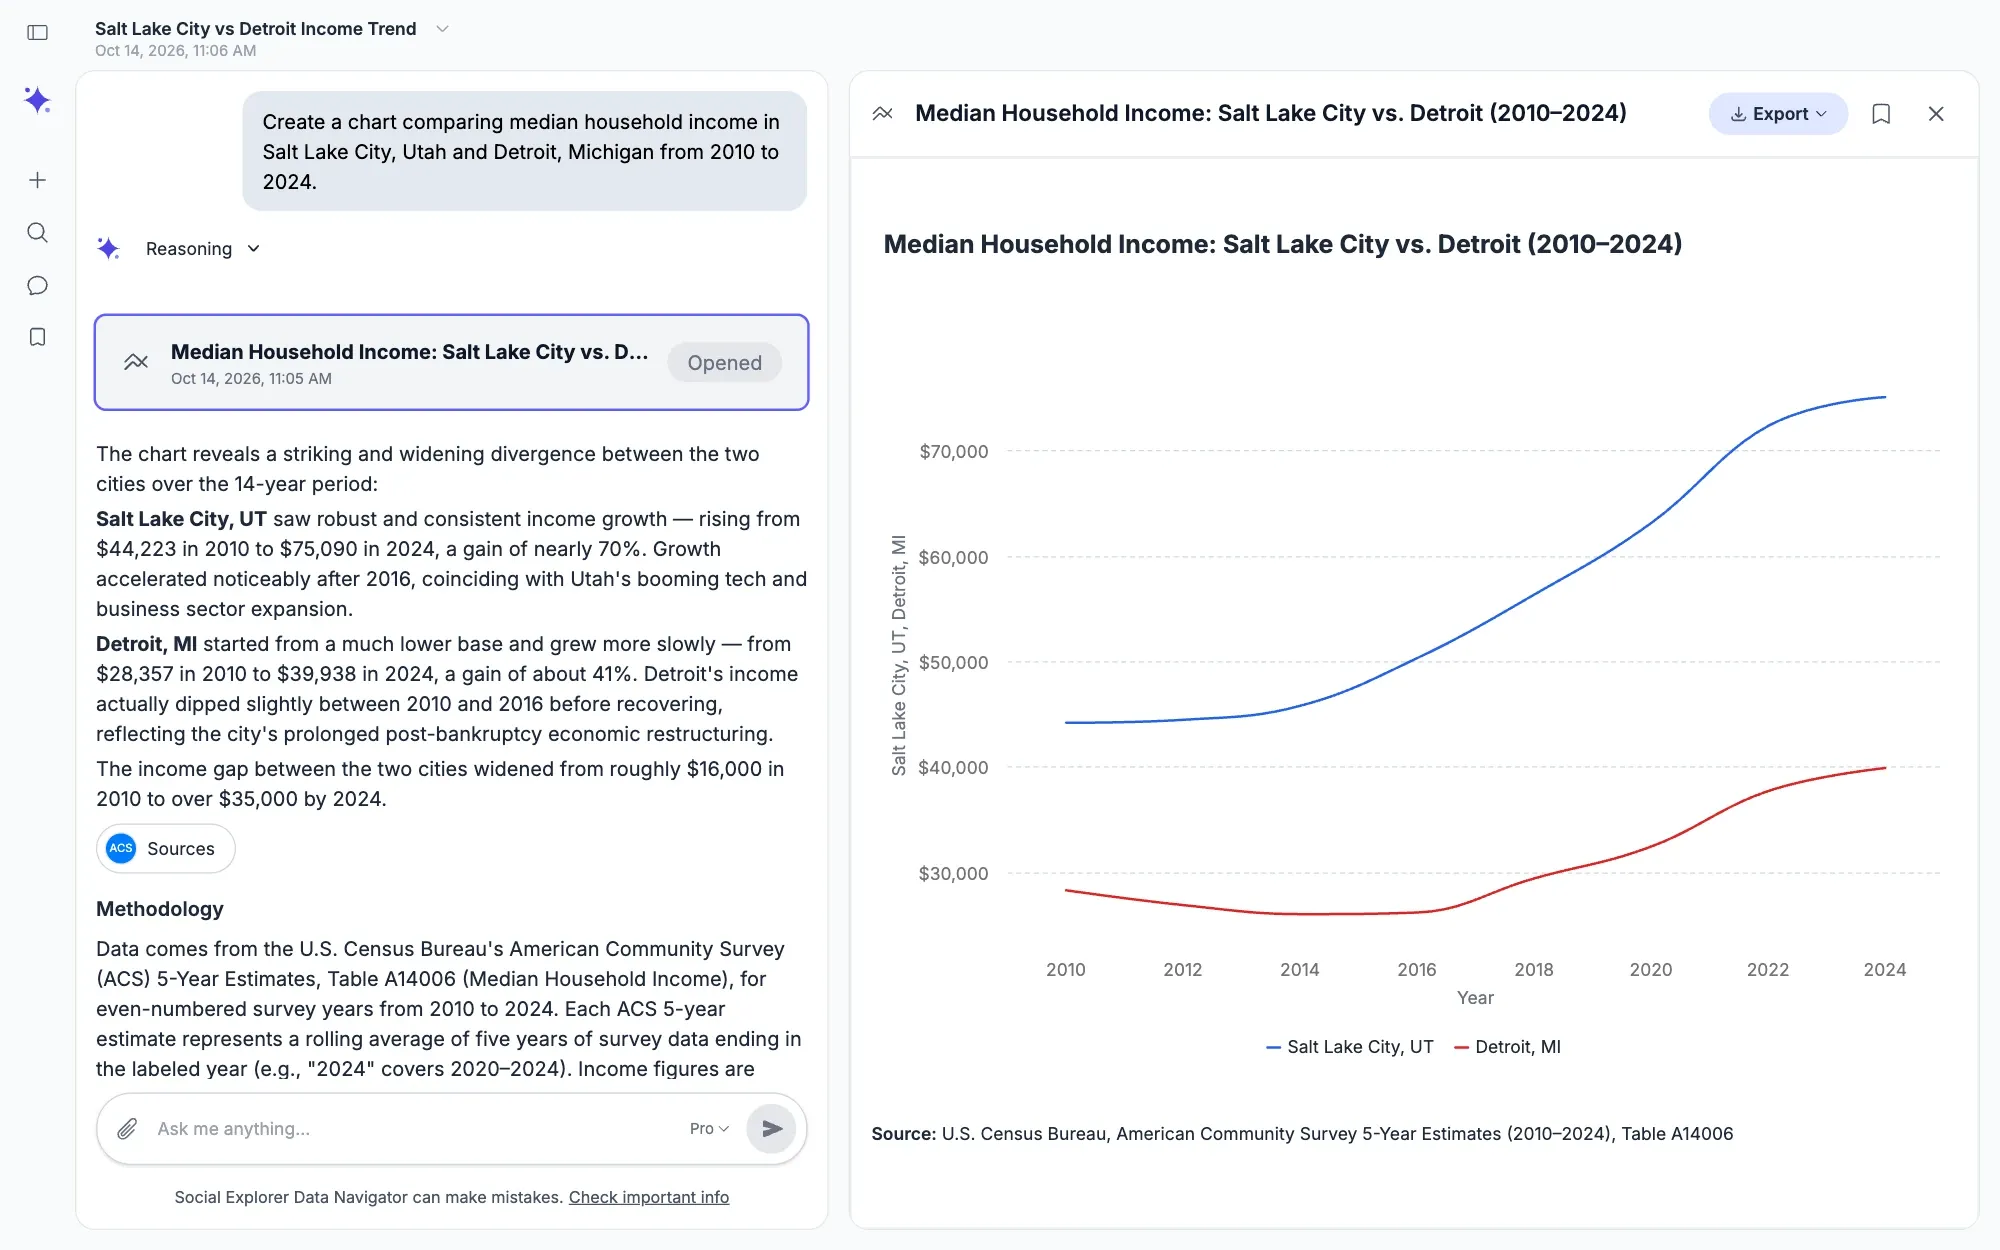
Data Navigator relies exclusively on Social Explorer’s published datasets and any files you attach. It does not search the web.
Go further with microdata and spatial processing.
-
Coming soon
Spatial processing
Bring your own GIS data into Social Explorer, line it up with census geographies and map it alongside the data library. Available in early 2027.
About Spatial -
Coming later
Microdata analysis
Build your own tables from census microdata, with the right weights and margins of error, and no code.
About Abacus
See how teams use Social Explorer.
 Ypsilanti District Library
Using service-area analysis to reach underserved residents
 AmeriCorps VISTA
Building data literacy across a national service program
 John Muir Land Trust
Finding likely donors with community data
Find your field
- Universities & libraries Teach with real data and support research across departments, with a license that covers everyone on campus.
- Government Back plans and policies with evidence about who lives where and how that is changing.
- Urban planning Build the existing conditions report and the rest of your plan’s analysis, with every source cited.
- Nonprofits Show the need behind your programs and grant applications, with sources reviewers can check.
- Business Compare markets and locations on the demographics that drive your decisions.
In their own words.
-
“Best, most accessible data source for comprehensive data on demographics and population.”
Stefan Heisler Community Development, City of Rancho Cordova, CA
-
“It’s a product as welcome in a high school classroom as the newsroom of the New York Times.”
Michael Hughes Trinity University The Charleston Advisor review of Social Explorer
-
“The Social Explorer enables researchers to devote more time to research than to data extraction, processing and mapping… It is simple to learn and use for both novices and professionals.”
Joan Naymark Target Corporation
-
“My students thought Social Explorer was a fantastic resource… It’s very user-friendly, too; the students learned to navigate effortlessly. Social Explorer inspired the best census explorations I’ve ever seen.”
Anne Knowles Associate Professor of Geography, Middlebury College
-
“Social Explorer allows me a quick way to understand the demographics or demographic changes, without taking the time to download census data and put them in GIS. You have saved me a ton of time and effort.”
Laurie Zapalac, PhD Zapalac Advisors
-
“It makes my job a lot easier. What I like about Social Explorer is that it is curated – it’s nice to know that there is something out there that was really validated.”
Kathy Freeman The Nature Conservancy
From the blog
News, updates, and data explorations.

Find the plan that fits.
A plan for you and your team, or a site license for your whole organization.
For individuals and teams
See it in a live demo, then choose the plan with the data, Studio or shared workspace you need.
For universities, libraries and agencies
Cover everyone on your network with a site license: Pro for maps and reports, or Premium and Platinum for Studio, Data Navigator and MCP too, with Spatial coming soon.
Questions about Social Explorer
What is Social Explorer?
Social Explorer is an online platform that brings ready-to-use data, mapping and analysis together in one place. Its latest releases hold 610,000+ variables from 29 publishers, with census data back to 1790.
How do I use Social Explorer?
Search for a place or a topic in plain words, or let the topic wizard walk you through it, and Social Explorer shades the map with its legend and source. Click any area for its numbers, then compare places or open a report. It runs in the browser, with no GIS skills or software to install.
How do I get Social Explorer through my university or library?
Ask your library whether it subscribes to Social Explorer: universities and public libraries can license it for everyone they serve. On the library’s network you get in automatically by IP address; off site, through its EZproxy link, OpenAthens or a referring URL. To use that access from home, set up a personal account, as Social Explorer’s help center explains.
What data does Social Explorer have?
Social Explorer has census data from 1790 to 2020, the American Community Survey down to block groups, and data on the economy, housing, health, education, transportation, the environment, crime and elections. Its 29 publishers include the Bureau of Labor Statistics, HUD, the CDC, the EPA and the FBI. Browse the data library for every dataset with its publisher, years and finest geography.
How do I cite Social Explorer?
Social Explorer writes the citation for you. Every variable comes with its definition and a citation, and every report can be cited in Chicago, MLA or APA style. Copy the citation into your paper or bibliography, then check it against the style guide your course or journal follows.
Can Data Navigator analyze my own data?
Yes. Attach your own files to a message, such as CSV or Excel spreadsheets and PDF or Word documents, and Data Navigator analyzes them beside Social Explorer’s published datasets. Every answer shows the sources and methods behind it. Data Navigator comes with Premium and Platinum, for one person, a team or a whole institution, and with Enterprise.
See how easy it is to get started
Bring a question from your own work. In a live demo, we’ll show you how to explore a place, compare locations or take an analysis further.