

Wisconsin: Population, demographics and census data
Home to 5,972,787 people, the 20th largest of the 50 states and DC, anchored by Milwaukee. It grew 3.5% between 2015 and 2025.
- Population
- 5.97M. Census Bureau estimate · Rank 20 of the 50 states and DC
- Median household income
- $80,213 ±$703. US $84,780
- Median age
- 41.3 ±0.2. US 39.5
ACS 2025 1-year estimates, U.S. Census Bureau
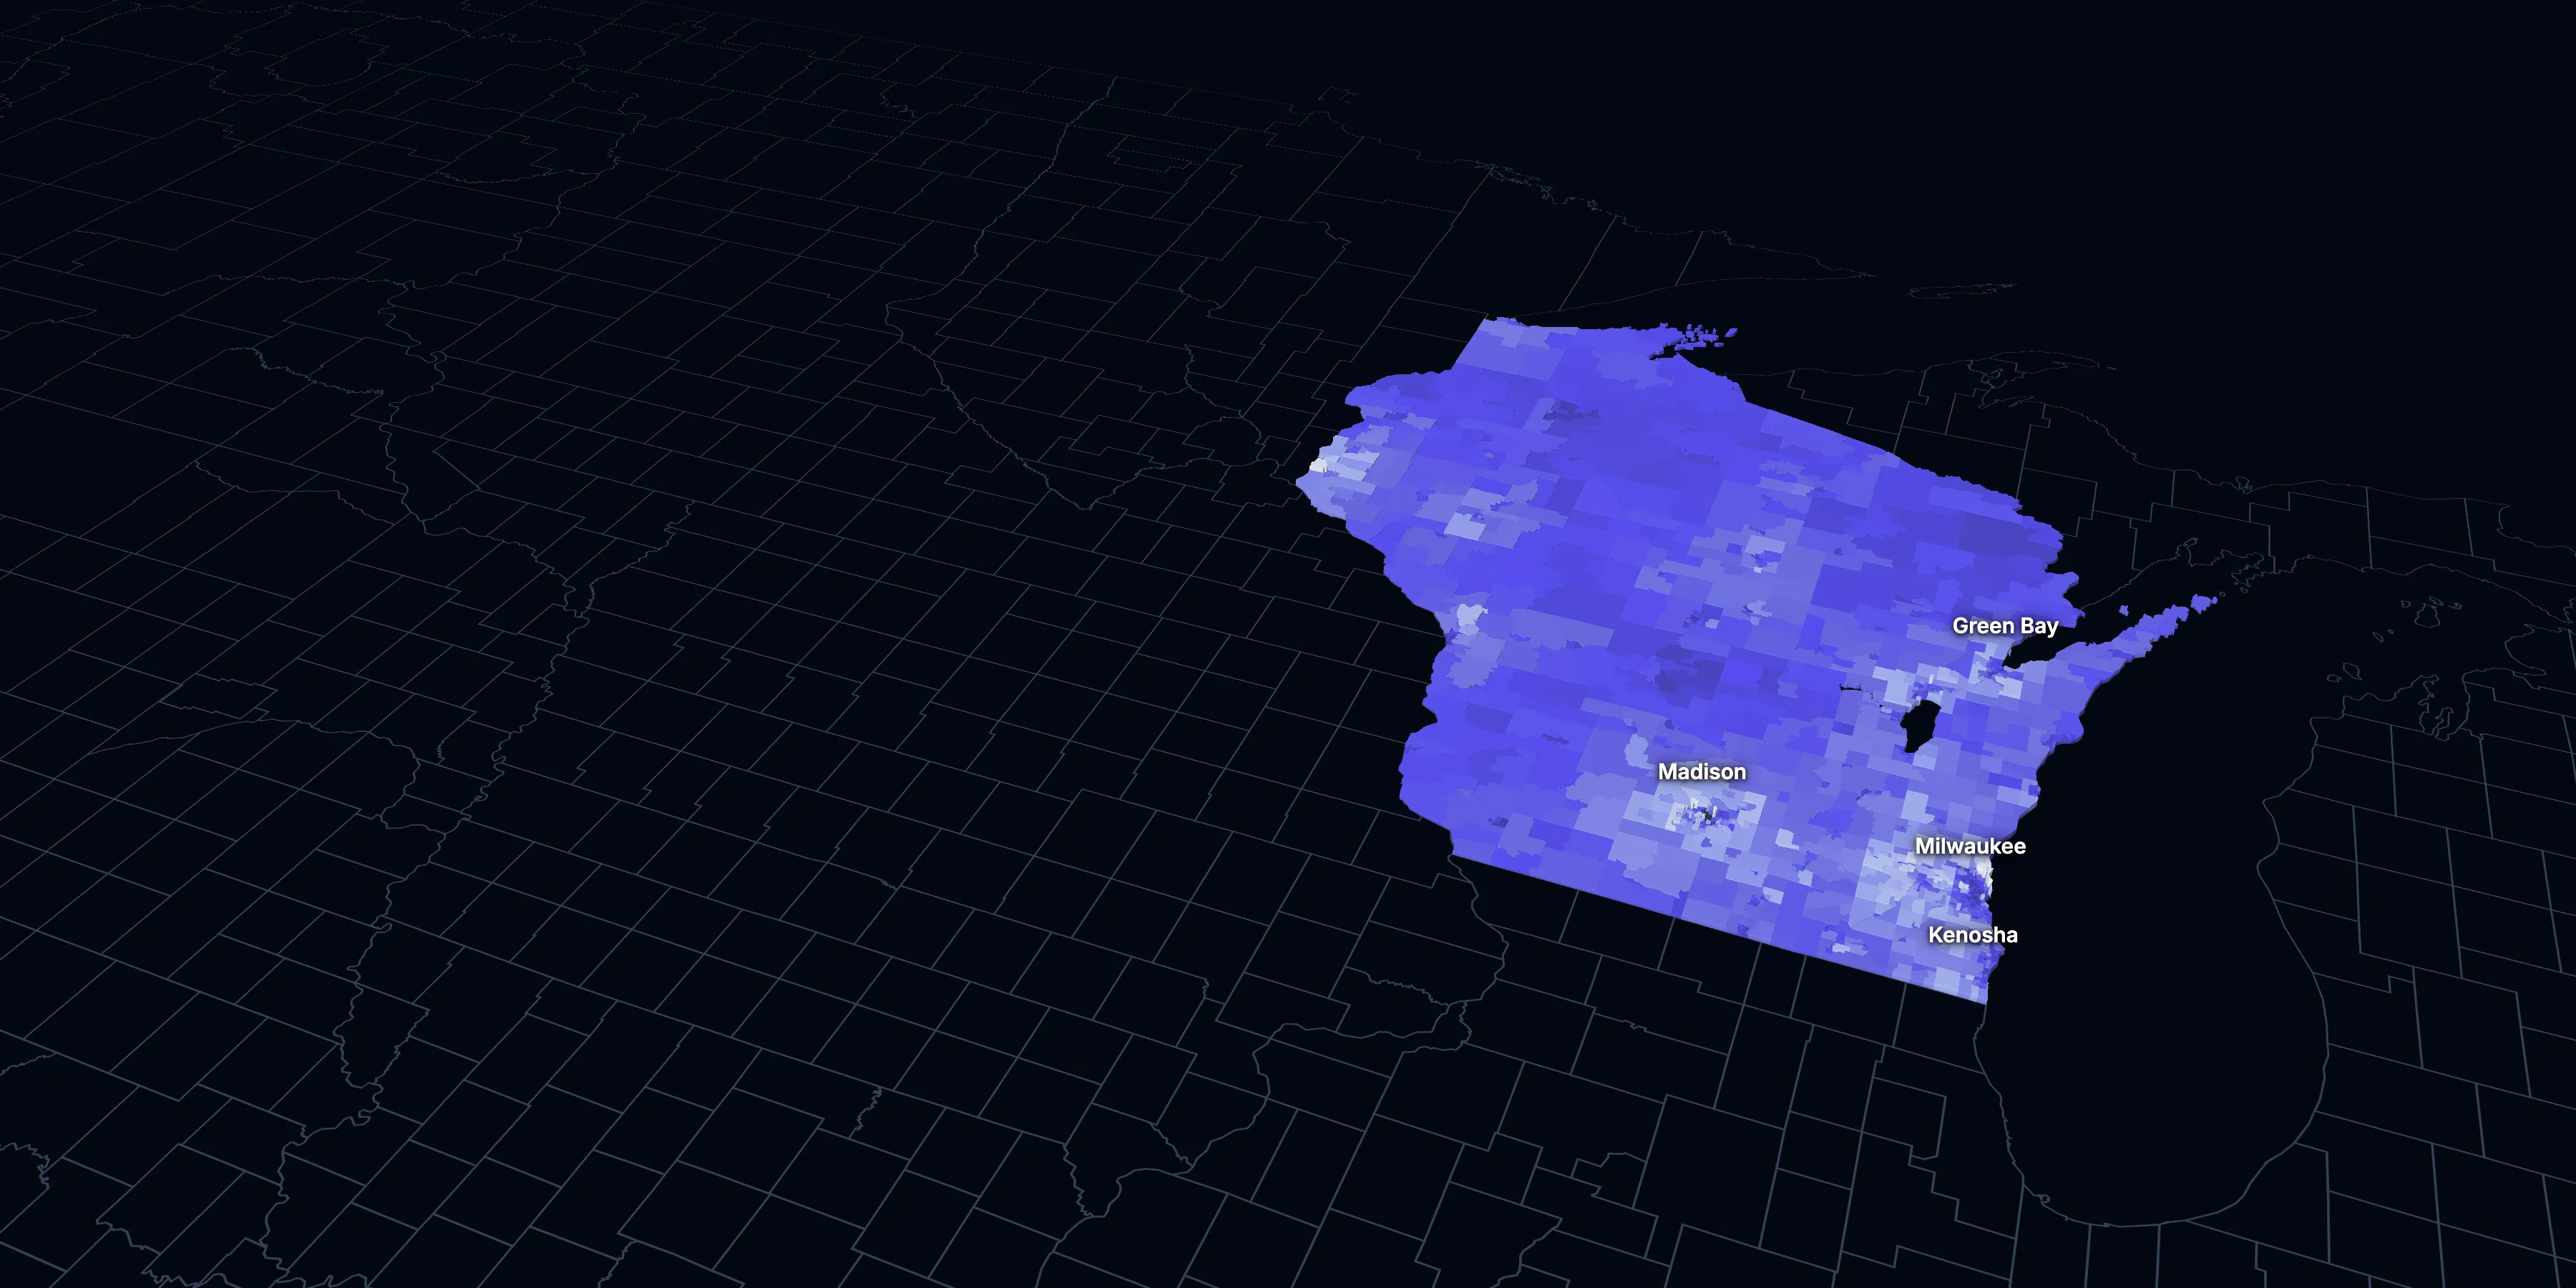
Taller, lighter tracts have higher household incomes
About Wisconsin
Wisconsin’s median household income is $80,213 (±$703), lower than the US ($84,780), and its median age is 41.3 (±0.2), according to the ACS 2025 1-year estimates. Its largest city is Milwaukee.
± is each figure’s margin of error, at 90% confidence, and † marks one too uncertain to lean on. Under each percentage in the tables is the number it counts. How the margins are worked out.
FIPS code 55
Highlights
What stands out in Wisconsin
The numbers where Wisconsin sits furthest from the nation, or past a recognized policy benchmark.
Past a policy benchmark
32.2%
HighHomes built before 1960
That’s higher than the US (24.0%). Older homes carry more lead-paint risk: the EPA found lead paint in 69% of homes built from 1940 to 1959.
+7 points
ElevatedRent growth ahead of income
After inflation, rent grew 12% from 2015 to 2025, and household income 5%. The dots show rent growth.
Furthest from the national picture
5.4%
Very lowBorn outside the US
That’s lower than the US (14.7%).
2.27
Lower than the USPeople per household
That’s lower than the US (2.49). It’s the 5th lowest of the 50 states and DC.
9.5%
Very lowSpeak a language other than English at home
That’s lower than the US (22.9%).
29.0%
Lower than the USCommute 30 minutes or more
That’s lower than the US (39.2%).
2015 to 2025
How Wisconsin changed in ten years
The state added 201,450 people. It got older, more foreign-born and better educated, and poverty fell 1.8 points.
Population, change since 2015
+3.5% in the state and +6.3% in the US.
Source: ACS 1-year, 2015 to 2025, table A00001.
Show data
| Wisconsin | United States | |
|---|---|---|
| 2015 | 0.0% | 0.0% |
| 2016 | +0.1% | +0.5% |
| 2017 | +0.4% | +1.3% |
| 2018 | +0.7% | +1.8% |
| 2019 | +0.9% | +2.1% |
| 2021 | +2.2% | +3.3% |
| 2022 | +2.1% | +3.7% |
| 2023 | +2.4% | +4.2% |
| 2024 | +3.3% | +5.8% |
| 2025 | +3.5% | +6.3% |
Embed
Median household income, in 2025 dollars
+5.2% in the state and +10.9% in the US.
Source: ACS 1-year, 2015 to 2025, table A14006.
Show data
| Wisconsin | United States | |
|---|---|---|
| 2015 | $76,225 | $76,413 |
| 2016 | $76,841 | $77,931 |
| 2017 | $78,526 | $79,891 |
| 2018 | $78,555 | $80,059 |
| 2019 | $81,467 | $83,427 |
| 2021 | $80,415 | $83,521 |
| 2022 | $78,647 | $82,811 |
| 2023 | $79,398 | $82,683 |
| 2024 | $80,085 | $84,339 |
| 2025 | $80,213 | $84,780 |
Embed
Living in poverty
−1.8 points in the state and −3.0 points in the US.
Source: ACS 1-year, 2015 to 2025, table A13004.
Show data
| Wisconsin | United States | |
|---|---|---|
| 2015 | 12.1% | 14.7% |
| 2016 | 11.8% | 14.0% |
| 2017 | 11.3% | 13.4% |
| 2018 | 11.0% | 13.1% |
| 2019 | 10.4% | 12.3% |
| 2021 | 10.8% | 12.8% |
| 2022 | 10.7% | 12.6% |
| 2023 | 10.7% | 12.5% |
| 2024 | 10.3% | 12.1% |
| 2025 | 10.3% | 11.8% |
Embed
Bachelor’s degree or more
+6.9 points in the state and +6.7 points in the US.
Source: ACS 1-year, 2015 to 2025, table A12001.
Show data
| Wisconsin | United States | |
|---|---|---|
| 2015 | 28.4% | 30.6% |
| 2016 | 29.5% | 31.3% |
| 2017 | 30.4% | 32.0% |
| 2018 | 30.0% | 32.6% |
| 2019 | 31.3% | 33.1% |
| 2021 | 32.5% | 35.0% |
| 2022 | 33.2% | 35.7% |
| 2023 | 33.8% | 36.2% |
| 2024 | 34.6% | 36.8% |
| 2025 | 35.2% | 37.4% |
Embed
Median gross rent, in 2025 dollars
+12.4% in the state and +18.5% in the US.
Source: ACS 1-year, 2015 to 2025, table A18009.
Show data
| Wisconsin | United States | |
|---|---|---|
| 2015 | $1,085 | $1,314 |
| 2016 | $1,085 | $1,327 |
| 2017 | $1,084 | $1,340 |
| 2018 | $1,095 | $1,368 |
| 2019 | $1,101 | $1,393 |
| 2021 | $1,103 | $1,427 |
| 2022 | $1,099 | $1,440 |
| 2023 | $1,139 | $1,496 |
| 2024 | $1,180 | $1,537 |
| 2025 | $1,219 | $1,557 |
Embed
Median home value, in 2025 dollars
+37.3% in the state and +39.3% in the US.
Source: ACS 1-year, 2015 to 2025, table A10036.
Show data
| Wisconsin | United States | |
|---|---|---|
| 2015 | $230,574 | $266,469 |
| 2016 | $234,266 | $277,278 |
| 2017 | $236,881 | $288,124 |
| 2018 | $243,653 | $296,908 |
| 2019 | $250,363 | $305,336 |
| 2021 | $276,377 | $337,116 |
| 2022 | $280,043 | $355,481 |
| 2023 | $289,907 | $361,931 |
| 2024 | $304,576 | $372,685 |
| 2025 | $316,500 | $371,100 |
Embed
ACS 1-year estimates. The dotted stretch of each line spans 2020, when the Census Bureau released no standard 1-year estimates. Dollar values are in 2025 dollars.
| Indicator | 2015 | 2025 | Change |
|---|---|---|---|
| Population | 5,771,337 | 5,972,787 | +3.5% |
| Median age | 39.4 | 41.3 | +1.9 years |
| 65 and over | 15.6% | 20.9% | +5.3 points |
| Born outside the US | 4.8% | 5.4% | +0.6 points |
| Hispanic or Latino | 6.6% | 8.7% | +2.1 points |
| Median household income | $76,225 | $80,213 | +5.2% |
| Living in poverty | 12.1% | 10.3% | −1.8 points |
| Bachelor’s degree or more | 28.4% | 35.2% | +6.9 points |
| Households that rent | 33.2% | 31.9% | −1.3 points |
| Median gross rent | $1,085 | $1,219 | +12.4% |
| Median home value | $230,574 | $316,500 | +37.3% |
1542 census tracts
Wisconsin, tract by tract
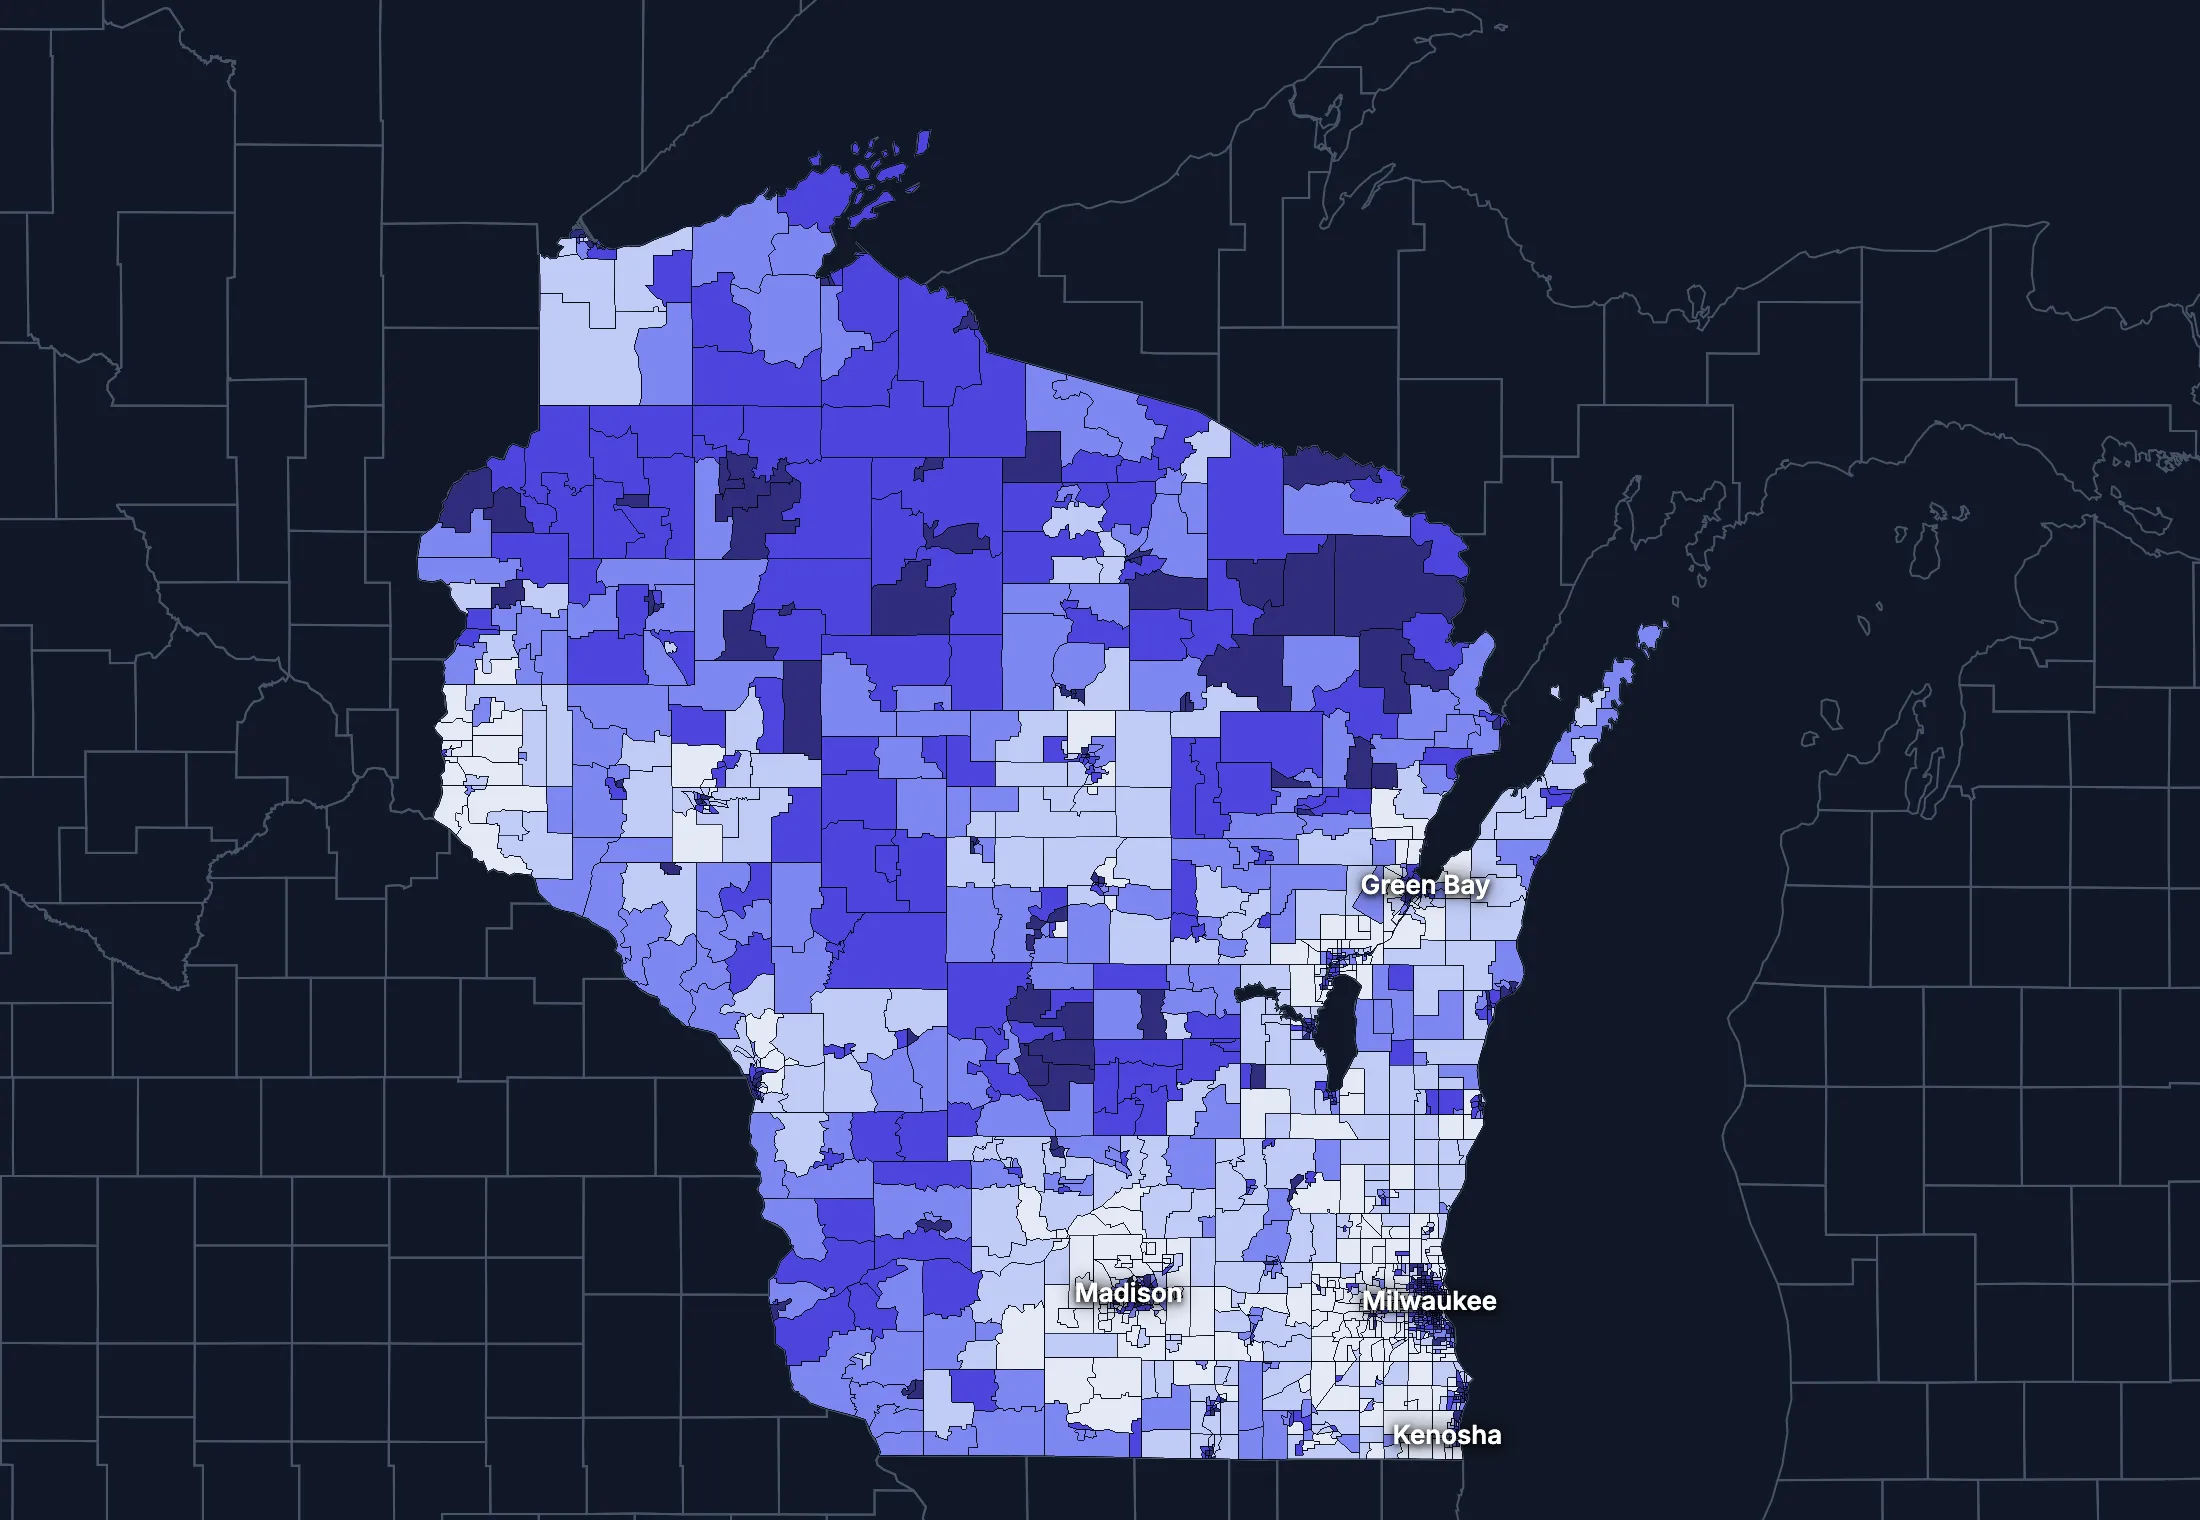
State averages hide a lot. These census tracts are the closest the census comes to neighborhoods.
Where the state’s average misleads
Each tick is one census tract, and the dark line marks the state. Hover over a tick or tap it to see the tract.
Poverty
320 of 1524 tracts are at least 1.5 times the state’s overall 10.6%, and 413 are at two-thirds of it or less.
Highest: Tract 11.02, 88.9%. Lowest: Tract 4702.04, 0.3%.
Renters paying 30% or more of income
106 of 1480 tracts are at least 1.5 times the state’s overall 41.1%, and 383 are at two-thirds of it or less.
Highest: Tract 9612, 87.2%. Lowest: Tract 30.01, 0.0%.
Adults with a bachelor’s degree
218 of 1524 tracts are at least 1.5 times the state’s overall 33.4%, and 478 are at two-thirds of it or less.
Highest: Tract 32, 95.6%. Lowest: Tract 9800, 0.0%.
Median household income
151 of 1522 tracts are at least 1.5 times the typical tract’s $75,091, and 170 are at two-thirds of it or less.
Highest: Tract 702, $224,750. Lowest: Tract 11.02, $10,114.
American Community Survey 2020–2024 5-year estimates, by census tract. Income is capped at $250,000+ by the Census Bureau.
People
Who lives in Wisconsin
Its median age of 41.3 is higher than the US (39.5). 5.4% of residents were born outside the US, and 9.5% speak a language other than English at home.
Age
Source: ACS 2025 1-year, table A01001.
Show data
| Wisconsin | United States | |
|---|---|---|
| Under 18 | 20.3% ±0.2% , number 1,211,897 ±13,700 | 21.0% ±<0.1% , number 71,689,151 ±111,800 |
| 18 to 24 | 9.4% ±0.2% , number 560,026 ±11,590 | 9.3% ±<0.1% , number 31,716,680 ±98,660 |
| 25 to 34 | 12.3% ±0.1% , number 736,034 ±6,451 | 13.6% ±<0.1% , number 46,357,354 ±55,690 |
| 35 to 44 | 12.9% ±0.2% , number 768,497 ±13,170 | 13.4% ±<0.1% , number 45,746,189 ±105,700 |
| 45 to 54 | 11.4% ±0.1% , number 682,237 ±5,835 | 11.8% ±<0.1% , number 40,257,563 ±53,540 |
| 55 to 64 | 12.8% ±0.2% , number 763,456 ±11,420 | 12.1% ±<0.1% , number 41,242,904 ±104,700 |
| 65 to 74 | 12.1% ±0.2% , number 723,350 ±10,760 | 10.8% ±<0.1% , number 36,895,650 ±91,520 |
| 75 and over | 8.8% ±0.1% , number 527,290 ±8,574 | 8.2% ±<0.1% , number 27,879,368 ±78,140 |
Embed
Race and ethnicity
Source: ACS 2025 1-year, table A04001.
Show data
| Wisconsin | United States | |
|---|---|---|
| White, not Hispanic | 76.5% ±0.1% , number 4,567,326 ±7,333 | 55.0% ±<0.1% , number 187,959,031 ±58,340 |
| Hispanic or Latino | 8.7% ±<0.1% , number 521,813 ±974 | 20.5% ±<0.1% , number 69,975,516 ±13,270 |
| Black, not Hispanic | 5.8% ±0.1% , number 346,645 ±8,565 | 11.7% ±<0.1% , number 40,096,453 ±106,200 |
| Asian, not Hispanic | 3.2% ±0.1% , number 191,184 ±5,064 | 6.5% ±<0.1% , number 22,096,709 ±58,340 |
| Other or multiracial | 5.8% ±0.2% , number 345,819 ±13,850 | 6.3% ±<0.1% , number 21,657,150 ±150,100 |
Embed
Language spoken at home
Source: ACS 2025 1-year, table C16001.
Show data
| Wisconsin | United States | |
|---|---|---|
| English only | 90.5% ±0.3% , number 5,135,966 ±16,440 | 77.1% ±0.1% , number 249,390,588 ±275,300 |
| Spanish | 5.2% ±0.2% , number 294,659 ±11,820 | 13.9% ±0.1% , number 44,921,985 ±177,800 |
| Other Indo-European | 2.0% ±0.2% , number 115,556 ±9,089 | 4.0% ±<0.1% , number 12,862,980 ±113,500 |
| Asian and Pacific Island | 1.7% ±0.1% , number 95,028 ±6,636 | 3.8% ±<0.1% , number 12,288,841 ±99,740 |
| Arabic and other | 0.6% ±0.1% , number 32,906 ±6,733 | 1.3% ±<0.1% , number 4,116,949 ±71,480 |
Embed
Marital status
Source: ACS 2025 1-year, table A11001.
Show data
| Wisconsin | United States | |
|---|---|---|
| Now married | 50.3% ±0.4% , number 2,506,982 ±21,240 | 47.9% ±0.1% , number 135,567,564 ±223,300 |
| Never married | 33.1% ±0.3% , number 1,649,410 ±17,180 | 34.8% ±0.1% , number 98,647,238 ±152,600 |
| Divorced | 10.4% ±0.3% , number 517,669 ±12,740 | 10.2% ±<0.1% , number 28,879,967 ±112,900 |
| Widowed | 5.6% ±0.1% , number 277,558 ±7,465 | 5.5% ±<0.1% , number 15,599,094 ±69,430 |
| Separated | 0.7% ±0.1% , number 35,755 ±3,447 | 1.6% ±<0.1% , number 4,441,399 ±49,160 |
Embed
Where people lived a year ago
Source: ACS 2025 1-year, table A08001.
Show data
| Wisconsin | United States | |
|---|---|---|
| Same home | 89.4% ±0.3% , number 5,288,703 ±21,000 | 88.4% ±0.1% , number 298,889,697 ±214,800 |
| Same county | 5.6% ±0.3% , number 328,886 ±18,110 | 6.0% ±<0.1% , number 20,202,671 ±166,300 |
| Another county in the state | 3.0% ±0.2% , number 176,925 ±9,223 | 3.0% ±<0.1% , number 10,168,097 ±89,190 |
| Another state | 1.8% ±0.2% , number 105,065 ±9,048 | 2.1% ±<0.1% , number 7,025,589 ±81,660 |
| Another country | 0.3% ±0.1% , number 17,130 ±3,478 | 0.6% ±<0.1% , number 1,984,943 ±47,210 |
Embed
Top countries of birth, among those born abroad
Source: ACS 2025 1-year, table A07001.
Show data
| Wisconsin | |
|---|---|
| Mexico | 24.2% , number 78,066 |
| India | 8.3% , number 26,944 |
| Laos | 4.9% , number 15,747 |
| Colombia | 3.9% , number 12,752 |
| China, Excluding Hong Kong and Taiwan | 3.6% , number 11,537 |
| Philippines | 3.5% , number 11,427 |
Embed
All the numbers
| Indicator | Wisconsin | US | Rank among states* | Table |
|---|---|---|---|---|
| Population | 5,972,787 | 341,784,859 | 20th | A00001 |
| People per square mile | 110 | 97 | 26th | A00002 |
| Land area (square miles) | 54,168 | – | – | A00002 |
| Median age | 41.3 ±0.2 | 39.5 ±0.1 | 13th | A01004 |
| Under 18 | 20.3% ±0.2% , number 1,211,897 ±13,700 | 21.0% ±<0.1% , number 71,689,151 ±111,800 | 34th | B02002 |
| 65 and over | 20.9% ±0.2% , number 1,250,640 ±13,760 | 19.0% ±<0.1% , number 64,775,018 ±120,300 | 16th | B02002 |
| Born outside the US | 5.4% ±0.2% , number 323,252 ±13,210 | 14.7% ±0.1% , number 50,409,320 ±204,800 | 39th | A06001 |
| Speak a language other than English at home | 9.5% ±0.3% , number 538,149 ±17,650 | 22.9% ±0.1% , number 74,190,755 ±244,000 | 34th | C16001 |
| Veterans (adults) | 5.7% ±0.2% , number 271,392 ±7,984 | 5.9% ±<0.1% , number 15,746,228 ±85,320 | 37th | A16002 |
| Living with a disability | 12.9% ±0.2% , number 762,631 ±14,110 | 13.7% ±<0.1% , number 46,271,455 ±126,000 | 41st | B18101 |
| Women 15–50 who had a baby in the past year | 5.1% ±0.4% , number 68,087 ±4,720 | 5.0% ±0.1% , number 4,016,759 ±44,040 | 39th | B13002 |
| Lived in the same home a year ago | 89.4% ±0.3% , number 5,288,703 ±21,000 | 88.4% ±0.1% , number 298,889,697 ±214,800 | 18th | A08001 |
| White, not Hispanic | 76.5% ±0.1% , number 4,567,326 ±7,333 | 55.0% ±<0.1% , number 187,959,031 ±58,340 | 11th | A04001 |
| Hispanic or Latino | 8.7% ±<0.1% , number 521,813 ±974 | 20.5% ±<0.1% , number 69,975,516 ±13,270 | 32nd | A04001 |
| Black, not Hispanic | 5.8% ±0.1% , number 346,645 ±8,565 | 11.7% ±<0.1% , number 40,096,453 ±106,200 | 29th | A04001 |
| Asian, not Hispanic | 3.2% ±0.1% , number 191,184 ±5,064 | 6.5% ±<0.1% , number 22,096,709 ±58,340 | 25th | A04001 |
*1 is the highest. Population is ranked among all states, and the rest among those of 1,000 people or more, whose figures can be ranked. Ranks use 5-year estimates, the only ones covering every state, so they can differ slightly from the figures here.
Income and work
Lower incomes than the US
The median household income is $80,213, lower than the US ($84,780). 10.3% of people live in poverty, and 5.9% have no health insurance, lower than the US (8.4%).
Household income
Source: ACS 2025 1-year, table A14001.
Show data
| Wisconsin | United States | |
|---|---|---|
| Under $25,000 | 12.9% ±0.4% , number 330,503 ±10,890 | 14.0% ±0.1% , number 18,727,548 ±88,990 |
| $25,000 to $49,999 | 16.8% ±0.5% , number 431,472 ±11,900 | 15.4% ±0.1% , number 20,665,585 ±101,400 |
| $50,000 to $74,999 | 17.2% ±0.4% , number 441,430 ±11,180 | 15.3% ±0.1% , number 20,513,565 ±88,500 |
| $75,000 to $99,999 | 13.8% ±0.4% , number 353,910 ±10,750 | 12.5% ±0.1% , number 16,814,245 ±87,520 |
| $100,000 to $149,999 | 19.3% ±0.4% , number 495,330 ±9,767 | 17.9% ±0.1% , number 24,018,984 ±99,670 |
| $150,000 to $199,999 | 9.4% ±0.3% , number 240,518 ±7,215 | 10.1% ±0.1% , number 13,521,827 ±70,660 |
| $200,000 or more | 10.7% ±0.3% , number 274,420 ±8,029 | 14.8% ±0.1% , number 19,801,668 ±84,120 |
Embed
What residents do for work
Source: ACS 2025 1-year, table A17004.
Show data
| Wisconsin | United States | |
|---|---|---|
| Education and health care | 24.3% ±0.4% , number 743,849 ±12,610 | 24.4% ±0.1% , number 40,862,193 ±140,800 |
| Manufacturing | 16.6% ±0.3% , number 508,466 ±10,790 | 9.6% ±0.1% , number 16,064,394 ±91,270 |
| Retail trade | 11.3% ±0.3% , number 346,517 ±9,602 | 10.6% ±0.1% , number 17,781,181 ±96,660 |
| Professional and business services | 9.7% ±0.3% , number 297,022 ±9,135 | 12.8% ±0.1% , number 21,375,231 ±87,110 |
| Arts, food and lodging | 8.0% ±0.3% , number 245,800 ±9,999 | 8.9% ±0.1% , number 14,811,502 ±87,840 |
| Construction | 6.5% ±0.2% , number 199,835 ±6,885 | 6.7% ±<0.1% , number 11,254,981 ±79,620 |
| Finance, insurance and real estate | 5.7% ±0.2% , number 175,454 ±7,161 | 6.6% ±<0.1% , number 11,025,569 ±68,570 |
| Transportation and warehousing | 4.9% ±0.2% , number 150,241 ±6,223 | 5.9% ±<0.1% , number 9,832,211 ±73,020 |
Embed
Where workers come from and go
Wisconsin has 2,905,544 jobs and 2,933,097 employed residents. 119,430 people commute in to work and 146,983 commute out, while 2,786,114 both live and work here. The most commuters come from Illinois.
Most commuters come from
- Illinois: 54,102
- Minnesota: 30,224
- Michigan: 12,829
Most residents commute to
- Minnesota: 66,412
- Illinois: 58,086
- Iowa: 7,769
Show data
| Wisconsin | |
|---|---|
| Live and work here | 2,786,114 |
| Work here, live elsewhere | 119,430 |
| Live here, work elsewhere | 146,983 |
Embed
All the numbers
| Indicator | Wisconsin | US | Rank among states* | Table |
|---|---|---|---|---|
| Median household income | $80,213 ±$703 | $84,780 ±$215 | 26th | A14006 |
| Income per person | $45,542 ±$495 | $47,171 ±$115 | 23rd | A14024 |
| Income inequality (Gini index) | 0.449 ±0.005 | 0.482 ±0.001 | 47th | A14028 |
| Living in poverty | 10.3% ±0.4% , number 598,881 ±21,320 | 11.8% ±0.1% , number 39,264,183 ±277,400 | 36th | A13004 |
| Unemployment rate | 3.2% ±0.2% , number 100,039 ±6,248 | 4.9% ±<0.1% , number 8,574,594 ±64,350 | 48th | A17005 |
| No health insurance | 5.9% ±0.2% , number 350,781 ±13,010 | 8.4% ±<0.1% , number 28,323,306 ±152,000 | 42nd | A20001 |
*1 is the highest. Population is ranked among all states, and the rest among those of 1,000 people or more, whose figures can be ranked. Ranks use 5-year estimates, the only ones covering every state, so they can differ slightly from the figures here.
Education
College degrees close to the US
35.2% of adults 25 and over have a bachelor’s degree or more, lower than the US (37.4%).
Highest level of education
Source: ACS 2025 1-year, table A12001.
Show data
| Wisconsin | United States | |
|---|---|---|
| Less than high school | 6.1% ±0.2% , number 258,121 ±9,889 | 9.4% ±0.1% , number 22,321,002 ±120,500 |
| High school only | 28.3% ±0.4% , number 1,190,353 ±17,090 | 25.6% ±0.1% , number 61,096,726 ±203,400 |
| Some college | 30.3% ±0.4% , number 1,272,004 ±18,850 | 27.7% ±0.1% , number 65,920,977 ±173,500 |
| Bachelor’s degree | 22.5% ±0.4% , number 947,202 ±16,470 | 22.3% ±0.1% , number 53,224,312 ±196,700 |
| Graduate degree | 12.7% ±0.3% , number 533,184 ±12,380 | 15.0% ±0.1% , number 35,816,011 ±159,400 |
Embed
All the numbers
| Indicator | Wisconsin | US | Rank among states* | Table |
|---|---|---|---|---|
| Bachelor’s degree or more | 35.2% ±0.5% , number 1,480,386 ±20,610 | 37.4% ±0.1% , number 89,040,323 ±253,200 | 29th | A12001 |
| High school graduate or more | 93.9% ±0.8% , number 3,942,743 ±32,750 | 90.6% ±0.2% , number 216,058,026 ±368,200 | 8th | A12001 |
*1 is the highest. Population is ranked among all states, and the rest among those of 1,000 people or more, whose figures can be ranked. Ranks use 5-year estimates, the only ones covering every state, so they can differ slightly from the figures here.
Housing
Home values outran incomes
31.9% of households rent, lower than the US (34.7%). The median home is worth $316,500 and the median rent is $1,219. After inflation, home values rose 37% from 2015 to 2025, while household income rose 5%.
Housing costs and income, 2015 to 2025, after inflation
Source: ACS 1-year, table A10036, A18009, A14006.
Show data
| Wisconsin | United States | |
|---|---|---|
| Median home value | +37.3% | +39.3% |
| Median rent | +12.4% | +18.5% |
| Median household income | +5.2% | +10.9% |
Embed
Types of homes
Source: ACS 2025 1-year, table A10032.
Show data
| Wisconsin | United States | |
|---|---|---|
| Single-family, detached | 65.8% ±0.4% , number 1,866,766 ±11,700 | 60.9% ±0.1% , number 90,335,844 ±173,300 |
| Single-family, attached | 4.8% ±0.2% , number 135,470 ±6,386 | 6.4% ±<0.1% , number 9,527,703 ±51,230 |
| 2 to 4 units | 8.7% ±0.3% , number 247,776 ±9,140 | 7.5% ±0.1% , number 11,109,005 ±75,790 |
| 5 to 19 units | 8.7% ±0.4% , number 246,711 ±10,740 | 8.7% ±0.1% , number 12,829,882 ±97,590 |
| 20 or more units | 9.2% ±0.4% , number 259,775 ±10,510 | 11.1% ±0.1% , number 16,381,450 ±92,310 |
| Mobile homes and other | 2.9% ±0.1% , number 82,469 ±4,032 | 5.4% ±<0.1% , number 8,045,083 ±53,680 |
Embed
When homes were built
Source: ACS 2025 1-year, table A10055.
Show data
| Wisconsin | United States | |
|---|---|---|
| 2010 or later | 11.2% ±0.3% , number 286,642 ±8,904 | 15.1% ±0.1% , number 20,257,912 ±101,300 |
| 2000 to 2009 | 12.1% ±0.3% , number 311,489 ±8,708 | 13.8% ±0.1% , number 18,535,840 ±92,260 |
| 1980 to 1999 | 21.2% ±0.5% , number 543,793 ±11,890 | 24.1% ±0.1% , number 32,332,570 ±118,900 |
| 1960 to 1979 | 23.3% ±0.5% , number 598,223 ±12,430 | 22.9% ±0.1% , number 30,726,302 ±110,000 |
| Before 1960 | 32.2% ±0.6% , number 827,436 ±14,910 | 24.0% ±0.1% , number 32,210,798 ±121,500 |
Embed
All the numbers
| Indicator | Wisconsin | US | Rank among states* | Table |
|---|---|---|---|---|
| Housing units | 2,838,967 | – | – | A10001 |
| Households | 2,567,583 ±9,080 | – | – | A10008 |
| People per household | 2.27 ±0.01 | 2.49 ±0.01 | 47th | A10003 |
| Households that rent | 31.9% ±0.5% , number 819,851 ±12,410 | 34.7% ±0.1% , number 46,551,688 ±193,200 | 30th | A10060 |
| Vacant homes | 9.6% ±0.3% , number 271,384 ±9,359 | 9.6% ±0.1% , number 14,165,545 ±137,100 | 22nd | A10047, A10060 |
| Median gross rent | $1,219 ±$12 | $1,557 ±$4 | 33rd | A18009 |
| Median home value | $316,500 ±$2,156 | $371,100 ±$646 | 31st | A10036 |
| Renters paying 30% or more of income | 43.1% ±1.3% , number 353,239 ±11,750 | 48.3% ±0.2% , number 22,486,693 ±122,100 | 41st | A18002 |
| Owners paying 30% or more of income | 19.6% ±0.5% , number 342,449 ±9,257 | 24.2% ±0.1% , number 21,201,943 ±93,050 | 37th | A10040 |
| Homes built before 1960 | 32.2% ±0.6% , number 827,436 ±14,910 | 24.0% ±0.1% , number 32,210,798 ±121,500 | 13th | A10055 |
*1 is the highest. Population is ranked among all states, and the rest among those of 1,000 people or more, whose figures can be ranked. Ranks use 5-year estimates, the only ones covering every state, so they can differ slightly from the figures here.
Getting around
A driving state with short commutes
74.9% of workers drive alone and 11.6% work from home. 29.0% of those who travel to work spend 30 minutes or more getting there, and 6.8% of households have no vehicle.
How people get to work
Source: ACS 2025 1-year, table A09005.
Show data
| Wisconsin | United States | |
|---|---|---|
| Drive alone | 74.9% ±0.4% , number 2,265,259 ±17,600 | 69.8% ±0.1% , number 115,297,377 ±192,900 |
| Carpool | 7.7% ±0.3% , number 234,487 ±10,070 | 8.9% ±0.1% , number 14,712,170 ±97,240 |
| Public transit | 1.6% ±0.2% , number 49,796 ±5,030 | 4.3% ±<0.1% , number 7,100,386 ±63,330 |
| Walk | 2.6% ±0.2% , number 80,024 ±5,528 | 2.4% ±<0.1% , number 4,016,469 ±41,070 |
| Work from home | 11.6% ±0.3% , number 351,624 ±9,945 | 12.9% ±0.1% , number 21,288,393 ±105,700 |
| Other | 1.5% ±0.1% , number 44,560 ±4,166 | 1.7% ±<0.1% , number 2,799,658 ±41,510 |
Embed
Time spent getting to work
Source: ACS 2025 1-year, table B09001.
Show data
| Wisconsin | United States | |
|---|---|---|
| Under 10 minutes | 17.3% ±0.4% , number 462,045 ±12,310 | 12.0% ±0.1% , number 17,199,225 ±93,440 |
| 10 to 19 minutes | 32.0% ±0.5% , number 856,798 ±15,670 | 27.8% ±0.1% , number 40,059,540 ±137,700 |
| 20 to 29 minutes | 21.7% ±0.5% , number 580,336 ±12,850 | 21.0% ±0.1% , number 30,221,743 ±111,100 |
| 30 to 39 minutes | 14.7% ±0.4% , number 392,503 ±11,540 | 17.1% ±0.1% , number 24,659,138 ±103,800 |
| 40 to 59 minutes | 8.7% ±0.3% , number 233,822 ±8,381 | 12.6% ±0.1% , number 18,104,709 ±97,070 |
| 60 minutes or more | 5.6% ±0.2% , number 148,622 ±6,551 | 9.5% ±0.1% , number 13,681,705 ±84,440 |
Embed
Vehicles per household
Source: ACS 2025 1-year, table A10030.
Show data
| Wisconsin | United States | |
|---|---|---|
| None | 6.8% ±0.3% , number 175,192 ±7,527 | 8.8% ±0.1% , number 11,781,997 ±77,240 |
| One | 32.9% ±0.5% , number 844,289 ±12,610 | 33.1% ±0.1% , number 44,424,682 ±160,700 |
| Two | 39.2% ±0.5% , number 1,005,613 ±14,350 | 36.0% ±0.1% , number 48,200,889 ±176,800 |
| Three or more | 21.1% ±0.4% , number 542,489 ±11,410 | 22.1% ±0.1% , number 29,655,854 ±113,300 |
Embed
All the numbers
| Indicator | Wisconsin | US | Rank among states* | Table |
|---|---|---|---|---|
| Drive to work alone | 74.9% ±0.4% , number 2,265,259 ±17,600 | 69.8% ±0.1% , number 115,297,377 ±192,900 | 19th | A09005 |
| Take public transit | 1.6% ±0.2% , number 49,796 ±5,030 | 4.3% ±<0.1% , number 7,100,386 ±63,330 | 24th | A09005 |
| Work from home | 11.6% ±0.3% , number 351,624 ±9,945 | 12.9% ±0.1% , number 21,288,393 ±105,700 | 27th | A09005 |
| Commute 30 minutes or more | 29.0% ±0.6% , number 774,947 ±15,700 | 39.2% ±0.1% , number 56,445,552 ±165,300 | 41st | B09001 |
| Households with no vehicle | 6.8% ±0.3% , number 175,192 ±7,468 | 8.8% ±<0.1% , number 11,781,997 ±64,240 | 24th | A10030 |
*1 is the highest. Population is ranked among all states, and the rest among those of 1,000 people or more, whose figures can be ranked. Ranks use 5-year estimates, the only ones covering every state, so they can differ slightly from the figures here.
Places
The largest cities in Wisconsin
Population, from the latest estimates available. Figures cover the whole of each place.
Largest cities
- Milwaukee: 562,388
- Madison: 286,238
- Green Bay: 106,678
- Kenosha: 99,222
- Racine: 77,902
- Appleton: 77,124
- Eau Claire: 71,607
- Waukesha city: 70,880
States like this one
- Pennsylvania: 13,018,639
- Ohio: 11,810,293
- Tennessee: 7,066,383
- Missouri: 6,191,814
States at least a third this size, with the closest income, education, age, housing and origins.
Every county and place in Wisconsin
Find any county, city, town, metro area, ZIP code, school district or district in Wisconsin.
Counties
Each of the 72 counties with its population, from ACS 2020–2024 5-year estimates.
- Adams County21,123
- Ashland County16,080
- Barron County46,797
- Bayfield County16,575
- Brown County270,892
- Buffalo County13,393
- Burnett County16,916
- Calumet County52,942
- Chippewa County66,799
- Clark County34,739
- Columbia County58,272
- Crawford County16,042
- Dane County572,674
- Dodge County88,742
- Door County30,445
- Douglas County44,229
- Dunn County45,527
- Eau Claire County107,116
- Florence County4,646
- Fond du Lac County104,137
- Forest County9,369
- Grant County51,770
- Green County37,017
- Green Lake County19,263
- Iowa County23,867
- Iron County6,210
- Jackson County20,981
- Jefferson County86,003
- Juneau County26,689
- Kenosha County168,438
- Kewaunee County20,664
- La Crosse County120,488
- Lafayette County16,942
- Langlade County19,490
- Lincoln County28,426
- Manitowoc County81,406
- Marathon County138,403
- Marinette County42,046
- Marquette County15,746
- Menominee County4,252
- Milwaukee County926,331
- Monroe County46,208
- Oconto County39,589
- Oneida County38,167
- Outagamie County192,826
- Ozaukee County92,966
- Pepin County7,431
- Pierce County42,584
- Polk County45,555
- Portage County70,832
- Price County14,092
- Racine County197,532
- Richland County17,205
- Rock County164,350
- Rusk County14,179
- Sauk County66,009
- Sawyer County18,476
- Shawano County41,039
- Sheboygan County117,991
- St. Croix County96,033
- Taylor County20,024
- Trempealeau County30,839
- Vernon County31,049
- Vilas County23,647
- Walworth County105,657
- Washburn County16,854
- Washington County137,879
- Waukesha County411,762
- Waupaca County51,569
- Waushara County24,868
- Winnebago County171,769
- Wood County74,004
Cities, towns and other places
Each of the 808 with its population, from ACS 2020–2024 5-year estimates. Census-designated places are communities without a local government of their own, drawn by the Census Bureau so they can be counted.
- Abbotsford2,024
- Abrams278
- Adams2,050
- Adell419
- Albany1,063
- Algoma3,228
- Allens Grove147
- Allenton842
- Allouez13,975
- Alma788
- Alma Center713
- Almena641
- Almond441
- Alto122
- Altoona8,878
- Amberg185
- Amery2,959
- Amherst1,113
- Amherst Junction341
- Angelica115
- Aniwa245
- Antigo8,069
- Appleton75,023
- Arcadia3,806
- Arena883
- Argonne96
- Argyle877
- Arkansaw334
- Arkdale186
- Arlington946
- Arpin290
- Ashippun919
- Ashland7,902
- Ashwaubenon17,314
- Athens1,055
- Auburndale837
- Augusta1,341
- Avoca473
- Babcock95
- Bagley337
- Baileys Harbor386
- Baldwin4,342
- Balsam Lake754
- Bancroft673
- Bangor1,517
- Baraboo12,769
- Barneveld1,416
- Barron3,681
- Barronett42
- Batavia239
- Bay City327
- Bayfield565
- Bayfront135
- Bayside4,329
- Bear Creek307
- Beaver Dam16,565
- Belgium2,488
- Bell Center82
- Belleville2,579
- Bellevue16,442
- Belmont949
- Beloit36,534
- Benton1,054
- Berlin5,562
- Big Bend1,291
- Big Falls134
- Big Foot Prairie136
- Birch Hill313
- Birchwood451
- Birnamwood643
- Biron822
- Black Creek1,262
- Black Earth1,736
- Black River Falls3,546
- Blair1,254
- Blanchardville734
- Bloomer3,673
- Bloomfield4,780
- Bloomington710
- Blue Mounds795
- Blue River472
- Bluffview542
- Boaz116
- Bohners Lake2,460
- Bonduel1,535
- Boscobel3,242
- Boulder Junction193
- Bowler316
- Boyceville1,083
- Boyd566
- Brandon913
- Brice Prairie1,782
- Briggsville320
- Brillion3,299
- Bristol5,207
- Brodhead3,197
- Brookfield41,273
- Brooklyn1,408
- Brothertown258
- Brown Deer12,564
- Browns Lake1,827
- Brownsville595
- Browntown249
- Bruce900
- Brule162
- Buffalo City902
- Burlington10,987
- Burnett270
- Butler1,859
- Butte des Morts1,064
- Butternut465
- Cable207
- Cadott1,449
- Caledonia25,257
- Cambria795
- Cambridge1,617
- Cameron1,686
- Camp Douglas762
- Campbellsport1,973
- Caroline426
- Cascade620
- Casco561
- Cashton1,281
- Cassville634
- Cataract138
- Catawba170
- Cazenovia267
- Cecil466
- Cedar Grove2,402
- Cedarburg12,605
- Ceex Haci25
- Centuria806
- Chain O' Lakes908
- Chaseburg304
- Chelsea75
- Chenequa742
- Chetek2,177
- Chief Lake660
- Chili306
- Chilton4,049
- Chippewa Falls14,782
- Clam Lake53
- Clarks Mills87
- Clayton370
- Clear Lake957
- Cleveland1,676
- Clinton2,041
- Clintonville4,580
- Clyman354
- Cobb403
- Cochrane516
- Colby1,907
- Coleman942
- Colfax1,370
- Collins249
- Coloma549
- Columbus5,488
- Combined Locks3,622
- Como2,197
- Conrath70
- Coon Valley857
- Cornell1,307
- Cornucopia108
- Cottage Grove8,513
- Couderay118
- Crandon1,365
- Crivitz993
- Cross Plains4,107
- Cuba City2,007
- Cudahy17,853
- Cumberland2,282
- Curtiss442
- Dale707
- Dallas359
- Dalton227
- Danbury73
- Dane1,067
- Darien1,126
- Darlington2,409
- De Pere25,301
- De Soto503
- Deer Park223
- Deerfield2,541
- DeForest11,501
- Dekorra161
- Delafield7,202
- Delavan8,689
- Delavan Lake2,757
- Dellwood661
- Denmark2,558
- Diamond Bluff192
- Diaperville109
- Dickeyville878
- Dodge207
- Dodgeville5,042
- Dorchester879
- Dousman2,479
- Downing271
- Downsville305
- Doylestown160
- Dresser1,028
- Drummond141
- Dunbar96
- Durand1,731
- Dyckesville391
- Eagle2,054
- Eagle Lake1,037
- Eagle River1,528
- East Troy4,978
- Eastman398
- Easton46
- Eau Claire70,322
- Eden732
- Edgar1,409
- Edgerton6,014
- Edmund187
- Egg Harbor343
- Eland169
- Elcho207
- Elderon135
- Eleva747
- Elk Mound1,096
- Elkhart Lake1,092
- Elkhorn10,221
- Ellison Bay186
- Ellsworth3,349
- Elm Grove6,459
- Elmwood629
- Elmwood Park526
- Elroy1,522
- Embarrass284
- Emerald191
- Endeavor458
- Ephraim412
- Ettrick601
- Eureka167
- Evansville5,782
- Exeland193
- Fairchild414
- Fairwater350
- Fall Creek1,493
- Fall River1,678
- Fennimore2,752
- Fenwood92
- Ferryville194
- Fitchburg32,619
- Florence488
- Fond du Lac44,494
- Fontana-on-Geneva Lake1,737
- Footville908
- Forest Junction594
- Forestville558
- Fort Atkinson12,463
- Fountain City835
- Fox Crossing19,131
- Fox Lake1,780
- Fox Point6,683
- Francis Creek627
- Franklin35,886
- Franks Field49
- Frederic1,140
- Fredonia2,448
- Fremont650
- French Island4,188
- Friendship813
- Friesland297
- Fulton31
- Galesville1,742
- Gays Mills523
- Genoa273
- Genoa City2,942
- Germantown20,962
- Gibbsville529
- Gillett1,209
- Gilman388
- Gilmanton148
- Glen Flora89
- Glen Haven68
- Glenbeulah435
- Glendale13,656
- Glenwood City1,260
- Glidden215
- Goodman170
- Gordon128
- Gotham177
- Grafton12,445
- Grand Marsh141
- Grand View138
- Granton345
- Grantsburg1,340
- Gratiot305
- Green Bay106,253
- Green Lake1,076
- Green Valley37
- Greenbush126
- Greendale14,594
- Greenfield37,345
- Greenleaf865
- Greenville12,987
- Greenwood1,100
- Gresham570
- Hager City243
- Hales Corners7,689
- Hammond1,960
- Hancock471
- Hanover130
- Harrison13,658
- Harrisville156
- Hartford15,821
- Hartland9,972
- Hatfield190
- Hatley542
- Haugen284
- Hawkins322
- Hayward2,555
- Hazel Green1,204
- Hebron344
- Helenville96
- Herbster83
- Hewitt775
- Highland867
- Hilbert988
- Hillsboro1,353
- Hingham960
- Hixton422
- Hobart10,610
- Holcombe237
- Hollandale327
- Holmen11,372
- Horicon3,814
- Hortonville3,256
- Houlton240
- Howard21,087
- Howards Grove3,223
- Hudson14,959
- Humbird300
- Hurley1,354
- Hustisford1,008
- Hustler141
- Independence1,462
- Ingram44
- Iola1,286
- Iron Belt140
- Iron Ridge909
- Iron River826
- Ironton271
- Ixonia2,684
- Jackson8,003
- Janesville66,030
- Jefferson7,732
- Jim Falls339
- Johnson Creek3,362
- Jolmaville104
- Juda390
- Jump River43
- Junction City311
- Juneau2,625
- Kaukauna17,706
- Kekoskee1,067
- Kellnersville254
- Kendall379
- Kennan112
- Kenosha99,372
- Keshena1,410
- Kewaskum4,461
- Kewaunee2,806
- Kiel3,943
- Kieler358
- Kimberly7,447
- King1,399
- Kingston271
- Knapp532
- Knowlton91
- Kohler2,175
- Krakow301
- Kronenwetter8,395
- La Crosse51,356
- La Farge575
- La Valle326
- Lac du Flambeau1,503
- Lac La Belle259
- Ladysmith3,227
- Lake Arrowhead969
- Lake Camelot1,162
- Lake Delton3,482
- Lake Geneva8,521
- Lake Hallie7,285
- Lake Ivanhoe558
- Lake Koshkonong1,010
- Lake Lorraine284
- Lake Mills6,470
- Lake Nebagamon963
- Lake Ripley1,932
- Lake Sherwood369
- Lake Tomahawk190
- Lake Wazeecha2,850
- Lake Wisconsin5,384
- Lake Wissota3,184
- Lakewood182
- Lancaster3,976
- Lannon1,482
- Laona631
- Lauderdale Lakes1,469
- Lebanon85
- Legend Lake1,717
- Lena483
- Leopolis100
- Lewis170
- Lily Lake456
- Lime Ridge263
- Linden553
- Lisbon10,736
- Little Chute11,754
- Little Round Lake1,295
- Little Sturgeon111
- Livingston555
- Lodi3,204
- Loganville252
- Lohrville457
- Lomira2,675
- Lone Rock734
- Long Lake40
- Lowell312
- Loyal1,363
- Lublin110
- Luck1,124
- Luxemburg2,737
- Lyndon Station720
- Lynxville105
- Lyons1,196
- Madison278,001
- Maiden Rock85
- Maine2,602
- Manawa1,337
- Manitowoc34,620
- Maple Bluff1,329
- Marathon City1,422
- Marengo149
- Maribel370
- Marinette11,115
- Marion1,238
- Markesan1,275
- Marquette232
- Marshall3,778
- Marshfield18,700
- Mason93
- Mattoon457
- Mauston4,248
- Mayville5,228
- Mazomanie1,694
- McFarland9,160
- Medford4,431
- Mellen681
- Melrose562
- Melvina89
- Menasha18,273
- Menomonee Falls39,539
- Menomonie16,539
- Mequon25,270
- Mercer365
- Merrill9,356
- Merrillan527
- Merrimac570
- Merton3,550
- Middle Village236
- Middleton22,301
- Milladore419
- Millston114
- Milltown861
- Milton5,706
- Milwaukee566,973
- Mindoro225
- Mineral Point2,559
- Minocqua497
- Minong678
- Mishicot1,450
- Mission349
- Mole Lake533
- Mondovi2,872
- Monona8,527
- Monroe10,587
- Montello1,404
- Montfort629
- Monticello1,189
- Montreal909
- Mosinee4,498
- Mount Calvary642
- Mount Hope230
- Mount Horeb7,736
- Mount Pleasant27,953
- Mount Sterling164
- Mountain250
- Mukwonago8,415
- Muscoda1,151
- Muskego25,406
- Nashotah1,354
- Navarino159
- Necedah1,142
- Neenah27,336
- Neillsville2,230
- Nekoosa2,420
- Nelson381
- Nelsonville190
- Neopit623
- Neosho536
- Neshkoro470
- New Auburn531
- New Berlin40,270
- New Glarus2,172
- New Holstein3,075
- New Lisbon2,562
- New London7,726
- New Munster234
- New Odanah275
- New Post340
- New Richmond10,539
- Newald82
- Newburg1,287
- Niagara1,464
- Nichols332
- North Bay203
- North Fond du Lac5,392
- North Freedom716
- North Hudson3,819
- North Lake348
- North Prairie2,385
- Northport373
- Norwalk662
- Oak Creek37,325
- Oakdale321
- Oakfield1,182
- Oconomowoc19,080
- Oconomowoc Lake669
- Oconto4,625
- Oconto Falls3,001
- Odanah60
- Ogdensburg189
- Ogema293
- Okauchee Lake4,733
- Oliver462
- Omro3,642
- Onalaska19,348
- Ontario422
- Oostburg3,058
- Oregon11,547
- Orfordville1,473
- Osceola2,849
- Oshkosh66,729
- Osseo1,687
- Owen920
- Oxford527
- Paac Ciinak58
- Packwaukee244
- Paddock Lake2,947
- Palmyra2,195
- Pardeeville1,672
- Park Falls2,318
- Park Ridge626
- Patch Grove227
- Pella112
- Pembine269
- Pence149
- Pepin736
- Peshtigo3,398
- Pewaukee city16,211
- Pewaukee village8,196
- Phillips1,602
- Pigeon Falls368
- Pine River106
- Pittsville823
- Plain780
- Plainfield1,094
- Platteville11,499
- Pleasant Prairie21,669
- Plover13,884
- Plum City541
- Plymouth8,890
- Polonia776
- Poplar626
- Port Edwards1,881
- Port Washington12,645
- Port Wing148
- Portage10,236
- Post Lake331
- Potosi595
- Potter221
- Potter Lake807
- Pound379
- Powers Lake1,278
- Poy Sippi433
- Poynette2,678
- Prairie du Chien5,491
- Prairie du Sac4,382
- Prairie Farm423
- Prentice521
- Prescott4,503
- Princeton1,166
- Pulaski4,006
- Pulcifer145
- Racine77,633
- Radisson234
- Randolph1,642
- Random Lake1,575
- Raymond3,945
- Readstown381
- Redgranite1,938
- Reedsburg10,168
- Reedsville1,099
- Reeseville895
- Reserve252
- Rewey238
- Rhinelander8,316
- Rib Lake888
- Rib Mountain7,289
- Rice Lake9,030
- Richfield11,755
- Richland Center5,109
- Ridgeland313
- Ridgeway594
- Rio1,141
- Ripon7,772
- River Falls16,719
- River Hills1,632
- Roberts1,858
- Rochester3,764
- Rock Falls169
- Rock Springs323
- Rockdale201
- Rockland745
- Rome620
- Rosendale853
- Rosholt460
- Rothschild5,600
- Rubicon127
- Rudolph466
- Salem Lakes14,366
- Sand Pillow176
- Sandy Hook268
- Sauk City3,483
- Saukville4,267
- Saxon67
- Sayner213
- Scandinavia379
- Schofield2,120
- Seneca372
- Sextonville459
- Seymour CDP1,531
- Seymour city3,570
- Sharon1,592
- Shawano9,522
- Sheboygan49,645
- Sheboygan Falls8,547
- Sheldon220
- Shell Lake1,459
- Sherwood3,252
- Shiocton825
- Shopiere123
- Shorewood13,627
- Shorewood Hills2,149
- Shullsburg1,184
- Siren713
- Sister Bay1,044
- Slinger6,307
- Sobieski382
- Soldiers Grove579
- Solon Springs649
- Somers8,216
- Somerset3,208
- South Milwaukee20,442
- South Wayne441
- Sparta9,950
- Spencer1,686
- Spooner2,278
- Spring Green1,397
- Spring Valley1,290
- Springbrook77
- Springfield100
- St. Cloud454
- St. Croix Falls2,423
- St. Francis9,004
- St. Joseph548
- St. Nazianz907
- St. Peter1,413
- Stanley3,760
- Star Prairie674
- Stetsonville575
- Steuben148
- Stevens Point25,785
- Stockbridge771
- Stockholm74
- Stoddard823
- Stone Lake127
- Stoughton13,033
- Stratford1,438
- Strum1,064
- Sturgeon Bay9,806
- Sturtevant6,772
- Suamico12,985
- Sullivan663
- Summit5,114
- Summit Lake93
- Sun Prairie37,570
- Superior city26,677
- Superior village653
- Suring411
- Sussex12,066
- Tainter Lake2,609
- Taycheedah801
- Taylor328
- Tennyson308
- Theresa1,378
- Thiensville3,299
- Thornton32
- Thorp1,590
- Three Lakes410
- Tichigan5,052
- Tigerton762
- Tilleda72
- Tomah9,532
- Tomahawk3,395
- Tony123
- Townsend37
- Trego142
- Trempealeau1,864
- Tunnel City105
- Turtle Lake CDP327
- Turtle Lake village960
- Tustin68
- Twin Lakes6,309
- Two Rivers11,231
- Union Center215
- Union Grove5,036
- Unity378
- Valders873
- Van Dyne752
- Vernon7,481
- Verona15,232
- Vesper496
- Viola551
- Viroqua4,471
- Wabeno269
- Waldo506
- Wales2,902
- Walworth2,759
- Warrens438
- Washburn1,884
- Waterford5,692
- Waterloo3,600
- Watertown22,774
- Waubeka573
- Waukau325
- Waukesha city71,233
- Waukesha village8,514
- Waumandee81
- Waunakee15,687
- Waupaca6,283
- Waupun11,174
- Wausau39,996
- Wausaukee531
- Wautoma1,817
- Wauwatosa48,529
- Wauzeka591
- Webster575
- West Allis59,612
- West Baraboo1,577
- West Bend32,030
- West Milwaukee4,038
- West Salem5,330
- Westboro227
- Westby2,432
- Westfield1,231
- Weston15,749
- Weyauwega1,789
- Weyerhaeuser161
- Wheeler316
- White Lake220
- Whitefish Bay14,665
- Whitehall1,555
- Whitelaw862
- Whitewater15,807
- Whiting1,493
- Whittlesey77
- Wild Rose903
- Williams Bay2,981
- Wilson200
- Wilton532
- Winchester569
- Wind Lake4,836
- Wind Point1,531
- Windsor9,452
- Winneconne2,511
- Winter285
- Wiota50
- Wisconsin Dells2,547
- Wisconsin Rapids18,722
- Withee520
- Wittenberg1,027
- Wonewoc670
- Woodford75
- Woodman224
- Woodruff580
- Woodville1,424
- Wrightstown3,322
- Wyeville159
- Wyocena676
- Yorkville3,243
- Yuba54
- Zoar89
Metro and micro areas
Each of the 29 that reach into Wisconsin, with its whole population, from ACS 2020–2024 5-year estimates. Metro and micro areas are counties tied together by commuting, drawn by the Office of Management and Budget.
- Appleton, WI Metro Area245,768
- Baraboo, WI Micro Area66,009
- Beaver Dam, WI Micro Area88,742
- Duluth, MN-WI Metro Area280,870
- Eau Claire, WI Metro Area173,915
- Fond du Lac, WI Metro Area104,137
- Green Bay, WI Metro Area331,145
- Iron Mountain, MI-WI Micro Area30,600
- Janesville-Beloit, WI Metro Area164,350
- Kenosha, WI Metro Area168,438
- La Crosse-Onalaska, WI-MN Metro Area170,190
- Madison, WI Metro Area691,830
- Manitowoc, WI Micro Area81,406
- Marinette, WI-MI Micro Area65,293
- Menomonie, WI Micro Area45,527
- Milwaukee-Waukesha, WI Metro Area1.57M
- Minneapolis-St. Paul-Bloomington, MN-WI Metro Area3.71M
- Oshkosh-Neenah, WI Metro Area171,769
- Platteville, WI Micro Area51,770
- Racine-Mount Pleasant, WI Metro Area197,532
- Rice Lake, WI Micro Area46,797
- Shawano, WI Micro Area45,291
- Sheboygan, WI Metro Area117,991
- Sparta, WI Micro Area46,208
- Stevens Point-Plover, WI Micro Area70,832
- Watertown-Fort Atkinson, WI Micro Area86,003
- Wausau, WI Metro Area138,403
- Whitewater-Elkhorn, WI Micro Area105,657
- Wisconsin Rapids-Marshfield, WI Micro Area74,004
ZIP codes
Each of the 780 with people in it, by the town it's centered in, from ACS 2020–2024 5-year estimates. These are the Census Bureau's ZIP Code Tabulation Areas, which follow the Postal Service's ZIP codes as closely as census blocks allow.
- 53001Batavia1,766
- 53002Allenton2,584
- 53003Ashippun130
- 53004Belgium3,475
- 53005Brookfield21,675
- 53006Brownsville1,905
- 53007Butler1,859
- 53010Campbellsport7,444
- 53011Cascade2,176
- 53012Cedarburg19,183
- 53013Cedar Grove3,717
- 53014Chilton7,898
- 53015Cleveland2,751
- 53016Clyman360
- 53017Richfield5,458
- 53018Delafield8,201
- 53019Eden1,876
- 53020Elkhart Lake3,431
- 53021Waubeka4,537
- 53022Germantown20,046
- 53023Greenbush1,293
- 53024Grafton18,982
- 53027Hartford23,118
- 53029Merton21,778
- 53031Hingham105
- 53032Horicon4,898
- 53033Richfield6,286
- 53034Hustisford1,652
- 53035Iron Ridge2,502
- 53036Ixonia3,730
- 53037Jackson10,254
- 53038Johnson Creek4,192
- 53039Juneau4,702
- 53040Kewaskum8,630
- 53042Kiel6,810
- 53044Kohler2,326
- 53045Brookfield23,329
- 53046Lannon1,482
- 53047Lebanon85
- 53048Lomira3,420
- 53049St. Peter2,298
- 53050Mayville7,159
- 53051Menomonee Falls39,559
- 53057Mount Calvary1,882
- 53058Nashotah3,405
- 53059Neosho1,774
- 53061New Holstein5,144
- 53063Cleveland1,578
- 53065Oakfield2,351
- 53066Oconomowoc37,558
- 53069Lac La Belle671
- 53070Oostburg4,951
- 53072Pewaukee village26,200
- 53073Plymouth16,136
- 53074Port Washington13,682
- 53075Random Lake3,402
- 53076Richfield3,109
- 53078Rubicon1,734
- 53079St. Cloud1,420
- 53080Saukville5,059
- 53081Sheboygan43,381
- 53083Howards Grove21,579
- 53085Sheboygan Falls11,695
- 53086Slinger9,426
- 53088Stockbridge203
- 53089Lisbon20,588
- 53090West Bend21,625
- 53091Theresa2,123
- 53092Mequon20,886
- 53093Hingham2,135
- 53094Watertown17,998
- 53095West Bend27,817
- 53097Mequon7,683
- 53098Lebanon11,353
- 53099Iron Ridge15
- 53103Vernon3,762
- 53104Bristol5,826
- 53105Burlington28,751
- 53108Caledonia3,060
- 53110Cudahy17,853
- 53114Darien1,979
- 53115Delavan16,381
- 53118Dousman7,554
- 53119Eagle5,803
- 53120East Troy10,848
- 53121Elkhorn18,551
- 53122Elm Grove6,508
- 53125Fontana-on-Geneva Lake1,898
- 53126Raymond7,064
- 53127North Prairie79
- 53128Bloomfield9,030
- 53129Greendale14,570
- 53130Hales Corners7,712
- 53132Franklin35,433
- 53137Helenville1,650
- 53139Eagle Lake2,523
- 53140Kenosha30,238
- 53142Pleasant Prairie34,144
- 53143Kenosha20,889
- 53144Somers26,652
- 53146New Berlin7,285
- 53147Lake Geneva18,638
- 53149Mukwonago19,614
- 53150Muskego26,259
- 53151New Berlin32,824
- 53153North Prairie2,548
- 53154Oak Creek37,325
- 53156Palmyra3,232
- 53158Pleasant Prairie18,420
- 53167Rochester157
- 53168Salem Lakes9,036
- 53170Salem Lakes2,134
- 53172South Milwaukee20,442
- 53176Springfield100
- 53177Mount Pleasant8,489
- 53178Sullivan2,497
- 53179Salem Lakes6,469
- 53181Twin Lakes7,964
- 53182Yorkville9,821
- 53183Wales3,111
- 53184Walworth4,169
- 53185Tichigan18,560
- 53186Waukesha city33,374
- 53188Waukesha city34,892
- 53189Waukesha village26,855
- 53190Whitewater20,499
- 53191Williams Bay3,261
- 53192Salem Lakes252
- 53195Fontana-on-Geneva Lake133
- 53202Milwaukee25,861
- 53203Milwaukee2,357
- 53204Milwaukee39,996
- 53205Milwaukee9,265
- 53206Milwaukee19,887
- 53207Milwaukee34,313
- 53208Milwaukee27,201
- 53209Milwaukee45,170
- 53210Milwaukee23,922
- 53211Shorewood34,234
- 53212Milwaukee28,938
- 53213Wauwatosa26,905
- 53214West Allis34,480
- 53215Milwaukee58,146
- 53216Milwaukee30,345
- 53217Glendale29,957
- 53218Milwaukee41,196
- 53219Milwaukee34,764
- 53220Greenfield27,782
- 53221Milwaukee38,044
- 53222Milwaukee24,663
- 53223Milwaukee28,793
- 53224Milwaukee21,223
- 53225Milwaukee25,187
- 53226Wauwatosa18,908
- 53227West Allis22,885
- 53228Greenfield15,121
- 53233Milwaukee14,497
- 53235St. Francis9,004
- 53295Milwaukee90
- 53402Caledonia34,850
- 53403Racine27,009
- 53404Racine13,703
- 53405Racine26,793
- 53406Mount Pleasant25,778
- 53501Hanover165
- 53502Albany2,393
- 53503Arena2,057
- 53504Argyle2,281
- 53505Allens Grove358
- 53506Avoca1,011
- 53507Barneveld2,467
- 53508Belleville5,654
- 53510Belmont1,435
- 53511Beloit48,701
- 53515Black Earth2,647
- 53516Blanchardville2,238
- 53517Blue Mounds1,799
- 53518Blue River1,489
- 53520Brodhead6,687
- 53521Brooklyn3,640
- 53522Browntown943
- 53523Rockdale5,074
- 53525Clinton4,066
- 53526Cobb471
- 53527Cottage Grove11,924
- 53528Cross Plains6,263
- 53529Dane2,611
- 53530Darlington4,569
- 53531Deerfield4,430
- 53532DeForest16,514
- 53533Dodgeville7,283
- 53534Edgerton12,241
- 53536Evansville9,547
- 53537Footville752
- 53538Fort Atkinson18,813
- 53540Gotham112
- 53541Gratiot904
- 53543Highland1,758
- 53544Hollandale826
- 53545Janesville24,703
- 53546Janesville29,867
- 53548Hanover19,916
- 53549Jefferson9,873
- 53550Juda1,220
- 53551Lake Mills9,731
- 53553Linden621
- 53554Livingston1,029
- 53555Lodi8,933
- 53556Gotham2,428
- 53557Lowell446
- 53558McFarland13,164
- 53559Marshall6,110
- 53560Mazomanie3,416
- 53561Merrimac1,872
- 53562Middleton29,790
- 53563Milton11,280
- 53565Mineral Point4,778
- 53566Monroe14,901
- 53569Montfort978
- 53570Monticello2,686
- 53571Windsor367
- 53572Mount Horeb10,385
- 53573Muscoda2,906
- 53574New Glarus4,033
- 53575Oregon18,204
- 53576Orfordville2,131
- 53577Plain1,363
- 53578Prairie du Sac6,503
- 53579Reeseville1,732
- 53580Rewey442
- 53581Richland Center10,176
- 53582Ridgeway1,070
- 53583Sauk City5,816
- 53584Sextonville7
- 53585Sharon2,264
- 53586Shullsburg2,211
- 53587South Wayne1,177
- 53588Spring Green3,770
- 53589Stoughton19,550
- 53590Sun Prairie45,602
- 53593Verona31,081
- 53594Waterloo5,199
- 53597Waunakee21,426
- 53598Windsor4,176
- 53599Woodford75
- 53703Madison37,659
- 53704Madison46,730
- 53705Madison25,017
- 53706Madison3,958
- 53711Fitchburg51,279
- 53713Madison24,351
- 53714Madison16,169
- 53715Madison15,974
- 53716Madison18,596
- 53717Madison13,052
- 53718Madison18,989
- 53719Madison34,115
- 53726Madison5,043
- 53801Bagley998
- 53802Bloomington132
- 53803Benton1,386
- 53804Bloomington1,275
- 53805Boscobel5,554
- 53806Cassville1,514
- 53807Cuba City4,209
- 53808Dickeyville905
- 53809Fennimore4,748
- 53810Glen Haven389
- 53811Hazel Green3,093
- 53812Kieler254
- 53813Lancaster6,222
- 53816Mount Hope856
- 53817Patch Grove227
- 53818Platteville16,024
- 53820Potosi2,467
- 53821Prairie du Chien7,780
- 53825Fennimore358
- 53826Wauzeka1,323
- 53827Woodman429
- 53901Portage14,291
- 53910Easton3,522
- 53911Arlington1,450
- 53913Baraboo21,704
- 53916Beaver Dam22,808
- 53919Brandon2,292
- 53920Briggsville599
- 53922Burnett1,057
- 53923Cambria2,295
- 53924Cazenovia1,346
- 53925Columbus8,754
- 53926Dalton1,951
- 53928Doylestown63
- 53929Elroy2,808
- 53930Endeavor1,192
- 53931Fairwater350
- 53932Fall River2,495
- 53933Fox Lake4,227
- 53934Friendship4,520
- 53935Friesland297
- 53936Grand Marsh1,231
- 53937Lime Ridge1,157
- 53939Kingston251
- 53941La Valle2,817
- 53942Lime Ridge235
- 53943Loganville1,245
- 53944Lyndon Station2,207
- 53946Markesan4,333
- 53947Marquette223
- 53948Mauston8,195
- 53949Montello6,292
- 53950New Lisbon5,942
- 53951North Freedom2,452
- 53952Oxford3,524
- 53953Packwaukee213
- 53954Pardeeville6,678
- 53955Poynette6,125
- 53956Randolph3,477
- 53959Reedsburg14,451
- 53960Rio3,396
- 53961Rock Springs831
- 53962Union Center27
- 53963Waupun13,952
- 53964Westfield3,371
- 53965Wisconsin Dells10,818
- 53968Wonewoc2,429
- 53969Wyocena329
- 54001Amery7,906
- 54002Baldwin6,872
- 54003Ellsworth1,065
- 54004Clayton2,192
- 54005Clear Lake3,264
- 54006Milltown852
- 54007Deer Park1,175
- 54009Dresser2,739
- 54011Ellsworth7,054
- 54013Emerald3,443
- 54014Diamond Bluff2,026
- 54015Hammond4,086
- 54016Hudson33,398
- 54017New Richmond20,366
- 54020Osceola7,687
- 54021Prescott7,346
- 54022River Falls24,789
- 54023Roberts4,620
- 54024Centuria5,035
- 54025Somerset7,612
- 54026Star Prairie2,361
- 54027Wilson1,154
- 54028Woodville2,574
- 54082Houlton2,190
- 54101Abrams2,998
- 54102Amberg763
- 54103Goodman535
- 541041,027
- 54106Black Creek4,990
- 54107Bonduel3,713
- 54110Brillion5,591
- 54111Pulcifer1,951
- 54112Coleman2,716
- 54113Combined Locks3,622
- 54114Crivitz5,926
- 54115De Pere50,411
- 54119Dunbar715
- 54120Long Lake213
- 54121Florence3,257
- 54123Forest Junction204
- 54124Gillett3,414
- 54125Goodman430
- 54126Greenleaf4,233
- 54127Green Valley37
- 54128Gresham2,082
- 54129Hilbert3,222
- 54130Kaukauna28,380
- 54135Keshena3,018
- 54136Kimberly7,019
- 54137Krakow1,087
- 54138Lakewood787
- 54139Lena3,130
- 54140Little Chute8,035
- 54141Sobieski2,861
- 54143Peshtigo15,119
- 54149Mountain1,210
- 54150Neopit1,024
- 54151Niagara3,411
- 54152Nichols253
- 54153Oconto7,551
- 54154Oconto Falls5,741
- 54155Hobart7,418
- 54156Pembine1,502
- 54157Peshtigo5,951
- 54159Crivitz1,381
- 54160Potter221
- 54161Pound2,595
- 54162Pulaski9,596
- 54165Seymour city7,786
- 54166Shawano16,940
- 54169Sherwood3,252
- 54170Nichols3,898
- 54171Sobieski4,024
- 54173Suamico3,403
- 54174Suring3,171
- 54175Townsend1,101
- 54177Wausaukee2,913
- 54180Wrightstown3,378
- 54201Algoma5,209
- 54202Baileys Harbor1,772
- 54204Little Sturgeon2,139
- 54205Casco2,229
- 54207Collins176
- 54208Denmark6,231
- 54209Egg Harbor1,485
- 54210Ellison Bay942
- 54211Ephraim403
- 54212Ephraim980
- 54213Forestville1,395
- 54214Francis Creek436
- 54215Kellnersville186
- 54216Kewaunee6,075
- 54217Luxemburg8,022
- 54220Manitowoc40,949
- 54227Maribel1,621
- 54228Mishicot2,762
- 54229Luxemburg4,329
- 54230Reedsville4,158
- 54232St. Nazianz907
- 54234Sister Bay2,158
- 54235Sturgeon Bay17,749
- 54241Mishicot14,120
- 54245St. Nazianz2,069
- 54246803
- 54247Kellnersville2,558
- 54301Allouez21,724
- 54302Green Bay30,333
- 54303Green Bay28,153
- 54304Ashwaubenon28,502
- 54307Allouez1,128
- 54311Green Bay37,879
- 54313Howard41,422
- 54401Wausau31,692
- 54403Wausau24,950
- 54405Abbotsford2,770
- 54406Amherst4,040
- 54407Nelsonville1,350
- 54408Aniwa1,247
- 54409Antigo12,639
- 54410Arpin2,611
- 54411Athens5,028
- 54412Auburndale2,122
- 54413Babcock219
- 54414Birnamwood3,208
- 54416Bowler1,682
- 54417Maine4
- 544181,084
- 54420Chili1,330
- 54421Colby3,468
- 54422Curtiss1,553
- 54423Polonia2,394
- 54424Summit Lake1,565
- 54425Dorchester1,988
- 54426Edgar4,275
- 54427Elderon1,156
- 54428Elcho975
- 54430White Lake92
- 54433Gilman1,858
- 544352,122
- 54436Granton2,203
- 54437Greenwood3,236
- 54440Hatley2,662
- 54441Hewitt791
- 54442Tomahawk1,527
- 54443Junction City2,145
- 54446Loyal3,500
- 54447Lublin546
- 54448Marathon City4,280
- 54449Marshfield26,183
- 54450Mattoon457
- 54451Whittlesey11,198
- 54452Merrill18,969
- 54454Milladore1,215
- 54455Mosinee19,025
- 54456Neillsville5,890
- 54457Lake Arrowhead8,183
- 54458Nelsonville133
- 54459Ogema1,377
- 54460Owen2,620
- 54462Post Lake416
- 54463Elcho746
- 54464Mattoon70
- 54465Mole Lake731
- 544662,557
- 54467Plover14,870
- 54469Port Edwards1,820
- 54470Rib Lake1,953
- 54471Hatley1,636
- 54473Rosholt2,472
- 54474Rothschild4,589
- 54475Rudolph1,447
- 54476Weston19,377
- 54479Spencer3,630
- 54480Stetsonville1,386
- 54481Stevens Point28,242
- 54482Stevens Point8,963
- 54484Stratford5,529
- 54485Summit Lake395
- 54486Tigerton2,171
- 54487Tomahawk9,562
- 54488Unity1,275
- 54489Vesper1,336
- 54490Chelsea1,085
- 54491White Lake1,607
- 54493631
- 54494Lake Wazeecha27,696
- 54495Port Edwards7,859
- 54498Lublin2,362
- 54499Wittenberg2,896
- 54501Rhinelander21,405
- 54511Newald1,393
- 54512Boulder Junction1,461
- 54513Prentice431
- 54514Butternut1,827
- 54515Catawba639
- 54517Clam Lake167
- 54519Eagle River1,309
- 54520Crandon3,764
- 54521Eagle River8,551
- 54524Park Falls663
- 54525Montreal318
- 54526Ingram644
- 54527Glidden932
- 545291,220
- 54530Hawkins758
- 545311,385
- 54534Pence2,393
- 54536Iron Belt154
- 54537Kennan601
- 54538Lac du Flambeau3,025
- 54539Lake Tomahawk1,356
- 54540971
- 54541Laona1,561
- 54542Long Lake702
- 54545Mercer947
- 54546Mellen1,332
- 54547Mercer1,549
- 54548Minocqua5,676
- 54550Pence768
- 54552Park Falls4,292
- 545541,148
- 54555Phillips4,728
- 54556Prentice1,161
- 54557Boulder Junction1,042
- 54558Sayner2,262
- 54559Birch Hill837
- 54560Sayner561
- 54561Sayner55
- 54562Three Lakes2,038
- 54563Tony811
- 54564393
- 5456538
- 54566Wabeno1,453
- 54568Woodruff4,854
- 54601La Crosse50,397
- 54603La Crosse13,738
- 54610Alma1,564
- 54611Alma Center1,372
- 54612Arcadia5,915
- 54613Arkdale2,174
- 54614Rockland2,776
- 54615Black River Falls11,315
- 54616Blair2,443
- 54618Camp Douglas2,333
- 54619Cashton3,849
- 54621Chaseburg1,319
- 54622Waumandee2,147
- 54623Coon Valley1,928
- 54624De Soto1,554
- 54625Dodge317
- 54626Lynxville1,423
- 54627Ettrick2,020
- 54628Ferryville912
- 54629Fountain City2,595
- 54630Galesville4,261
- 54631Bell Center1,737
- 54632Genoa1,288
- 54634Yuba4,484
- 54635Hixton1,793
- 54636Holmen16,727
- 54637Hustler131
- 54638Kendall1,513
- 54639La Farge2,435
- 54642Melrose2,259
- 54643Millston2
- 54644Mindoro1,236
- 54645Mount Sterling97
- 54646Necedah3,770
- 54648Norwalk1,608
- 54650Onalaska25,304
- 54651Ontario1,384
- 54652Readstown947
- 54653Rockland1,335
- 54654Seneca168
- 54655Soldiers Grove1,798
- 54656Sparta18,160
- 54657Steuben357
- 54658Stoddard2,326
- 54659Taylor1,257
- 54660Tomah16,124
- 54661Trempealeau3,806
- 54664Viola1,571
- 54665Viroqua8,863
- 54666Warrens2,635
- 54667Westby5,100
- 54669West Salem8,228
- 54670Wilton2,048
- 54701Eau Claire43,014
- 54703Eau Claire44,153
- 54720Altoona8,947
- 54721Arkansaw1,367
- 54722Augusta4,277
- 54723Bay City973
- 54724Bloomer7,517
- 54725Boyceville2,844
- 54726Boyd1,866
- 54727Cadott4,806
- 54728Chetek5,835
- 54729Chippewa Falls34,366
- 54730Colfax5,578
- 54731Conrath672
- 54732Cornell2,843
- 54733Dallas1,333
- 54734Downing772
- 54736Durand4,169
- 54737Downsville562
- 54738Eleva3,784
- 54739Elk Mound5,549
- 54740Elmwood1,760
- 54741Fairchild1,664
- 54742Fall Creek4,255
- 54745Holcombe2,282
- 54746Humbird693
- 54747Independence2,690
- 54748Jim Falls1,422
- 54749Knapp1,410
- 54750Plum City1,047
- 54751Menomonie26,193
- 54754Hatfield1,308
- 54755Mondovi7,389
- 54756Nelson946
- 54757New Auburn3,584
- 54758Osseo4,577
- 54759Pepin1,392
- 54760Pigeon Falls190
- 54761Plum City1,149
- 54762Prairie Farm1,232
- 54763Ridgeland1,120
- 54766Jump River1,668
- 54767Spring Valley3,352
- 54768Stanley6,557
- 54769Stockholm515
- 54770Strum2,033
- 54771Thorp4,171
- 54772Wheeler1,164
- 54773Whitehall3,542
- 54801Spooner6,266
- 54805Almena1,520
- 54806Ashland11,704
- 54810Balsam Lake2,849
- 54812Barron6,069
- 54813Barronett678
- 54814Bayfield2,762
- 54817Birchwood2,264
- 54819Bruce2,612
- 54820Brule707
- 54821Cable1,625
- 54822Cameron4,670
- 54824Centuria1,950
- 54826Turtle Lake village922
- 54827Cornucopia300
- 54828Reserve546
- 54829Cumberland5,446
- 548303,526
- 54832Drummond453
- 54835Exeland933
- 54836931
- 54837Lewis3,803
- 54838Gordon1,404
- 54839Grand View342
- 54840Grantsburg4,775
- 54841Haugen284
- 54842Poplar267
- 54843Little Round Lake13,416
- 54844Herbster243
- 54845103
- 54846Jolmaville650
- 54847Iron River2,607
- 54848Ladysmith5,832
- 54849Lake Nebagamon1,857
- 54850321
- 54853Luck3,506
- 54854Poplar960
- 54855Marengo924
- 54856Mason1,628
- 54857Birchwood34
- 54858Milltown1,636
- 54859Minong2,242
- 54861New Odanah122
- 54862Winter307
- 54864Poplar1,590
- 54865Port Wing517
- 54867Radisson517
- 54868Rice Lake16,323
- 54870Shell Lake1,698
- 54871Shell Lake3,270
- 54872Siren2,569
- 54873Solon Springs3,056
- 54874Poplar3,690
- 54875Springbrook1,335
- 54876Stone Lake1,712
- 54880Superior village30,312
- 54888Trego1,381
- 54889Turtle Lake village2,837
- 54891Washburn3,297
- 54893Webster4,207
- 54895Weyerhaeuser799
- 54896Winter1,635
- 54901Oshkosh37,294
- 54902Van Dyne22,243
- 54904Oshkosh22,273
- 54909Almond1,982
- 54911Appleton25,308
- 54913Appleton25,147
- 54914Greenville31,849
- 54915Appleton44,367
- 54921Bancroft1,482
- 54922Bear Creek1,101
- 54923Berlin8,793
- 54926Big Falls125
- 54927Butte des Morts540
- 54928Leopolis524
- 54929Clintonville8,776
- 54930Coloma1,840
- 54931Dale364
- 54932Rosendale1,218
- 54933Embarrass106
- 54935Fond du Lac41,613
- 54937Eden21,687
- 54940Fremont4,533
- 54941Green Lake2,563
- 54942Greenville11,020
- 54943Hancock2,250
- 54944Hortonville9,312
- 54945Iola3,470
- 54946King401
- 54947Winchester2,323
- 54948Leopolis225
- 54949Manawa3,565
- 54950Marion2,802
- 54952Harrison27,312
- 54956Neenah46,567
- 54960Neshkoro2,997
- 54961New London14,485
- 54962Ogdensburg1,025
- 54963Omro7,271
- 54964Waukau974
- 54965Pine River1,212
- 54966Plainfield2,202
- 54967Poy Sippi497
- 54968Princeton2,762
- 54970Redgranite3,845
- 54971Ripon10,907
- 54974Rosendale1,415
- 54977Scandinavia1,592
- 54978Tilleda74
- 54979Van Dyne2,037
- 54980Waukau218
- 54981King14,870
- 54982Wautoma6,958
- 54983Weyauwega4,144
- 54984Wild Rose3,394
- 54985Oshkosh249
- 54986Winneconne5,394
Towns and townships
Each of the 1,240 with people in it, from ACS 2020–2024 5-year estimates: the county subdivisions that are governments of their own. A city, borough or village that is one too is listed with the places above.
- Abrams town2,070
- Ackley town459
- Adams town (Adams County)1,347
- Adams town (Green County)566
- Adams town (Jackson County)1,641
- Addison town3,435
- Adrian town816
- Agenda town492
- Ahnapee town841
- Ainsworth town597
- Akan town372
- Alban town876
- Albany town (Green County)1,055
- Albany town (Pepin County)855
- Albion town (Dane County)1,986
- Albion town (Jackson County)1,093
- Albion town (Trempealeau County)710
- Alden town2,992
- Algoma town6,850
- Alma town (Buffalo County)291
- Alma town (Jackson County)863
- Almena town753
- Almon town590
- Almond town471
- Alto town1,064
- Alvin town238
- Amberg town675
- Amherst town1,564
- Amnicon town1,202
- Anderson town (Burnett County)409
- Anderson town (Iron County)38
- Angelica town1,639
- Angelo town1,669
- Aniwa town483
- Anson town2,505
- Antigo town1,384
- Apple River town1,194
- Arbor Vitae town3,505
- Arcadia town1,662
- Arena town1,504
- Argonne town471
- Argyle town419
- Arland town722
- Arlington town807
- Armenia town697
- Armstrong Creek town518
- Arpin town970
- Arthur town962
- Ashford town1,744
- Ashippun town2,667
- Ashland town654
- Athelstane town475
- Atlanta town571
- Auburn town (Chippewa County)795
- Auburn town (Fond du Lac County)2,292
- Auburndale town797
- Aurora town (Florence County)859
- Aurora town (Taylor County)432
- Aurora town (Waushara County)960
- Avon town634
- Aztalan town1,155
- Bagley town348
- Baileys Harbor town1,409
- Baldwin town1,216
- Balsam Lake town1,509
- Bangor town527
- Baraboo town1,607
- Barksdale town881
- Barnes town854
- Barre town1,363
- Barron town891
- Barronett town480
- Bartelme town808
- Barton town2,766
- Bashaw town1,048
- Bass Lake town (Sawyer County)2,839
- Bass Lake town (Washburn County)677
- Bayfield town709
- Bayview town615
- Bear Bluff town170
- Bear Creek town (Sauk County)631
- Bear Creek town (Waupaca County)682
- Bear Lake town789
- Beaver Brook town708
- Beaver Dam town4,041
- Beaver town (Clark County)963
- Beaver town (Marinette County)901
- Beaver town (Polk County)968
- Beecher town704
- Beetown town792
- Belgium town1,537
- Bell town345
- Belle Plaine town1,936
- Belmont town (Lafayette County)995
- Belmont town (Portage County)626
- Beloit town7,799
- Belvidere town425
- Bennett town622
- Benton town445
- Bergen town (Marathon County)784
- Bergen town (Vernon County)1,348
- Berlin town (Green Lake County)1,281
- Berlin town (Marathon County)918
- Bern town603
- Berry town1,122
- Bevent town978
- Big Bend town478
- Big Falls town124
- Big Flats town1,279
- Birch Creek town503
- Birch town684
- Birchwood town660
- Birnamwood town782
- Black Brook town1,777
- Black Creek town1,324
- Black Earth town428
- Black Wolf town2,371
- Blackwell town260
- Blaine town221
- Blanchard town330
- Bloom town514
- Bloomer town1,246
- Bloomfield town (Walworth County)2,325
- Bloomfield town (Waushara County)993
- Blooming Grove town1,508
- Bloomington town308
- Blue Mounds town931
- Bone Lake town704
- Boscobel town510
- Boulder Junction town1,483
- Bovina town1,116
- Bradford town897
- Bradley town2,029
- Brazeau town1,207
- Breed town706
- Bridge Creek town2,388
- Bridgeport town947
- Brigham town1,153
- Brighton town (Kenosha County)1,381
- Brighton town (Marathon County)677
- Brillion town1,631
- Bristol town4,374
- Brockway town2,977
- Brookfield town6,459
- Brooklyn town (Green County)1,223
- Brooklyn town (Green Lake County)1,650
- Brooklyn town (Washburn County)341
- Brothertown town1,310
- Browning town873
- Brule town545
- Brunswick town1,848
- Brussels town1,112
- Buchanan town6,784
- Buena Vista town (Portage County)1,154
- Buena Vista town (Richland County)1,583
- Buffalo town (Buffalo County)725
- Buffalo town (Marquette County)1,228
- Burke town3,181
- Burlington town6,420
- Burnett town799
- Burns town768
- Burnside town456
- Butler town118
- Byron town (Fond du Lac County)1,759
- Byron town (Monroe County)1,208
- Cable town859
- Cadiz town653
- Cady town848
- Calamus town902
- Caledonia town (Columbia County)1,408
- Caledonia town (Trempealeau County)912
- Caledonia town (Waupaca County)1,638
- Calumet town1,261
- Cameron town512
- Campbell town4,188
- Canton town241
- Carey town291
- Carlton town984
- Carson town1,197
- Cary town347
- Casco town1,102
- Casey town365
- Cassel town1,020
- Cassian town1,043
- Cassville town402
- Castle Rock town353
- Caswell town89
- Catawba town349
- Cato town1,512
- Cedar Lake town904
- Cedar Rapids town15
- Cedarburg town6,195
- Center town (Outagamie County)3,643
- Center town (Rock County)1,088
- Centerville town431
- Charlestown town798
- Chase town3,282
- Chelsea town634
- Chester town855
- Chetek town1,670
- Chicog town302
- Chilton town1,058
- Chimney Rock town216
- Chippewa town366
- Christiana town (Dane County)1,012
- Christiana town (Vernon County)1,022
- Cicero town1,144
- City Point town251
- Clam Falls town543
- Clarno town1,147
- Clay Banks town421
- Clayton town (Crawford County)1,088
- Clayton town (Polk County)1,012
- Clayton town (Winnebago County)4,466
- Clear Creek town880
- Clear Lake town1,010
- Clearfield town741
- Cleveland town (Chippewa County)943
- Cleveland town (Jackson County)427
- Cleveland town (Marathon County)1,595
- Cleveland town (Taylor County)247
- Clifton town (Grant County)456
- Clifton town (Monroe County)775
- Clifton town (Pierce County)2,531
- Clinton town (Barron County)1,009
- Clinton town (Rock County)1,041
- Clinton town (Vernon County)1,126
- Clover town183
- Cloverland town (Douglas County)199
- Cloverland town (Vilas County)1,179
- Clyde town379
- Clyman town725
- Colburn town (Adams County)335
- Colburn town (Chippewa County)1,041
- Colby town816
- Cold Spring town1,019
- Colfax town1,238
- Coloma town659
- Columbus town556
- Commonwealth town512
- Concord town1,744
- Conover town1,294
- Cooks Valley town839
- Coon town701
- Cooperstown town1,167
- Corning town976
- Cottage Grove town3,729
- Couderay town278
- Courtland town558
- Crandon town589
- Cranmoor town208
- Crescent town2,210
- Cross Plains town1,648
- Cross town437
- Crystal Lake town (Barron County)858
- Crystal Lake town (Marquette County)451
- Crystal town277
- Cumberland town830
- Curran town460
- Cutler town386
- Cylon town690
- Dairyland town245
- Dakota town1,258
- Dale town2,891
- Dallas town638
- Dane town1,567
- Daniels town662
- Darien town1,962
- Darlington town890
- Day town1,221
- Dayton town (Richland County)648
- Dayton town (Waupaca County)2,627
- Decatur town1,839
- Deer Creek town (Outagamie County)580
- Deer Creek town (Taylor County)747
- Deerfield town (Dane County)1,770
- Deerfield town (Waushara County)698
- Dekorra town2,467
- Delafield town8,079
- Delavan town5,216
- Dell Prairie town1,579
- Dellona town1,664
- Delmar town1,105
- Delta town265
- Delton town2,684
- Dewey town (Burnett County)535
- Dewey town (Portage County)1,157
- Dewey town (Rusk County)482
- Dewhurst town224
- Dexter town327
- Diamond Bluff town451
- Dodge town503
- Dodgeville town1,491
- Doty town298
- Douglas town647
- Dover town (Buffalo County)479
- Dover town (Racine County)4,232
- Dovre town865
- Doyle town712
- Drammen town681
- Draper town230
- Drummond town560
- Dunbar town712
- Dunkirk town1,505
- Dunn town (Dane County)4,784
- Dunn town (Dunn County)1,624
- Dupont town679
- Durand town781
- Eagle Point town3,252
- Eagle town (Richland County)582
- Eagle town (Waukesha County)3,507
- East Troy town4,000
- Eastman town616
- Easton town (Adams County)967
- Easton town (Marathon County)1,246
- Eaton town (Brown County)1,672
- Eaton town (Clark County)607
- Eaton town (Manitowoc County)667
- Eau Galle town (Dunn County)785
- Eau Galle town (St. Croix County)1,243
- Eau Pleine town (Marathon County)1,088
- Eau Pleine town (Portage County)1,054
- Eden town (Fond du Lac County)1,109
- Eden town (Iowa County)304
- Edgewater town442
- Edson town1,052
- Egg Harbor town1,548
- Eileen town811
- Eisenstein town563
- El Paso town685
- Elba town1,119
- Elcho town1,176
- Elderon town682
- Eldorado town1,436
- Elk Grove town594
- Elk Mound town1,825
- Elk town949
- Ellenboro town604
- Ellington town3,226
- Ellsworth town1,399
- Emerald town797
- Emery town299
- Emmet town (Dodge County)1,202
- Emmet town (Marathon County)1,023
- Empire town2,751
- Enterprise town404
- Erin Prairie town718
- Erin town3,818
- Estella town528
- Ettrick town1,300
- Eureka town1,535
- Evergreen town (Langlade County)420
- Evergreen town (Washburn County)1,233
- Excelsior town1,650
- Exeter town2,312
- Fairbanks town438
- Fairchild town500
- Fairfield town1,164
- Farmington town (Jefferson County)1,309
- Farmington town (La Crosse County)1,902
- Farmington town (Polk County)1,929
- Farmington town (Washington County)3,579
- Farmington town (Waupaca County)3,658
- Fayette town366
- Fence town259
- Fennimore town815
- Fern town212
- Fifield town950
- Finley town108
- Flambeau town (Price County)474
- Flambeau town (Rusk County)1,136
- Florence town1,822
- Fond du Lac town3,713
- Ford town410
- Forest town (Fond du Lac County)1,295
- Forest town (Richland County)359
- Forest town (St. Croix County)638
- Forest town (Vernon County)733
- Forestville town974
- Fort Winnebago town798
- Foster town138
- Fountain Prairie town875
- Fountain town438
- Fox Lake town2,487
- Frankfort town (Marathon County)537
- Frankfort town (Pepin County)345
- Franklin town (Jackson County)527
- Franklin town (Kewaunee County)843
- Franklin town (Manitowoc County)1,072
- Franklin town (Sauk County)694
- Franklin town (Vernon County)1,011
- Franzen town514
- Fredonia town1,931
- Freedom town (Forest County)462
- Freedom town (Outagamie County)6,223
- Freedom town (Sauk County)617
- Freeman town596
- Fremont town (Clark County)1,330
- Fremont town (Waupaca County)908
- Friendship town2,763
- Frog Creek town81
- Fulton town3,636
- Gale town1,822
- Garden Valley town398
- Gardner town1,318
- Garfield town (Jackson County)704
- Garfield town (Polk County)1,707
- Genesee town7,193
- Geneva town5,440
- Genoa town812
- Georgetown town (Polk County)1,239
- Georgetown town (Price County)219
- Germania town291
- Germantown town (Juneau County)1,950
- Germantown town (Washington County)246
- Gibraltar town1,008
- Gibson town1,236
- Gillett town907
- Gilman town1,178
- Gilmanton town355
- Gingles town594
- Glen Haven town411
- Glencoe town448
- Glendale town655
- Glenmore town1,034
- Glenwood town805
- Goetz town703
- Goodman town515
- Goodrich town524
- Gordon town (Ashland County)403
- Gordon town (Douglas County)784
- Grafton town4,375
- Grand Chute town24,168
- Grand Rapids town7,598
- Grand View town584
- Grant town (Clark County)735
- Grant town (Dunn County)394
- Grant town (Monroe County)487
- Grant town (Portage County)1,883
- Grant town (Rusk County)692
- Grant town (Shawano County)1,058
- Grantsburg town1,090
- Gratiot town473
- Green Bay town2,019
- Green Grove town826
- Green Lake town1,312
- Green Valley town (Marathon County)525
- Green Valley town (Shawano County)852
- Greenbush town2,268
- Greenfield town (La Crosse County)2,169
- Greenfield town (Monroe County)629
- Greenfield town (Sauk County)961
- Greenwood town (Taylor County)617
- Greenwood town (Vernon County)925
- Grover town (Marinette County)1,865
- Grover town (Taylor County)230
- Grow town540
- Guenther town342
- Gull Lake town233
- Gurney town186
- Hackett town239
- Hale town970
- Hallie town169
- Halsey town626
- Hamburg town (Marathon County)828
- Hamburg town (Vernon County)1,114
- Hamilton town2,668
- Hammel town659
- Hammond town2,604
- Hampden town733
- Hancock town665
- Haney town291
- Hansen town801
- Harding town301
- Harmony town (Price County)188
- Harmony town (Rock County)2,550
- Harmony town (Vernon County)920
- Harris town723
- Harrison town (Grant County)541
- Harrison town (Lincoln County)872
- Harrison town (Marathon County)391
- Harrison town (Waupaca County)436
- Hartford town3,355
- Hartland town (Pierce County)818
- Hartland town (Shawano County)811
- Hawkins town104
- Hawthorne town1,170
- Hay River town642
- Hayward town3,854
- Hazel Green town950
- Hazelhurst town1,246
- Hebron town1,153
- Helvetia town668
- Hendren town400
- Henrietta town585
- Herman town (Dodge County)1,035
- Herman town (Shawano County)913
- Herman town (Sheboygan County)2,086
- Hewett town308
- Hewitt town511
- Hickory Grove town649
- Highland town (Douglas County)454
- Highland town (Iowa County)837
- Hiles town (Forest County)440
- Hiles town (Wood County)160
- Hill town414
- Hillsboro town784
- Hixon town876
- Hixton town580
- Hoard town632
- Holland town (Brown County)1,518
- Holland town (La Crosse County)4,528
- Holland town (Sheboygan County)2,010
- Holton town883
- Holway town928
- Homestead town527
- Honey Creek town730
- Hortonia town1,066
- How town702
- Howard town936
- Hubbard town (Dodge County)1,821
- Hubbard town (Rusk County)158
- Hudson town8,757
- Hughes town555
- Hull town (Marathon County)832
- Hull town (Portage County)5,255
- Humboldt town1,493
- Hunter town902
- Hustisford town1,566
- Hutchins town557
- Iola town962
- Iron River town1,294
- Ironton town623
- Irving town936
- Isabelle town234
- Ithaca town645
- Ixonia town5,078
- Jackson town (Adams County)938
- Jackson town (Burnett County)1,047
- Jackson town (Washington County)3,966
- Jacksonport town979
- Jacobs town423
- Jamestown town1,965
- Janesville town3,678
- Jefferson town (Green County)1,085
- Jefferson town (Jefferson County)1,916
- Jefferson town (Monroe County)790
- Jefferson town (Vernon County)1,353
- Johnson town878
- Johnstown town (Polk County)623
- Johnstown town (Rock County)638
- Jordan town539
- Jump River town290
- Kaukauna town1,574
- Kelly town584
- Kendall town489
- Kennan town394
- Kewaskum town997
- Keystone town360
- Kickapoo town687
- Kildare town689
- Kimball town580
- King town842
- Kingston town (Green Lake County)1,104
- Kingston town (Juneau County)46
- Kinnickinnic town1,603
- Knapp town333
- Knight town161
- Knowlton town1,584
- Knox town265
- Komensky town530
- Koshkonong town3,748
- Kossuth town2,151
- La Follette town657
- La Grange town (Monroe County)1,922
- La Grange town (Walworth County)2,565
- La Pointe town321
- La Prairie town839
- La Valle town1,367
- Lac du Flambeau town3,644
- Lafayette town (Chippewa County)6,346
- Lafayette town (Monroe County)379
- Lafayette town (Walworth County)1,843
- Lake Holcombe town1,125
- Lake Mills town2,317
- Lake Tomahawk town1,135
- Lake town (Marinette County)1,104
- Lake town (Price County)1,040
- Lakeland town857
- Lakeside town720
- Laketown town1,024
- Lakewood town787
- Lamartine town1,681
- Lamont town313
- Lanark town1,760
- Land O'Lakes town856
- Langlade town533
- Laona town1,320
- Larrabee town1,304
- Lawrence town (Brown County)6,637
- Lawrence town (Rusk County)254
- Lebanon town (Dodge County)1,474
- Lebanon town (Waupaca County)1,518
- Ledgeview town9,248
- Leeds town870
- Lemonweir town1,728
- Lena town662
- Lenroot town1,436
- Leola town275
- Leon town (Monroe County)1,142
- Leon town (Waushara County)1,540
- Leroy town1,046
- Lessor town1,171
- Levis town440
- Lewiston town1,570
- Liberty Grove town2,195
- Liberty town (Grant County)507
- Liberty town (Manitowoc County)1,355
- Liberty town (Outagamie County)921
- Liberty town (Vernon County)326
- Lima town (Grant County)876
- Lima town (Pepin County)761
- Lima town (Rock County)1,338
- Lima town (Sheboygan County)2,939
- Lincoln town (Adams County)327
- Lincoln town (Bayfield County)261
- Lincoln town (Buffalo County)173
- Lincoln town (Burnett County)381
- Lincoln town (Eau Claire County)1,177
- Lincoln town (Forest County)1,286
- Lincoln town (Kewaunee County)828
- Lincoln town (Monroe County)955
- Lincoln town (Polk County)2,029
- Lincoln town (Trempealeau County)707
- Lincoln town (Vilas County)2,738
- Lincoln town (Wood County)1,721
- Lind town1,515
- Linden town890
- Lindina town684
- Linn town2,710
- Linwood town1,107
- Lisbon town833
- Little Black town981
- Little Falls town1,653
- Little Grant town253
- Little Rice town338
- Little River town1,069
- Little Suamico town5,687
- Little Wolf town1,537
- Lodi town3,289
- Lomira town1,021
- Long Lake town (Florence County)170
- Long Lake town (Washburn County)668
- Longwood town971
- Lorain town279
- Lowell town1,075
- Lowville town1,042
- Loyal town705
- Lucas town693
- Luck town818
- Ludington town925
- Luxemburg town1,572
- Lyndon town (Juneau County)1,009
- Lyndon town (Sheboygan County)1,551
- Lynn town987
- Lynne town115
- Lyons town3,640
- Mackford town451
- Madge town607
- Magnolia town864
- Maiden Rock town438
- Maine town740
- Manchester town (Green Lake County)1,176
- Manchester town (Jackson County)792
- Manitowish Waters town768
- Manitowoc Rapids town1,953
- Manitowoc town1,263
- Maple Creek town494
- Maple Grove town (Barron County)1,000
- Maple Grove town (Manitowoc County)745
- Maple Grove town (Shawano County)869
- Maple Plain town779
- Maple town678
- Maple Valley town542
- Maplehurst town303
- Marathon town1,107
- Marcellon town760
- Marengo town577
- Marietta town488
- Marion town (Grant County)580
- Marion town (Juneau County)541
- Marion town (Waushara County)1,983
- Marquette town600
- Marshall town (Richland County)519
- Marshall town (Rusk County)586
- Marshfield town (Fond du Lac County)1,055
- Marshfield town (Wood County)725
- Martell town1,064
- Mason town322
- Matteson town895
- Maxville town403
- Mayville town1,152
- Mazomanie town927
- McKinley town (Polk County)397
- McKinley town (Taylor County)442
- McMillan town2,117
- Mead town317
- Meadowbrook town166
- Mecan town699
- Medary town1,514
- Medford town2,503
- Medina town1,256
- Meeme town1,495
- Meenon town1,119
- Melrose town552
- Menomonie town3,422
- Mentor town597
- Mercer town1,485
- Merrill town2,873
- Merrimac town1,075
- Merton town8,278
- Meteor town93
- Metomen town599
- Middle Inlet town926
- Middleton town6,807
- Mifflin town432
- Milford town1,164
- Milladore town625
- Millston town147
- Milltown town1,360
- Millville town121
- Milton town (Buffalo County)450
- Milton town (Rock County)3,103
- Mineral Point town906
- Minocqua town5,074
- Minong town1,086
- Mishicot town1,429
- Mitchell town1,667
- Modena town343
- Molitor town284
- Mondovi town457
- Monico town336
- Monroe town (Adams County)418
- Monroe town (Green County)1,462
- Montana town262
- Montello town1,376
- Monticello town124
- Montpelier town1,509
- Montrose town1,046
- Morgan town1,087
- Morris town459
- Morrison town1,798
- Morse town608
- Moscow town617
- Mosel town673
- Mosinee town2,536
- Moundville town546
- Mount Hope town280
- Mount Ida town682
- Mount Morris town1,099
- Mount Pleasant town468
- Mountain town923
- Mukwa town2,799
- Mukwonago town7,792
- Murry town206
- Muscoda town744
- Namakagon town420
- Naples town606
- Nasewaupee town1,676
- Nashville town1,229
- Navarino town384
- Necedah town1,966
- Neenah town3,660
- Nekimi town1,067
- Nelson town470
- Nepeuskun town645
- Neshkoro town726
- Neva town834
- New Chester town1,394
- New Denmark town1,479
- New Diggings town435
- New Glarus town1,456
- New Haven town (Adams County)851
- New Haven town (Dunn County)634
- New Holstein town1,812
- New Hope town664
- New Lyme town158
- Newark town1,377
- Newbold town2,866
- Newport town597
- Newton town (Manitowoc County)2,309
- Newton town (Marquette County)452
- Niagara town1,079
- Nokomis town1,511
- Norrie town1,047
- North Bend town377
- North Lancaster town571
- Northfield town587
- Norway town7,863
- Norwood town882
- Oak Grove town (Barron County)964
- Oak Grove town (Dodge County)1,035
- Oak Grove town (Pierce County)2,452
- Oakdale town663
- Oakfield town675
- Oakland town (Burnett County)998
- Oakland town (Douglas County)1,198
- Oakland town (Jefferson County)3,222
- Oasis town369
- Oconomowoc town8,832
- Oconto Falls town1,634
- Oconto town1,574
- Ogema town890
- Ojibwa town249
- Oma town309
- Omro town2,238
- Onalaska town5,798
- Oneida town4,560
- Orange town562
- Oregon town3,040
- Orienta town225
- Orion town424
- Osborn town1,139
- Osceola town (Fond du Lac County)1,820
- Osceola town (Polk County)3,087
- Oshkosh town2,425
- Otsego town755
- Ottawa town3,644
- Otter Creek town (Dunn County)522
- Otter Creek town (Eau Claire County)394
- Oulu town477
- Oxford town968
- Pacific town2,781
- Packwaukee town1,560
- Palmyra town1,146
- Paris town (Grant County)672
- Paris town (Kenosha County)1,438
- Parkland town1,464
- Parrish town80
- Patch Grove town541
- Peck town333
- Peeksville town160
- Pelican town2,844
- Pella town749
- Pembine town869
- Pence town184
- Pensaukee town1,417
- Pepin town685
- Perry town676
- Pershing town188
- Peru town321
- Peshtigo town4,027
- Phelps town1,364
- Piehl town76
- Pierce town905
- Pigeon town1,178
- Pilsen town235
- Pine Grove town1,086
- Pine Lake town2,739
- Pine River town1,734
- Pine Valley town1,296
- Pittsfield town2,772
- Plainfield town584
- Platteville town1,769
- Pleasant Springs town3,033
- Pleasant Valley town (Eau Claire County)3,839
- Pleasant Valley town (St. Croix County)561
- Plover town (Marathon County)699
- Plover town (Portage County)1,299
- Plum Lake town458
- Plymouth town (Juneau County)547
- Plymouth town (Rock County)907
- Plymouth town (Sheboygan County)3,052
- Polar town1,001
- Polk town3,970
- Popple River town32
- Port Edwards town1,331
- Port Washington town1,591
- Port Wing town345
- Porter town961
- Porterfield town1,798
- Portland town (Dodge County)806
- Portland town (Monroe County)846
- Potosi town686
- Pound town1,722
- Poy Sippi town965
- Poygan town1,495
- Prairie du Chien town953
- Prairie du Sac town992
- Prairie Farm town483
- Prairie Lake town1,520
- Prentice town432
- Presque Isle town611
- Preston town (Adams County)1,375
- Preston town (Trempealeau County)868
- Price town367
- Primrose town575
- Princeton town1,477
- Pulaski town374
- Quincy town1,209
- Radisson town535
- Randall town3,256
- Randolph town1,005
- Rantoul town680
- Red Cedar town2,042
- Red River town1,448
- Red Springs town881
- Reedsburg town1,259
- Reid town1,059
- Remington town278
- Reseburg town806
- Rhine town1,970
- Rib Falls town959
- Rib Lake town739
- Rice Lake town2,823
- Richfield town (Adams County)158
- Richfield town (Wood County)1,618
- Richford town1,000
- Richland town (Richland County)1,341
- Richland town (Rusk County)169
- Richmond town (Shawano County)1,781
- Richmond town (St. Croix County)4,201
- Richmond town (Walworth County)1,680
- Richwood town617
- Ridgeville town406
- Ridgeway town508
- Rietbrock town820
- Ringle town1,446
- Ripon town1,370
- River Falls town2,631
- Riverview town776
- Rock Creek town1,012
- Rock Elm town411
- Rock Falls town884
- Rock town (Rock County)2,986
- Rock town (Wood County)703
- Rockbridge town760
- Rockland town (Brown County)1,787
- Rockland town (Manitowoc County)1,180
- Rolling town1,362
- Rome town3,184
- Roosevelt town (Burnett County)281
- Roosevelt town (Taylor County)460
- Rose town583
- Rosendale town696
- Ross town133
- Round Lake town1,160
- Roxbury town1,808
- Royalton town1,391
- Rubicon town1,965
- Ruby town499
- Rudolph town974
- Rush River town523
- Rushford town1,442
- Rusk town (Burnett County)504
- Rusk town (Rusk County)556
- Russell town (Bayfield County)1,413
- Russell town (Lincoln County)788
- Russell town (Sheboygan County)410
- Rutland town1,669
- Salem town563
- Sampson town886
- Sanborn town1,146
- Sand Creek town651
- Sand Lake town (Burnett County)654
- Sand Lake town (Sawyer County)1,077
- Saratoga town5,071
- Sarona town424
- Saukville town1,693
- Saxeville town884
- Saxon town332
- Scandinavia town1,247
- Schleswig town1,817
- Schley town836
- Schoepke town353
- Scott town (Brown County)3,640
- Scott town (Burnett County)655
- Scott town (Columbia County)906
- Scott town (Crawford County)535
- Scott town (Lincoln County)1,454
- Scott town (Monroe County)51
- Scott town (Sheboygan County)1,729
- Seif town220
- Seneca town (Crawford County)1,075
- Seneca town (Green Lake County)367
- Seneca town (Shawano County)561
- Seneca town (Wood County)881
- Sevastopol town2,836
- Seven Mile Creek town387
- Seymour town (Eau Claire County)3,300
- Seymour town (Lafayette County)391
- Seymour town (Outagamie County)1,041
- Shanagolden town143
- Sharon town (Portage County)2,023
- Sharon town (Walworth County)942
- Sheboygan Falls town1,859
- Sheboygan town8,281
- Shelby town4,724
- Sheldon town659
- Sheridan town450
- Sherman town (Clark County)933
- Sherman town (Dunn County)858
- Sherman town (Iron County)381
- Sherman town (Sheboygan County)1,470
- Sherry town674
- Sherwood town238
- Shields town (Dodge County)547
- Shields town (Marquette County)733
- Shullsburg town349
- Sigel town (Chippewa County)1,024
- Sigel town (Wood County)1,059
- Silver Cliff town528
- Sioux Creek town678
- Siren town1,091
- Skanawan town364
- Smelser town743
- Solon Springs town979
- Somers town929
- Somerset town4,405
- Somo town168
- South Fork town142
- South Lancaster town808
- Sparta town3,225
- Spencer town1,679
- Spider Lake town538
- Spirit town319
- Spooner town722
- Spring Brook town1,760
- Spring Green town1,667
- Spring Grove town883
- Spring Lake town823
- Spring Prairie town1,875
- Spring Valley town633
- Springbrook town578
- Springdale town2,179
- Springfield town (Dane County)2,859
- Springfield town (Jackson County)538
- Springfield town (Marquette County)810
- Springfield town (St. Croix County)1,093
- Springvale town (Columbia County)337
- Springvale town (Fond du Lac County)824
- Springville town1,306
- Springwater town1,541
- Spruce town834
- St. Croix Falls town947
- St. Germain town2,067
- St. Joseph town4,292
- St. Lawrence town712
- St. Marie town303
- Stanfold town979
- Stanley town2,549
- Stanton town (Dunn County)865
- Stanton town (St. Croix County)927
- Star Prairie town3,766
- Stark town389
- Stella town653
- Stephenson town3,552
- Sterling town (Polk County)777
- Sterling town (Vernon County)575
- Stettin town2,572
- Stiles town1,640
- Stinnett town227
- Stockbridge town1,167
- Stockholm town200
- Stockton town3,012
- Stone Lake town457
- Strickland town321
- Strongs Prairie town1,318
- Stubbs town508
- Sturgeon Bay town949
- Sugar Camp town2,165
- Sugar Creek town3,886
- Sullivan town2,029
- Summit town (Douglas County)897
- Summit town (Juneau County)710
- Summit town (Langlade County)173
- Sumner town (Barron County)729
- Sumner town (Jefferson County)824
- Sumner town (Trempealeau County)984
- Sumpter town1,163
- Sun Prairie town2,007
- Superior town2,107
- Swiss town768
- Sylvan town588
- Sylvester town1,009
- Taft town306
- Tainter town2,648
- Taycheedah town4,609
- Texas town1,984
- Theresa town1,009
- Thornapple town659
- Thorp town831
- Three Lakes town2,316
- Tiffany town547
- Tilden town1,316
- Tipler town285
- Tomah town1,466
- Tomahawk town560
- Townsend town1,020
- Trade Lake town926
- Trego town814
- Trempealeau town1,929
- Trenton town (Dodge County)1,406
- Trenton town (Pierce County)1,697
- Trenton town (Washington County)4,579
- Trimbelle town1,495
- Tripp town308
- Troy town (Sauk County)775
- Troy town (St. Croix County)5,563
- Troy town (Walworth County)2,626
- True town189
- Turtle Lake town797
- Turtle town2,768
- Two Creeks town369
- Two Rivers town1,666
- Underhill town688
- Union town (Burnett County)462
- Union town (Door County)1,054
- Union town (Eau Claire County)2,624
- Union town (Pierce County)653
- Union town (Rock County)2,235
- Union town (Vernon County)922
- Union town (Waupaca County)695
- Unity town (Clark County)660
- Unity town (Trempealeau County)472
- Upham town670
- Utica town (Crawford County)592
- Utica town (Winnebago County)1,428
- Vance Creek town499
- Vandenbroek town1,833
- Vermont town979
- Verona town2,578
- Vienna town1,385
- Vilas town192
- Vinland town2,281
- Viroqua town1,698
- Wabeno town937
- Wagner town651
- Waldwick town471
- Walworth town1,717
- Warner town675
- Warren town (St. Croix County)1,935
- Warren town (Waushara County)592
- Wascott town935
- Washburn town (Bayfield County)568
- Washburn town (Clark County)232
- Washington town (Door County)803
- Washington town (Eau Claire County)7,593
- Washington town (Green County)881
- Washington town (La Crosse County)671
- Washington town (Rusk County)440
- Washington town (Sauk County)1,221
- Washington town (Shawano County)2,017
- Washington town (Vilas County)1,610
- Waterford town6,475
- Waterloo town (Grant County)675
- Waterloo town (Jefferson County)934
- Watertown town1,850
- Waterville town863
- Watterstown town397
- Waubeek town400
- Waukechon town1,017
- Waumandee town534
- Waupaca town1,036
- Waupun town1,318
- Wausau town2,229
- Wausaukee town1,121
- Wautoma town1,226
- Wauzeka town441
- Wayne town (Lafayette County)472
- Wayne town (Washington County)2,199
- Webb Lake town488
- Webster town893
- Weirgor town257
- Wellington town707
- Wells town430
- Wescott town3,243
- West Bend town4,405
- West Kewaunee town1,300
- West Marshland town477
- West Point town2,229
- West Sweden town748
- Westboro town835
- Westfield town (Marquette County)737
- Westfield town (Sauk County)601
- Westford town (Dodge County)1,346
- Westford town (Richland County)641
- Weston town (Clark County)726
- Weston town (Dunn County)538
- Weston town (Marathon County)780
- Westport town4,213
- Weyauwega town553
- Wheatland town (Kenosha County)3,348
- Wheatland town (Vernon County)568
- Wheaton town2,762
- White Oak Springs town129
- White River town1,145
- Whitestown town711
- Whitewater town1,179
- Wien town894
- Wilkinson town20
- Willard town522
- Willow Springs town684
- Willow town378
- Wilson town (Dunn County)536
- Wilson town (Eau Claire County)498
- Wilson town (Lincoln County)310
- Wilson town (Rusk County)151
- Wilson town (Sheboygan County)3,439
- Wilton town1,174
- Winchester town (Vilas County)542
- Winchester town (Winnebago County)1,757
- Winfield town893
- Wingville town302
- Winneconne town2,625
- Winter town1,035
- Wiota town1,029
- Withee town1,017
- Wittenberg town779
- Wolf River town (Langlade County)738
- Wolf River town (Winnebago County)1,268
- Wonewoc town685
- Wood River town863
- Wood town699
- Woodboro town869
- Woodland town1,086
- Woodman town191
- Woodmohr town982
- Woodruff town1,558
- Woodville town818
- Worcester town1,385
- Worden town714
- Wrightstown town2,605
- Wyalusing town352
- Wyocena town2,101
- Wyoming town (Iowa County)342
- Wyoming town (Waupaca County)268
- York town (Clark County)976
- York town (Dane County)1,121
- York town (Green County)1,020
School districts
Each of the 421 with people in it, from ACS 2020–2024 5-year estimates. Elementary districts teach the lower grades and secondary districts the upper ones, under them; the rest are unified, teaching every grade.
- Abbotsford School District3,876
- Adams-Friendship Area School District14,158
- Albany School District2,946
- Algoma School District5,060
- Alma Center School District2,980
- Alma School District1,588
- Almond-Bancroft School District2,774
- Altoona School District10,271
- Amery School District9,826
- Antigo School District17,416
- Appleton Area School District101,477
- Arcadia School District6,548
- Argyle School District2,090
- Arrowhead Union High School Districtsecondary35,132
- Ashland School District13,175
- Ashwaubenon School District15,738
- Athens School District4,408
- Auburndale School District4,689
- Augusta School District4,705
- Baldwin-Woodville Area School District9,433
- Bangor School District3,898
- Baraboo School District21,662
- Barneveld School District2,551
- Barron Area School District9,467
- Bayfield School District3,008
- Beaver Dam School District22,807
- Beecher-Dunbar-Pembine School District2,285
- Belleville School District5,617
- Belmont Community School District2,177
- Beloit School District36,714
- Beloit Turner School District8,881
- Benton School District1,633
- Berlin Area School District10,271
- Big Foot Union High School Districtsecondary9,889
- Birchwood School District2,017
- Black Hawk School District2,589
- Black River Falls School District12,912
- Blair-Taylor School District3,894
- Bloomer School District7,629
- Bonduel School District6,241
- Boscobel Area School District6,178
- Bowler School District2,559
- Boyceville Community School District4,478
- Brighton No. 1 School Districtelementary1,343
- Brillion School District5,497
- Bristol No. 1 School Districtelementary6,758
- Brodhead School District6,391
- Brown Deer School District12,564
- Bruce School District3,668
- Burlington Area School District23,410
- Butternut School District1,370
- Cadott Community School District5,012
- Cambria-Friesland School District2,474
- Cambridge School District5,876
- Cameron School District4,791
- Campbellsport School District10,502
- Cashton School District4,038
- Cassville School District1,880
- Cedar Grove-Belgium Area School District6,742
- Cedarburg School District21,446
- Chequamegon School District6,386
- Chetek-Weyerhaeuser Area School District8,081
- Chilton School District6,993
- Chippewa Falls Area School District36,006
- Clayton School District1,651
- Clear Lake School District3,431
- Clinton Community School District5,733
- Clintonville School District9,301
- Cochrane-Fountain City School District4,578
- Colby School District6,978
- Coleman School District5,263
- Colfax School District4,962
- Columbus School District8,945
- Cornell School District2,813
- Crandon School District5,576
- Crivitz School District6,503
- Cuba City School District4,514
- Cudahy School District17,853
- Cumberland School District6,233
- D.C. Everest Area School District35,262
- Darlington Community School District4,861
- De Pere Unified School District25,569
- De Soto Area School District4,516
- Deerfield Community School District4,308
- DeForest Area School District24,317
- Delavan-Darien School District16,464
- Denmark School District8,577
- Dodgeland School District5,857
- Dodgeville School District8,262
- Dover No. 1 School Districtelementary2,074
- Drummond Area School District4,478
- Durand School District7,525
- East Troy Community School District12,633
- Eau Claire Area School District87,381
- Edgar School District3,521
- Edgerton School District12,162
- Elcho School District3,312
- Eleva-Strum School District3,971
- Elk Mound Area School District5,490
- Elkhart Lake-Glenbeulah School District3,816
- Elkhorn Area School District17,360
- Ellsworth Community School District10,789
- Elmbrook School District48,049
- Elmwood School District1,925
- Erin School Districtelementary2,949
- Evansville Community School District10,186
- Fall Creek School District4,512
- Fall River School District2,863
- Fennimore Community School District5,275
- Flambeau School District3,955
- Florence School District4,646
- Fond du Lac School District54,259
- Fontana Joint No. 8 School Districtelementary2,686
- Fort Atkinson School District18,426
- Fox Point Joint No. 2 School Districtelementary7,138
- Franklin Public School District29,300
- Frederic School District3,705
- Freedom Area School District10,078
- Galesville-Ettrick-Trempealeau School District9,558
- Geneva Joint No. 4 School Districtelementary1,160
- Genoa City Joint No. 2 School Districtelementary4,886
- Germantown School District28,037
- Gibraltar Area School District6,788
- Gillett School District3,500
- Gilman School District3,162
- Gilmanton School District927
- Glendale-River Hills School Districtelementary13,795
- Glenwood City School District3,982
- Goodman-Armstrong School District1,033
- Grafton School District15,349
- Granton Area School District2,150
- Grantsburg School District4,903
- Green Bay Area School District139,634
- Green Lake School District2,820
- Greendale School District14,594
- Greenfield School District28,923
- Greenwood School District3,286
- Gresham School District1,926
- Hamilton School District30,459
- Hartford Joint No. 1 School Districtelementary19,054
- Hartford Union High School Districtsecondary32,815
- Hartland-Lakeside Joint No. 3 School Districtelementary11,655
- Hayward Community School District15,070
- Herman-Neosho-Rubicon School Districtelementary4,462
- Highland School District1,720
- Hilbert School District2,539
- Hillsboro School District4,750
- Holmen School District22,821
- Holy Hill Area School Districtelementary6,350
- Horicon School District5,626
- Hortonville School District22,697
- Howard-Suamico School District33,831
- Howards Grove School District5,834
- Hudson School District32,779
- Hurley School District4,344
- Hustisford School District3,373
- Independence School District2,567
- Iola-Scandinavia School District4,807
- Iowa-Grant School District4,068
- Ithaca School District1,565
- Janesville School District65,554
- Jefferson School District12,578
- Johnson Creek School District4,885
- Juda School District1,318
- Kaukauna Area School District31,785
- Kenosha School District128,162
- Kettle Moraine School District24,417
- Kewaskum School District13,734
- Kewaunee School District6,667
- Kickapoo Area School District3,244
- Kiel Area School District8,232
- Kimberly Area School District25,356
- Kohler School District2,295
- La Crosse School District62,801
- La Farge School District1,831
- Lac du Flambeau No. 1 School Districtelementary3,644
- Ladysmith School District5,154
- Lake Country School Districtelementary4,352
- Lake Geneva Joint No. 1 School Districtelementary19,509
- Lake Geneva-Genoa City Union High School Districtsecondary26,500
- Lake Holcombe School District2,771
- Lake Mills Area School District10,552
- Lakeland Union High School Districtsecondary19,566
- Lancaster Community School District6,271
- Laona School District1,582
- Lena School District2,707
- Linn Joint No. 4 School Districtelementary945
- Linn Joint No. 6 School Districtelementary1,184
- Little Chute Area School District7,641
- Lodi School District10,376
- Lomira School District7,054
- Loyal School District4,349
- Luck School District3,403
- Luxemburg-Casco School District11,758
- Madison Metropolitan School District279,606
- Manawa School District5,112
- Manitowoc School District40,265
- Maple Dale-Indian Hill School Districtelementary5,367
- Maple School District8,275
- Marathon City School District4,579
- Marinette School District15,622
- Marion School District3,938
- Markesan School District6,622
- Marshall School District5,510
- Marshfield School District27,518
- Mauston School District10,120
- Mayville School District8,283
- McFarland School District13,004
- Medford Area School District13,231
- Mellen School District1,997
- Melrose-Mindoro School District4,409
- Menasha School District25,536
- Menominee Indian School District4,434
- Menomonee Falls School District31,107
- Menomonie Area School District27,795
- Mequon-Thiensville School District28,569
- Mercer School District1,485
- Merrill Area School District19,760
- Merton Community School Districtelementary6,719
- Middleton-Cross Plains School District44,919
- Milton School District19,397
- Milwaukee School District566,973
- Mineral Point School District4,243
- Minocqua Joint No. 1 School Districtelementary7,455
- Mishicot School District6,132
- Mondovi School District5,880
- Monona Grove School District20,112
- Monroe School District15,433
- Montello School District6,717
- Monticello School District2,296
- Mosinee School District13,065
- Mount Horeb Area School District12,950
- Mukwonago School District30,328
- Muskego-Norway School District29,978
- Necedah Area School District4,810
- Neenah School District47,065
- Neillsville School District6,240
- Nekoosa School District8,449
- New Auburn School District1,959
- New Berlin School District36,729
- New Glarus School District4,865
- New Holstein School District9,423
- New Lisbon School District5,310
- New London School District16,715
- New Richmond School District20,671
- Niagara School District2,543
- Nicolet Union High School Districtsecondary26,300
- Norris School District43
- North Cape School Districtelementary1,833
- North Crawford School District3,044
- North Fond du Lac School District8,997
- North Lake School Districtelementary2,989
- North Lakeland School Districtelementary3,404
- Northern Ozaukee School District5,240
- Northland Pines School District12,201
- Northwood School District3,544
- Norwalk-Ontario-Wilton School District4,479
- Norway Joint No. 7 School Districtelementary1,149
- Oak Creek-Franklin School District41,692
- Oakfield School District3,385
- Oconomowoc Area School District38,139
- Oconto Falls School District11,813
- Oconto School District7,680
- Omro School District7,826
- Onalaska School District18,818
- Oostburg School District6,433
- Oregon School District24,642
- Osceola School District10,023
- Oshkosh Area School District79,868
- Osseo-Fairchild School District5,709
- Owen-Withee School District4,486
- Palmyra-Eagle Area School District7,895
- Pardeeville Area School District6,396
- Paris Joint No. 1 School Districtelementary1,643
- Parkview School District5,411
- Pecatonica Area School District2,838
- Pepin Area School District1,919
- Peshtigo School District6,038
- Pewaukee School District18,646
- Phelps School District1,373
- Phillips School District6,080
- Pittsville School District3,673
- Platteville School District15,808
- Plum City School District1,793
- Plymouth School District17,366
- Port Edwards School District3,673
- Port Washington-Saukville School District18,003
- Portage Community School District17,239
- Potosi School District2,018
- Poynette School District7,070
- Prairie du Chien Area School District8,010
- Prairie Farm School District1,642
- Prentice School District3,075
- Prescott School District8,645
- Princeton School District3,038
- Pulaski Community School District23,618
- Racine School District139,875
- Randall Joint No. 1 School Districtelementary5,882
- Randolph School District3,375
- Random Lake School District5,862
- Raymond No. 14 School Districtelementary3,509
- Reedsburg School District17,738
- Reedsville School District4,567
- Rhinelander School District21,489
- Rib Lake School District3,331
- Rice Lake Area School District16,833
- Richland School District10,662
- Richmond School Districtelementary3,250
- Rio Community School District2,966
- Ripon Area School District10,762
- River Falls School District26,244
- River Ridge School District3,662
- River Valley School District9,166
- Riverdale School District4,687
- Rosendale-Brandon School District5,289
- Rosholt School District3,724
- Royall School District3,998
- Salem School Districtelementary9,068
- Sauk Prairie School District16,230
- Seneca School District1,731
- Sevastopol School District5,585
- Seymour Community School District12,507
- Sharon Joint No. 11 School Districtelementary2,110
- Shawano School District17,412
- Sheboygan Area School District62,328
- Sheboygan Falls School District12,245
- Shell Lake School District3,852
- Shiocton School District4,340
- Shorewood School District13,627
- Shullsburg School District2,195
- Silver Lake Joint No. 1 School Districtelementary3,967
- Siren School District3,235
- Slinger School District17,085
- Solon Springs School District2,270
- Somerset School District8,923
- South Milwaukee School District20,442
- South Shore School District1,879
- Southern Door County School District8,082
- Southwestern Wisconsin School District3,654
- Sparta Area School District18,169
- Spencer School District4,342
- Spooner Area School District10,757
- Spring Valley School District4,538
- St. Croix Central School District8,651
- St. Croix Falls School District7,219
- St. Francis School District9,004
- Stanley-Boyd Area School District8,085
- Stevens Point Area School District56,966
- Stockbridge School District1,719
- Stone Bank School Districtelementary2,776
- Stoughton Area School District20,724
- Stratford School District5,335
- Sturgeon Bay School District9,187
- Sun Prairie Area School District49,730
- Superior School District33,458
- Suring School District4,389
- Swallow School Districtelementary3,391
- Thorp School District4,294
- Three Lakes School District4,927
- Tigerton School District1,769
- Tomah Area School District20,594
- Tomahawk School District10,006
- Tomorrow River School District5,383
- Trevor-Wilmot Consolidated School Districtelementary4,113
- Tri-County Area School District4,283
- Turtle Lake School District3,588
- Twin Lakes No. 4 School Districtelementary3,467
- Two Rivers School District12,583
- Union Grove Joint No. 1 School Districtelementary5,368
- Union Grove Union High School Districtsecondary14,029
- Unity School District7,197
- Valders Area School District7,148
- Verona Area School District31,951
- Viroqua Area School District9,219
- Wabeno Area School District3,710
- Walworth Joint No. 1 School Districtelementary3,909
- Washburn School District3,948
- Washington Island School District803
- Washington-Caldwell School Districtelementary1,735
- Waterford Joint No. 1 School Districtelementary14,473
- Waterford Union High School Districtsecondary19,190
- Waterloo School District5,412
- Watertown School District29,288
- Waukesha School District94,232
- Waunakee Community School District22,596
- Waupaca School District15,691
- Waupun School District19,198
- Wausau School District55,819
- Wausaukee School District4,015
- Wautoma Area School District11,081
- Wauwatosa School District48,529
- Wauzeka-Steuben School District1,478
- Webster School District6,445
- West Allis School District66,316
- West Bend School District52,724
- West De Pere School District25,525
- West Salem School District10,835
- Westby Area School District7,929
- Westfield School District9,188
- Weston School District2,802
- Westosha Central High School Districtsecondary21,208
- Weyauwega-Fremont School District6,633
- Wheatland Joint No. 1 School Districtelementary3,984
- White Lake School District1,369
- Whitefish Bay School District14,665
- Whitehall School District4,987
- Whitewater School District21,487
- Whitnall School District18,185
- Wild Rose School District5,308
- Williams Bay School District4,233
- Wilmot Union High School Districtsecondary18,997
- Winneconne Community School District10,025
- Winter School District3,112
- Wisconsin Dells School District12,754
- Wisconsin Heights School District6,333
- Wisconsin Rapids School District35,916
- Wittenberg-Birnamwood School District7,526
- Wonewoc-Union Center School District3,167
- Woodruff Joint No. 1 School Districtelementary5,063
- Wrightstown Community School District8,011
- Yorkville Joint No. 2 School Districtelementary3,058
Congressional districts
As drawn for the 119th Congress (2025–2027).
- Congressional District 1733,917
- Congressional District 2748,550
- Congressional District 3739,573
- Congressional District 4725,486
- Congressional District 5742,808
- Congressional District 6738,897
- Congressional District 7743,243
- Congressional District 8742,398
State senate districts
The upper chamber’s districts, as drawn in 2024.
- State Senate District 1180,530
- State Senate District 2182,406
- State Senate District 3177,352
- State Senate District 4180,152
- State Senate District 5176,671
- State Senate District 6172,634
- State Senate District 7173,425
- State Senate District 8180,050
- State Senate District 9178,811
- State Senate District 10181,923
- State Senate District 11178,142
- State Senate District 12181,243
- State Senate District 13177,948
- State Senate District 14177,461
- State Senate District 15180,166
- State Senate District 16181,587
- State Senate District 17178,525
- State Senate District 18177,198
- State Senate District 19182,373
- State Senate District 20179,040
- State Senate District 21179,053
- State Senate District 22177,736
- State Senate District 23180,709
- State Senate District 24180,403
- State Senate District 25180,895
- State Senate District 26179,470
- State Senate District 27185,808
- State Senate District 28177,680
- State Senate District 29177,915
- State Senate District 30178,375
- State Senate District 31179,708
- State Senate District 32178,523
- State Senate District 33180,960
Assembly districts
The lower chamber’s districts, as drawn in 2024.
- Assembly District 159,933
- Assembly District 260,622
- Assembly District 359,975
- Assembly District 462,125
- Assembly District 561,155
- Assembly District 659,126
- Assembly District 758,947
- Assembly District 859,254
- Assembly District 959,151
- Assembly District 1058,500
- Assembly District 1162,495
- Assembly District 1259,157
- Assembly District 1359,782
- Assembly District 1457,225
- Assembly District 1559,664
- Assembly District 1656,064
- Assembly District 1760,404
- Assembly District 1856,166
- Assembly District 1955,839
- Assembly District 2058,105
- Assembly District 2159,481
- Assembly District 2261,716
- Assembly District 2357,745
- Assembly District 2460,589
- Assembly District 2559,892
- Assembly District 2658,790
- Assembly District 2760,129
- Assembly District 2861,326
- Assembly District 2959,723
- Assembly District 3060,874
- Assembly District 3157,534
- Assembly District 3260,279
- Assembly District 3360,329
- Assembly District 3460,303
- Assembly District 3560,540
- Assembly District 3660,400
- Assembly District 3759,563
- Assembly District 3858,913
- Assembly District 3959,472
- Assembly District 4058,419
- Assembly District 4159,785
- Assembly District 4259,257
- Assembly District 4359,969
- Assembly District 4460,098
- Assembly District 4560,099
- Assembly District 4660,180
- Assembly District 4760,216
- Assembly District 4861,191
- Assembly District 4959,622
- Assembly District 5059,105
- Assembly District 5159,798
- Assembly District 5259,007
- Assembly District 5359,469
- Assembly District 5458,722
- Assembly District 5561,300
- Assembly District 5660,803
- Assembly District 5760,270
- Assembly District 5859,571
- Assembly District 5960,356
- Assembly District 6059,113
- Assembly District 6159,449
- Assembly District 6260,048
- Assembly District 6359,556
- Assembly District 6460,077
- Assembly District 6558,953
- Assembly District 6658,706
- Assembly District 6760,273
- Assembly District 6860,468
- Assembly District 6959,968
- Assembly District 7059,284
- Assembly District 7160,067
- Assembly District 7261,052
- Assembly District 7359,202
- Assembly District 7460,699
- Assembly District 7560,994
- Assembly District 7660,764
- Assembly District 7756,402
- Assembly District 7862,304
- Assembly District 7959,037
- Assembly District 8064,891
- Assembly District 8161,880
- Assembly District 8258,352
- Assembly District 8359,947
- Assembly District 8459,381
- Assembly District 8559,250
- Assembly District 8659,728
- Assembly District 8758,937
- Assembly District 8860,236
- Assembly District 8960,338
- Assembly District 9057,801
- Assembly District 9159,968
- Assembly District 9258,686
- Assembly District 9361,054
- Assembly District 9460,849
- Assembly District 9559,432
- Assembly District 9658,242
- Assembly District 9759,729
- Assembly District 9860,994
- Assembly District 9960,237
PUMAs
Public Use Microdata Areas: areas of 100,000 people or more that the state draws from census tracts, for the Census Bureau’s microdata.
- Barron, Polk, Clark & Chippewa (Eastern, North & NW Towns) Counties PUMA158,513
- Brown County–City of Green Bay PUMA107,391
- Brown County–Outer Ring of Green Bay City PUMA163,501
- Dane County–Cities of Fitchburg & Verona and other near-S/SW/W/NW suburban MCDs PUMA112,887
- Dane County–Cities of Madison/Middleton/Monona, Villages of Shorewood/Maple Bluff PUMA129,452
- Dane County–City of Madison (Central) PUMA102,799
- Dane County–Rural & Outlying MCDs PUMA121,791
- Dane County–Sun Prairie, Waunakee, McFarland & other near-N/NE/E/SE suburban MCDs PUMA105,745
- Dodge & Jefferson Counties PUMA174,745
- Eau Claire County & SW Chippewa County PUMA142,493
- Fond du Lac & Calumet Counties PUMA157,079
- Grant, Green, Iowa, Richland & Lafayette Counties PUMA146,801
- Kenosha County PUMA168,438
- La Crosse County PUMA120,488
- Manitowoc, Door & Kewaunee Counties PUMA132,515
- Marathon County PUMA138,403
- Marinette, Shawano, Oconto, Florence & Menominee Counties PUMA131,572
- Milwaukee County–City of Milwaukee Central PUMA94,800
- Milwaukee County–City of Milwaukee East Side & Northern Suburbs PUMA112,353
- Milwaukee County–City of Milwaukee North Central PUMA102,079
- Milwaukee County–City of Milwaukee Northwest PUMA107,289
- Milwaukee County–City of Milwaukee South Central PUMA101,404
- Milwaukee County–City of Milwaukee South PUMA116,396
- Milwaukee County–Southern Suburbs PUMA120,510
- Milwaukee County–Western Suburbs PUMA171,500
- Monroe, Vernon, Juneau & Crawford Counties PUMA119,988
- Northwest Wisconsin Counties PUMA183,635
- Oneida, Lincoln, Vilas, Langlade & Forest Counties PUMA119,099
- Outagamie County PUMA192,826
- Pierce, Trempealeau, Jackson, Buffalo & Pepin Counties PUMA115,228
- Racine County PUMA197,532
- Rock County PUMA164,350
- Sauk & Columbia Counties PUMA124,281
- Sheboygan County PUMA117,991
- St. Croix & Dunn Counties PUMA141,560
- Walworth County PUMA105,657
- Washington & Ozaukee Counties PUMA230,845
- Waukesha County–Brookfield, New Berlin, Menomonee Falls, Muskego, Elm Grove & Butler PUMA165,568
- Waukesha County–Waukesha, Pewaukee, Sussex Area PUMA125,505
- Waukesha County–West and South Cities, Towns and Villages PUMA120,689
- Waupaca, Waushara, Green Lake & Marquette Counties PUMA111,446
- Winnebago County PUMA171,769
- Wood, Portage & Adams Counties PUMA165,959
Urban areas
Each that reaches into Wisconsin, with its whole population. Urban areas are the densely settled land the Census Bureau draws after each census, whatever the city lines.
- Antigo, WI8,187
- Appleton, WI233,300
- Ashland, WI7,126
- Baraboo, WI14,386
- Beaver Dam, WI18,483
- Beloit, WI–IL63,575
- Berlin, WI5,299
- Black River Falls, WI4,391
- Burlington, WI23,680
- Clintonville, WI4,532
- Columbus, WI6,831
- Delavan, WI12,362
- Dodgeville, WI5,007
- Duluth, MN–WI120,208
- East Troy, WI5,590
- Eau Claire, WI107,949
- Edgerton, WI8,337
- Elkhorn, WI11,693
- Evansville, WI6,526
- Fond du Lac, WI54,385
- Fontana-on-Geneva Lake, WI8,988
- Fort Atkinson, WI13,994
- Grafton–Port Washington–Cedarburg, WI44,842
- Green Bay, WI225,423
- Hartford, WI23,894
- Hudson, WI–MN23,396
- Iron Mountain–Kingsford, MI–WI17,437
- Ironwood, MI–WI6,667
- Jackson, WI7,877
- Janesville, WI73,296
- Jefferson, WI7,618
- Kenosha, WI125,500
- La Crosse, WI–MN98,440
- Lake Delton, WI6,246
- Lake Geneva, WI11,619
- Lake Mills, WI7,320
- Madison, WI460,184
- Manitowoc, WI46,726
- Marinette–Menominee, WI–MI23,292
- Marshfield, WI19,309
- Mayville, WI5,228
- Medford, WI4,229
- Menomonie, WI17,321
- Merrill, WI9,467
- Milwaukee, WI1.29M
- Monroe, WI10,629
- Mount Horeb, WI7,736
- Mukwonago, WI15,234
- New London, WI7,802
- New Richmond, WI9,838
- Oregon, WI12,078
- Oshkosh, WI75,735
- Platteville, WI11,507
- Plymouth, WI9,060
- Portage, WI10,133
- Prairie du Chien, WI–IA6,009
- Prairie du Sac–Sauk City, WI7,684
- Racine, WI135,264
- Reedsburg, WI10,332
- Rhinelander, WI9,937
- Rice Lake, WI10,135
- Richland Center, WI4,837
- Ripon, WI8,149
- River Falls, WI16,864
- Round Lake Beach–McHenry–Grayslake, IL–WI264,914
- Shawano, WI12,168
- Sheboygan, WI74,626
- Sparta, WI10,045
- Stevens Point, WI44,256
- Stillwater, MN–WI31,956
- Stoughton, WI15,327
- Sturgeon Bay, WI9,857
- Tomah, WI9,695
- Twin Lakes, WI–IL12,326
- Union Grove, WI6,483
- Viroqua, WI3,805
- Wales, WI5,626
- Watertown, WI22,330
- Waupaca, WI8,109
- Waupun, WI11,454
- Wausau, WI77,948
- West Bend, WI34,910
- West Salem, WI5,526
- Whitewater, WI15,576
- Wind Lake, WI4,333
- Wisconsin Rapids, WI29,216
Tribal areas
Each that reaches into Wisconsin, with its whole population.
- Bad River Reservation, WI1,279
- Fond du Lac Reservation and Off-Reservation Trust Land, MN–WI3,799
- Forest County Potawatomi Community and Off-Reservation Trust Land, WI667
- Ho-Chunk Nation Reservation and Off-Reservation Trust Land, WI–MN1,131
- Lac Courte Oreilles Reservation and Off-Reservation Trust Land, WI3,046
- Lac du Flambeau Reservation, WI3,654
- Menominee Reservation and Off-Reservation Trust Land, WI3,548
- Oneida (WI) Reservation and Off-Reservation Trust Land, WI27,624
- Red Cliff Reservation and Off-Reservation Trust Land, WI1,256
- Sokaogon Chippewa Community and Off-Reservation Trust Land, WI466
- St. Croix Reservation and Off-Reservation Trust Land, WI447
- Stockbridge Munsee Community and Off-Reservation Trust Land, WI714
Turn Wisconsin into your planning report.
Social Explorer Studio builds an editable profile of any place, with tables and charts beside the county and state, and exports to Word, PDF and Excel.
Questions about Wisconsin
What is the population of Wisconsin?
5,972,787 people, according to the ACS 2025 1-year estimates, which the Census Bureau adjusts to match its own population estimate. That’s the 20th largest of the 50 states and DC.
What is the FIPS code for Wisconsin?
55. Every county’s and place’s FIPS code in Wisconsin starts with it. The Census Bureau’s full geographic identifier (GEOID) is 0400000US55.
What is the largest city in Wisconsin?
Milwaukee, with 562,388 people. Other large cities here include Madison, Green Bay and Kenosha.
What is the median household income in Wisconsin?
$80,213 (±$703), according to the ACS 2025 1-year estimates, lower than the US ($84,780).
What is the median age in Wisconsin?
41.3 years (±0.2), according to the ACS 2025 1-year estimates, higher than the US (39.5).
How much does housing cost in Wisconsin?
Wisconsin’s median home value is $316,500 (±$2,156) and its median gross rent is $1,219 (±$12) a month, according to the ACS 2025 1-year estimates. 43.1% (±1.3%) of its renters pay 30% or more of their income on rent.
Is Wisconsin growing?
Wisconsin’s population grew 3.5%, from 5,771,337 in 2015 to 5,972,787 in 2025, according to the ACS 1-year estimates.
Where do people who work in Wisconsin live?
2,786,114 of its 2,905,544 jobs are held by people who live here. Of those who commute in, the most come from Illinois, Minnesota, Michigan.
Where does this census data come from?
The U.S. Census Bureau’s American Community Survey, through Social Explorer’s tables: the latest 1-year estimates where they exist, for the most recent numbers, and 5-year estimates otherwise. Each table lists its code, so you can find it again.
Is this data free to use?
Yes. You can read it, cite it, download the CSV and embed the charts, with no account. To map other variables, compare your own areas or build a report, see Social Explorer’s plans in a live demo.
Sources and how to cite
American Community Survey 2025 1-year estimates, or 2020–2024 5-year estimates where noted, U.S. Census Bureau, from Social Explorer’s tables A00001, A00002, A01004, A04001, A06001, A08001, A09005, A10001, A10003, A10008, A10030, A10036, A10040, A10047, A10055, A10060, A12001, A13004, A14006, A14024, A14028, A16002, A17005, A18002, A18009, A20001, B02002, B09001, B13002, B18101, C16001. Maps by census tract use 2020–2024 5-year estimates, since the 1-year survey doesn’t cover tracts. Commuting: LEHD LODES 2023. These are estimates from a sample, each with its margin of error. Data retrieved November 14, 2026. How these profiles are made.
U.S. Census Bureau, American Community Survey 2025 1-year estimates, or 2020–2024 5-year estimates where noted, via Social Explorer. “Wisconsin.” https://www.socialexplorer.com/places/wisconsin. Accessed November 14, 2026.