

US census data, from 1790 to today.
Social Explorer has every decennial census since 1790, the American Community Survey and the population estimates, ready to map, compare and cite.
Search for a place, and map any variable in seconds. Compare places and decades, build a report and cite it, with no GIS skills and no files to clean.
- Already use Social Explorer? Login
- Part of a university or library? Check your access
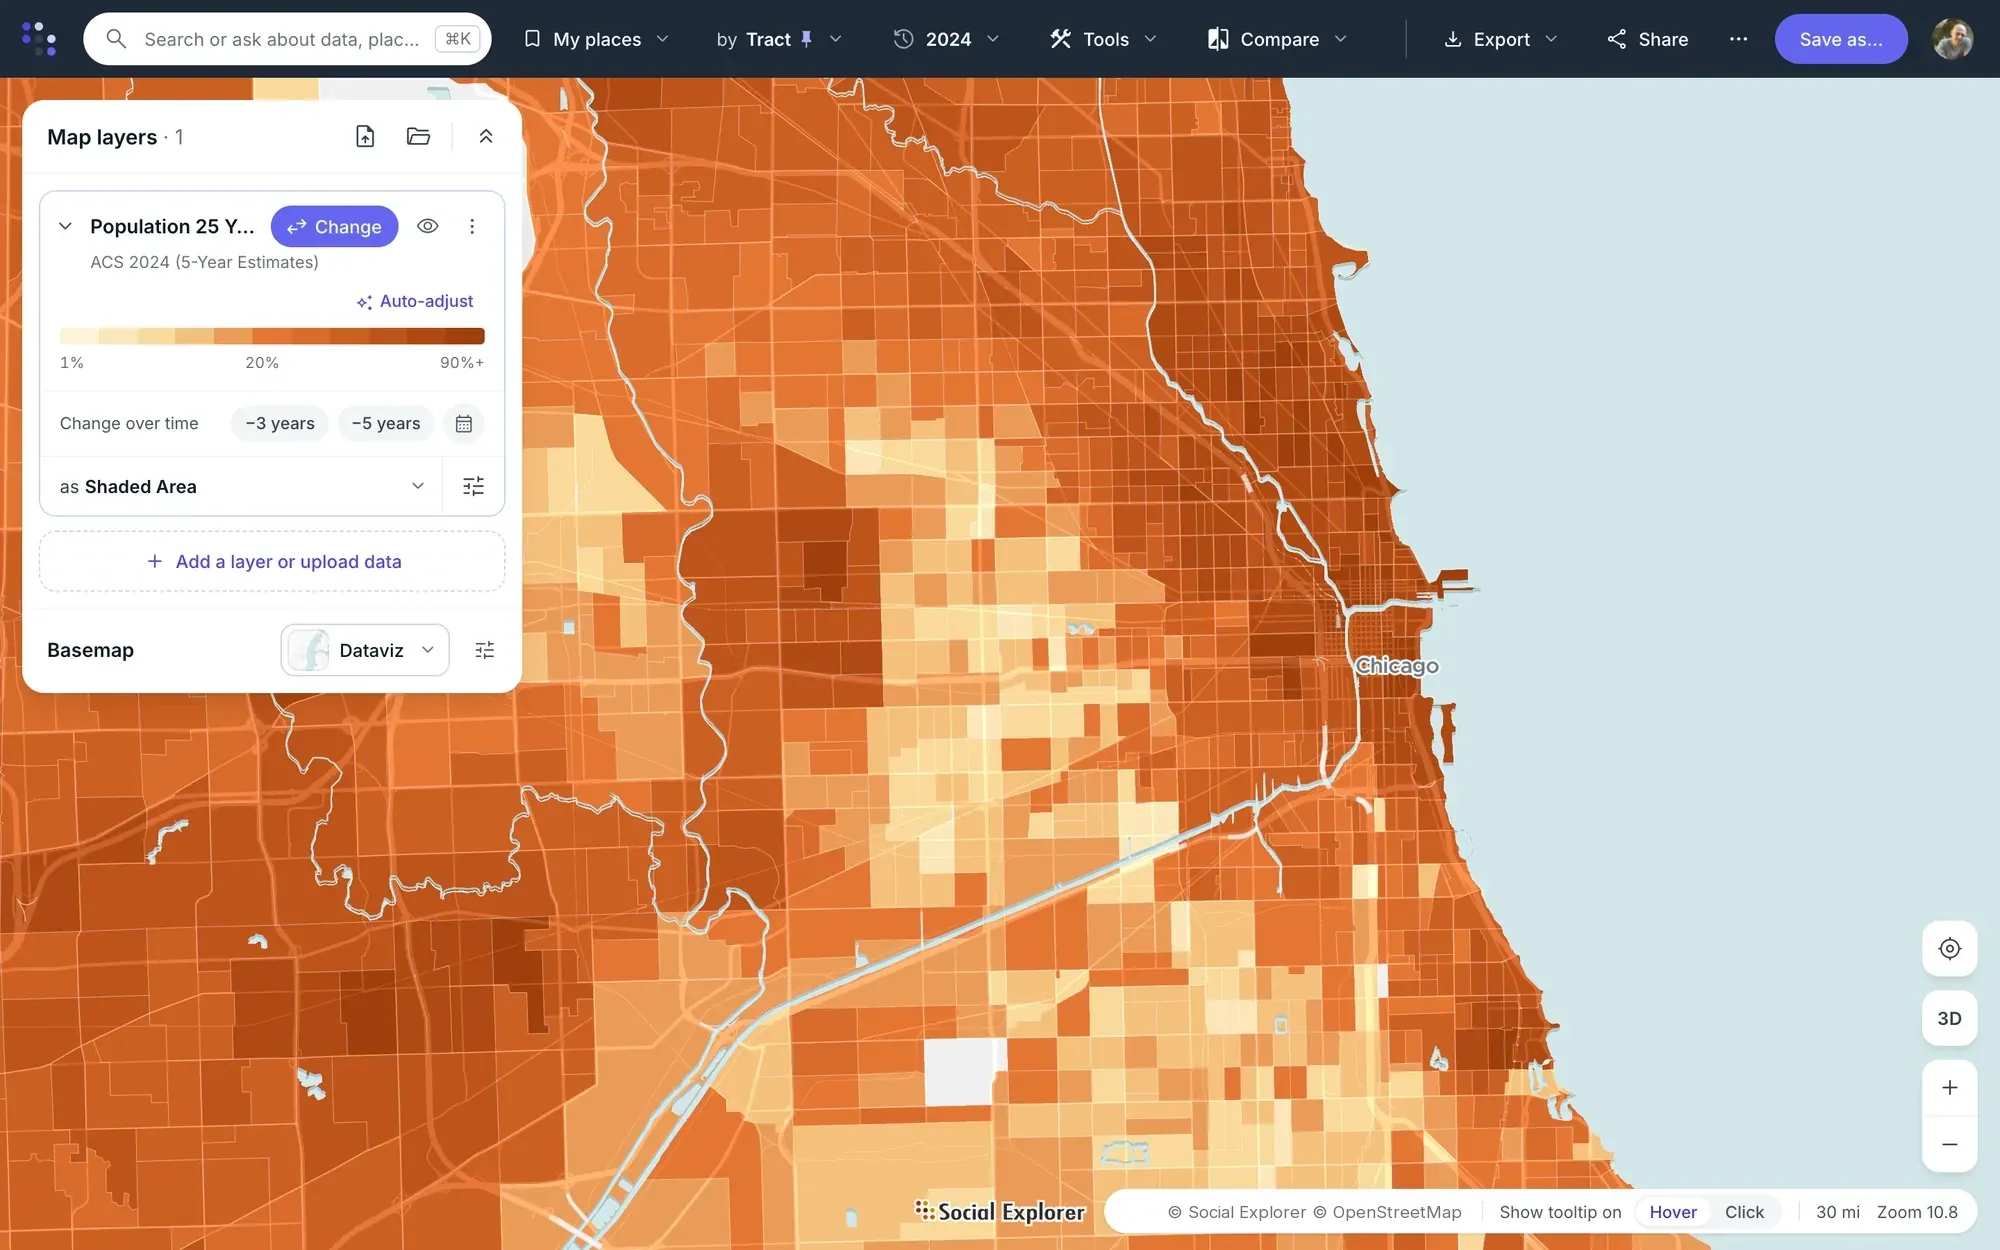
Shade every tract by any census variable, with its legend and source.
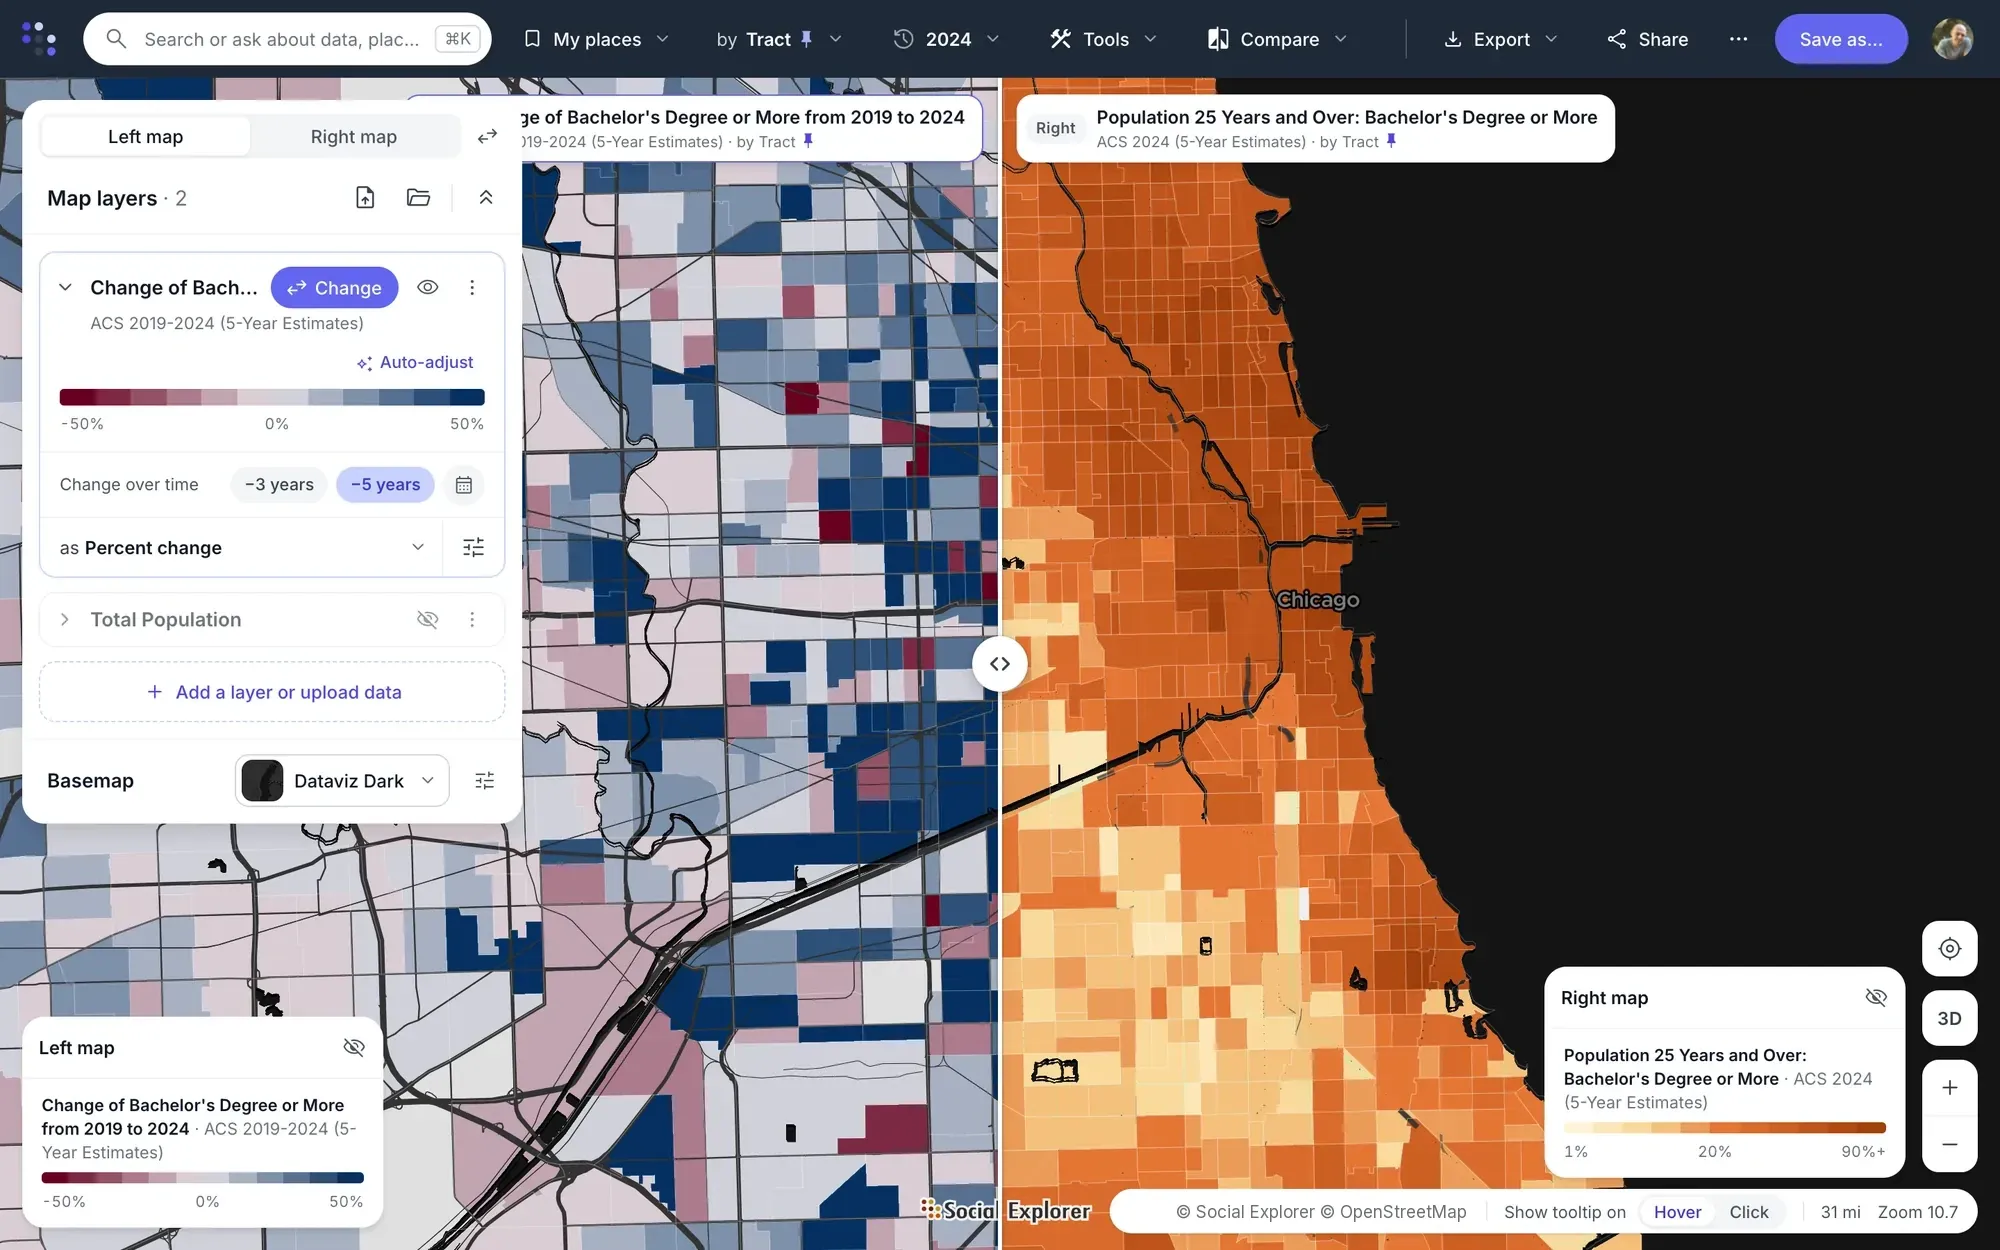
Swipe between two years, or color every tract by how much it changed.
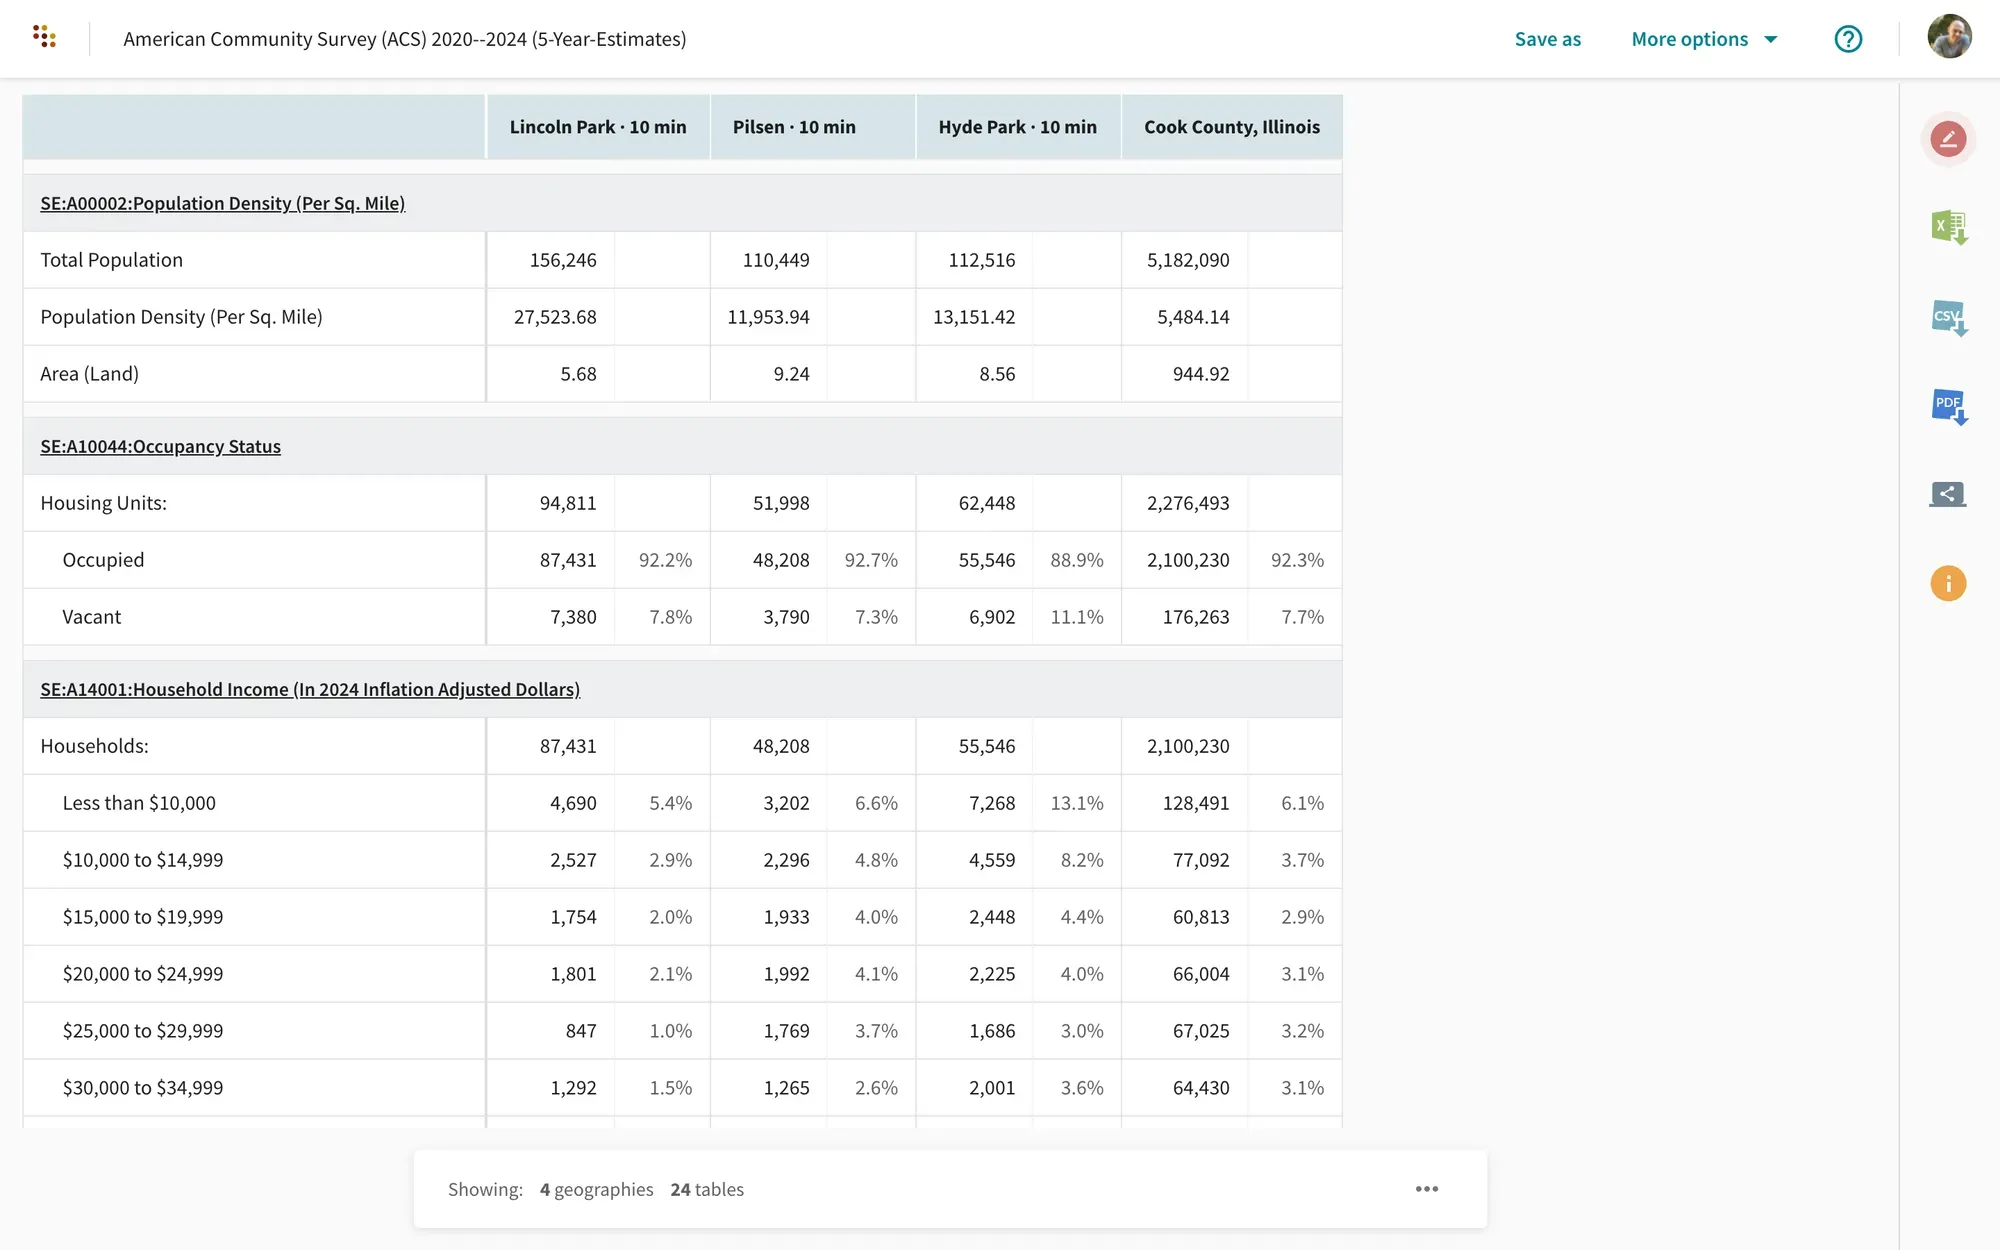
Put your areas side by side in a report, and export it with its sources.
- 24
- Decennial censuses, 1790 to 2020
- 2024
- Newest American Community Survey
- 2025
- Newest population estimates
- 1.7 million+
- Variables across every census release
Start with the census data you need.
- Earlier censuses Every census since 1790, with counties from the start and census tracts from 1940. Go back in time
- Current census data The American Community Survey through 2024 and population estimates through 2025, down to block groups. See what’s current
- EASI projections EASI’s commercial projections through 2030, by block group and ZIP code, with a Social Explorer subscription. Modeled, not counted. Look ahead
- Maps and analysis Map any variable, compare places and years, and turn the numbers into a report you can cite. See what you can do
Free demographic profiles for communities across the US.
Population, income, education and housing for communities across the US, with maps, charts and ten years of change, from the American Community Survey. No account needed.
Find your communityWhat is census data?
Census data is what the U.S. Census Bureau publishes about the people and housing in an area: how many people live there, their age, income and education, and the homes they live in. It’s published as statistics for places, never as records about individuals.
Looking for your ancestors?
Census records that name individuals stay private for 72 years, then the National Archives releases them. Social Explorer has statistics about places, not records about people, so it’s the place to learn about the community your family lived in.
-
The decennial census
A full count of every person in the country, every 10 years, as the Constitution requires. The latest is 2020, and the next is 2030.
-
The American Community Survey
A survey sent to a sample of households every year. It has the detail the short decennial form doesn’t: income, education, commuting, rent and more.
-
The population estimates
The Census Bureau’s yearly update of the latest count, using births, deaths and migration, so totals stay current between censuses.
A country, counted
From 3.9 million people to 331 million.
The 24 censuses since 1790 show how the country grew. Growth slowed to 7.4 percent in the 2010s, the slowest decade since the 1930s, and the Census Bureau’s estimate for 2025 is 341.8 million people.
See the count at every census
| Census | Population | Growth |
|---|---|---|
| 1790 | 3,929,625 | – |
| 1800 | 5,306,526 | 35.0% |
| 1810 | 7,239,814 | 36.4% |
| 1820 | 9,638,193 | 33.1% |
| 1830 | 12,860,702 | 33.4% |
| 1840 | 17,063,353 | 32.7% |
| 1850 | 23,191,876 | 35.9% |
| 1860 | 31,443,321 | 35.6% |
| 1870 | 38,558,371 | 22.6% |
| 1880 | 50,155,783 | 30.1% |
| 1890 | 62,622,250 | 24.9% |
| 1900 | 76,303,387 | 21.8% |
| 1910 | 92,228,531 | 20.9% |
| 1920 | 105,710,620 | 14.6% |
| 1930 | 122,775,046 | 16.1% |
| 1940 | 131,669,275 | 7.2% |
| 1950 | 150,697,361 | 14.5% |
| 1960 | 179,323,175 | 19.0% |
| 1970 | 203,212,877 | 13.3% |
| 1980 | 226,545,805 | 11.5% |
| 1990 | 248,709,873 | 9.8% |
| 2000 | 281,421,906 | 13.2% |
| 2010 | 308,745,538 | 9.7% |
| 2020 | 331,449,281 | 7.4% |
Choosing a source
Which census data should you use?
Each program answers a different question. Counts are exact but come once a decade, and estimates are more detailed and more current but carry a margin of error.
| Source | What it is | How often | Latest | Smallest area | Best for |
|---|---|---|---|---|---|
| Decennial census | A full count of everyone | Every 10 years | 2020 | Census block | Exact counts, redistricting and long-run history |
| ACS 5-year estimates | A sample, pooled over five years | Every year | 2020–2024 | Block group | Income, education and housing for small areas |
| ACS 1-year estimates | One year’s sample | Every year | 2024 | Areas of 65,000 people or more | The most current detail for larger places |
| Population estimates | The last count, updated by a model | Every year | 2025 | Cities and towns | Current totals, and how they’re changing |
| Censuses on 2010 geographies | Earlier censuses, reallocated to 2010 boundaries | By census | 1970–2000 | Census tract | Comparing the same tracts across decades |
| EASI Market Profile projections | Modeled by EASI, not counted | Every year | To 2030 | Block group | Planning ahead for markets and services |
Earlier censuses
Every census, back to 1790.
Follow a county, a neighborhood or the whole country across two centuries, without tracking down old tables. Boundaries change over time, so each era has the geography the census itself published.
-
1790–1930
States and counties
The earliest censuses, from the first count of the new country onward.
-
1940–1960
Census tracts begin
Neighborhood-level data, for the areas the census had tracted by then.
-
1970–2000
Comparable tracts
These censuses are also reallocated to 2010 boundaries, so a tract can be compared across decades.
-
2010–2020
Down to the census block
Blocks, ZIP code areas and congressional districts. Since 2010 the census asks only the short form; the detail moved to the ACS.
Current census data
The American Community Survey, through 2024.
The ACS is where to look for what people earn, how they get to work and what they pay for housing. Choose by the size of your area:
-
5-year estimates, for small areas
The 2020–2024 release pools five years of responses, so it reaches every census tract and block group.
-
1-year estimates, for the latest picture
The 2024 release covers places of 65,000 people or more. It’s the newest, but it’s based on a smaller sample.
-
Population estimates, for current totals
The 2025 release updates the count for states, counties, metro areas and cities.
ACS figures are estimates from a sample, and every one has a margin of error. The smaller the area, the larger it tends to be, so check it before you lean on a small difference.
What is the American Community Survey?Projections from EASI
Look ahead, through 2030.
The census counts what has happened. To plan what comes next, EASI’s commercial Market Profile data, available with a Social Explorer subscription, has current-year values and projections through 2030, by state, county, tract, block group and ZIP code, beside demographics, retail sales, employment and consumer spending.
EASI’s projections are modeled, not counted by the Census Bureau, so they’re a starting point for planning rather than census data or a forecast to rely on alone.
About EASI Market Profile dataCensus geography
From states to census blocks.
Census data is published for areas of every size. Small areas tell you more about a neighborhood, and larger ones have more reliable estimates.
-
States and counties
The legal areas most data starts with, available from the first census on.
-
Places
Cities, towns and census-designated places, such as unincorporated communities.
-
Census tracts
Small, stable areas of 1,200 to 8,000 people, about 4,000 on average, drawn to resemble neighborhoods and compare over time.
-
Block groups
Parts of a tract, with 600 to 3,000 people. The smallest area with ACS data.
-
Census blocks
The smallest area of all, often a single city block. Blocks have decennial counts only.
-
ZIP code areas
ZIP codes are mail routes, so the Census Bureau publishes ZIP Code Tabulation Areas (ZCTAs), which approximate them.
-
Congressional and school districts
Areas that decisions are made for, with their own tables in the census and the ACS.
-
Metro areas
A core city and the counties tied to it by commuting, for looking at a whole region.
Maps and analysis
What do you want to ask the census?
Start with a place or a question. Each example shows the steps from question to result.
See it on a map
Map any census variable, from states down to block groups.
Explore Maps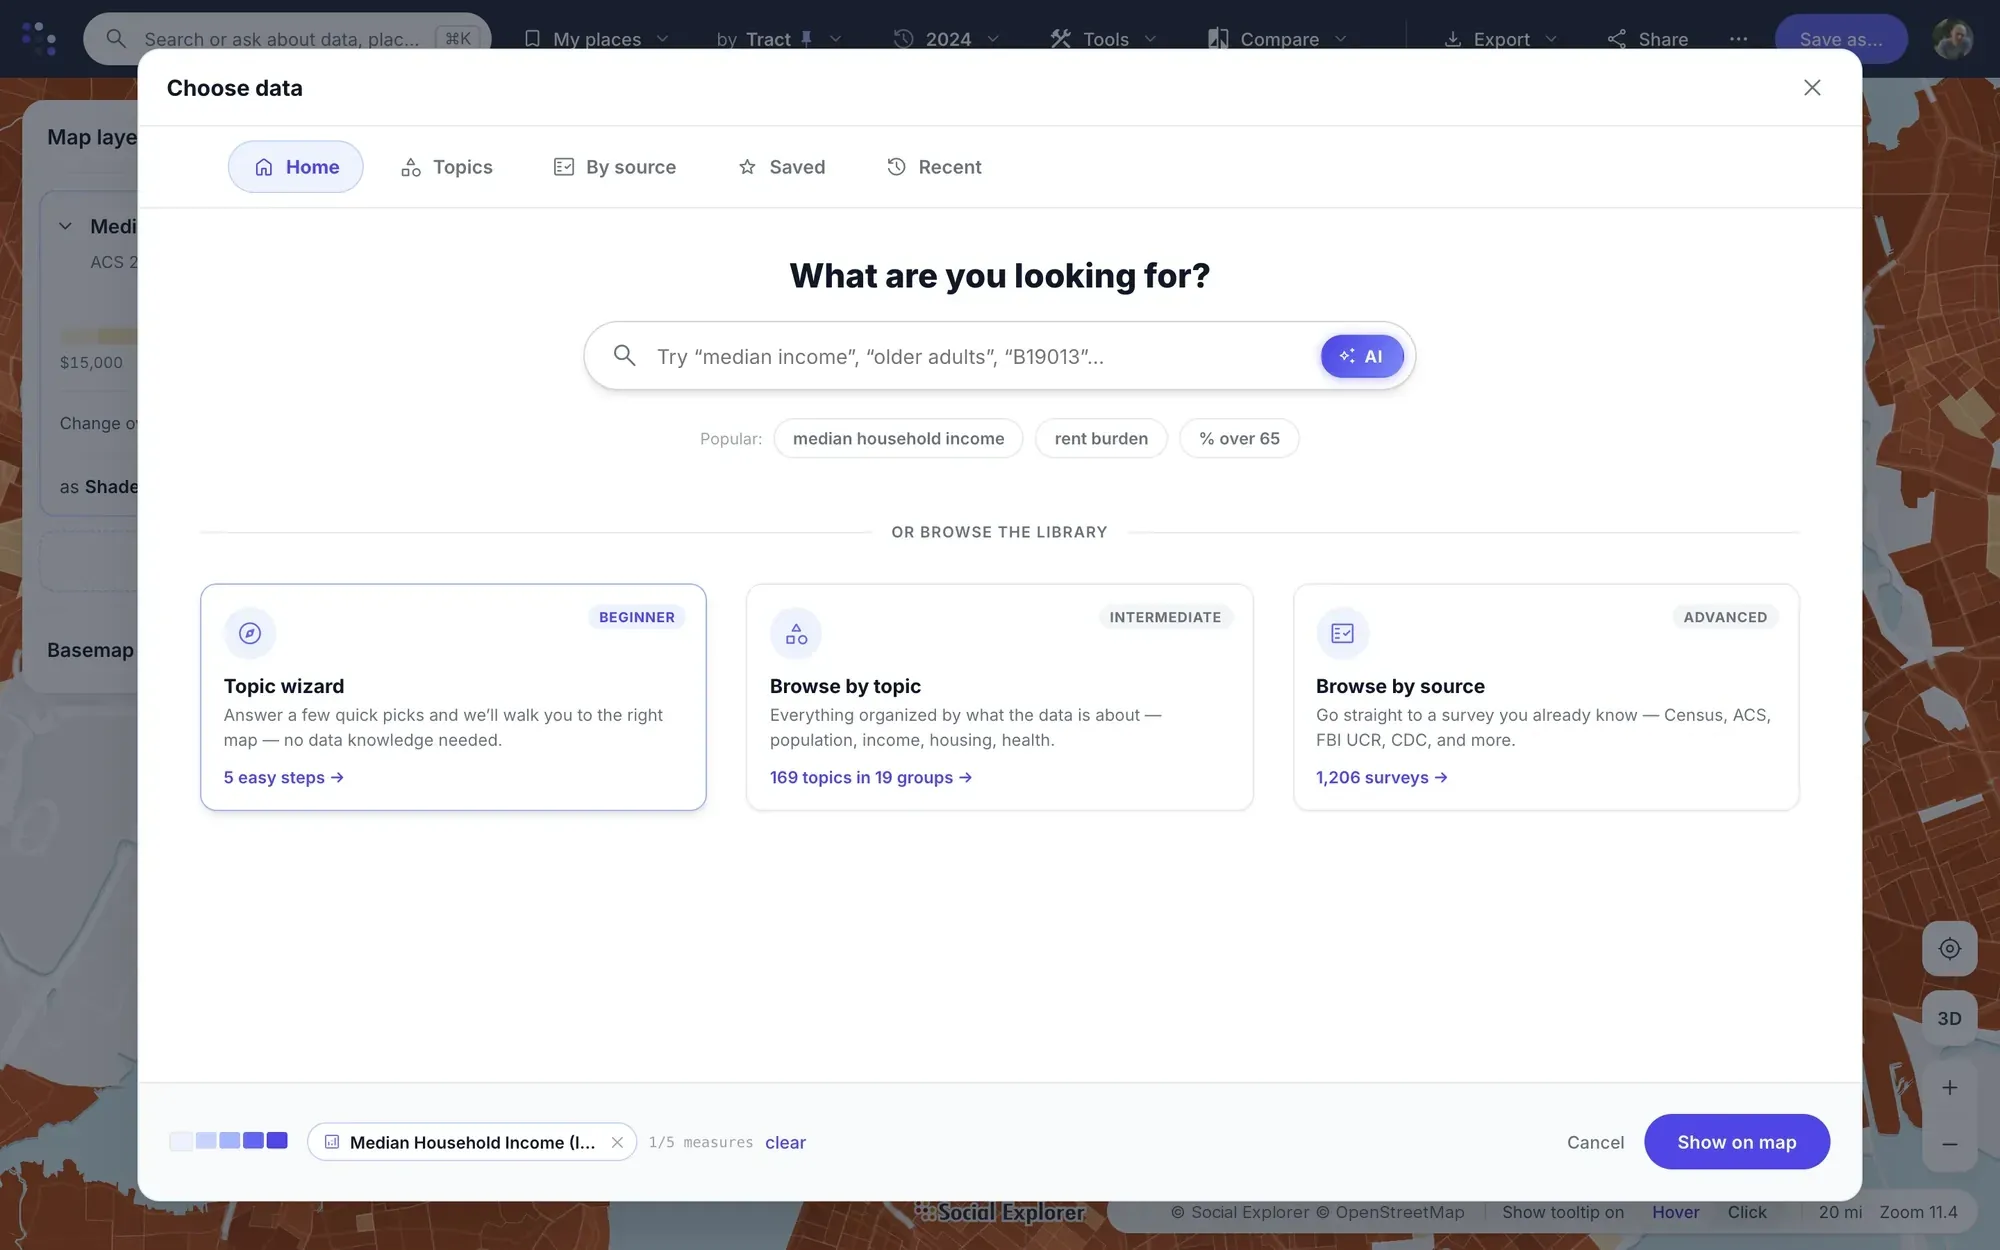
- Search for a place, or click it on the map.
- Pick a topic or a variable, or let the topic wizard walk you through it.
- Every area is shaded, with its legend and source. Click one for its numbers.
Put two years on one screen, or shade every area by how much it changed.
Tracking community change
- Choose a place and an indicator, such as income, housing costs or education.
- Swipe between two years of the same variable, or set them side by side.
- Shade areas by percent change, or compare up to three years in a report, with dollars adjusted for inflation.
Change over time shows how a community changed, not what caused it. It works for data Social Explorer has made comparable.
Screen a whole region by the census measures that matter to you.
Compare locations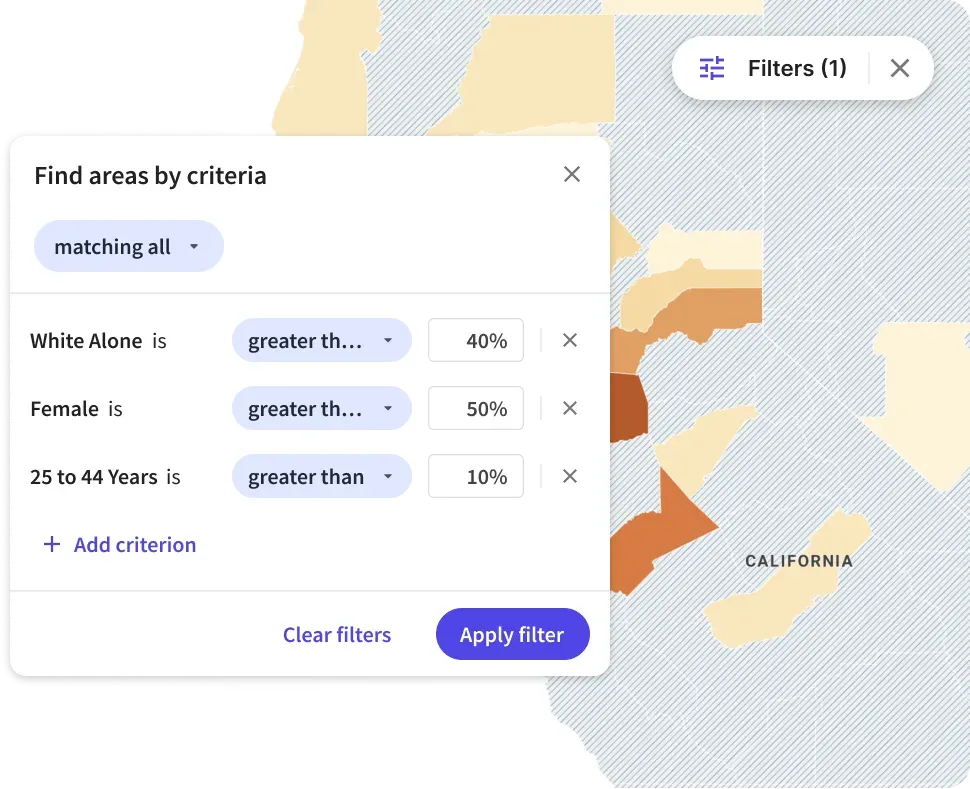
- Choose a region and the level you want, such as counties or tracts.
- Stack as many criteria as you need, such as income above a set level or growth since 2010.
- Match all, any or none of them, and see the matching areas on the map.
Turn it into a result
Draw the area you care about, and compare it with others side by side.
Compare areas in Maps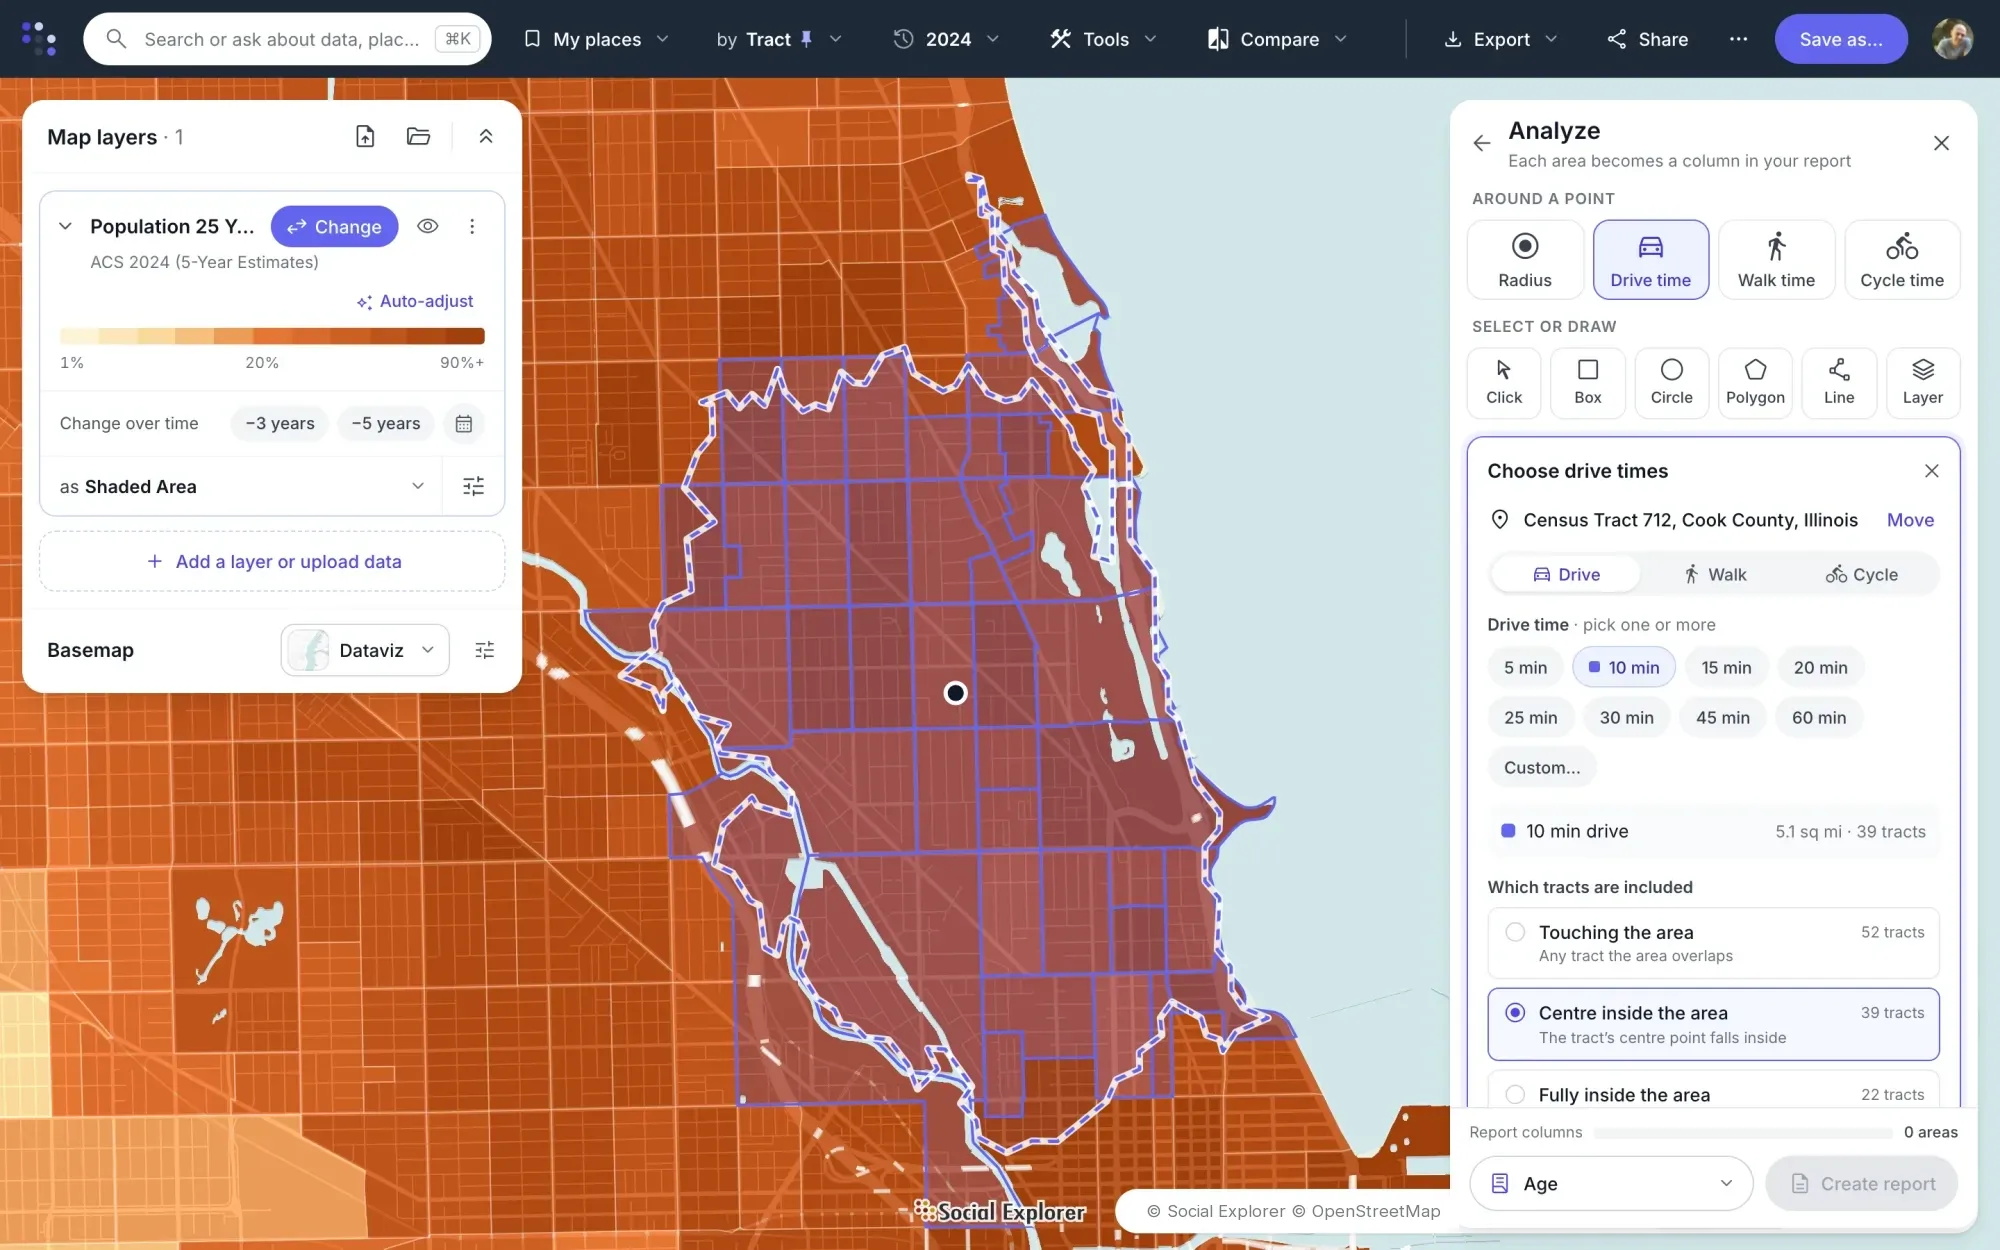
- Click a site and choose a radius or a drive, walk or cycle time.
- Choose which tracts count: those touching the area, those with their center inside it, or those fully inside.
- Each area becomes a column in one report, with the county beside them.
Turn any comparison into a report with its sources, and export it.
Reports and exports
- Open the report for the areas you chose.
- Add up to three years, with dollars adjusted for inflation.
- Export to Excel, CSV, PDF, SAS, SPSS or Stata, and cite it in Chicago, MLA or APA style.
Describe what you want to know, and get a map, chart or table with its sources.
Explore Data Navigator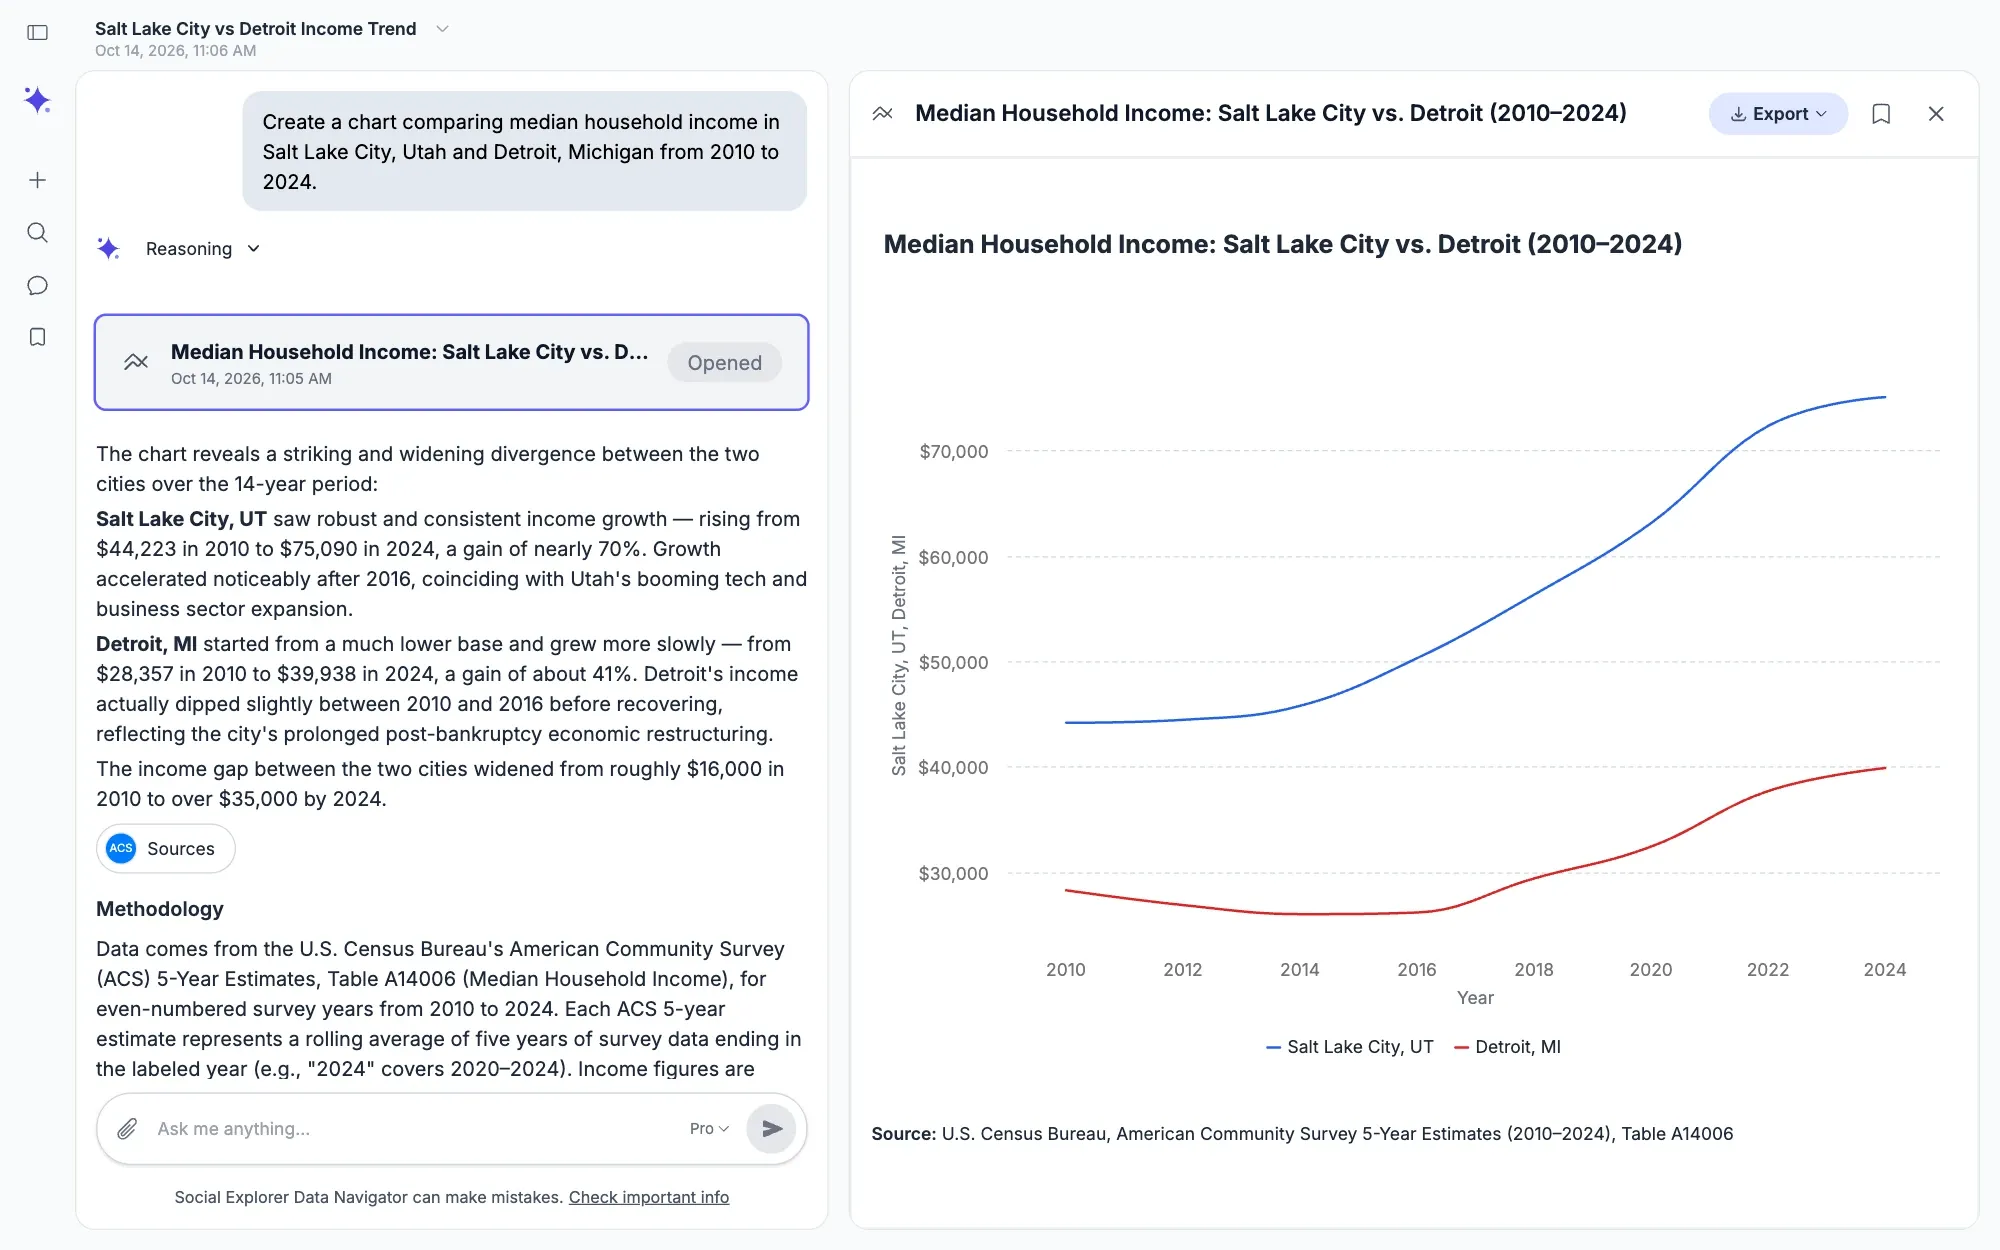
- Ask in everyday language, such as how income in two cities has changed since 2010.
- Data Navigator finds the data in Social Explorer’s published datasets.
- Review the answer with its sources and methods.
Data Navigator comes with Premium and Platinum. It answers from published datasets and from any files you attach.
Who it’s for
Census data for the work you do.
- Universities & libraries Teach with real data and support research across departments, with a license that covers everyone on campus.
- Government Back plans and policies with evidence about who lives where and how that is changing.
- Urban planning Build the existing conditions report and the rest of your plan’s analysis, with every source cited.
- Nonprofits Show the need behind your programs and grant applications, with sources reviewers can check.
- Business Compare markets and locations on the demographics that drive your decisions.
Guides
Learn to use census data.



Questions about census data.
What is census data?
Census data is what the U.S. Census Bureau publishes about the people and housing in an area, such as population, age, income, education and housing costs. It comes mainly from the decennial census, the American Community Survey and the population estimates, and it’s published as statistics for places, not records about individuals.
Where can I find US census data?
The Census Bureau publishes its data at data.census.gov, table by table. Social Explorer brings the same data together with its history back to 1790, so you can search for a place, map a variable and build a report without downloading, cleaning or joining files.
How do I access US census data for free?
Social Explorer’s demographic profiles are free for everyone, with no account: population, income, education and housing for every state, county, place, metro area and ZIP code. The Census Bureau’s data.census.gov is free too. For maps and reports, many universities and public libraries subscribe to Social Explorer for their members, so check with yours.
What’s the latest US census data?
The latest decennial census is 2020. The newest American Community Survey data is the 2024 1-year and 2020–2024 5-year release, and the newest population estimates are for 2025. Social Explorer adds each new release to its data library once the Census Bureau publishes it.
When is the next US census?
The next decennial census is in 2030, counting everyone living in the United States on April 1, 2030. Between censuses, the American Community Survey and the population estimates are updated every year, so current detail on income, housing and more never has to wait a decade.
What’s the difference between the census and the American Community Survey?
The decennial census counts everyone every 10 years and asks only a few questions. The American Community Survey samples households every year and asks about much more, including income, education, commuting and housing costs. Use the census for exact counts, and the ACS for detail.
What is a census tract?
A census tract is a small, relatively stable area of 1,200 to 8,000 people, about 4,000 on average, drawn by the Census Bureau to resemble a neighborhood. Tracts are often the best level for comparing neighborhoods over time, and Social Explorer has them from the 1940 census on.
Can I get census data by ZIP code?
Yes, through ZIP Code Tabulation Areas (ZCTAs), the Census Bureau’s approximations of ZIP code areas. They’re in the decennial census and the ACS 5-year estimates, and Social Explorer’s free demographic profiles cover 33,120 of them. ZIP codes themselves are mail routes, not areas, so the Bureau publishes its data for ZCTAs instead.
How far back does census data go?
US census data goes back to the first census, in 1790. Social Explorer has every decennial census since: nation, states and counties from 1790, and census tracts from 1940. Censuses from 1970 to 2000 are also available on 2010 boundaries, for comparing tracts across decades.
How do I cite census data?
To cite census data, name the Census Bureau, the program and year, such as the American Community Survey 2020–2024 5-year estimates, and the table and place you used. Social Explorer reports give you a ready-made citation in Chicago, MLA or APA style, and every variable comes with its definition.
Can I download census data?
Yes. Census data in Social Explorer downloads from any report as Excel, CSV or PDF, or with program files for SAS, SPSS and Stata, with its source and citation. Boundary shapefiles from 1790 to 2019 come from the Geodata Library, and maps export as pictures or as editable SVG files.
Do I need GIS skills to map census data?
No. Social Explorer maps census data in the browser, with nothing to install: search for a place or a topic in plain words, or let the topic wizard walk you through it, and every area is shaded with its legend and source. The map follows your zoom from states down to census tracts and block groups.
See census data for a place you know.
We’ll walk through the maps, reports and data for the work you do.