

Alaska: Population, demographics and census data
Home to 737,270 people, the 48th largest of the 50 states and DC, anchored by Anchorage. It fell 0.2% between 2015 and 2025.
- Population
- 737,270. Census Bureau estimate · Rank 48 of the 50 states and DC
- Median household income
- $95,220 ±$4,301. US $84,780
- Median age
- 37.0 ±0.3. US 39.5
ACS 2025 1-year estimates, U.S. Census Bureau
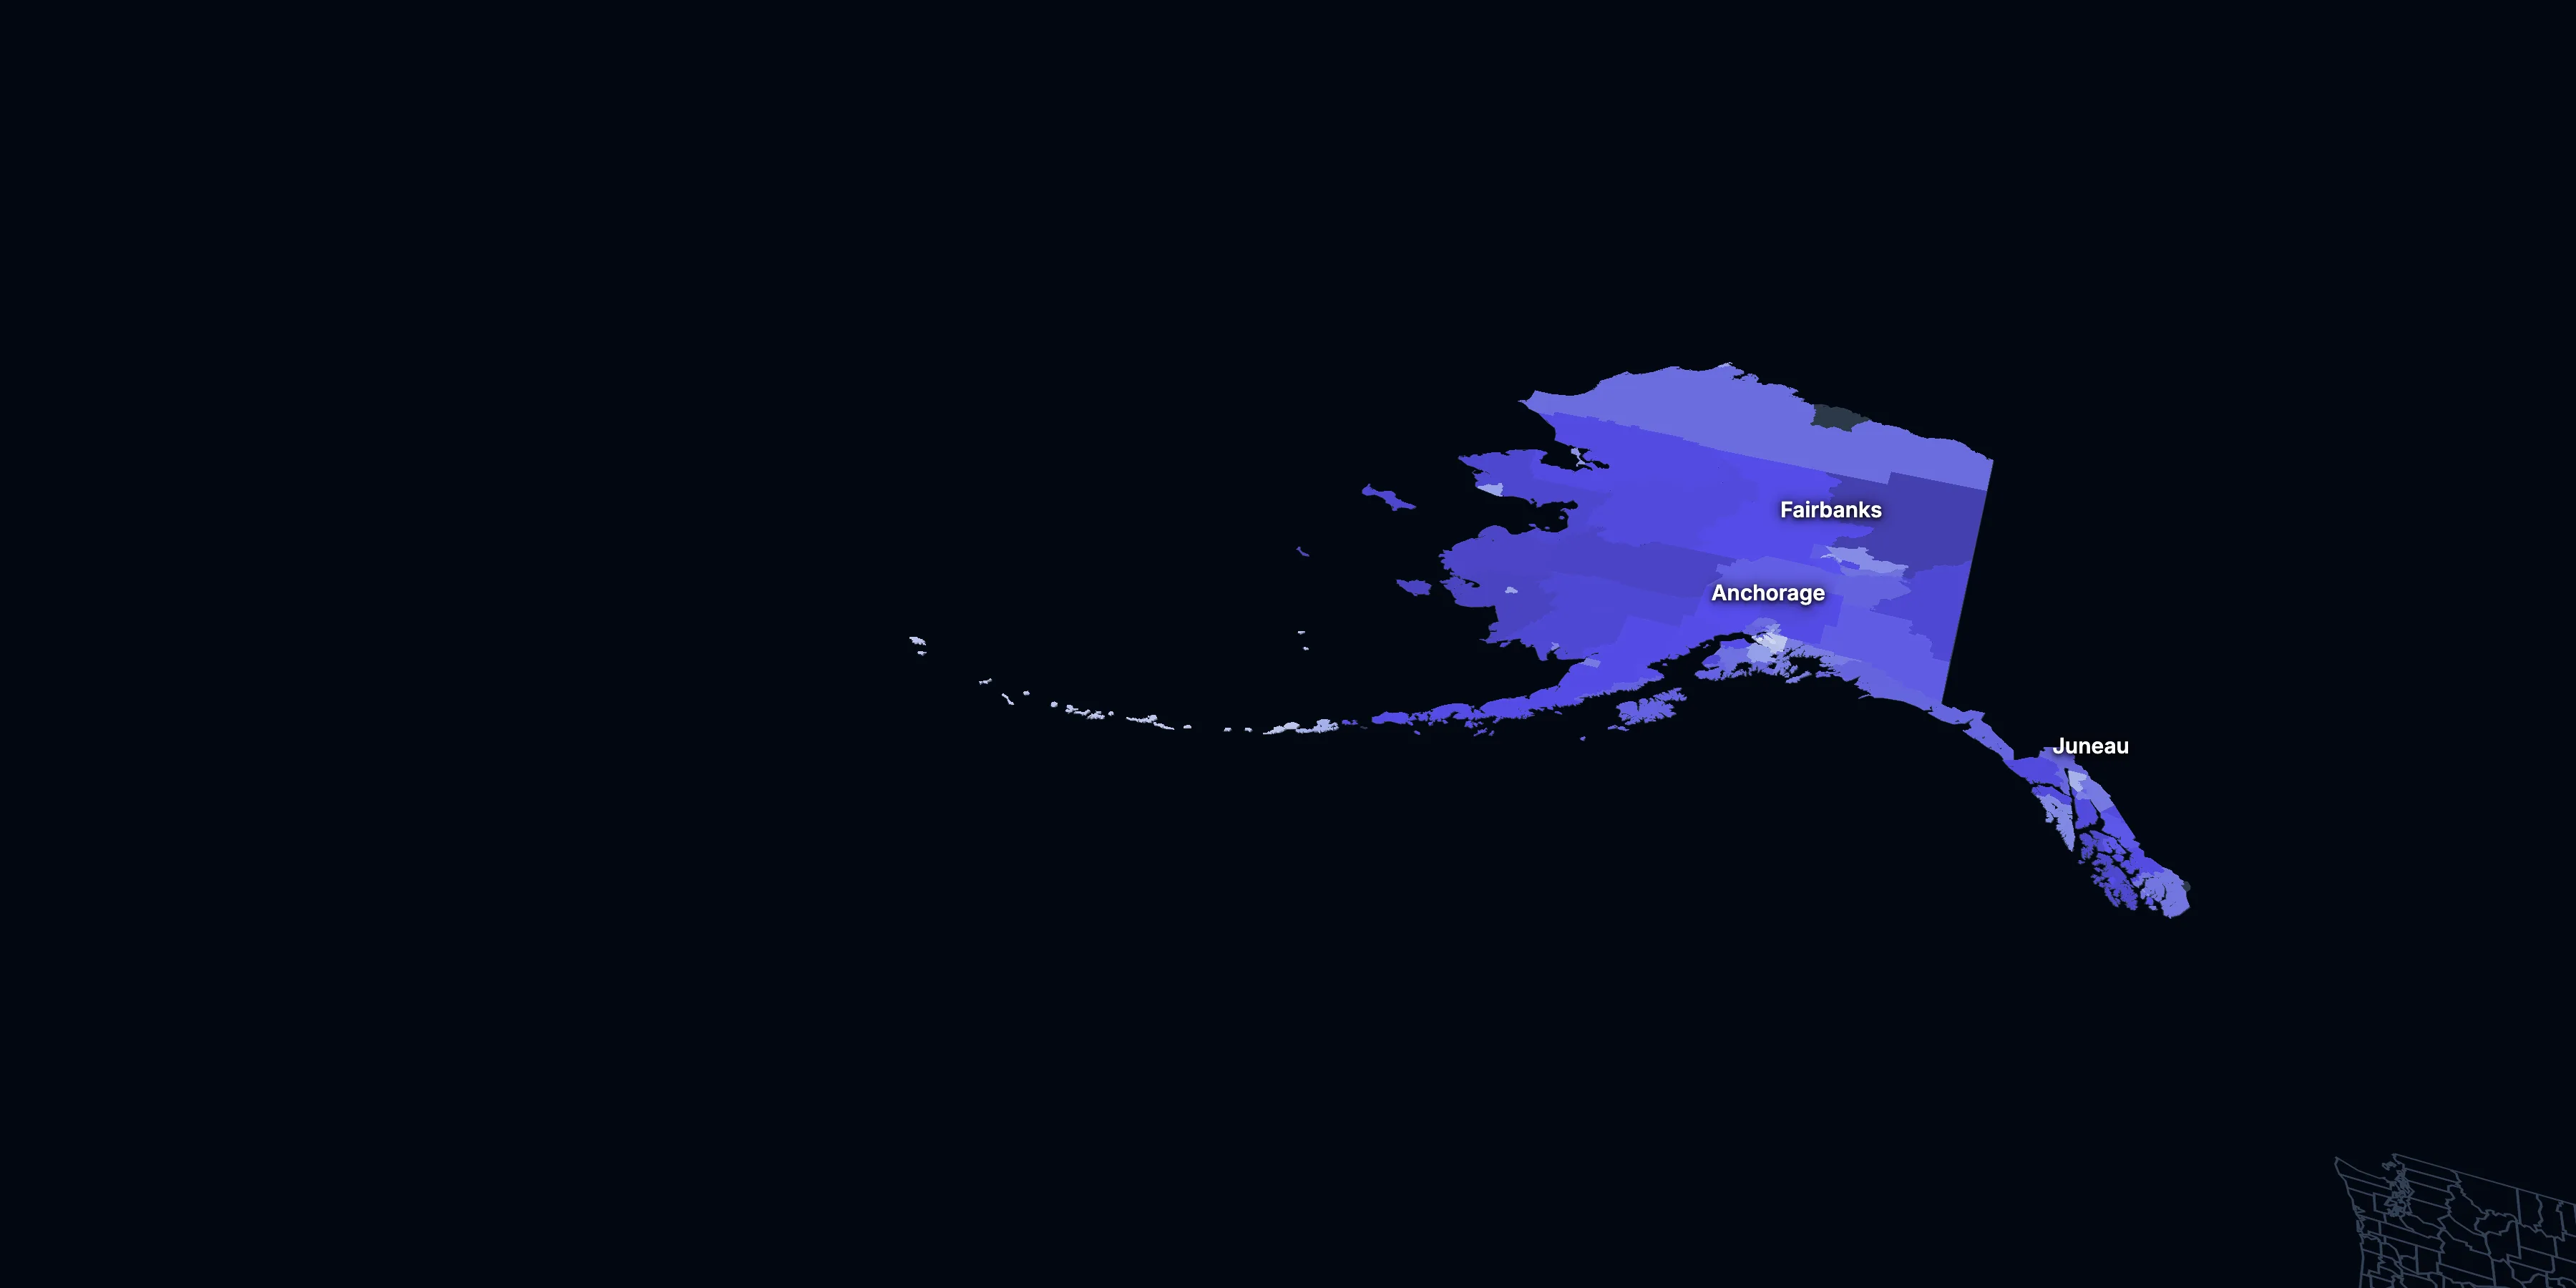
Taller, lighter tracts have higher household incomes
About Alaska
Alaska’s median household income is $95,220 (±$4,301), higher than the US ($84,780), and its median age is 37.0 (±0.3), according to the ACS 2025 1-year estimates. Its largest community is Anchorage.
± is each figure’s margin of error, at 90% confidence, and † marks one too uncertain to lean on. Under each percentage in the tables is the number it counts. How the margins are worked out.
FIPS code 02
Highlights
What stands out in Alaska
The numbers where Alaska sits furthest from the nation, or past a recognized policy benchmark.
Furthest from the national picture
9.7%
Highest among statesVeterans (adults)
That’s higher than the US (5.9%). It’s the highest of the 50 states and DC.
18.7%
3rd lowest among statesCommute 30 minutes or more
That’s lower than the US (39.2%). It’s the 3rd lowest of the 50 states and DC.
13.6%
1.5× the USNo health insurance
That’s higher than the US (8.4%). It’s the 7th highest of the 50 states and DC.
15.8%
Lower than the US65 and over
That’s lower than the US (19.0%). It’s the 4th lowest of the 50 states and DC.
7.1%
Lower than the USWork from home
That’s lower than the US (12.9%).
7.6%
Lower than the USBorn outside the US
That’s lower than the US (14.7%).
2015 to 2025
How Alaska changed in ten years
The state lost 1,162 people. It got older and better educated, and poverty rose 0.6 points.
Population, change since 2015
−0.2% in the state and +6.3% in the US.
Source: ACS 1-year, 2015 to 2025, table A00001.
Show data
| Alaska | United States | |
|---|---|---|
| 2015 | 0.0% | 0.0% |
| 2016 | +0.5% | +0.5% |
| 2017 | +0.2% | +1.3% |
| 2018 | −0.1% | +1.8% |
| 2019 | −0.9% | +2.1% |
| 2021 | −0.8% | +3.3% |
| 2022 | −0.7% | +3.7% |
| 2023 | −0.7% | +4.2% |
| 2024 | +0.2% | +5.8% |
| 2025 | −0.2% | +6.3% |
Embed
Median household income, in 2025 dollars
−5.3% in the state and +10.9% in the US.
Source: ACS 1-year, 2015 to 2025, table A14006.
Show data
| Alaska | United States | |
|---|---|---|
| 2015 | $100,498 | $76,413 |
| 2016 | $103,391 | $77,931 |
| 2017 | $96,899 | $79,891 |
| 2018 | $96,099 | $80,059 |
| 2019 | $95,807 | $83,427 |
| 2021 | $93,258 | $83,521 |
| 2022 | $97,617 | $82,811 |
| 2023 | $92,165 | $82,683 |
| 2024 | $98,871 | $84,339 |
| 2025 | $95,220 | $84,780 |
Embed
Living in poverty
+0.6 points in the state and −3.0 points in the US.
Source: ACS 1-year, 2015 to 2025, table A13004.
Show data
| Alaska | United States | |
|---|---|---|
| 2015 | 10.3% | 14.7% |
| 2016 | 9.9% | 14.0% |
| 2017 | 11.1% | 13.4% |
| 2018 | 10.9% | 13.1% |
| 2019 | 10.1% | 12.3% |
| 2021 | 10.5% | 12.8% |
| 2022 | 11.0% | 12.6% |
| 2023 | 10.4% | 12.5% |
| 2024 | 10.2% | 12.1% |
| 2025 | 11.0% | 11.8% |
Embed
Bachelor’s degree or more
+3.3 points in the state and +6.7 points in the US.
Source: ACS 1-year, 2015 to 2025, table A12001.
Show data
| Alaska | United States | |
|---|---|---|
| 2015 | 29.7% | 30.6% |
| 2016 | 29.6% | 31.3% |
| 2017 | 28.8% | 32.0% |
| 2018 | 30.2% | 32.6% |
| 2019 | 30.2% | 33.1% |
| 2021 | 32.8% | 35.0% |
| 2022 | 30.6% | 35.7% |
| 2023 | 32.2% | 36.2% |
| 2024 | 32.8% | 36.8% |
| 2025 | 32.9% | 37.4% |
Embed
Median gross rent, in 2025 dollars
−5.8% in the state and +18.5% in the US.
Source: ACS 1-year, 2015 to 2025, table A18009.
Show data
| Alaska | United States | |
|---|---|---|
| 2015 | $1,593 | $1,314 |
| 2016 | $1,634 | $1,327 |
| 2017 | $1,590 | $1,340 |
| 2018 | $1,521 | $1,368 |
| 2019 | $1,525 | $1,393 |
| 2021 | $1,508 | $1,427 |
| 2022 | $1,472 | $1,440 |
| 2023 | $1,461 | $1,496 |
| 2024 | $1,492 | $1,537 |
| 2025 | $1,500 | $1,557 |
Embed
Median home value, in 2025 dollars
+8.3% in the state and +39.3% in the US.
Source: ACS 1-year, 2015 to 2025, table A10036.
Show data
| Alaska | United States | |
|---|---|---|
| 2015 | $355,657 | $266,469 |
| 2016 | $362,220 | $277,278 |
| 2017 | $361,612 | $288,124 |
| 2018 | $356,884 | $296,908 |
| 2019 | $357,008 | $305,336 |
| 2021 | $365,269 | $337,116 |
| 2022 | $373,206 | $355,481 |
| 2023 | $369,697 | $361,931 |
| 2024 | $389,118 | $372,685 |
| 2025 | $385,100 | $371,100 |
Embed
ACS 1-year estimates. The dotted stretch of each line spans 2020, when the Census Bureau released no standard 1-year estimates. Dollar values are in 2025 dollars.
| Indicator | 2015 | 2025 | Change |
|---|---|---|---|
| Population | 738,432 | 737,270 | −0.2% |
| Median age | 33.3 | 37.0 | +3.7 years |
| 65 and over | 9.6% | 15.8% | +6.2 points |
| Born outside the US | 7.9% | 7.6% | −0.3 points |
| Hispanic or Latino | 7.0% | 8.2% | +1.2 points |
| Median household income | $100,498 | $95,220 | −5.3% |
| Living in poverty | 10.3% | 11.0% | +0.6 points |
| Bachelor’s degree or more | 29.7% | 32.9% | +3.3 points |
| Households that rent | 36.1% | 33.5% | −2.6 points |
| Median gross rent | $1,593 | $1,500 | −5.8% |
| Median home value | $355,657 | $385,100 | +8.3% |
177 census tracts
Alaska, tract by tract
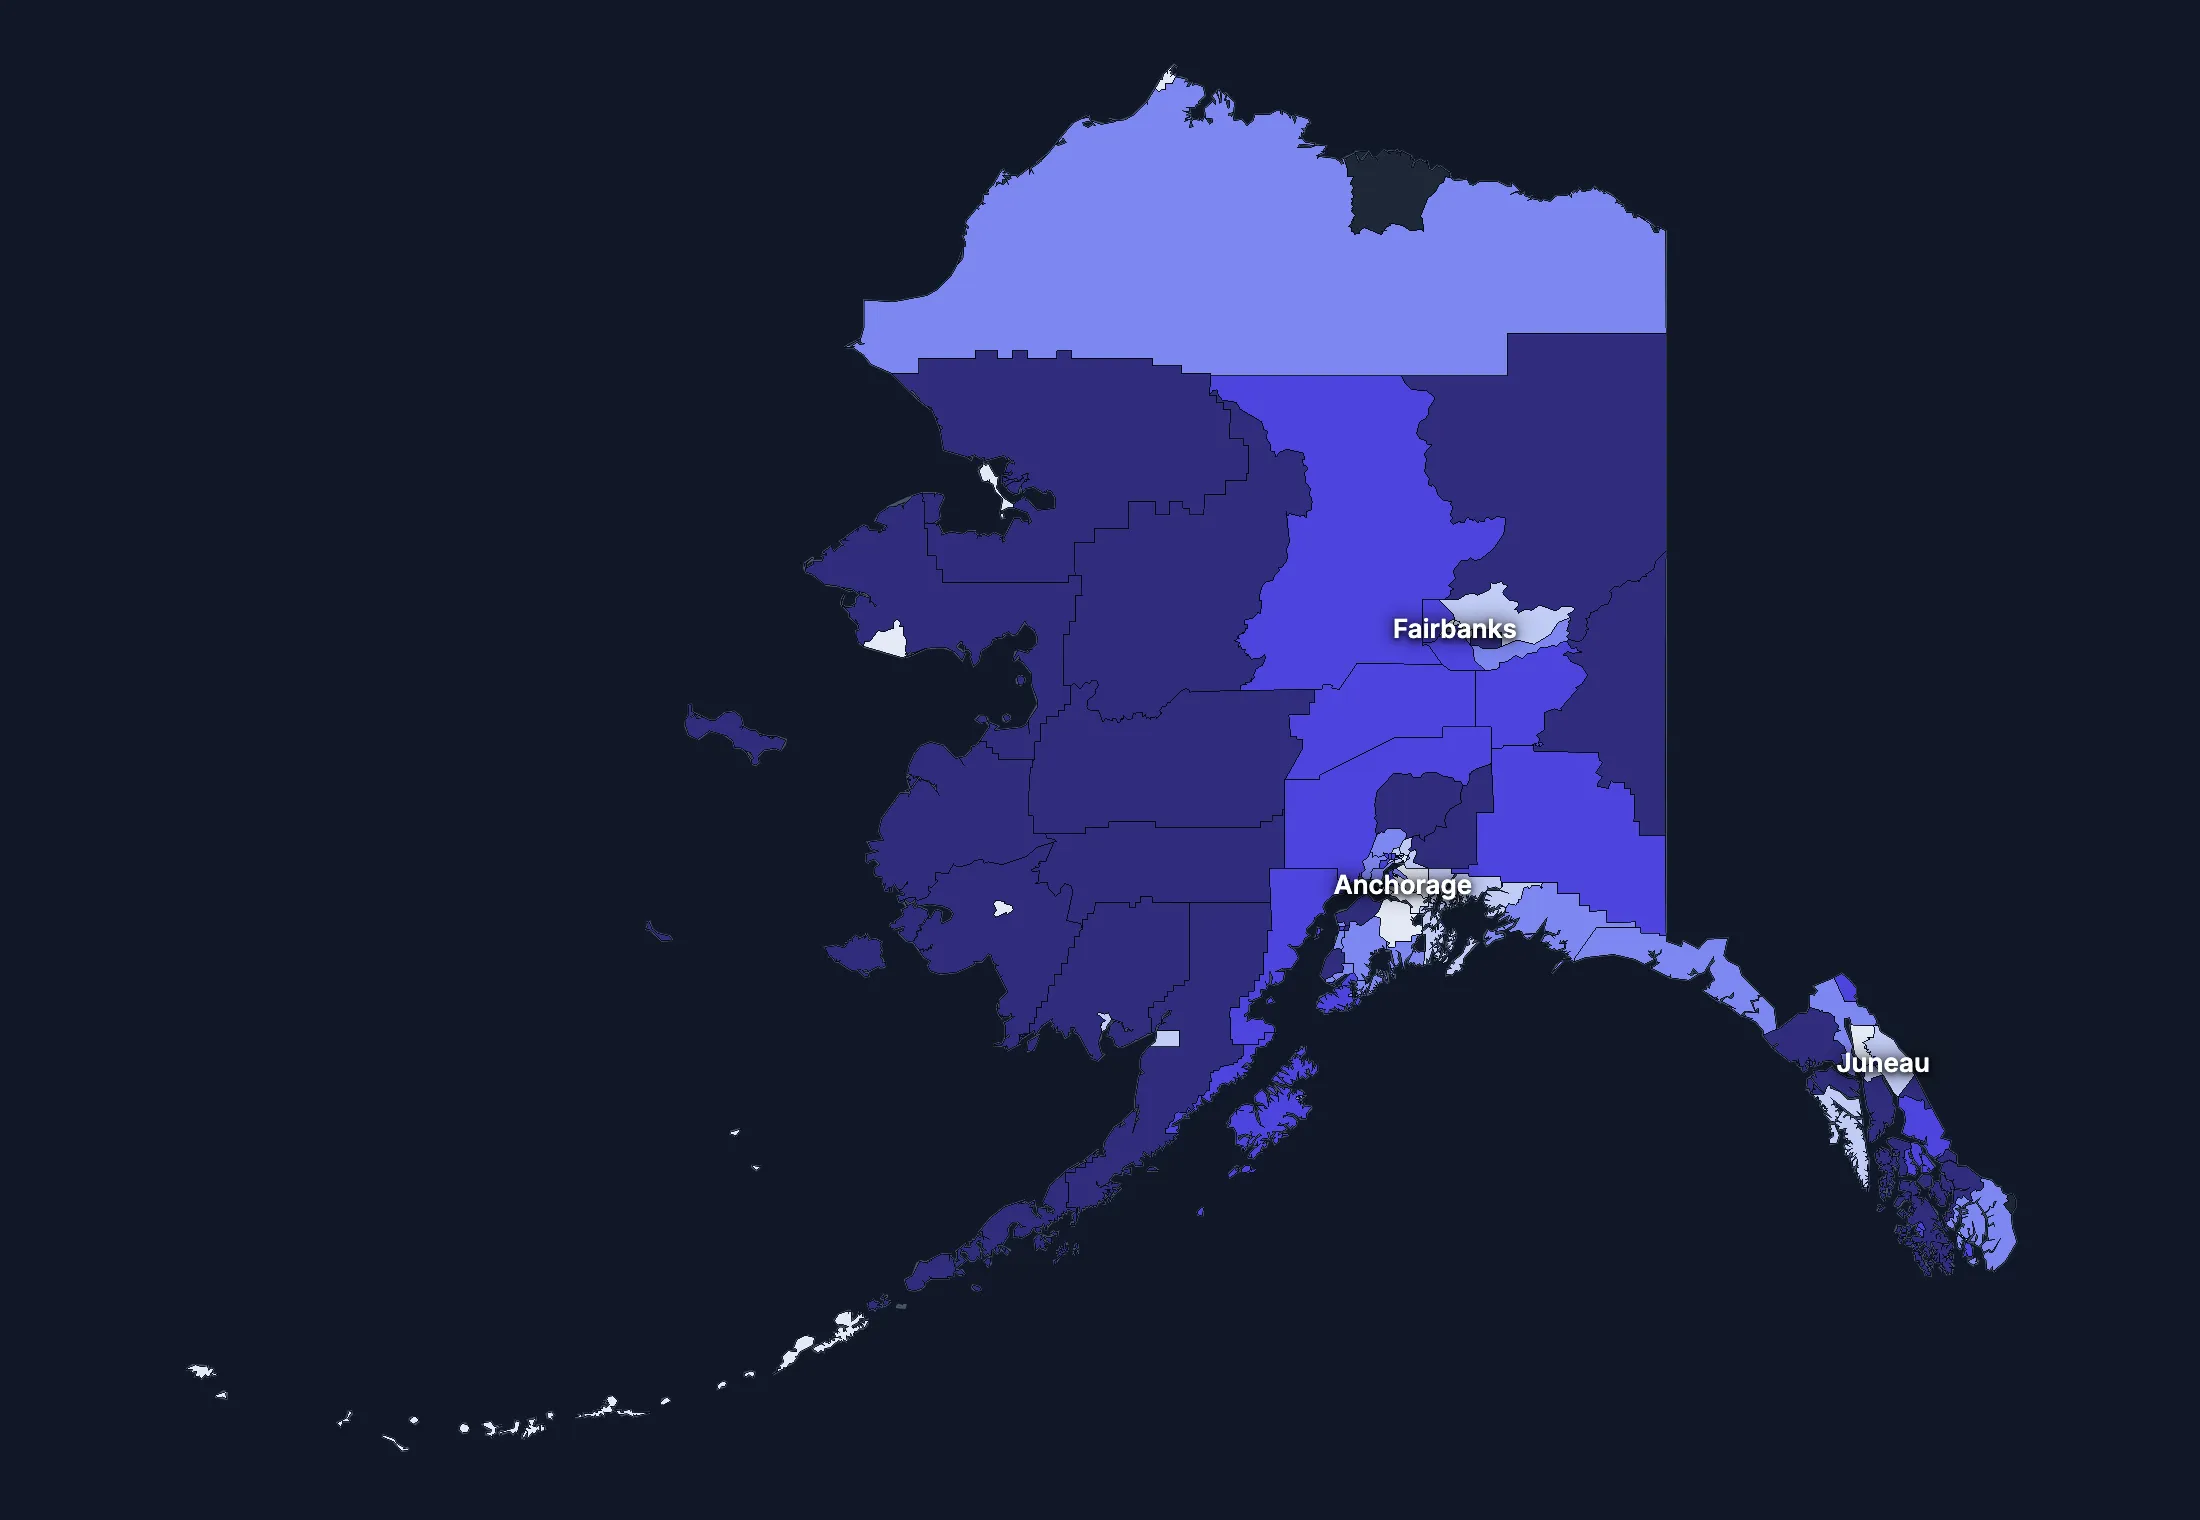
State averages hide a lot. These census tracts are the closest the census comes to neighborhoods.
Where the state’s average misleads
Each tick is one census tract, and the dark line marks the state. Hover over a tick or tap it to see the tract.
Poverty
31 of 175 tracts are at least 1.5 times the state’s overall 10.1%, and 35 are at two-thirds of it or less.
Highest: Tract 6.01, 57.4%. Lowest: Tract 13, 0.6%.
Renters paying 30% or more of income
12 of 165 tracts are at least 1.5 times the state’s overall 40.5%, and 47 are at two-thirds of it or less.
Highest: Tract 15, 84.8%. Lowest: Tract 1.01, 0.0%.
Adults with a bachelor’s degree
22 of 175 tracts are at least 1.5 times the state’s overall 31.7%, and 45 are at two-thirds of it or less.
Highest: Tract 28.23, 72.5%. Lowest: Tract 1, 4.2%.
Median household income
17 of 174 tracts are at least 1.5 times the typical tract’s $88,410, and 16 are at two-thirds of it or less.
Highest: Tract 28.13, $239,125. Lowest: Tract 1, $26,691.
American Community Survey 2020–2024 5-year estimates, by census tract. Income is capped at $250,000+ by the Census Bureau.
People
Who lives in Alaska
Its median age of 37.0 is lower than the US (39.5). 7.6% of residents were born outside the US, and 15.4% speak a language other than English at home.
Age
Source: ACS 2025 1-year, table A01001.
Show data
| Alaska | United States | |
|---|---|---|
| Under 18 | 23.2% ±0.8% , number 170,804 ±6,060 | 21.0% ±<0.1% , number 71,689,151 ±111,800 |
| 18 to 24 | 9.3% ±0.6% , number 68,201 ±4,276 | 9.3% ±<0.1% , number 31,716,680 ±98,660 |
| 25 to 34 | 14.5% ±0.5% , number 106,713 ±3,890 | 13.6% ±<0.1% , number 46,357,354 ±55,690 |
| 35 to 44 | 15.2% ±0.8% , number 111,973 ±5,723 | 13.4% ±<0.1% , number 45,746,189 ±105,700 |
| 45 to 54 | 10.9% ±0.4% , number 80,284 ±3,142 | 11.8% ±<0.1% , number 40,257,563 ±53,540 |
| 55 to 64 | 11.2% ±0.6% , number 82,449 ±4,407 | 12.1% ±<0.1% , number 41,242,904 ±104,700 |
| 65 to 74 | 10.2% ±0.5% , number 75,439 ±3,886 | 10.8% ±<0.1% , number 36,895,650 ±91,520 |
| 75 and over | 5.6% ±0.4% , number 41,407 ±2,613 | 8.2% ±<0.1% , number 27,879,368 ±78,140 |
Embed
Race and ethnicity
Source: ACS 2025 1-year, table A04001.
Show data
| Alaska | United States | |
|---|---|---|
| White, not Hispanic | 55.8% ±0.2% , number 411,209 ±1,651 | 55.0% ±<0.1% , number 187,959,031 ±58,340 |
| Hispanic or Latino | 8.2% ±<0.1% , number 60,499 ±291 | 20.5% ±<0.1% , number 69,975,516 ±13,270 |
| Black, not Hispanic | 3.0% ±0.3% , number 22,428 ±2,111 | 11.7% ±<0.1% , number 40,096,453 ±106,200 |
| Asian, not Hispanic | 6.5% ±0.4% , number 48,037 ±2,767 | 6.5% ±<0.1% , number 22,096,709 ±58,340 |
| Other or multiracial | 26.5% ±1.1% , number 195,097 ±7,827 | 6.3% ±<0.1% , number 21,657,150 ±150,100 |
Embed
Language spoken at home
Source: ACS 2025 1-year, table C16001.
Show data
| Alaska | United States | |
|---|---|---|
| English only | 84.6% ±1.0% , number 586,946 ±7,266 | 77.1% ±0.1% , number 249,390,588 ±275,300 |
| Spanish | 3.1% ±0.5% , number 21,273 ±3,438 | 13.9% ±0.1% , number 44,921,985 ±177,800 |
| Other Indo-European | 2.6% ±0.6% , number 17,737 ±3,877 | 4.0% ±<0.1% , number 12,862,980 ±113,500 |
| Asian and Pacific Island | 5.9% ±0.7% , number 40,916 ±4,888 | 3.8% ±<0.1% , number 12,288,841 ±99,740 |
| Arabic and other | 3.9% ±0.5% , number 26,826 ±3,787 | 1.3% ±<0.1% , number 4,116,949 ±71,480 |
Embed
Marital status
Source: ACS 2025 1-year, table A11001.
Show data
| Alaska | United States | |
|---|---|---|
| Now married | 48.5% ±1.2% , number 288,369 ±7,039 | 47.9% ±0.1% , number 135,567,564 ±223,300 |
| Never married | 34.8% ±1.0% , number 206,886 ±6,201 | 34.8% ±0.1% , number 98,647,238 ±152,600 |
| Divorced | 11.3% ±0.8% , number 67,056 ±4,464 | 10.2% ±<0.1% , number 28,879,967 ±112,900 |
| Widowed | 4.2% ±0.4% , number 24,878 ±2,318 | 5.5% ±<0.1% , number 15,599,094 ±69,430 |
| Separated | 1.3% ±0.2% , number 7,530 ±1,475 | 1.6% ±<0.1% , number 4,441,399 ±49,160 |
Embed
Where people lived a year ago
Source: ACS 2025 1-year, table A08001.
Show data
| Alaska | United States | |
|---|---|---|
| Same home | 86.5% ±1.2% , number 630,480 ±8,591 | 88.4% ±0.1% , number 298,889,697 ±214,800 |
| Same county | 7.3% ±0.9% , number 53,207 ±6,643 | 6.0% ±<0.1% , number 20,202,671 ±166,300 |
| Another county in the state | 1.9% ±0.4% , number 13,510 ±2,889 | 3.0% ±<0.1% , number 10,168,097 ±89,190 |
| Another state | 4.0% ±0.6% , number 29,497 ±4,668 | 2.1% ±<0.1% , number 7,025,589 ±81,660 |
| Another country | 0.4% ±0.1% , number 2,557 ±990 | 0.6% ±<0.1% , number 1,984,943 ±47,210 |
Embed
Top countries of birth, among those born abroad
Source: ACS 2020–2024 5-year, table A07001.
Show data
| Alaska | |
|---|---|
| Philippines | 32.2% , number 18,252 |
| Korea | 5.6% , number 3,188 |
| Mexico | 5.5% , number 3,147 |
| Canada | 4.3% , number 2,451 |
| Thailand | 3.9% , number 2,227 |
| Ukraine | 2.6% , number 1,493 |
Embed
All the numbers
| Indicator | Alaska | US | Rank among states* | Table |
|---|---|---|---|---|
| Population | 737,270 | 341,784,859 | 48th | A00001 |
| People per square mile | 1 | 97 | 51st | A00002 |
| Land area (square miles) | 571,390 | – | – | A00002 |
| Median age | 37.0 ±0.3 | 39.5 ±0.1 | 48th | A01004 |
| Under 18 | 23.2% ±0.8% , number 170,804 ±6,060 | 21.0% ±<0.1% , number 71,689,151 ±111,800 | 6th | B02002 |
| 65 and over | 15.8% ±0.6% , number 116,846 ±4,683 | 19.0% ±<0.1% , number 64,775,018 ±120,300 | 48th | B02002 |
| Born outside the US | 7.6% ±0.6% , number 56,023 ±4,553 | 14.7% ±0.1% , number 50,409,320 ±204,800 | 27th | A06001 |
| Speak a language other than English at home | 15.4% ±1.0% , number 106,752 ±8,068 | 22.9% ±0.1% , number 74,190,755 ±244,000 | 23rd | C16001 |
| Veterans (adults) | 9.7% ±0.7% , number 53,052 ±3,567 | 5.9% ±<0.1% , number 15,746,228 ±85,320 | 1st | A16002 |
| Living with a disability | 13.6% ±0.7% , number 96,726 ±5,173 | 13.7% ±<0.1% , number 46,271,455 ±126,000 | 27th | B18101 |
| Women 15–50 who had a baby in the past year | 5.8% ±1.1% , number 9,680 ±1,776 | 5.0% ±0.1% , number 4,016,759 ±44,040 | 8th | B13002 |
| Lived in the same home a year ago | 86.5% ±1.2% , number 630,480 ±8,591 | 88.4% ±0.1% , number 298,889,697 ±214,800 | 46th | A08001 |
| White, not Hispanic | 55.8% ±0.2% , number 411,209 ±1,651 | 55.0% ±<0.1% , number 187,959,031 ±58,340 | 37th | A04001 |
| Hispanic or Latino | 8.2% ±<0.1% , number 60,499 ±291 | 20.5% ±<0.1% , number 69,975,516 ±13,270 | 35th | A04001 |
| Black, not Hispanic | 3.0% ±0.3% , number 22,428 ±2,111 | 11.7% ±<0.1% , number 40,096,453 ±106,200 | 40th | A04001 |
| Asian, not Hispanic | 6.5% ±0.4% , number 48,037 ±2,767 | 6.5% ±<0.1% , number 22,096,709 ±58,340 | 10th | A04001 |
*1 is the highest. Population is ranked among all states, and the rest among those of 1,000 people or more, whose figures can be ranked. Ranks use 5-year estimates, the only ones covering every state, so they can differ slightly from the figures here.
Income and work
Higher incomes, but a wide coverage gap
The median household income is $95,220, higher than the US ($84,780). 11.0% of people live in poverty, and 13.6% have no health insurance, higher than the US (8.4%).
Household income
Source: ACS 2025 1-year, table A14001.
Show data
| Alaska | United States | |
|---|---|---|
| Under $25,000 | 10.5% ±1.0% , number 29,198 ±2,920 | 14.0% ±0.1% , number 18,727,548 ±88,990 |
| $25,000 to $49,999 | 14.6% ±1.3% , number 40,851 ±3,642 | 15.4% ±0.1% , number 20,665,585 ±101,400 |
| $50,000 to $74,999 | 14.7% ±1.4% , number 40,899 ±4,056 | 15.3% ±0.1% , number 20,513,565 ±88,500 |
| $75,000 to $99,999 | 12.2% ±1.1% , number 34,017 ±3,162 | 12.5% ±0.1% , number 16,814,245 ±87,520 |
| $100,000 to $149,999 | 19.2% ±1.6% , number 53,644 ±4,471 | 17.9% ±0.1% , number 24,018,984 ±99,670 |
| $150,000 to $199,999 | 12.3% ±1.3% , number 34,272 ±3,702 | 10.1% ±0.1% , number 13,521,827 ±70,660 |
| $200,000 or more | 16.5% ±1.2% , number 46,039 ±3,465 | 14.8% ±0.1% , number 19,801,668 ±84,120 |
Embed
What residents do for work
Source: ACS 2025 1-year, table A17004.
Show data
| Alaska | United States | |
|---|---|---|
| Education and health care | 24.3% ±1.2% , number 84,852 ±4,452 | 24.4% ±0.1% , number 40,862,193 ±140,800 |
| Public administration | 11.8% ±1.2% , number 41,117 ±4,384 | 4.7% ±<0.1% , number 7,944,601 ±69,540 |
| Transportation and warehousing | 11.1% ±1.0% , number 38,637 ±3,644 | 5.9% ±<0.1% , number 9,832,211 ±73,020 |
| Retail trade | 10.4% ±1.0% , number 36,205 ±3,677 | 10.6% ±0.1% , number 17,781,181 ±96,660 |
| Arts, food and lodging | 8.6% ±1.1% , number 29,987 ±3,997 | 8.9% ±0.1% , number 14,811,502 ±87,840 |
| Professional and business services | 8.2% ±0.9% , number 28,545 ±3,205 | 12.8% ±0.1% , number 21,375,231 ±87,110 |
| Construction | 7.3% ±1.0% , number 25,426 ±3,551 | 6.7% ±<0.1% , number 11,254,981 ±79,620 |
| Agriculture and mining | 4.0% ±0.5% , number 13,851 ±1,862 | 1.4% ±<0.1% , number 2,287,596 ±30,080 |
Embed
All the numbers
| Indicator | Alaska | US | Rank among states* | Table |
|---|---|---|---|---|
| Median household income | $95,220 ±$4,301 | $84,780 ±$215 | 13th | A14006 |
| Income per person | $48,244 ±$1,544 | $47,171 ±$115 | 14th | A14024 |
| Income inequality (Gini index) | 0.442 ±0.012 | 0.482 ±0.001 | 50th | A14028 |
| Living in poverty | 11.0% ±1.2% , number 78,839 ±8,342 | 11.8% ±0.1% , number 39,264,183 ±277,400 | 39th | A13004 |
| Unemployment rate | 5.2% ±0.7% , number 19,142 ±2,775 | 4.9% ±<0.1% , number 8,574,594 ±64,350 | 8th | A17005 |
| No health insurance | 13.6% ±0.8% , number 96,164 ±5,870 | 8.4% ±<0.1% , number 28,323,306 ±152,000 | 7th | A20001 |
*1 is the highest. Population is ranked among all states, and the rest among those of 1,000 people or more, whose figures can be ranked. Ranks use 5-year estimates, the only ones covering every state, so they can differ slightly from the figures here.
Education
Fewer college degrees than the US
32.9% of adults 25 and over have a bachelor’s degree or more, lower than the US (37.4%).
Highest level of education
Source: ACS 2025 1-year, table A12001.
Show data
| Alaska | United States | |
|---|---|---|
| Less than high school | 5.9% ±0.6% , number 29,487 ±3,144 | 9.4% ±0.1% , number 22,321,002 ±120,500 |
| High school only | 27.6% ±1.4% , number 137,392 ±6,812 | 25.6% ±0.1% , number 61,096,726 ±203,400 |
| Some college | 33.6% ±1.5% , number 167,213 ±7,427 | 27.7% ±0.1% , number 65,920,977 ±173,500 |
| Bachelor’s degree | 19.6% ±1.0% , number 97,746 ±5,204 | 22.3% ±0.1% , number 53,224,312 ±196,700 |
| Graduate degree | 13.3% ±1.0% , number 66,427 ±5,047 | 15.0% ±0.1% , number 35,816,011 ±159,400 |
Embed
All the numbers
| Indicator | Alaska | US | Rank among states* | Table |
|---|---|---|---|---|
| Bachelor’s degree or more | 32.9% ±1.4% , number 164,173 ±7,250 | 37.4% ±0.1% , number 89,040,323 ±253,200 | 37th | A12001 |
| High school graduate or more | 94.1% ±2.4% , number 468,778 ±12,410 | 90.6% ±0.2% , number 216,058,026 ±368,200 | 9th | A12001 |
*1 is the highest. Population is ranked among all states, and the rest among those of 1,000 people or more, whose figures can be ranked. Ranks use 5-year estimates, the only ones covering every state, so they can differ slightly from the figures here.
Housing
Home values outran incomes
33.5% of households rent, about the same as the US (34.7%). The median home is worth $385,100 and the median rent is $1,500. After inflation, home values rose 8% from 2015 to 2025, while household income fell 5%.
Housing costs and income, 2015 to 2025, after inflation
Source: ACS 1-year, table A10036, A18009, A14006.
Show data
| Alaska | United States | |
|---|---|---|
| Median home value | +8.3% | +39.3% |
| Median rent | −5.8% | +18.5% |
| Median household income | −5.3% | +10.9% |
Embed
Types of homes
Source: ACS 2025 1-year, table A10032.
Show data
| Alaska | United States | |
|---|---|---|
| Single-family, detached | 61.9% ±1.5% , number 204,748 ±5,137 | 60.9% ±0.1% , number 90,335,844 ±173,300 |
| Single-family, attached | 8.5% ±0.9% , number 28,080 ±2,993 | 6.4% ±<0.1% , number 9,527,703 ±51,230 |
| 2 to 4 units | 13.5% ±1.3% , number 44,469 ±4,162 | 7.5% ±0.1% , number 11,109,005 ±75,790 |
| 5 to 19 units | 7.4% ±1.0% , number 24,345 ±3,241 | 8.7% ±0.1% , number 12,829,882 ±97,590 |
| 20 or more units | 4.8% ±0.7% , number 16,023 ±2,418 | 11.1% ±0.1% , number 16,381,450 ±92,310 |
| Mobile homes and other | 3.9% ±0.6% , number 12,873 ±2,099 | 5.4% ±<0.1% , number 8,045,083 ±53,680 |
Embed
When homes were built
Source: ACS 2025 1-year, table A10055.
Show data
| Alaska | United States | |
|---|---|---|
| 2010 or later | 12.4% ±1.2% , number 34,591 ±3,421 | 15.1% ±0.1% , number 20,257,912 ±101,300 |
| 2000 to 2009 | 16.3% ±1.3% , number 45,361 ±3,607 | 13.8% ±0.1% , number 18,535,840 ±92,260 |
| 1980 to 1999 | 35.6% ±1.8% , number 99,318 ±5,171 | 24.1% ±0.1% , number 32,332,570 ±118,900 |
| 1960 to 1979 | 29.4% ±1.7% , number 81,969 ±4,876 | 22.9% ±0.1% , number 30,726,302 ±110,000 |
| Before 1960 | 6.3% ±0.8% , number 17,681 ±2,303 | 24.0% ±0.1% , number 32,210,798 ±121,500 |
Embed
All the numbers
| Indicator | Alaska | US | Rank among states* | Table |
|---|---|---|---|---|
| Housing units | 330,538 ±668 | – | – | A10001 |
| Households | 278,920 ±3,561 | – | – | A10008 |
| People per household | 2.53 ±0.03 | 2.49 ±0.01 | 9th | A10003 |
| Households that rent | 33.5% ±1.5% , number 93,426 ±4,378 | 34.7% ±0.1% , number 46,551,688 ±193,200 | 20th | A10060 |
| Vacant homes | 15.6% ±1.1% , number 51,618 ±3,688 | 9.6% ±0.1% , number 14,165,545 ±137,100 | 3rd | A10047, A10060 |
| Median gross rent | $1,500 ±$44 | $1,557 ±$4 | 18th | A18009 |
| Median home value | $385,100 ±$8,954 | $371,100 ±$646 | 21st | A10036 |
| Renters paying 30% or more of income | 39.3% ±4.1% , number 36,736 ±4,184 | 48.3% ±0.2% , number 22,486,693 ±122,100 | 47th | A18002 |
| Owners paying 30% or more of income | 20.7% ±1.8% , number 38,398 ±3,352 | 24.2% ±0.1% , number 21,201,943 ±93,050 | 18th | A10040 |
| Homes built before 1960 | 6.3% ±0.8% , number 17,681 ±2,303 | 24.0% ±0.1% , number 32,210,798 ±121,500 | 50th | A10055 |
*1 is the highest. Population is ranked among all states, and the rest among those of 1,000 people or more, whose figures can be ranked. Ranks use 5-year estimates, the only ones covering every state, so they can differ slightly from the figures here.
Getting around
How people get around
66.6% of workers drive alone and 7.1% work from home. 18.7% of those who travel to work spend 30 minutes or more getting there, and 9.3% of households have no vehicle.
How people get to work
Source: ACS 2025 1-year, table A09005.
Show data
| Alaska | United States | |
|---|---|---|
| Drive alone | 66.6% ±1.5% , number 239,681 ±6,703 | 69.8% ±0.1% , number 115,297,377 ±192,900 |
| Carpool | 13.6% ±1.5% , number 48,746 ±5,615 | 8.9% ±0.1% , number 14,712,170 ±97,240 |
| Public transit | 1.4% ±0.5% , number 5,156 ±1,695 | 4.3% ±<0.1% , number 7,100,386 ±63,330 |
| Walk | 6.6% ±0.5% , number 23,676 ±2,003 | 2.4% ±<0.1% , number 4,016,469 ±41,070 |
| Work from home | 7.1% ±0.7% , number 25,556 ±2,613 | 12.9% ±0.1% , number 21,288,393 ±105,700 |
| Other | 4.7% ±0.6% , number 16,832 ±2,013 | 1.7% ±<0.1% , number 2,799,658 ±41,510 |
Embed
Time spent getting to work
Source: ACS 2025 1-year, table B09001.
Show data
| Alaska | United States | |
|---|---|---|
| Under 10 minutes | 26.5% ±1.4% , number 88,676 ±4,970 | 12.0% ±0.1% , number 17,199,225 ±93,440 |
| 10 to 19 minutes | 38.5% ±1.9% , number 128,508 ±6,647 | 27.8% ±0.1% , number 40,059,540 ±137,700 |
| 20 to 29 minutes | 16.3% ±1.6% , number 54,367 ±5,412 | 21.0% ±0.1% , number 30,221,743 ±111,100 |
| 30 to 39 minutes | 8.1% ±0.9% , number 27,047 ±3,117 | 17.1% ±0.1% , number 24,659,138 ±103,800 |
| 40 to 59 minutes | 5.1% ±0.8% , number 16,921 ±2,583 | 12.6% ±0.1% , number 18,104,709 ±97,070 |
| 60 minutes or more | 5.6% ±0.8% , number 18,572 ±2,634 | 9.5% ±0.1% , number 13,681,705 ±84,440 |
Embed
Vehicles per household
Source: ACS 2025 1-year, table A10030.
Show data
| Alaska | United States | |
|---|---|---|
| None | 9.3% ±0.7% , number 26,035 ±2,068 | 8.8% ±0.1% , number 11,781,997 ±77,240 |
| One | 30.8% ±1.8% , number 85,895 ±5,117 | 33.1% ±0.1% , number 44,424,682 ±160,700 |
| Two | 33.5% ±1.7% , number 93,531 ±4,892 | 36.0% ±0.1% , number 48,200,889 ±176,800 |
| Three or more | 26.3% ±1.7% , number 73,459 ±4,795 | 22.1% ±0.1% , number 29,655,854 ±113,300 |
Embed
All the numbers
| Indicator | Alaska | US | Rank among states* | Table |
|---|---|---|---|---|
| Drive to work alone | 66.6% ±1.5% , number 239,681 ±6,703 | 69.8% ±0.1% , number 115,297,377 ±192,900 | 44th | A09005 |
| Take public transit | 1.4% ±0.5% , number 5,156 ±1,695 | 4.3% ±<0.1% , number 7,100,386 ±63,330 | 22nd | A09005 |
| Work from home | 7.1% ±0.7% , number 25,556 ±2,613 | 12.9% ±0.1% , number 21,288,393 ±105,700 | 41st | A09005 |
| Commute 30 minutes or more | 18.7% ±1.4% , number 62,540 ±4,830 | 39.2% ±0.1% , number 56,445,552 ±165,300 | 49th | B09001 |
| Households with no vehicle | 9.3% ±0.8% , number 26,035 ±2,161 | 8.8% ±<0.1% , number 11,781,997 ±64,240 | 8th | A10030 |
*1 is the highest. Population is ranked among all states, and the rest among those of 1,000 people or more, whose figures can be ranked. Ranks use 5-year estimates, the only ones covering every state, so they can differ slightly from the figures here.
Places
The largest cities in Alaska
Population, from the latest estimates available. Figures cover the whole of each place.
Largest places
- Anchorage: 287,155
- Fairbanks: 32,083
- Juneau: 31,794
- Knik-Fairview: 19,972
- Badger: 18,677
- College: 11,924
- North Lakes: 10,223
- Wasilla: 9,720
States like this one
- Georgia: 10,940,407
- Nebraska: 1,978,707
- Idaho: 1,934,262
- North Dakota: 784,841
States at least a third this size, with the closest income, education, age, housing and origins.
Every county and place in Alaska
Find any county, city, town, metro area, ZIP code, school district or district in Alaska.
Counties and equivalents
Each of the 30 counties and equivalents with its population, from ACS 2020–2024 5-year estimates.
- Aleutians East Borough3,491
- Aleutians West Census Area5,235
- Anchorage Municipality288,976
- Bethel Census Area18,394
- Bristol Bay Borough918
- Chugach Census Area6,862
- Copper River Census Area2,626
- Denali Borough1,969
- Dillingham Census Area4,724
- Fairbanks North Star Borough95,460
- Haines Borough2,086
- Hoonah-Angoon Census Area2,311
- Juneau City and Borough31,794
- Kenai Peninsula Borough60,413
- Ketchikan Gateway Borough13,768
- Kodiak Island Borough12,771
- Kusilvak Census Area8,176
- Lake and Peninsula Borough1,013
- Matanuska-Susitna Borough112,988
- Nome Census Area9,866
- North Slope Borough10,810
- Northwest Arctic Borough7,441
- Petersburg Borough3,409
- Prince of Wales-Hyder Census Area5,715
- Sitka City and Borough8,368
- Skagway Municipality1,244
- Southeast Fairbanks Census Area7,068
- Wrangell City and Borough2,088
- Yakutat City and Borough527
- Yukon-Koyukuk Census Area5,195
Cities, towns and other places
Each of the 326 with its population, from ACS 2020–2024 5-year estimates. Census-designated places are communities without a local government of their own, drawn by the Census Bureau so they can be counted.
- Adak73
- Akhiok160
- Akiachak736
- Akiak377
- Akutan694
- Alakanuk864
- Alatna11
- Alcan Border3
- Aleknagik92
- Allakaket167
- Ambler182
- Anaktuvuk Pass329
- Anchor Point2,243
- Anchorage288,976
- Anderson140
- Angoon480
- Aniak585
- Anvik79
- Arctic Village164
- Atka15
- Atmautluak88
- Atqasuk288
- Attu Station13
- Badger18,677
- Bear Creek1,732
- Beaver17
- Beluga4
- Bethel6,312
- Bettles16
- Big Delta565
- Big Lake3,585
- Brevig Mission718
- Buckland533
- Buffalo Soapstone739
- Butte4,085
- Cantwell128
- Central108
- Chalkyitsik80
- Chase29
- Chefornak620
- Chena Ridge5,881
- Chenega37
- Chevak494
- Chickaloon333
- Chignik27
- Chignik Lagoon29
- Chignik Lake27
- Chistochina58
- Chitina100
- Chuathbaluk82
- Circle54
- Clam Gulch238
- Clark's Point25
- Coffman Cove269
- Cohoe1,598
- Cold Bay145
- Coldfoot211
- College11,924
- Cooper Landing227
- Copper Center346
- Cordova2,453
- Covenant Life15
- Craig1,131
- Crooked Creek17
- Crown Point65
- Deering227
- Delta Junction1,217
- Deltana1,997
- Denali Park819
- Diamond Ridge1,329
- Dillingham2,109
- Diomede27
- Dry Creek162
- Eagle95
- Eagle Village24
- Eareckson Station129
- Edna Bay25
- Eek174
- Egegik54
- Eielson AFB3,155
- Ekwok36
- Elfin Cove28
- Elim383
- Emmonak966
- Ester2,752
- Evansville17
- Excursion Inlet62
- Fairbanks32,083
- False Pass151
- Farm Loop2,894
- Farmers Loop4,954
- Ferry22
- Fishhook5,819
- Fort Greely111
- Fort Yukon656
- Fox80
- Fox River741
- Fritz Creek2,383
- Funny River1,081
- Gakona181
- Galena611
- Gambell569
- Gateway6,845
- Glacier View308
- Glennallen450
- Goldstream3,294
- Golovin181
- Goodnews Bay115
- Grayling173
- Gulkana47
- Gustavus594
- Haines1,757
- Halibut Cove167
- Happy Valley775
- Harding-Birch Lakes277
- Healy670
- Healy Lake24
- Hollis66
- Holy Cross205
- Homer5,877
- Hoonah862
- Hooper Bay903
- Houston1,834
- Hughes40
- Huslia51
- Hydaburg375
- Hyder14
- Igiugig53
- Iliamna70
- Juneau31,794
- Kachemak805
- Kake624
- Kaktovik124
- Kalifornsky8,663
- Kaltag68
- Karluk33
- Kasaan51
- Kasigluk698
- Kasilof313
- Kenai7,641
- Kenny Lake289
- Ketchikan8,078
- Kiana437
- King Cove1,352
- King Salmon323
- Kipnuk706
- Kivalina809
- Klawock749
- Klukwan82
- Knik River883
- Knik-Fairview19,972
- Kobuk101
- Kodiak5,447
- Kodiak Station1,823
- Kokhanok39
- Koliganek193
- Kongiganak316
- Kotlik976
- Kotzebue2,984
- Koyuk348
- Koyukuk29
- Kupreanof10
- Kwethluk975
- Kwigillingok545
- Lake Minchumina7
- Larsen Bay145
- Lazy Mountain1,459
- Levelock8
- Lower Kalskag239
- Lutak24
- Manley Hot Springs32
- Manokotak679
- Marshall386
- McCarthy3
- McGrath255
- Meadow Lakes8,689
- Mekoryuk287
- Mendeltna41
- Mentasta Lake96
- Mertarvik12
- Metlakatla1,235
- Mill Bay3,654
- Minto214
- Moose Creek507
- Moose Pass202
- Mosquito Lake116
- Mountain Village949
- Mud Bay79
- Naknek522
- Nanwalek199
- Napakiak556
- Napaskiak447
- Naukati Bay66
- Nelchina149
- Nelson Lagoon78
- Nenana479
- New Stuyahok474
- Newhalen122
- Newtok36
- Nightmute93
- Nikiski4,773
- Nikolaevsk245
- Nikolai44
- Nikolski1
- Ninilchik965
- Noatak786
- Nome3,653
- Nondalton103
- Noorvik748
- North Lakes10,223
- North Pole2,370
- Northway192
- Nuiqsut616
- Nulato255
- Nunapitchuk618
- Old Harbor162
- Oscarville42
- Ouzinkie86
- Palmer6,268
- Paxson17
- Pedro Bay14
- Pelican58
- Perryville82
- Petersburg3,227
- Petersville53
- Pilot Point48
- Pilot Station713
- Pitkas Point169
- Platinum43
- Pleasant Valley790
- Point Hope832
- Point Lay390
- Point MacKenzie1,668
- Port Alexander50
- Port Alsworth199
- Port Clarence16
- Port Graham83
- Port Heiden73
- Port Lions150
- Port Protection27
- Portage Creek1
- Primrose89
- Prudhoe Bay1,664
- Quinhagak1,311
- Red Devil3
- Ridgeway1,997
- Ruby237
- Russian Mission314
- Salamatof1,149
- Salcha829
- Sand Point1,064
- Savoonga868
- Saxman324
- Scammon Bay440
- Selawik412
- Seldovia202
- Seldovia Village213
- Seward2,794
- Shageluk34
- Shaktoolik283
- Shishmaref466
- Shungnak147
- Silver Springs71
- Sitka8,368
- Skagway1,174
- Skwentna97
- Slana119
- Sleetmute48
- Soldotna4,485
- South Lakes6,180
- South Naknek73
- South Van Horn572
- St. George70
- St. Mary's810
- St. Michael177
- St. Paul378
- Stebbins596
- Steele Creek5,928
- Sterling6,323
- Stony River29
- Sunrise23
- Susitna31
- Susitna North1,566
- Sutton-Alpine1,598
- Takotna15
- Talkeetna944
- Tanacross155
- Tanaina9,646
- Tanana334
- Tatitlek20
- Tazlina365
- Teller255
- Tenakee Springs163
- Tetlin123
- Thorne Bay519
- Togiak963
- Tok1,649
- Toksook Bay833
- Tolsona76
- Tonsina47
- Trapper Creek491
- Tuluksak118
- Tuntutuliak514
- Tununak384
- Twin Hills87
- Two Rivers451
- Tyonek291
- Ugashik4
- Unalakleet519
- Unalaska4,556
- Upper Kalskag239
- Utqiaġvik4,778
- Valdez3,847
- Venetie76
- Wainwright718
- Wales238
- Wasilla9,720
- Whale Pass54
- White Mountain222
- Whitestone18
- Whittier411
- Willow1,815
- Willow Creek144
- Womens Bay788
- Wrangell2,088
- Yakutat527
Metro and micro areas
Each of the 4 that reach into Alaska, with its whole population, from ACS 2020–2024 5-year estimates. Metro and micro areas are counties tied together by commuting, drawn by the Office of Management and Budget.
ZIP codes
Each of the 236 with people in it, by the town it's centered in, from ACS 2020–2024 5-year estimates. These are the Census Bureau's ZIP Code Tabulation Areas, which follow the Postal Service's ZIP codes as closely as census blocks allow.
- 99501Anchorage16,175
- 99502Anchorage25,006
- 9950312,964
- 99504Anchorage42,093
- 99505Anchorage5,015
- 99506Anchorage7,028
- 99507Anchorage37,301
- 99508Anchorage36,458
- 99515Anchorage21,870
- 99516Anchorage21,500
- 99517Anchorage16,486
- 99518Anchorage9,764
- 995191,297
- 99540Anchorage468
- 99546Adak73
- 99547Atka15
- 99548Chignik Lake27
- 99549Port Heiden73
- 99550Port Lions150
- 99551Akiachak736
- 99552Akiak377
- 99553Akutan694
- 99554Alakanuk864
- 99555Aleknagik92
- 99556Nikolaevsk2,866
- 99557714
- 99558Anvik79
- 99559Bethel7,241
- 99561Chefornak620
- 99563Chevak494
- 99564Chignik27
- 99565Chignik Lagoon29
- 99566130
- 99567Anchorage6,452
- 99568465
- 99569Clark's Point26
- 99571Cold Bay223
- 99572Cooper Landing241
- 99573941
- 995742,551
- 99575Crooked Creek17
- 99576Aleknagik2,454
- 99577Anchorage28,477
- 99578Eek174
- 99579Egegik54
- 99580Ekwok36
- 99581Emmonak966
- 99583False Pass151
- 99585Marshall386
- 99586Chistochina420
- 99587Anchorage1,949
- 995881,037
- 99589Goodnews Bay115
- 99590Grayling173
- 99591St. George70
- 99602Holy Cross205
- 99603Halibut Cove11,693
- 99604Hooper Bay903
- 99605Sunrise23
- 99606Newhalen231
- 99607Upper Kalskag239
- 99608Karluk33
- 99609Kasigluk698
- 99610Cohoe2,222
- 9961116,510
- 99612King Cove1,352
- 99613376
- 99614Kipnuk706
- 9961512,194
- 99620Kotlik976
- 99621Kwethluk975
- 99622Kwigillingok545
- 99623Point MacKenzie23,424
- 99624Larsen Bay145
- 99625Levelock8
- 99626Lower Kalskag239
- 99627255
- 99628Manokotak679
- 99630Mekoryuk287
- 99631Cooper Landing222
- 99632Mountain Village949
- 99633Naknek522
- 99634Napakiak692
- 99635100
- 99636New Stuyahok474
- 99637Toksook Bay833
- 99638Nikolski1
- 99639Ninilchik1,175
- 99640116
- 99641Nunapitchuk618
- 99643Old Harbor162
- 99644Ouzinkie87
- 99645Lazy Mountain32,103
- 99647Pedro Bay14
- 99648Perryville82
- 99649Ugashik52
- 99650Pilot Station713
- 99651Platinum43
- 99652Big Lake4,313
- 99653Port Alsworth199
- 99654Tanaina44,647
- 99655Quinhagak1,311
- 99656Red Devil3
- 99657Russian Mission442
- 99658St. Mary's979
- 99659St. Michael177
- 99660St. Paul378
- 99661Sand Point1,071
- 99662Scammon Bay440
- 99663Seldovia Village417
- 99664Seward4,698
- 99665Shageluk34
- 99667261
- 99668Sleetmute48
- 99669Soldotna15,395
- 99670South Naknek73
- 99671Stebbins596
- 99672Sterling4,091
- 996741,774
- 99675Takotna15
- 996761,628
- 99677Tatitlek20
- 99678963
- 99679Tuluksak118
- 99680Tuntutuliak514
- 99681Tununak384
- 99682Beluga295
- 99683Trapper Creek583
- 99684565
- 99685Unalaska3,747
- 99686Valdez3,862
- 99688Willow2,739
- 99689Yakutat527
- 99690Nightmute93
- 9969149
- 99692Unalaska809
- 99693429
- 99694Houston1,516
- 9970118,061
- 99702Eielson AFB3,260
- 99703Fairbanks8,304
- 99704Anderson20
- 99705Badger21,769
- 99706Healy Lake24
- 99709Ester29,551
- 9971212,477
- 99714Harding-Birch Lakes1,106
- 99720Alatna178
- 99721Anaktuvuk Pass329
- 99722Arctic Village164
- 99723Utqiaġvik4,785
- 9972417
- 99725Ester448
- 9972633
- 99727Buckland533
- 99729128
- 99730108
- 997329
- 99733Circle54
- 99734Prudhoe Bay1,203
- 99736Deering227
- 997374,774
- 99738125
- 99739383
- 99740656
- 99741Galena611
- 99742Gambell569
- 99743652
- 99744Anderson120
- 99745Hughes40
- 99746Huslia51
- 99747Kaktovik124
- 99748Kaltag68
- 99749Kiana440
- 99750Kivalina809
- 99751Kobuk101
- 997523,056
- 99753Koyuk348
- 99754Koyukuk29
- 99755987
- 9975632
- 99757Lake Minchumina7
- 99758Minto214
- 99759Point Lay390
- 99760Anderson833
- 99761Noatak786
- 997624,156
- 99763Noorvik748
- 99764195
- 99765Nulato255
- 99766832
- 99768237
- 99769Savoonga868
- 99770Selawik412
- 99771Shaktoolik283
- 99772466
- 99773Shungnak147
- 99775College826
- 99776Tanacross155
- 99777Tanana334
- 99778Teller255
- 997801,884
- 9978176
- 99782Wainwright718
- 99783Wales238
- 99784White Mountain222
- 99785Brevig Mission718
- 99786Ambler182
- 99788Chalkyitsik80
- 99789Nuiqsut616
- 99791Atqasuk288
- 99801Juneau29,588
- 99820Angoon480
- 99824Juneau2,190
- 99825Elfin Cove28
- 99826Gustavus594
- 998272,168
- 99829Hoonah862
- 99830629
- 99832Pelican102
- 99833Kupreanof3,409
- 99835Sitka8,368
- 99836Port Alexander50
- 998401,244
- 99841163
- 9990113,768
- 99903Wrangell1
- 99918Coffman Cove269
- 99919Thorne Bay570
- 99921Hollis1,596
- 99922375
- 99923Hyder24
- 99925Klawock841
- 99926Metlakatla1,334
- 99927Port Protection27
- 99929Wrangell2,087
School districts
Each of the 53 with people in it, from ACS 2020–2024 5-year estimates.
- Alaska Gateway School District2,545
- Aleutian Region School District231
- Aleutians East Borough School District3,491
- Anchorage School District288,976
- Annette Island School District1,334
- Bering Strait School District6,213
- Bristol Bay Borough School District918
- Chatham School District1,391
- Chugach School District562
- Copper River School District2,530
- Cordova City School District2,453
- Craig City School District1,131
- Delta/Greely School District4,619
- Denali Borough School District1,969
- Dillingham City School District2,109
- Fairbanks North Star Borough School District95,460
- Galena City School District611
- Haines Borough School District2,086
- Hoonah City School District862
- Hydaburg City School District375
- Iditarod Area School District847
- Juneau Borough School District31,794
- Kake City School District624
- Kashunamiut School District494
- Kenai Peninsula Borough School District60,413
- Ketchikan Gateway Borough School District13,768
- Klawock City School District749
- Kodiak Island Borough School District12,771
- Kuspuk School District1,272
- Lake and Peninsula Borough School District1,013
- Lower Kuskokwim School District15,873
- Lower Yukon School District6,872
- Matanuska-Susitna Borough School District112,988
- Nenana City School District479
- Nome School District3,653
- North Slope Borough School District10,810
- Northwest Arctic Borough School District7,441
- Pelican City School District58
- Petersburg Borough School District3,409
- Pribilof School District448
- Sitka School District8,368
- Skagway School District1,244
- Southeast Island School District1,502
- Southwest Region School District2,615
- St. Marys City School District810
- Tanana City School District334
- Unalaska City School District4,556
- Valdez City School District3,847
- Wrangell School District2,088
- Yakutat School District527
- Yukon Flats School District1,155
- Yukon-Koyukuk School District1,787
- Yupiit School District1,231
State senate districts
The upper chamber’s districts, as drawn in 2024.
- State Senate District A35,510
- State Senate District B35,800
- State Senate District C37,952
- State Senate District D37,104
- State Senate District E35,592
- State Senate District F35,840
- State Senate District G36,422
- State Senate District H37,625
- State Senate District I34,426
- State Senate District J36,840
- State Senate District K37,510
- State Senate District L35,132
- State Senate District M40,435
- State Senate District N40,257
- State Senate District O38,167
- State Senate District P35,925
- State Senate District Q37,097
- State Senate District R37,327
- State Senate District S34,946
- State Senate District T35,799
State house districts
The lower chamber’s districts, as drawn in 2024.
- State House District 117,537
- State House District 217,973
- State House District 317,418
- State House District 418,382
- State House District 518,132
- State House District 619,820
- State House District 718,580
- State House District 818,524
- State House District 917,577
- State House District 1018,015
- State House District 1118,530
- State House District 1217,310
- State House District 1318,316
- State House District 1418,106
- State House District 1519,191
- State House District 1618,434
- State House District 1716,940
- State House District 1817,486
- State House District 1918,920
- State House District 2017,920
- State House District 2118,664
- State House District 2218,846
- State House District 2317,582
- State House District 2417,550
- State House District 2520,024
- State House District 2620,411
- State House District 2719,400
- State House District 2820,857
- State House District 2920,165
- State House District 3018,002
- State House District 3118,636
- State House District 3217,289
- State House District 3318,015
- State House District 3419,082
- State House District 3518,671
- State House District 3618,656
- State House District 3717,518
- State House District 3817,428
- State House District 3917,548
- State House District 4018,251
PUMAs
Public Use Microdata Areas: areas of 100,000 people or more that the state draws from census tracts, for the Census Bureau’s microdata.
Urban areas
Each that reaches into Alaska, with its whole population. Urban areas are the densely settled land the Census Bureau draws after each census, whatever the city lines.
- Anchorage Northeast, AK28,573
- Anchorage, AK248,475
- Bethel, AK4,665
- Fairbanks, AK72,935
- Juneau, AK25,340
- Kenai, AK8,155
- Ketchikan, AK11,823
- Kodiak–Mill Bay, AK8,953
- Sitka, AK7,635
- Soldotna, AK4,746
- Wasilla–Knik-Fairview–North Lakes, AK58,205
Alaska Native areas
Each that reaches into Alaska, with its whole population.
- Akhiok ANVSA, AK160
- Akiachak ANVSA, AK736
- Akiak ANVSA, AK377
- Akutan ANVSA, AK694
- Alakanuk ANVSA, AK864
- Alatna ANVSA, AK11
- Aleknagik ANVSA, AK92
- Algaaciq ANVSA, AK650
- Allakaket ANVSA, AK167
- Ambler ANVSA, AK182
- Anaktuvuk Pass ANVSA, AK329
- Andreafsky ANVSA, AK160
- Angoon ANVSA, AK480
- Aniak ANVSA, AK585
- Annette Island Reserve, AK1,334
- Anvik ANVSA, AK79
- Arctic Village ANVSA, AK164
- Atka ANVSA, AK15
- Atmautluak ANVSA, AK88
- Atqasuk ANVSA, AK288
- Barrow ANVSA, AK4,778
- Beaver ANVSA, AK17
- Bethel ANVSA, AK6,312
- Brevig Mission ANVSA, AK718
- Buckland ANVSA, AK533
- Cantwell ANVSA, AK128
- Chalkyitsik ANVSA, AK80
- Chefornak ANVSA, AK620
- Chenega ANVSA, AK37
- Chevak ANVSA, AK494
- Chickaloon ANVSA, AK27,567
- Chignik ANVSA, AK27
- Chignik Lagoon ANVSA, AK29
- Chignik Lake ANVSA, AK27
- Chilkat ANVSA, AK82
- Chilkoot ANVSA, AK787
- Chistochina ANVSA, AK58
- Chitina ANVSA, AK100
- Chuathbaluk ANVSA, AK82
- Circle ANVSA, AK54
- Clarks Point ANVSA, AK25
- Copper Center ANVSA, AK417
- Council ANVSA, AK6
- Craig ANVSA, AK1,248
- Crooked Creek ANVSA, AK17
- Deering ANVSA, AK227
- Dillingham ANVSA, AK2,171
- Douglas ANVSA, AK6,208
- Eagle ANVSA, AK24
- Eek ANVSA, AK174
- Egegik ANVSA, AK54
- Eklutna ANVSA, AK84
- Ekuk ANVSA, AK1
- Ekwok ANVSA, AK36
- Elim ANVSA, AK383
- Emmonak ANVSA, AK966
- Evansville ANVSA, AK33
- Eyak ANVSA, AK206
- False Pass ANVSA, AK151
- Fort Yukon ANVSA, AK656
- Gakona ANVSA, AK173
- Galena ANVSA, AK611
- Gambell ANVSA, AK569
- Golovin ANVSA, AK181
- Goodnews Bay ANVSA, AK115
- Grayling ANVSA, AK173
- Gulkana ANVSA, AK55
- Healy Lake ANVSA, AK24
- Holy Cross ANVSA, AK205
- Hoonah ANVSA, AK862
- Hooper Bay ANVSA, AK903
- Hughes ANVSA, AK40
- Huslia ANVSA, AK51
- Hydaburg ANVSA, AK375
- Igiugig ANVSA, AK53
- Iliamna ANVSA, AK70
- Inalik ANVSA, AK27
- Kake ANVSA, AK624
- Kaktovik ANVSA, AK124
- Kalskag ANVSA, AK239
- Kaltag ANVSA, AK68
- Karluk ANVSA, AK33
- Kasaan ANVSA, AK51
- Kasigluk ANVSA, AK698
- Kenaitze ANVSA, AK35,530
- Ketchikan ANVSA, AK13,122
- Kiana ANVSA, AK440
- King Cove ANVSA, AK1,352
- King Salmon ANVSA, AK81
- Kipnuk ANVSA, AK706
- Kivalina ANVSA, AK809
- Klawock ANVSA, AK561
- Knik ANVSA, AK85,258
- Kobuk ANVSA, AK101
- Kokhanok ANVSA, AK39
- Kongiganak ANVSA, AK316
- Kotlik ANVSA, AK976
- Kotzebue ANVSA, AK2,984
- Koyuk ANVSA, AK348
- Koyukuk ANVSA, AK29
- Kwethluk ANVSA, AK975
- Kwigillingok ANVSA, AK545
- Kwinhagak ANVSA, AK1,311
- Lake Minchumina ANVSA, AK7
- Larsen Bay ANVSA, AK145
- Levelock ANVSA, AK8
- Lower Kalskag ANVSA, AK239
- Manley Hot Springs ANVSA, AK32
- Manokotak ANVSA, AK679
- Marshall ANVSA, AK386
- McGrath ANVSA, AK255
- Mekoryuk ANVSA, AK287
- Mentasta Lake ANVSA, AK48
- Minto ANVSA, AK214
- Mountain Village ANVSA, AK949
- Naknek ANVSA, AK522
- Nanwalek ANVSA, AK199
- Napakiak ANVSA, AK556
- Napaskiak ANVSA, AK447
- Nelson Lagoon ANVSA, AK78
- Nenana ANVSA, AK479
- New Koliganek ANVSA, AK193
- New Stuyahok ANVSA, AK474
- Newhalen ANVSA, AK122
- Newtok ANVSA, AK48
- Nightmute ANVSA, AK93
- Nikolai ANVSA, AK44
- Nikolski ANVSA, AK1
- Ninilchik ANVSA, AK17,199
- Noatak ANVSA, AK786
- Nome ANVSA, AK3,801
- Nondalton ANVSA, AK103
- Noorvik ANVSA, AK748
- Northway ANVSA, AK192
- Nuiqsut ANVSA, AK616
- Nulato ANVSA, AK255
- Nunapitchuk ANVSA, AK618
- Old Harbor ANVSA, AK162
- Oscarville ANVSA, AK42
- Ouzinkie ANVSA, AK87
- Pedro Bay ANVSA, AK14
- Perryville ANVSA, AK82
- Petersburg ANVSA, AK2,805
- Pilot Point ANVSA, AK48
- Pilot Station ANVSA, AK713
- Pitkas Point ANVSA, AK169
- Platinum ANVSA, AK43
- Point Hope ANVSA, AK832
- Point Lay ANVSA, AK390
- Port Alsworth ANVSA, AK199
- Port Graham ANVSA, AK83
- Port Heiden ANVSA, AK73
- Port Lions ANVSA, AK150
- Portage Creek ANVSA, AK1
- Red Devil ANVSA, AK3
- Ruby ANVSA, AK237
- Russian Mission ANVSA, AK314
- Salamatof ANVSA, AK1,149
- Sand Point ANVSA, AK1,046
- Savoonga ANVSA, AK868
- Saxman ANVSA, AK324
- Scammon Bay ANVSA, AK440
- Selawik ANVSA, AK412
- Seldovia ANVSA, AK417
- Shageluk ANVSA, AK34
- Shaktoolik ANVSA, AK283
- Shishmaref ANVSA, AK466
- Shungnak ANVSA, AK147
- Sitka ANVSA, AK4,313
- Skagway ANVSA, AK1,244
- Sleetmute ANVSA, AK48
- South Naknek ANVSA, AK73
- St. George ANVSA, AK70
- St. Michael ANVSA, AK177
- St. Paul ANVSA, AK378
- Stebbins ANVSA, AK596
- Stony River ANVSA, AK29
- Takotna ANVSA, AK15
- Tanacross ANVSA, AK155
- Tanana ANVSA, AK334
- Tatitlek ANVSA, AK20
- Tazlina ANVSA, AK382
- Teller ANVSA, AK255
- Tetlin ANVSA, AK123
- Togiak ANVSA, AK963
- Toksook Bay ANVSA, AK833
- Tuluksak ANVSA, AK118
- Tuntutuliak ANVSA, AK514
- Tununak ANVSA, AK384
- Twin Hills ANVSA, AK87
- Tyonek ANVSA, AK295
- Ugashik ANVSA, AK4
- Unalakleet ANVSA, AK565
- Unalaska ANVSA, AK4,556
- Venetie ANVSA, AK76
- Wainwright ANVSA, AK718
- Wales ANVSA, AK238
- White Mountain ANVSA, AK222
- Wrangell ANVSA, AK1,439
- Yakutat ANVSA, AK527
Turn Alaska into your planning report.
Social Explorer Studio builds an editable profile of any place, with tables and charts beside the county and state, and exports to Word, PDF and Excel.
Questions about Alaska
What is the population of Alaska?
737,270 people, according to the ACS 2025 1-year estimates, which the Census Bureau adjusts to match its own population estimate. That’s the 48th largest of the 50 states and DC.
What is the FIPS code for Alaska?
02. Every county’s and place’s FIPS code in Alaska starts with it. The Census Bureau’s full geographic identifier (GEOID) is 0400000US02.
What is the largest community in Alaska?
Anchorage, with 287,155 people. Other large places here include Fairbanks, Juneau and Knik-Fairview.
What is the median household income in Alaska?
$95,220 (±$4,301), according to the ACS 2025 1-year estimates, higher than the US ($84,780).
What is the median age in Alaska?
37.0 years (±0.3), according to the ACS 2025 1-year estimates, lower than the US (39.5).
How much does housing cost in Alaska?
Alaska’s median home value is $385,100 (±$8,954) and its median gross rent is $1,500 (±$44) a month, according to the ACS 2025 1-year estimates. 39.3% (±4.1%) of its renters pay 30% or more of their income on rent.
Is Alaska growing?
Alaska’s population fell 0.2%, from 738,432 in 2015 to 737,270 in 2025, according to the ACS 1-year estimates.
Where does this census data come from?
The U.S. Census Bureau’s American Community Survey, through Social Explorer’s tables: the latest 1-year estimates where they exist, for the most recent numbers, and 5-year estimates otherwise. Each table lists its code, so you can find it again.
Is this data free to use?
Yes. You can read it, cite it, download the CSV and embed the charts, with no account. To map other variables, compare your own areas or build a report, see Social Explorer’s plans in a live demo.
Sources and how to cite
American Community Survey 2025 1-year estimates, or 2020–2024 5-year estimates where noted, U.S. Census Bureau, from Social Explorer’s tables A00001, A00002, A01004, A04001, A06001, A08001, A09005, A10001, A10003, A10008, A10030, A10036, A10040, A10047, A10055, A10060, A12001, A13004, A14006, A14024, A14028, A16002, A17005, A18002, A18009, A20001, B02002, B09001, B13002, B18101, C16001. Maps by census tract use 2020–2024 5-year estimates, since the 1-year survey doesn’t cover tracts. These are estimates from a sample, each with its margin of error. Data retrieved November 14, 2026. How these profiles are made.
U.S. Census Bureau, American Community Survey 2025 1-year estimates, or 2020–2024 5-year estimates where noted, via Social Explorer. “Alaska.” https://www.socialexplorer.com/places/alaska. Accessed November 14, 2026.