

Minnesota: Population, demographics and census data
Home to 5,830,405 people, the 22nd largest of the 50 states and DC, anchored by Minneapolis and St. Paul. It grew 6.2% between 2015 and 2025.
- Population
- 5.83M. Census Bureau estimate · Rank 22 of the 50 states and DC
- Median household income
- $92,297 ±$1,085. US $84,780
- Median age
- 39.5 ±0.3. US 39.5
ACS 2025 1-year estimates, U.S. Census Bureau
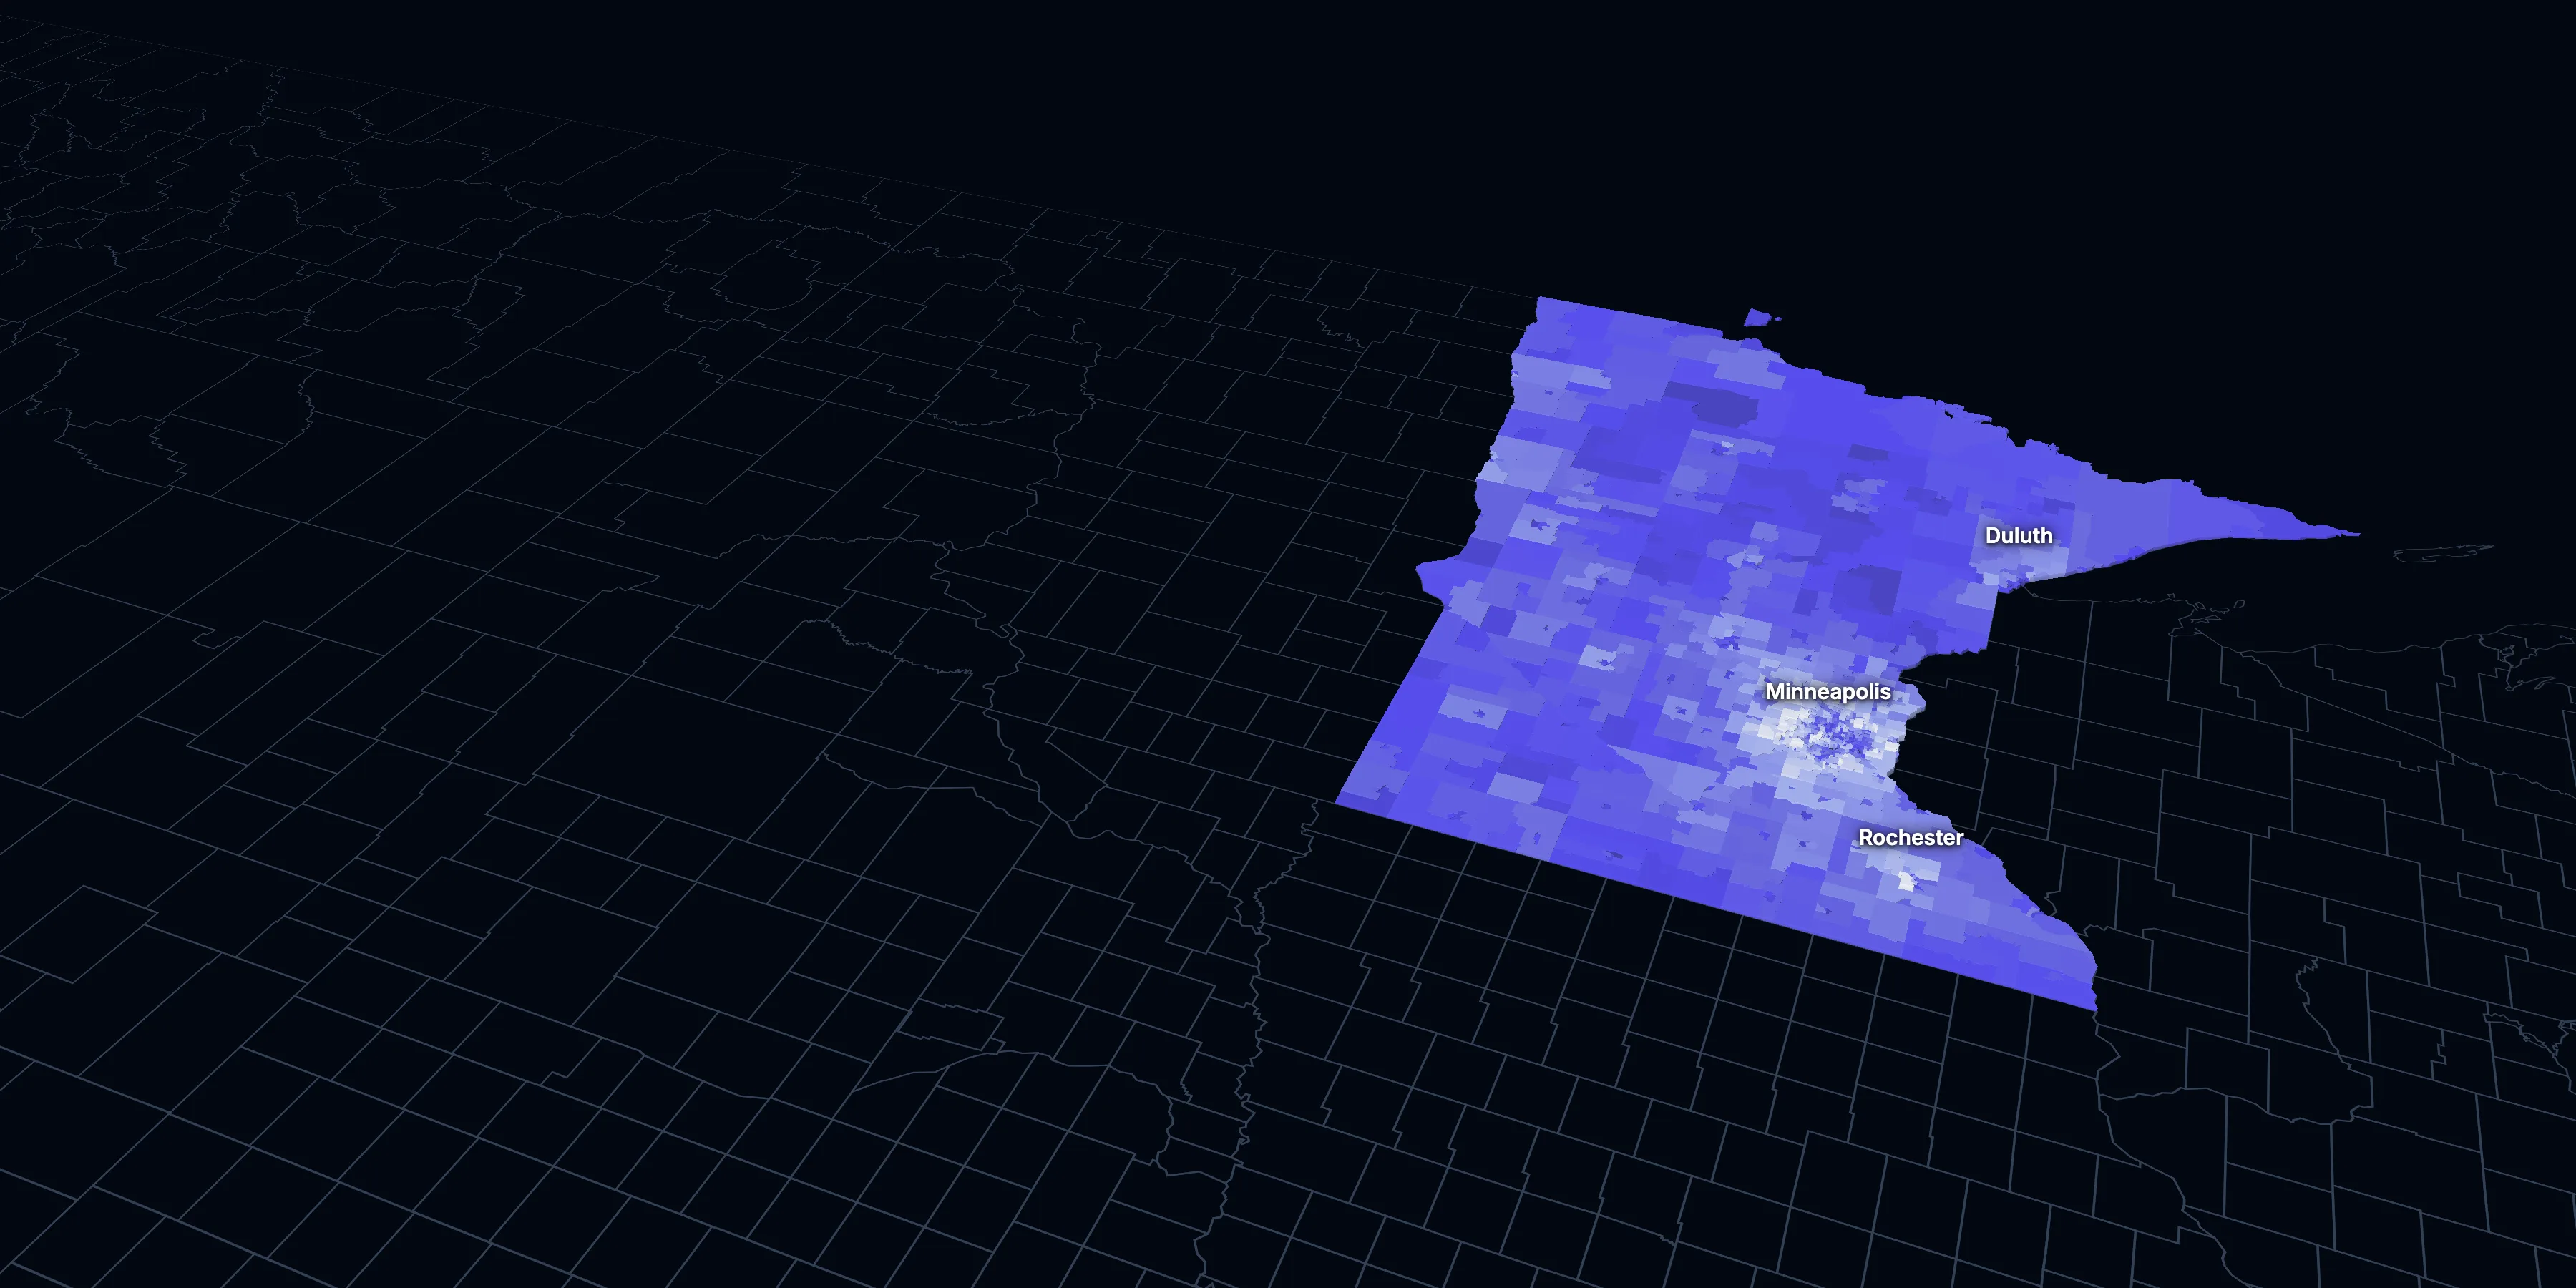
Taller, lighter tracts have higher household incomes
About Minnesota
Minnesota’s median household income is $92,297 (±$1,085), higher than the US ($84,780), and its median age is 39.5 (±0.3), according to the ACS 2025 1-year estimates. Its largest city is Minneapolis.
± is each figure’s margin of error, at 90% confidence, and † marks one too uncertain to lean on. Under each percentage in the tables is the number it counts. How the margins are worked out.
FIPS code 27
Highlights
What stands out in Minnesota
The numbers where Minnesota sits furthest from the nation, or past a recognized policy benchmark.
Past a policy benchmark
27.6%
ElevatedHomes built before 1960
That’s higher than the US (24.0%). Older homes carry more lead-paint risk: the EPA found lead paint in 69% of homes built from 1940 to 1959.
+5 points
ElevatedRent growth ahead of income
After inflation, rent grew 12% from 2015 to 2025, and household income 6%. The dots show rent growth.
Furthest from the national picture
27.9%
Lower than the USHouseholds that rent
That’s lower than the US (34.7%). It’s the 7th lowest of the 50 states and DC.
12.8%
Lower than the USSpeak a language other than English at home
That’s lower than the US (22.9%).
9.0%
3rd lowest among statesLiving in poverty
That’s lower than the US (11.8%). It’s the 3rd lowest of the 50 states and DC.
30.4%
Lower than the USCommute 30 minutes or more
That’s lower than the US (39.2%).
2015 to 2025
How Minnesota changed in ten years
The state added 340,811 people. It got older, more foreign-born and better educated, and poverty fell 1.2 points.
Population, change since 2015
+6.2% in the state and +6.3% in the US.
Source: ACS 1-year, 2015 to 2025, table A00001.
Show data
| Minnesota | United States | |
|---|---|---|
| 2015 | 0.0% | 0.0% |
| 2016 | +0.6% | +0.5% |
| 2017 | +1.6% | +1.3% |
| 2018 | +2.2% | +1.8% |
| 2019 | +2.7% | +2.1% |
| 2021 | +4.0% | +3.3% |
| 2022 | +4.1% | +3.7% |
| 2023 | +4.5% | +4.2% |
| 2024 | +5.5% | +5.8% |
| 2025 | +6.2% | +6.3% |
Embed
Median household income, in 2025 dollars
+6.1% in the state and +10.9% in the US.
Source: ACS 1-year, 2015 to 2025, table A14006.
Show data
| Minnesota | United States | |
|---|---|---|
| 2015 | $86,980 | $76,413 |
| 2016 | $88,728 | $77,931 |
| 2017 | $90,553 | $79,891 |
| 2018 | $90,889 | $80,059 |
| 2019 | $94,702 | $83,427 |
| 2021 | $93,108 | $83,521 |
| 2022 | $91,211 | $82,811 |
| 2023 | $90,521 | $82,683 |
| 2024 | $90,037 | $84,339 |
| 2025 | $92,297 | $84,780 |
Embed
Living in poverty
−1.2 points in the state and −3.0 points in the US.
Source: ACS 1-year, 2015 to 2025, table A13004.
Show data
| Minnesota | United States | |
|---|---|---|
| 2015 | 10.2% | 14.7% |
| 2016 | 9.9% | 14.0% |
| 2017 | 9.5% | 13.4% |
| 2018 | 9.6% | 13.1% |
| 2019 | 9.0% | 12.3% |
| 2021 | 9.3% | 12.8% |
| 2022 | 9.6% | 12.6% |
| 2023 | 9.3% | 12.5% |
| 2024 | 9.3% | 12.1% |
| 2025 | 9.0% | 11.8% |
Embed
Bachelor’s degree or more
+6.1 points in the state and +6.7 points in the US.
Source: ACS 1-year, 2015 to 2025, table A12001.
Show data
| Minnesota | United States | |
|---|---|---|
| 2015 | 34.7% | 30.6% |
| 2016 | 34.8% | 31.3% |
| 2017 | 36.1% | 32.0% |
| 2018 | 36.7% | 32.6% |
| 2019 | 37.3% | 33.1% |
| 2021 | 38.9% | 35.0% |
| 2022 | 39.1% | 35.7% |
| 2023 | 40.0% | 36.2% |
| 2024 | 40.0% | 36.8% |
| 2025 | 40.8% | 37.4% |
Embed
Median gross rent, in 2025 dollars
+11.5% in the state and +18.5% in the US.
Source: ACS 1-year, 2015 to 2025, table A18009.
Show data
| Minnesota | United States | |
|---|---|---|
| 2015 | $1,217 | $1,314 |
| 2016 | $1,234 | $1,327 |
| 2017 | $1,243 | $1,340 |
| 2018 | $1,253 | $1,368 |
| 2019 | $1,290 | $1,393 |
| 2021 | $1,333 | $1,427 |
| 2022 | $1,329 | $1,440 |
| 2023 | $1,345 | $1,496 |
| 2024 | $1,334 | $1,537 |
| 2025 | $1,357 | $1,557 |
Embed
Median home value, in 2025 dollars
+29.1% in the state and +39.3% in the US.
Source: ACS 1-year, 2015 to 2025, table A10036.
Show data
| Minnesota | United States | |
|---|---|---|
| 2015 | $274,004 | $266,469 |
| 2016 | $286,475 | $277,278 |
| 2017 | $296,598 | $288,124 |
| 2018 | $304,276 | $296,908 |
| 2019 | $313,207 | $305,336 |
| 2021 | $341,908 | $337,116 |
| 2022 | $348,502 | $355,481 |
| 2023 | $349,590 | $361,931 |
| 2024 | $356,149 | $372,685 |
| 2025 | $353,800 | $371,100 |
Embed
ACS 1-year estimates. The dotted stretch of each line spans 2020, when the Census Bureau released no standard 1-year estimates. Dollar values are in 2025 dollars.
| Indicator | 2015 | 2025 | Change |
|---|---|---|---|
| Population | 5,489,594 | 5,830,405 | +6.2% |
| Median age | 37.9 | 39.5 | +1.6 years |
| 65 and over | 14.7% | 19.1% | +4.5 points |
| Born outside the US | 8.3% | 9.1% | +0.7 points |
| Hispanic or Latino | 5.1% | 7.2% | +2.1 points |
| Median household income | $86,980 | $92,297 | +6.1% |
| Living in poverty | 10.2% | 9.0% | −1.2 points |
| Bachelor’s degree or more | 34.7% | 40.8% | +6.1 points |
| Households that rent | 29.1% | 27.9% | −1.1 points |
| Median gross rent | $1,217 | $1,357 | +11.5% |
| Median home value | $274,004 | $353,800 | +29.1% |
1505 census tracts
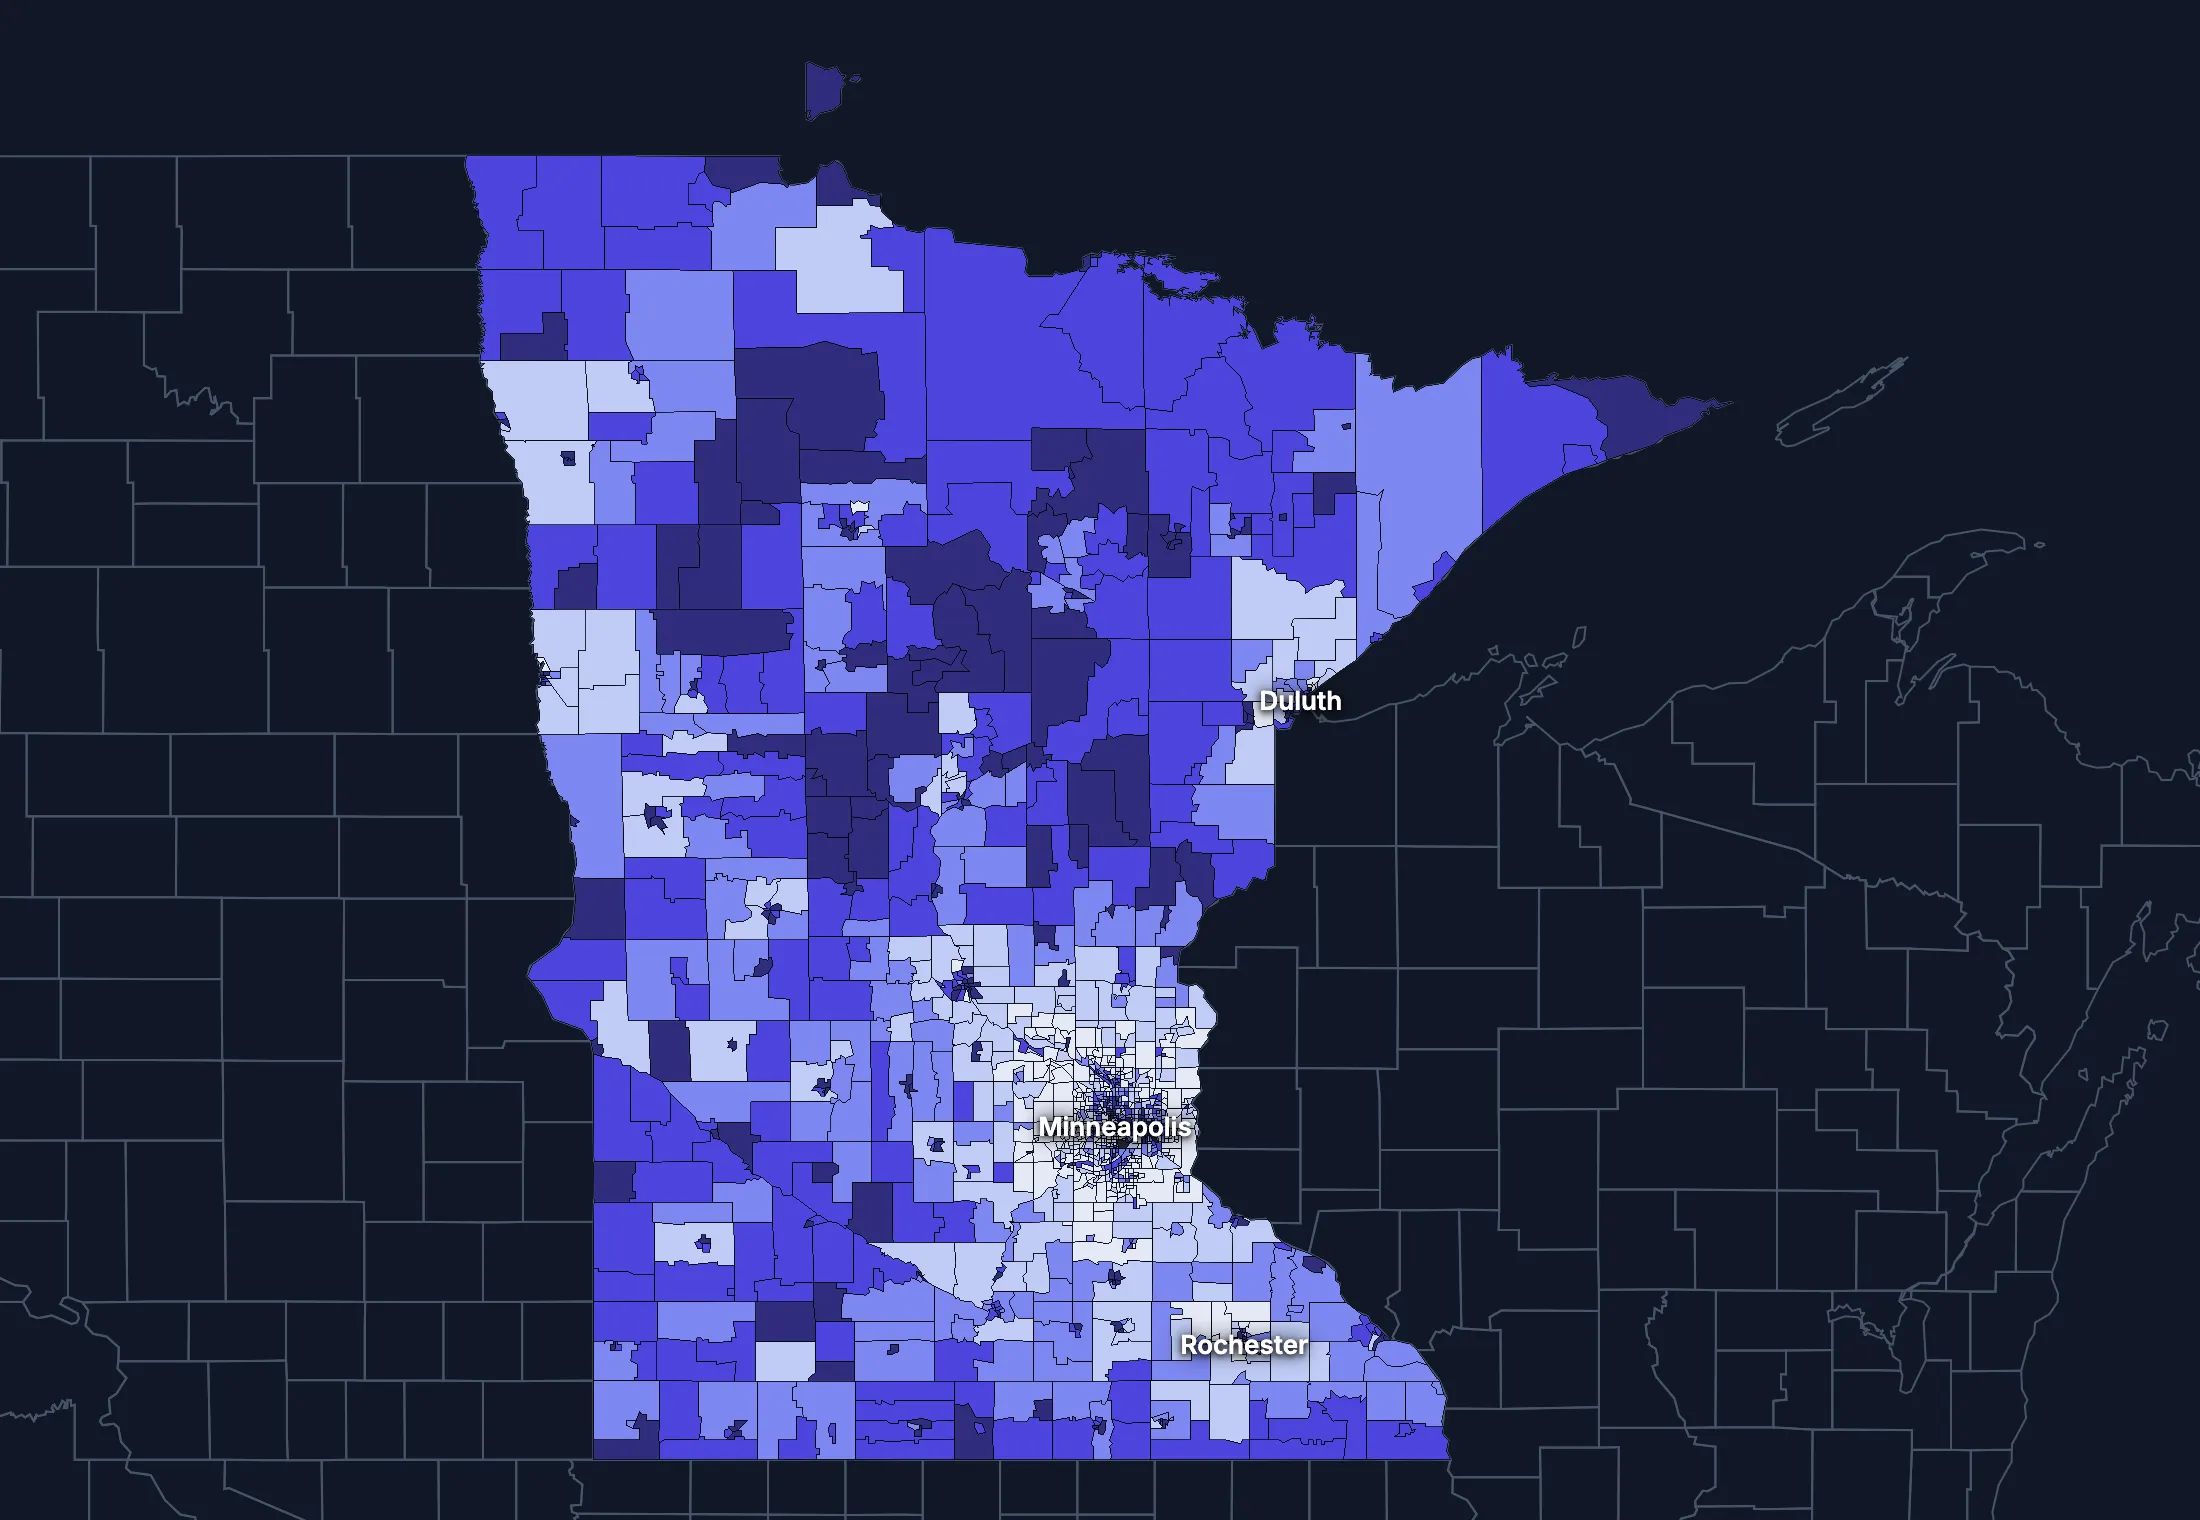
Minnesota, tract by tract
State averages hide a lot. These census tracts are the closest the census comes to neighborhoods.
Where the state’s average misleads
Each tick is one census tract, and the dark line marks the state. Hover over a tick or tap it to see the tract.
Poverty
304 of 1498 tracts are at least 1.5 times the state’s overall 9.3%, and 346 are at two-thirds of it or less.
Highest: Tract 1039, 69.6%. Lowest: Tract 710.14, 0.0%.
Renters paying 30% or more of income
95 of 1400 tracts are at least 1.5 times the state’s overall 45.4%, and 344 are at two-thirds of it or less.
Highest: Tract 803.06, 100.0%. Lowest: Tract 502.33, 0.0%.
Adults with a bachelor’s degree
236 of 1500 tracts are at least 1.5 times the state’s overall 39.4%, and 481 are at two-thirds of it or less.
Highest: Tract 231, 86.7%. Lowest: Tract 708.01, 0.0%.
Median household income
209 of 1495 tracts are at least 1.5 times the typical tract’s $85,441, and 138 are at two-thirds of it or less.
Highest: Tract 236, $250,000 or more. Lowest: Tract 19, $16,678.
American Community Survey 2020–2024 5-year estimates, by census tract. Income is capped at $250,000+ by the Census Bureau.
People
Who lives in Minnesota
Its median age of 39.5 is about the same as the US (39.5). 9.1% of residents were born outside the US, and 12.8% speak a language other than English at home.
Age
Source: ACS 2025 1-year, table A01001.
Show data
| Minnesota | United States | |
|---|---|---|
| Under 18 | 21.9% ±0.2% , number 1,274,253 ±13,810 | 21.0% ±<0.1% , number 71,689,151 ±111,800 |
| 18 to 24 | 9.1% ±0.2% , number 527,760 ±10,330 | 9.3% ±<0.1% , number 31,716,680 ±98,660 |
| 25 to 34 | 12.8% ±0.1% , number 745,684 ±5,682 | 13.6% ±<0.1% , number 46,357,354 ±55,690 |
| 35 to 44 | 13.7% ±0.2% , number 801,248 ±12,750 | 13.4% ±<0.1% , number 45,746,189 ±105,700 |
| 45 to 54 | 11.5% ±0.1% , number 669,230 ±4,949 | 11.8% ±<0.1% , number 40,257,563 ±53,540 |
| 55 to 64 | 12.0% ±0.2% , number 697,192 ±11,150 | 12.1% ±<0.1% , number 41,242,904 ±104,700 |
| 65 to 74 | 10.9% ±0.2% , number 637,288 ±8,913 | 10.8% ±<0.1% , number 36,895,650 ±91,520 |
| 75 and over | 8.2% ±0.1% , number 477,750 ±8,583 | 8.2% ±<0.1% , number 27,879,368 ±78,140 |
Embed
Race and ethnicity
Source: ACS 2025 1-year, table A04001.
Show data
| Minnesota | United States | |
|---|---|---|
| White, not Hispanic | 73.1% ±0.1% , number 4,262,879 ±6,516 | 55.0% ±<0.1% , number 187,959,031 ±58,340 |
| Hispanic or Latino | 7.2% ±<0.1% , number 420,899 ±1,076 | 20.5% ±<0.1% , number 69,975,516 ±13,270 |
| Black, not Hispanic | 7.4% ±0.2% , number 429,587 ±12,420 | 11.7% ±<0.1% , number 40,096,453 ±106,200 |
| Asian, not Hispanic | 5.6% ±0.1% , number 323,589 ±6,949 | 6.5% ±<0.1% , number 22,096,709 ±58,340 |
| Other or multiracial | 6.7% ±0.3% , number 393,451 ±17,550 | 6.3% ±<0.1% , number 21,657,150 ±150,100 |
Embed
Language spoken at home
Source: ACS 2025 1-year, table C16001.
Show data
| Minnesota | United States | |
|---|---|---|
| English only | 87.2% ±0.4% , number 4,805,810 ±19,700 | 77.1% ±0.1% , number 249,390,588 ±275,300 |
| Spanish | 4.5% ±0.2% , number 245,883 ±9,445 | 13.9% ±0.1% , number 44,921,985 ±177,800 |
| Other Indo-European | 2.0% ±0.2% , number 108,800 ±8,806 | 4.0% ±<0.1% , number 12,862,980 ±113,500 |
| Asian and Pacific Island | 3.4% ±0.2% , number 187,331 ±10,450 | 3.8% ±<0.1% , number 12,288,841 ±99,740 |
| Arabic and other | 3.0% ±0.3% , number 164,875 ±14,660 | 1.3% ±<0.1% , number 4,116,949 ±71,480 |
Embed
Marital status
Source: ACS 2025 1-year, table A11001.
Show data
| Minnesota | United States | |
|---|---|---|
| Now married | 51.4% ±0.4% , number 2,461,388 ±20,090 | 47.9% ±0.1% , number 135,567,564 ±223,300 |
| Never married | 33.3% ±0.3% , number 1,595,543 ±15,330 | 34.8% ±0.1% , number 98,647,238 ±152,600 |
| Divorced | 9.3% ±0.2% , number 447,013 ±11,600 | 10.2% ±<0.1% , number 28,879,967 ±112,900 |
| Widowed | 5.0% ±0.1% , number 239,479 ±7,051 | 5.5% ±<0.1% , number 15,599,094 ±69,430 |
| Separated | 0.9% ±0.1% , number 40,823 ±4,268 | 1.6% ±<0.1% , number 4,441,399 ±49,160 |
Embed
Where people lived a year ago
Source: ACS 2025 1-year, table A08001.
Show data
| Minnesota | United States | |
|---|---|---|
| Same home | 89.1% ±0.3% , number 5,140,163 ±19,200 | 88.4% ±0.1% , number 298,889,697 ±214,800 |
| Same county | 4.9% ±0.2% , number 280,817 ±12,800 | 6.0% ±<0.1% , number 20,202,671 ±166,300 |
| Another county in the state | 3.8% ±0.2% , number 217,686 ±10,430 | 3.0% ±<0.1% , number 10,168,097 ±89,190 |
| Another state | 1.8% ±0.1% , number 103,379 ±7,503 | 2.1% ±<0.1% , number 7,025,589 ±81,660 |
| Another country | 0.5% ±0.1% , number 26,796 ±4,856 | 0.6% ±<0.1% , number 1,984,943 ±47,210 |
Embed
Top countries of birth, among those born abroad
Source: ACS 2025 1-year, table A07001.
Show data
| Minnesota | |
|---|---|
| Mexico | 12.4% , number 65,616 |
| India | 6.0% , number 31,613 |
| Laos | 4.7% , number 25,035 |
| Ethiopia | 4.2% , number 21,974 |
| Thailand | 4.0% , number 21,352 |
| Kenya | 3.9% , number 20,738 |
Embed
All the numbers
| Indicator | Minnesota | US | Rank among states* | Table |
|---|---|---|---|---|
| Population | 5,830,405 | 341,784,859 | 22nd | A00001 |
| People per square mile | 73 | 97 | 31st | A00002 |
| Land area (square miles) | 79,632 | – | – | A00002 |
| Median age | 39.5 ±0.3 | 39.5 ±0.1 | 32nd | A01004 |
| Under 18 | 21.9% ±0.2% , number 1,274,253 ±13,810 | 21.0% ±<0.1% , number 71,689,151 ±111,800 | 16th | B02002 |
| 65 and over | 19.1% ±0.2% , number 1,115,038 ±12,370 | 19.0% ±<0.1% , number 64,775,018 ±120,300 | 28th | B02002 |
| Born outside the US | 9.1% ±0.3% , number 528,635 ±15,820 | 14.7% ±0.1% , number 50,409,320 ±204,800 | 24th | A06001 |
| Speak a language other than English at home | 12.8% ±0.4% , number 706,889 ±22,150 | 22.9% ±0.1% , number 74,190,755 ±244,000 | 26th | C16001 |
| Veterans (adults) | 5.3% ±0.1% , number 240,553 ±6,594 | 5.9% ±<0.1% , number 15,746,228 ±85,320 | 41st | A16002 |
| Living with a disability | 12.0% ±0.2% , number 690,914 ±12,660 | 13.7% ±<0.1% , number 46,271,455 ±126,000 | 45th | B18101 |
| Women 15–50 who had a baby in the past year | 5.2% ±0.3% , number 69,482 ±4,585 | 5.0% ±0.1% , number 4,016,759 ±44,040 | 15th | B13002 |
| Lived in the same home a year ago | 89.1% ±0.3% , number 5,140,163 ±19,200 | 88.4% ±0.1% , number 298,889,697 ±214,800 | 22nd | A08001 |
| White, not Hispanic | 73.1% ±0.1% , number 4,262,879 ±6,516 | 55.0% ±<0.1% , number 187,959,031 ±58,340 | 14th | A04001 |
| Hispanic or Latino | 7.2% ±<0.1% , number 420,899 ±1,076 | 20.5% ±<0.1% , number 69,975,516 ±13,270 | 38th | A04001 |
| Black, not Hispanic | 7.4% ±0.2% , number 429,587 ±12,420 | 11.7% ±<0.1% , number 40,096,453 ±106,200 | 26th | A04001 |
| Asian, not Hispanic | 5.6% ±0.1% , number 323,589 ±6,949 | 6.5% ±<0.1% , number 22,096,709 ±58,340 | 13th | A04001 |
*1 is the highest. Population is ranked among all states, and the rest among those of 1,000 people or more, whose figures can be ranked. Ranks use 5-year estimates, the only ones covering every state, so they can differ slightly from the figures here.
Income and work
Higher incomes than the US
The median household income is $92,297, higher than the US ($84,780). 9.0% of people live in poverty, and 5.6% have no health insurance, lower than the US (8.4%).
Household income
Source: ACS 2025 1-year, table A14001.
Show data
| Minnesota | United States | |
|---|---|---|
| Under $25,000 | 11.2% ±0.4% , number 268,933 ±9,623 | 14.0% ±0.1% , number 18,727,548 ±88,990 |
| $25,000 to $49,999 | 14.2% ±0.4% , number 340,114 ±10,170 | 15.4% ±0.1% , number 20,665,585 ±101,400 |
| $50,000 to $74,999 | 15.1% ±0.4% , number 361,113 ±9,400 | 15.3% ±0.1% , number 20,513,565 ±88,500 |
| $75,000 to $99,999 | 12.9% ±0.3% , number 309,547 ±7,943 | 12.5% ±0.1% , number 16,814,245 ±87,520 |
| $100,000 to $149,999 | 20.0% ±0.5% , number 478,768 ±11,800 | 17.9% ±0.1% , number 24,018,984 ±99,670 |
| $150,000 to $199,999 | 11.7% ±0.3% , number 278,928 ±7,453 | 10.1% ±0.1% , number 13,521,827 ±70,660 |
| $200,000 or more | 14.8% ±0.3% , number 354,467 ±8,370 | 14.8% ±0.1% , number 19,801,668 ±84,120 |
Embed
What residents do for work
Source: ACS 2025 1-year, table A17004.
Show data
| Minnesota | United States | |
|---|---|---|
| Education and health care | 27.2% ±0.5% , number 827,997 ±14,880 | 24.4% ±0.1% , number 40,862,193 ±140,800 |
| Manufacturing | 12.7% ±0.4% , number 386,223 ±12,190 | 9.6% ±0.1% , number 16,064,394 ±91,270 |
| Professional and business services | 11.0% ±0.4% , number 336,162 ±11,450 | 12.8% ±0.1% , number 21,375,231 ±87,110 |
| Retail trade | 10.6% ±0.3% , number 323,420 ±10,170 | 10.6% ±0.1% , number 17,781,181 ±96,660 |
| Arts, food and lodging | 7.1% ±0.3% , number 216,904 ±7,858 | 8.9% ±0.1% , number 14,811,502 ±87,840 |
| Finance, insurance and real estate | 6.9% ±0.3% , number 211,225 ±8,570 | 6.6% ±<0.1% , number 11,025,569 ±68,570 |
| Construction | 6.2% ±0.3% , number 190,161 ±7,680 | 6.7% ±<0.1% , number 11,254,981 ±79,620 |
| Transportation and warehousing | 4.7% ±0.2% , number 144,197 ±6,448 | 5.9% ±<0.1% , number 9,832,211 ±73,020 |
Embed
Where workers come from and go
Minnesota has 2,868,846 jobs and 2,860,540 employed residents. 109,669 people commute in to work and 101,363 commute out, while 2,759,177 both live and work here. The most commuters come from Wisconsin.
Most commuters come from
- Wisconsin: 66,412
- North Dakota: 13,875
- Iowa: 8,362
Most residents commute to
- North Dakota: 38,406
- Wisconsin: 30,224
- Iowa: 8,114
Show data
| Minnesota | |
|---|---|
| Live and work here | 2,759,177 |
| Work here, live elsewhere | 109,669 |
| Live here, work elsewhere | 101,363 |
Embed
All the numbers
| Indicator | Minnesota | US | Rank among states* | Table |
|---|---|---|---|---|
| Median household income | $92,297 ±$1,085 | $84,780 ±$215 | 14th | A14006 |
| Income per person | $50,187 ±$546 | $47,171 ±$115 | 12th | A14024 |
| Income inequality (Gini index) | 0.451 ±0.004 | 0.482 ±0.001 | 41st | A14028 |
| Living in poverty | 9.0% ±0.4% , number 515,019 ±20,410 | 11.8% ±0.1% , number 39,264,183 ±277,400 | 49th | A13004 |
| Unemployment rate | 3.9% ±0.2% , number 122,532 ±7,463 | 4.9% ±<0.1% , number 8,574,594 ±64,350 | 37th | A17005 |
| No health insurance | 5.6% ±0.2% , number 323,354 ±12,720 | 8.4% ±<0.1% , number 28,323,306 ±152,000 | 46th | A20001 |
*1 is the highest. Population is ranked among all states, and the rest among those of 1,000 people or more, whose figures can be ranked. Ranks use 5-year estimates, the only ones covering every state, so they can differ slightly from the figures here.
Education
More college degrees than the US
40.8% of adults 25 and over have a bachelor’s degree or more, higher than the US (37.4%).
Highest level of education
Source: ACS 2025 1-year, table A12001.
Show data
| Minnesota | United States | |
|---|---|---|
| Less than high school | 5.3% ±0.2% , number 214,736 ±9,520 | 9.4% ±0.1% , number 22,321,002 ±120,500 |
| High school only | 23.4% ±0.4% , number 943,576 ±15,020 | 25.6% ±0.1% , number 61,096,726 ±203,400 |
| Some college | 30.4% ±0.4% , number 1,226,537 ±18,080 | 27.7% ±0.1% , number 65,920,977 ±173,500 |
| Bachelor’s degree | 26.3% ±0.4% , number 1,058,095 ±14,560 | 22.3% ±0.1% , number 53,224,312 ±196,700 |
| Graduate degree | 14.5% ±0.3% , number 585,448 ±13,250 | 15.0% ±0.1% , number 35,816,011 ±159,400 |
Embed
All the numbers
| Indicator | Minnesota | US | Rank among states* | Table |
|---|---|---|---|---|
| Bachelor’s degree or more | 40.8% ±0.5% , number 1,643,543 ±19,680 | 37.4% ±0.1% , number 89,040,323 ±253,200 | 12th | A12001 |
| High school graduate or more | 94.7% ±0.8% , number 3,813,656 ±30,660 | 90.6% ±0.2% , number 216,058,026 ±368,200 | 7th | A12001 |
*1 is the highest. Population is ranked among all states, and the rest among those of 1,000 people or more, whose figures can be ranked. Ranks use 5-year estimates, the only ones covering every state, so they can differ slightly from the figures here.
Housing
Home values outran incomes
27.9% of households rent, lower than the US (34.7%). The median home is worth $353,800 and the median rent is $1,357. After inflation, home values rose 29% from 2015 to 2025, while household income rose 6%.
Housing costs and income, 2015 to 2025, after inflation
Source: ACS 1-year, table A10036, A18009, A14006.
Show data
| Minnesota | United States | |
|---|---|---|
| Median home value | +29.1% | +39.3% |
| Median rent | +11.5% | +18.5% |
| Median household income | +6.1% | +10.9% |
Embed
Types of homes
Source: ACS 2025 1-year, table A10032.
Show data
| Minnesota | United States | |
|---|---|---|
| Single-family, detached | 65.5% ±0.5% , number 1,711,716 ±12,300 | 60.9% ±0.1% , number 90,335,844 ±173,300 |
| Single-family, attached | 7.2% ±0.3% , number 188,760 ±7,666 | 6.4% ±<0.1% , number 9,527,703 ±51,230 |
| 2 to 4 units | 3.9% ±0.2% , number 102,214 ±6,061 | 7.5% ±0.1% , number 11,109,005 ±75,790 |
| 5 to 19 units | 5.2% ±0.3% , number 135,835 ±7,292 | 8.7% ±0.1% , number 12,829,882 ±97,590 |
| 20 or more units | 15.5% ±0.5% , number 405,388 ±13,080 | 11.1% ±0.1% , number 16,381,450 ±92,310 |
| Mobile homes and other | 2.7% ±0.1% , number 70,616 ±3,554 | 5.4% ±<0.1% , number 8,045,083 ±53,680 |
Embed
When homes were built
Source: ACS 2025 1-year, table A10055.
Show data
| Minnesota | United States | |
|---|---|---|
| 2010 or later | 13.7% ±0.4% , number 328,473 ±10,700 | 15.1% ±0.1% , number 20,257,912 ±101,300 |
| 2000 to 2009 | 13.2% ±0.4% , number 316,470 ±9,150 | 13.8% ±0.1% , number 18,535,840 ±92,260 |
| 1980 to 1999 | 23.3% ±0.5% , number 557,039 ±11,280 | 24.1% ±0.1% , number 32,332,570 ±118,900 |
| 1960 to 1979 | 22.2% ±0.5% , number 530,868 ±12,350 | 22.9% ±0.1% , number 30,726,302 ±110,000 |
| Before 1960 | 27.6% ±0.5% , number 659,020 ±12,870 | 24.0% ±0.1% , number 32,210,798 ±121,500 |
Embed
All the numbers
| Indicator | Minnesota | US | Rank among states* | Table |
|---|---|---|---|---|
| Housing units | 2,614,529 | – | – | A10001 |
| Households | 2,391,870 ±8,635 | – | – | A10008 |
| People per household | 2.38 ±0.01 | 2.49 ±0.01 | 32nd | A10003 |
| Households that rent | 27.9% ±0.5% , number 667,944 ±11,040 | 34.7% ±0.1% , number 46,551,688 ±193,200 | 45th | A10060 |
| Vacant homes | 8.5% ±0.3% , number 222,659 ±9,012 | 9.6% ±0.1% , number 14,165,545 ±137,100 | 33rd | A10047, A10060 |
| Median gross rent | $1,357 ±$17 | $1,557 ±$4 | 23rd | A18009 |
| Median home value | $353,800 ±$2,300 | $371,100 ±$646 | 23rd | A10036 |
| Renters paying 30% or more of income | 46.1% ±1.4% , number 307,999 ±10,440 | 48.3% ±0.2% , number 22,486,693 ±122,100 | 22nd | A18002 |
| Owners paying 30% or more of income | 21.1% ±0.5% , number 364,548 ±9,667 | 24.2% ±0.1% , number 21,201,943 ±93,050 | 34th | A10040 |
| Homes built before 1960 | 27.6% ±0.5% , number 659,020 ±12,870 | 24.0% ±0.1% , number 32,210,798 ±121,500 | 19th | A10055 |
*1 is the highest. Population is ranked among all states, and the rest among those of 1,000 people or more, whose figures can be ranked. Ranks use 5-year estimates, the only ones covering every state, so they can differ slightly from the figures here.
Getting around
A driving state with short commutes
71.2% of workers drive alone and 14.8% work from home. 30.4% of those who travel to work spend 30 minutes or more getting there, and 7.4% of households have no vehicle.
How people get to work
Source: ACS 2025 1-year, table A09005.
Show data
| Minnesota | United States | |
|---|---|---|
| Drive alone | 71.2% ±0.4% , number 2,135,627 ±17,550 | 69.8% ±0.1% , number 115,297,377 ±192,900 |
| Carpool | 7.5% ±0.3% , number 226,248 ±9,560 | 8.9% ±0.1% , number 14,712,170 ±97,240 |
| Public transit | 2.2% ±0.2% , number 66,866 ±5,752 | 4.3% ±<0.1% , number 7,100,386 ±63,330 |
| Walk | 2.6% ±0.2% , number 79,011 ±5,193 | 2.4% ±<0.1% , number 4,016,469 ±41,070 |
| Work from home | 14.8% ±0.3% , number 442,947 ±10,390 | 12.9% ±0.1% , number 21,288,393 ±105,700 |
| Other | 1.6% ±0.1% , number 48,635 ±4,119 | 1.7% ±<0.1% , number 2,799,658 ±41,510 |
Embed
Time spent getting to work
Source: ACS 2025 1-year, table B09001.
Show data
| Minnesota | United States | |
|---|---|---|
| Under 10 minutes | 15.6% ±0.4% , number 399,077 ±10,170 | 12.0% ±0.1% , number 17,199,225 ±93,440 |
| 10 to 19 minutes | 31.5% ±0.7% , number 804,980 ±17,890 | 27.8% ±0.1% , number 40,059,540 ±137,700 |
| 20 to 29 minutes | 22.5% ±0.5% , number 574,170 ±13,900 | 21.0% ±0.1% , number 30,221,743 ±111,100 |
| 30 to 39 minutes | 15.4% ±0.4% , number 392,916 ±10,790 | 17.1% ±0.1% , number 24,659,138 ±103,800 |
| 40 to 59 minutes | 9.6% ±0.4% , number 245,437 ±9,688 | 12.6% ±0.1% , number 18,104,709 ±97,070 |
| 60 minutes or more | 5.5% ±0.2% , number 139,807 ±6,375 | 9.5% ±0.1% , number 13,681,705 ±84,440 |
Embed
Vehicles per household
Source: ACS 2025 1-year, table A10030.
Show data
| Minnesota | United States | |
|---|---|---|
| None | 7.4% ±0.3% , number 176,466 ±7,649 | 8.8% ±0.1% , number 11,781,997 ±77,240 |
| One | 31.0% ±0.6% , number 742,522 ±13,860 | 33.1% ±0.1% , number 44,424,682 ±160,700 |
| Two | 39.0% ±0.6% , number 931,967 ±14,510 | 36.0% ±0.1% , number 48,200,889 ±176,800 |
| Three or more | 22.6% ±0.4% , number 540,915 ±10,260 | 22.1% ±0.1% , number 29,655,854 ±113,300 |
Embed
All the numbers
| Indicator | Minnesota | US | Rank among states* | Table |
|---|---|---|---|---|
| Drive to work alone | 71.2% ±0.4% , number 2,135,627 ±17,550 | 69.8% ±0.1% , number 115,297,377 ±192,900 | 33rd | A09005 |
| Take public transit | 2.2% ±0.2% , number 66,866 ±5,752 | 4.3% ±<0.1% , number 7,100,386 ±63,330 | 17th | A09005 |
| Work from home | 14.8% ±0.3% , number 442,947 ±10,390 | 12.9% ±0.1% , number 21,288,393 ±105,700 | 9th | A09005 |
| Commute 30 minutes or more | 30.4% ±0.6% , number 778,160 ±15,840 | 39.2% ±0.1% , number 56,445,552 ±165,300 | 38th | B09001 |
| Households with no vehicle | 7.4% ±0.3% , number 176,466 ±7,870 | 8.8% ±<0.1% , number 11,781,997 ±64,240 | 22nd | A10030 |
*1 is the highest. Population is ranked among all states, and the rest among those of 1,000 people or more, whose figures can be ranked. Ranks use 5-year estimates, the only ones covering every state, so they can differ slightly from the figures here.
Places
The largest cities in Minnesota
Population, from the latest estimates available. Figures cover the whole of each place.
Largest cities
- Minneapolis: 430,340
- St. Paul: 306,665
- Rochester: 124,296
- Bloomington: 89,026
- Duluth: 88,323
- Brooklyn Park: 83,538
- Woodbury: 81,547
- Plymouth: 78,955
States like this one
- Pennsylvania: 13,018,639
- Virginia: 8,705,170
- Wisconsin: 5,914,872
- Iowa: 3,210,507
States at least a third this size, with the closest income, education, age, housing and origins.
Every county and place in Minnesota
Find any county, city, town, metro area, ZIP code, school district or district in Minnesota.
Counties
Each of the 87 counties with its population, from ACS 2020–2024 5-year estimates.
- Aitkin County16,056
- Anoka County370,349
- Becker County35,343
- Beltrami County46,512
- Benton County41,593
- Big Stone County5,127
- Blue Earth County69,871
- Brown County25,800
- Carlton County36,518
- Carver County110,041
- Cass County30,992
- Chippewa County12,377
- Chisago County57,991
- Clay County66,059
- Clearwater County8,616
- Cook County5,635
- Cottonwood County11,458
- Crow Wing County67,686
- Dakota County445,771
- Dodge County21,045
- Douglas County39,575
- Faribault County13,914
- Fillmore County21,414
- Freeborn County30,623
- Goodhue County47,943
- Grant County6,127
- Hennepin County1.27M
- Houston County18,653
- Hubbard County21,831
- Isanti County42,596
- Itasca County45,275
- Jackson County9,933
- Kanabec County16,390
- Kandiyohi County44,079
- Kittson County4,084
- Koochiching County11,833
- Lac qui Parle County6,682
- Lake County10,879
- Lake of the Woods County3,821
- Le Sueur County29,113
- Lincoln County5,603
- Lyon County25,503
- Mahnomen County5,358
- Marshall County8,909
- Martin County19,780
- McLeod County36,798
- Meeker County23,468
- Mille Lacs County27,125
- Morrison County34,249
- Mower County40,343
- Murray County8,097
- Nicollet County34,411
- Nobles County22,041
- Norman County6,367
- Olmsted County164,498
- Otter Tail County60,475
- Pennington County13,791
- Pine County29,640
- Pipestone County9,284
- Polk County30,705
- Pope County11,418
- Ramsey County542,945
- Red Lake County3,915
- Redwood County15,350
- Renville County14,558
- Rice County67,917
- Rock County9,621
- Roseau County15,302
- Scott County154,557
- Sherburne County100,560
- Sibley County15,005
- St. Louis County200,123
- Stearns County160,865
- Steele County37,439
- Stevens County9,739
- Swift County9,748
- Todd County25,575
- Traverse County3,243
- Wabasha County21,565
- Wadena County14,256
- Waseca County18,885
- Washington County276,238
- Watonwan County11,205
- Wilkin County6,371
- Winona County49,779
- Wright County148,269
- Yellow Medicine County9,451
Cities, towns and other places
Each of the 914 with its population, from ACS 2020–2024 5-year estimates. Census-designated places are communities without a local government of their own, drawn by the Census Bureau so they can be counted.
- Ada1,833
- Adams745
- Adrian1,236
- Afton2,957
- Aitkin2,323
- Akeley289
- Albany2,821
- Albert Lea18,330
- Alberta93
- Albertville8,207
- Alden629
- Aldrich37
- Alexandria14,735
- Alpha114
- Altura388
- Alvarado317
- Amboy602
- Andover33,035
- Annandale3,399
- Anoka17,970
- Apple Valley55,679
- Appleton1,393
- Arco66
- Arden Hills9,658
- Argyle486
- Arlington2,065
- Ashby394
- Askov304
- Atwater1,203
- Audubon388
- Aurora1,792
- Austin26,358
- Avoca100
- Avon1,552
- Babbitt1,393
- Backus291
- Badger391
- Bagley1,248
- Baker52
- Balaton551
- Ball Club127
- Barnesville2,762
- Barnum503
- Barrett349
- Barry16
- Battle Lake786
- Baudette1,139
- Baxter8,966
- Bayport3,905
- Beardsley229
- Beaulieu63
- Beaver Bay82
- Beaver Creek293
- Becker5,034
- Bejou109
- Belgrade758
- Belle Plaine7,423
- Bellechester227
- Bellingham146
- Beltrami72
- Belview362
- Bemidji15,569
- Bena79
- Benson3,441
- Bertha474
- Bethel474
- Big Falls136
- Big Lake CDP378
- Big Lake city12,367
- Bigelow297
- Bigfork375
- Bingham Lake95
- Birchwood Village866
- Bird Island930
- Biscay138
- Biwabik966
- Blackduck699
- Blaine72,488
- Blomkest129
- Blooming Prairie1,843
- Bloomington88,665
- Blue Earth3,165
- Bluffton263
- Bock49
- Borup132
- Bovey646
- Bowlus278
- Boy River6
- Boyd172
- Braham1,732
- Brainerd14,468
- Brandon451
- Breckenridge3,349
- Breezy Point2,687
- Brewster687
- Bricelyn392
- Brook Park143
- Brooklyn Center32,479
- Brooklyn Park83,876
- Brooks133
- Brookston103
- Brooten602
- Browerville902
- Browns Valley382
- Brownsdale850
- Brownsville609
- Brownton546
- Bruno42
- Buckman339
- Buffalo16,499
- Buffalo Lake635
- Buhl1,022
- Burnsville64,463
- Burtrum94
- Butterfield535
- Byron6,646
- Caledonia2,820
- Callaway224
- Calumet279
- Cambridge10,307
- Campbell245
- Canby1,556
- Cannon Falls4,227
- Canton398
- Carlos512
- Carlton875
- Carver6,239
- Cass Lake635
- Cedar Mills40
- Center City651
- Centerville3,935
- Ceylon259
- Champlin23,294
- Chandler331
- Chanhassen26,006
- Chaska28,706
- Chatfield2,559
- Chickamaw Beach248
- Chisago City5,899
- Chisholm4,712
- Chokio392
- Circle Pines4,968
- Clara City1,466
- Claremont502
- Clarissa622
- Clarkfield913
- Clarks Grove636
- Clear Lake579
- Clearbrook584
- Clearwater1,970
- Clements109
- Cleveland563
- Climax209
- Clinton281
- Clitherall111
- Clontarf45
- Cloquet12,537
- Coates131
- Cobden12
- Cohasset2,703
- Cokato2,782
- Cold Spring4,249
- Coleraine2,150
- Cologne2,282
- Columbia Heights22,155
- Columbus4,248
- Comfrey338
- Comstock100
- Conger99
- Cook423
- Coon Rapids63,468
- Corcoran7,302
- Correll18
- Cosmos536
- Cottage Grove40,992
- Cottonwood1,061
- Courtland770
- Credit River5,551
- Cromwell423
- Crookston7,344
- Crosby2,218
- Crosslake2,521
- Crown College422
- Crystal22,476
- Currie220
- Cuyuna250
- Cyrus355
- Dakota304
- Dalton223
- Danube472
- Danvers126
- Darfur74
- Darwin358
- Dassel1,358
- Dawson1,513
- Dayton9,095
- De Graff58
- Deephaven3,793
- Deer Creek330
- Deer River889
- Deerwood710
- Delano6,942
- Delavan160
- Delhi33
- Dellwood1,181
- Denham33
- Dennison223
- Dent230
- Detroit Lakes10,025
- Dexter350
- Dilworth4,713
- Dodge Center2,880
- Donaldson5
- Donnelly277
- Doran12
- Dover895
- Dovray41
- Dresbach286
- Duluth87,093
- Dumont140
- Dundas1,916
- Dundee79
- Dunnell177
- Eagan68,000
- Eagle Bend597
- Eagle Lake3,281
- East Bethel12,115
- East Grand Forks9,028
- East Gull Lake1,076
- Easton178
- Ebro75
- Echo197
- Eden Prairie63,051
- Eden Valley1,002
- Edgerton1,104
- Edina53,262
- Effie77
- Eitzen281
- Elba102
- Elbow Lake CDP76
- Elbow Lake city1,301
- Elgin1,116
- Elizabeth122
- Elk River26,793
- Elko New Market5,002
- Elkton94
- Ellendale754
- Ellsworth428
- Elmdale172
- Elmore451
- Elrosa217
- Ely3,240
- Elysian676
- Emily693
- Emmons363
- Empire3,092
- Erhard154
- Erskine427
- Esko1,813
- Essig76
- Evan89
- Evansville550
- Eveleth3,448
- Excelsior2,570
- Eyota1,944
- Fairfax1,088
- Fairhaven255
- Fairmont10,296
- Falcon Heights5,085
- Faribault24,631
- Farmington23,902
- Farwell43
- Federal Dam142
- Felton186
- Fergus Falls14,181
- Fertile803
- Fifty Lakes478
- Finland257
- Finlayson267
- Fish Lake93
- Fisher396
- Flensburg199
- Floodwood497
- Florence25
- Foley2,675
- Forada161
- Forest Lake20,729
- Foreston757
- Fort Ripley68
- Fosston1,374
- Fountain493
- Foxhome110
- Franklin526
- Frazee1,647
- Freeborn348
- Freeport787
- Fridley30,241
- Frontenac188
- Frost275
- Fulda1,393
- Funkley55
- Garden City194
- Garfield282
- Garrison156
- Garvin114
- Gary268
- Gaylord2,073
- Gem Lake483
- Geneva387
- Genola81
- Georgetown72
- Ghent439
- Gibbon918
- Gilbert1,697
- Gilman233
- Glencoe5,695
- Glenville572
- Glenwood2,633
- Glyndon1,098
- Golden Valley21,725
- Gonvick221
- Good Thunder456
- Goodhue1,074
- Goodland24
- Goodridge49
- Goodview4,103
- Graceville564
- Granada243
- Grand Marais1,796
- Grand Meadow1,011
- Grand Rapids11,207
- Granite Falls2,685
- Grant3,950
- Grasston112
- Green Isle466
- Greenbush678
- Greenfield2,894
- Greenwald270
- Greenwood699
- Grey Eagle295
- Grove City814
- Grygla266
- Gully53
- Hackensack248
- Hadley29
- Hallock829
- Halma36
- Halstad509
- Ham Lake16,702
- Hamburg547
- Hammond134
- Hampton590
- Hancock859
- Hanley Falls248
- Hanover3,626
- Hanska380
- Harding169
- Hardwick235
- Harmony1,024
- Harris776
- Hartland422
- Hastings22,117
- Hatfield46
- Hawley2,178
- Hayfield1,395
- Hayward231
- Hazel Run58
- Hector1,130
- Heidelberg235
- Henderson875
- Hendricks517
- Hendrum240
- Henning860
- Henriette37
- Herman441
- Hermantown10,218
- Heron Lake593
- Hewitt283
- Hibbing16,057
- High Forest124
- Hill City503
- Hillman27
- Hills748
- Hilltop1,053
- Hinckley1,596
- Hitterdal314
- Hoffman730
- Hokah668
- Holdingford718
- Holland292
- Hollandale340
- Holloway74
- Holt95
- Homer179
- Hopkins18,819
- Houston982
- Howard Lake1,832
- Hoyt Lakes2,064
- Hubbard53
- Hugo16,340
- Humboldt44
- Hutchinson14,680
- Ihlen91
- Independence3,694
- Inger88
- International Falls5,642
- Inver Grove Heights35,906
- Iona214
- Iron Junction86
- Ironton621
- Isanti7,210
- Isle695
- Ivanhoe609
- Jackson3,287
- Janesville2,378
- Jasper818
- Jeffers368
- Jenkins508
- Johnson20
- Jordan6,771
- Kandiyohi493
- Karlstad622
- Kasota554
- Kasson7,050
- Keewatin1,215
- Kelliher341
- Kellogg513
- Kennedy170
- Kenneth72
- Kensington240
- Kent70
- Kenyon1,824
- Kerkhoven802
- Kerrick64
- Kettle River140
- Kiester494
- Kilkenny125
- Kimball709
- Kinbrae2
- Kingston206
- Kinney115
- Knife River131
- La Crescent5,251
- La Prairie592
- La Salle28
- Lafayette484
- Lake Benton794
- Lake Bronson190
- Lake City5,034
- Lake Crystal2,606
- Lake Elmo13,140
- Lake George204
- Lake Henry77
- Lake Lillian157
- Lake Park600
- Lake Shore1,073
- Lake St. Croix Beach1,105
- Lake Wilson237
- Lakefield1,507
- Lakeland1,492
- Lakeland Shores344
- Lakeville74,354
- Lamberton917
- Lancaster315
- Landfall776
- Lanesboro744
- Lansing152
- Laporte71
- Lastrup88
- Lauderdale2,388
- Le Center2,513
- Le Roy803
- Le Sueur4,215
- Lengby43
- Leonard12
- Leonidas37
- Leota169
- Lester Prairie1,898
- Lewiston1,613
- Lewisville255
- Lexington2,770
- Lilydale772
- Lindstrom4,978
- Lino Lakes22,113
- Lismore233
- Litchfield6,576
- Little Canada10,514
- Little Falls9,121
- Little Rock944
- Littlefork636
- Long Beach318
- Long Lake1,728
- Long Prairie3,693
- Longville138
- Lonsdale4,896
- Loretto784
- Louisburg20
- Lowry348
- Lucan220
- Lutsen222
- Luverne4,925
- Lyle504
- Lynd428
- Mabel730
- Madelia2,327
- Madison1,550
- Madison Lake1,322
- Magnolia215
- Mahnomen CDP195
- Mahnomen city1,049
- Mahtomedi8,133
- Mahtowa428
- Manchester32
- Manhattan Beach25
- Mankato45,473
- Mantorville1,047
- Maple Grove71,173
- Maple Lake2,042
- Maple Plain1,701
- Mapleton1,728
- Mapleview110
- Maplewood40,695
- Marble669
- Marietta166
- Marine on St. Croix740
- Marion314
- Marshall13,896
- Martin Lake1,068
- Mayer2,518
- Maynard234
- Mazeppa1,004
- McGrath28
- McGregor367
- McIntosh847
- McKinley92
- Meadowlands174
- Medford1,257
- Medicine Lake596
- Medina6,968
- Meire Grove167
- Melrose3,671
- Menahga1,343
- Mendota207
- Mendota Heights11,612
- Mentor131
- Merrifield121
- Middle River319
- Midway35
- Miesville125
- Milaca3,044
- Milan564
- Millerville116
- Millville247
- Milroy203
- Miltona418
- Minneapolis427,246
- Minneiska111
- Minneota1,594
- Minnesota City135
- Minnesota Lake687
- Minnetonka53,064
- Minnetrista8,708
- Mizpah58
- Montevideo5,315
- Montgomery3,434
- Monticello14,858
- Montrose3,888
- Moorhead45,036
- Moose Lake2,863
- Mora3,732
- Morgan925
- Morris5,128
- Morristown1,265
- Morton384
- Motley608
- Mound9,107
- Mounds View12,926
- Mountain Iron2,860
- Mountain Lake2,070
- Murdock331
- Myrtle31
- Nashua21
- Nashwauk926
- Nassau49
- Naytahwaush478
- Nelson155
- Nerstrand215
- Nett Lake171
- Nevis496
- New Auburn436
- New Brighton22,710
- New Germany595
- New Hope21,181
- New London1,187
- New Munich299
- New Prague8,237
- New Richland1,184
- New Trier78
- New Ulm14,056
- New York Mills1,371
- Newfolden332
- Newport4,754
- Nicollet957
- Nielsville102
- Nimrod118
- Nisswa1,954
- Norcross106
- North Branch11,565
- North Mankato14,211
- North Oaks5,179
- North St. Paul12,570
- Northfield20,742
- Northome159
- Northrop240
- Norwood Young America3,849
- Nowthen4,538
- Oak Grove9,130
- Oak Park Heights4,756
- Oakdale28,585
- Odessa87
- Odin126
- Ogema257
- Ogilvie322
- Okabena210
- Oklee383
- Olivia2,205
- Onamia719
- Ormsby136
- Orono8,195
- Oronoco1,679
- Orr368
- Ortonville2,028
- Osage290
- Osakis1,623
- Oslo260
- Osseo2,584
- Ostrander313
- Otsego22,245
- Ottertail490
- Owatonna26,498
- Palisade148
- Park Rapids4,270
- Parkers Prairie980
- Paynesville2,519
- Pease217
- Pelican Rapids2,586
- Pemberton223
- Pennock549
- Pequot Lakes2,079
- Perham3,627
- Perley126
- Peterson244
- Pickwick171
- Pierz1,424
- Pillager547
- Pine Bend11
- Pine City3,468
- Pine Island3,580
- Pine Point241
- Pine River906
- Pine Springs395
- Pipestone4,129
- Plainview3,500
- Plato242
- Plummer369
- Plymouth79,220
- Ponemah391
- Porter191
- Preston1,362
- Princeton5,274
- Prinsburg651
- Prior Lake28,016
- Proctor3,100
- Quamba82
- Racine416
- Ramsey28,421
- Randall695
- Randolph461
- Ranier509
- Raymond692
- Red Lake1,481
- Red Lake Falls1,348
- Red Wing16,758
- Redby1,495
- Redwood Falls5,068
- Regal33
- Remer371
- Renville1,503
- Revere64
- Rice2,085
- Rice Lake CDP244
- Rice Lake city4,153
- Richfield36,642
- Richmond1,431
- Richville44
- Riverland239
- Riverton145
- Robbinsdale14,234
- Rochester122,330
- Rock Creek1,748
- Rockford4,597
- Rockville2,452
- Rogers13,685
- Rollingstone620
- Ronneby67
- Roosevelt150
- Roscoe96
- Rose Creek429
- Roseau2,736
- Rosemount27,562
- Roseville35,802
- Rothsay454
- Round Lake333
- Roy Lake61
- Royalton1,211
- Rush City3,295
- Rushford1,826
- Rushford Village809
- Rushmore362
- Russell346
- Ruthton222
- Rutledge275
- Sabin718
- Sacred Heart481
- Sanborn299
- Sandstone2,482
- Sargeant30
- Sartell19,758
- Sauk Centre4,621
- Sauk Rapids13,852
- Savage32,889
- Scandia3,950
- Scanlon1,146
- Seaforth100
- Searles201
- Sebeka725
- Sedan40
- Shafer1,186
- Shakopee46,012
- Shelly229
- Sherburn1,015
- Shevlin148
- Shoreview26,714
- Shorewood7,647
- Silver Bay1,769
- Silver Creek167
- Silver Lake815
- Skyline307
- Slayton2,141
- Sleepy Eye3,444
- Sobieski192
- Solway117
- Soudan415
- South End38
- South Haven214
- South St. Paul20,611
- Spicer1,222
- Spring Grove1,177
- Spring Hill97
- Spring Lake Park7,032
- Spring Park1,896
- Spring Valley2,307
- Springfield2,125
- Squaw Lake104
- St. Anthony (Hennepin and Ramsey Counties)9,671
- St. Anthony (Stearns County)57
- St. Augusta3,625
- St. Bonifacius1,997
- St. Charles4,037
- St. Clair710
- St. Cloud70,629
- St. Francis8,372
- St. Hilaire259
- St. James4,767
- St. John's University1,580
- St. Joseph7,021
- St. Leo153
- St. Louis Park49,594
- St. Martin313
- St. Marys Point483
- St. Michael20,010
- St. Paul307,284
- St. Paul Park5,457
- St. Peter12,185
- St. Rosa62
- St. Stephen694
- St. Vincent45
- Stacy4,384
- Stanchfield100
- Staples2,269
- Starbuck1,235
- Steen125
- Stephen526
- Stewart644
- Stewartville6,807
- Stillwater19,355
- Stockton811
- Storden244
- Strandquist91
- Strathcona34
- Sturgeon Lake568
- Sunburg106
- Sunfish Lake533
- Swanville274
- Taconite468
- Tamarack43
- Taopi51
- Taunton128
- Taylors Falls1,167
- Tenstrike207
- The Lakes594
- The Ranch3
- Thief River Falls8,823
- Tintah43
- Tonka Bay1,270
- Tower367
- Tracy2,057
- Trail16
- Trimont546
- Trommald123
- Trosky51
- Truman1,212
- Turtle River58
- Twin Lakes CDP197
- Twin Lakes city158
- Twin Valley719
- Two Harbors3,567
- Tyler1,090
- Ulen413
- Underwood461
- Upsala417
- Urbank40
- Utica216
- Vadnais Heights12,838
- Vergas258
- Vermillion399
- Verndale452
- Vernon Center329
- Vesta311
- Victoria11,295
- Viking125
- Village of Minnetonka Beach469
- Villard236
- Vineland674
- Vining86
- Virginia8,332
- Wabasha2,587
- Wabasso603
- Waconia13,434
- Wadena4,419
- Wahkon258
- Waite Park8,399
- Waldorf171
- Walker848
- Walnut Grove808
- Walters57
- Waltham182
- Wanamingo1,389
- Wanda104
- Warba146
- Warren1,680
- Warroad1,959
- Warsaw560
- Waseca9,164
- Watertown4,790
- Waterville1,947
- Watkins765
- Watson200
- Waubun419
- Waverly2,285
- Wayzata4,354
- Welcome978
- Wells2,296
- Wendell186
- West Concord843
- West Roy Lake30
- West St. Paul21,382
- West Union69
- Westbrook792
- Westport37
- Whalan45
- Wheaton1,389
- Whipholt76
- White Bear Lake23,908
- White Earth506
- Wilder32
- Willernie495
- Williams237
- Willmar21,378
- Willow River342
- Wilmont280
- Wilton327
- Windom4,799
- Winger157
- Winnebago1,280
- Winona26,009
- Winsted2,181
- Winthrop1,381
- Winton124
- Wolf Lake73
- Wolverton145
- Wood Lake368
- Woodbury78,305
- Woodland477
- Woodstock200
- Worthington13,780
- Wrenshall404
- Wright96
- Wykoff377
- Wyoming8,087
- Zemple49
- Zimmerman6,546
- Zumbro Falls157
- Zumbrota3,914
Metro and micro areas
Each of the 28 that reach into Minnesota, with its whole population, from ACS 2020–2024 5-year estimates. Metro and micro areas are counties tied together by commuting, drawn by the Office of Management and Budget.
- Albert Lea, MN Micro Area30,623
- Alexandria, MN Micro Area39,575
- Austin, MN Micro Area40,343
- Bemidji, MN Micro Area46,512
- Brainerd, MN Micro Area98,678
- Detroit Lakes, MN Micro Area35,343
- Duluth, MN-WI Metro Area280,870
- Fairmont, MN Micro Area19,780
- Fargo, ND-MN Metro Area259,459
- Faribault-Northfield, MN Micro Area67,917
- Fergus Falls, MN Micro Area60,475
- Grand Forks, ND-MN Metro Area103,628
- Grand Rapids, MN Micro Area45,275
- Hutchinson, MN Micro Area36,798
- La Crosse-Onalaska, WI-MN Metro Area170,190
- Mankato, MN Metro Area104,282
- Marshall, MN Micro Area25,503
- Minneapolis-St. Paul-Bloomington, MN-WI Metro Area3.71M
- New Ulm, MN Micro Area25,800
- Owatonna, MN Micro Area37,439
- Red Wing, MN Micro Area47,943
- Rochester, MN Metro Area228,522
- Sioux Falls, SD-MN Metro Area298,181
- St. Cloud, MN Metro Area202,458
- Wahpeton, ND-MN Micro Area22,955
- Willmar, MN Micro Area44,079
- Winona, MN Micro Area49,779
- Worthington, MN Micro Area22,041
ZIP codes
Each of the 877 with people in it, by the town it's centered in, from ACS 2020–2024 5-year estimates. These are the Census Bureau's ZIP Code Tabulation Areas, which follow the Postal Service's ZIP codes as closely as census blocks allow.
- 55001Afton3,027
- 55003Bayport3,905
- 55005East Bethel4,376
- 55006Braham3,694
- 55007Brook Park2,201
- 55008Cambridge16,729
- 55009Cannon Falls8,127
- 55011East Bethel11,482
- 55012Center City2,087
- 55013Chisago City7,015
- 55014Lino Lakes29,047
- 55016Cottage Grove40,695
- 55017799
- 55018Dennison969
- 55019Dundas2,305
- 55020Elko New Market4,115
- 55021Faribault30,908
- 55024Farmington37,287
- 55025Forest Lake25,891
- 55026Frontenac470
- 55027Goodhue2,739
- 55029Stanchfield31
- 55030Henriette1,711
- 55031New Trier1,881
- 55032Harris3,416
- 55033Hastings29,674
- 55036Henriette37
- 55037Hinckley5,215
- 55038Hugo25,061
- 55040Isanti14,837
- 55041Lake City7,510
- 55042Lake Elmo13,705
- 55043Lakeland3,424
- 55044Lakeville64,762
- 55045Center City7,846
- 55046Lonsdale6,145
- 55047Marine on St. Croix2,244
- 55049Medford2,636
- 55051Mora9,935
- 55052Morristown2,114
- 55053Nerstrand995
- 55054Elko New Market2,831
- 55055Newport4,754
- 55056North Branch14,753
- 55057Northfield25,650
- 55060Owatonna29,599
- 55063Pine City9,212
- 55065Randolph1,224
- 55066Red Wing19,226
- 55068Rosemount33,119
- 55069Rush City5,836
- 55070St. Francis8,441
- 55071St. Paul Park5,719
- 550724,418
- 55073Scandia4,169
- 55074Shafer2,393
- 55075South St. Paul20,714
- 55076Inver Grove Heights21,374
- 55077Inver Grove Heights14,503
- 55079Stacy8,508
- 55080Stanchfield3,180
- 55082Stillwater36,277
- 55084Taylors Falls1,975
- 55085Vermillion371
- 55087Morristown327
- 55088Lonsdale1,812
- 55089Red Wing1,612
- 55090Willernie401
- 55092Martin Lake11,200
- 55101St. Paul7,911
- 55102St. Paul19,630
- 55103St. Paul13,125
- 55104St. Paul45,762
- 55105St. Paul28,617
- 55106St. Paul56,708
- 55107St. Paul15,377
- 55108Falcon Heights15,224
- 55109Maplewood33,461
- 55110White Bear Lake37,305
- 55111Mendota233
- 55112New Brighton45,346
- 55113Roseville40,819
- 55114St. Paul5,049
- 55115Mahtomedi8,949
- 55116St. Paul25,918
- 55117Maplewood44,697
- 55118West St. Paul29,564
- 55119St. Paul44,567
- 55120Mendota Heights5,058
- 55121Eagan9,198
- 55122Eagan32,261
- 55123Eagan26,501
- 55124Apple Valley55,658
- 55125Woodbury44,185
- 55126Shoreview27,456
- 55127North Oaks18,090
- 55128Oakdale29,384
- 55129Woodbury34,120
- 55130St. Paul17,775
- 55150Mendota201
- 55301Albertville13,482
- 55302Annandale7,326
- 55303Ramsey52,614
- 55304Ham Lake49,737
- 55305Minnetonka21,068
- 55306Burnsville16,830
- 55307Arlington2,981
- 55308Becker10,321
- 55309Big Lake city21,378
- 55310Bird Island1,344
- 55311Maple Grove38,472
- 55312Brownton1,428
- 55313Buffalo24,913
- 55314Buffalo Lake1,187
- 55315Carver7,147
- 55316Champlin23,294
- 55317Chanhassen22,299
- 55318Chaska30,369
- 55319Clear Lake5,185
- 55320Clearwater5,998
- 55321Cokato5,646
- 55322Cologne3,775
- 55324Darwin1,179
- 55325Dassel4,795
- 55327Dayton6,016
- 55328Delano10,019
- 55329Eden Valley2,219
- 55330Elk River45,721
- 55331Shorewood19,805
- 55332Fairfax1,667
- 55333Franklin698
- 55334Gaylord2,727
- 55335Gibbon1,666
- 55336Glencoe8,296
- 55337Burnsville47,633
- 55338Green Isle978
- 55339Hamburg942
- 55340Corcoran10,183
- 55341Hanover3,561
- 55342Hector1,973
- 55343Hopkins27,102
- 55344Eden Prairie14,034
- 55345Minnetonka20,789
- 55346Eden Prairie18,588
- 55347Eden Prairie30,429
- 55349Howard Lake3,549
- 55350Hutchinson18,610
- 55352Jordan10,515
- 55353Kimball3,361
- 55354Lester Prairie3,159
- 55355Litchfield9,663
- 55356Orono5,696
- 55357Greenfield3,419
- 55358Maple Lake5,061
- 55359Independence6,997
- 55360Mayer3,341
- 55362Monticello20,663
- 55363Montrose5,814
- 55364Mound14,097
- 55366New Auburn423
- 55367New Germany1,122
- 55368Norwood Young America1,775
- 55369Maple Grove39,290
- 55370Plato558
- 55371Princeton18,103
- 55372Credit River34,772
- 55373Rockford5,822
- 55374Rogers16,661
- 55375Minnetrista4,326
- 55376St. Michael20,106
- 55378Savage32,162
- 55379Shakopee50,041
- 55381Silver Lake1,819
- 55382South Haven3,691
- 55384Spring Park1,896
- 55385Stewart1,337
- 55386Victoria10,077
- 55387Waconia15,030
- 55388Watertown5,893
- 55389Watkins2,384
- 55390Waverly3,492
- 55391Wayzata15,502
- 55395Winsted2,723
- 55396Winthrop2,288
- 55397Norwood Young America3,404
- 55398Zimmerman17,688
- 55401Minneapolis11,816
- 55402Minneapolis667
- 55403Minneapolis17,601
- 55404Minneapolis28,920
- 55405Minneapolis17,198
- 55406Minneapolis36,581
- 55407Minneapolis37,667
- 55408Minneapolis31,507
- 55409Minneapolis11,188
- 55410Minneapolis20,422
- 55411Minneapolis27,741
- 55412Minneapolis24,460
- 55413Minneapolis14,655
- 55414Minneapolis35,007
- 55415Minneapolis6,900
- 55416St. Louis Park35,015
- 55417Minneapolis25,102
- 55418Minneapolis31,505
- 55419Minneapolis29,738
- 55420Bloomington24,451
- 55421Hilltop30,843
- 55422Golden Valley28,452
- 55423Richfield36,724
- 55424Edina10,289
- 55425Bloomington10,908
- 55426St. Louis Park25,251
- 55427Golden Valley24,764
- 55428New Hope32,499
- 55429Crystal27,024
- 55430Brooklyn Center22,749
- 55431Bloomington18,664
- 55432Fridley33,672
- 55433Coon Rapids34,463
- 55434Blaine33,029
- 55435Edina14,192
- 55436Edina14,462
- 55437Bloomington18,881
- 55438Bloomington15,701
- 55439Edina9,459
- 55441Plymouth17,944
- 55442Plymouth12,694
- 55443Brooklyn Park33,660
- 55444Brooklyn Park16,559
- 55445Brooklyn Park13,546
- 55446Plymouth28,247
- 55447Plymouth20,931
- 55448Coon Rapids29,005
- 55449Blaine34,443
- 55450Richfield124
- 55454Minneapolis8,880
- 55455Minneapolis5,390
- 55601Beaver Bay128
- 55602346
- 55603Finland490
- 556043,719
- 55605572
- 55606198
- 55607192
- 55609Knife River131
- 55612Lutsen535
- 55613232
- 55614Silver Bay2,485
- 55615Lutsen379
- 556167,250
- 55702Brookston412
- 55703Cook906
- 55704Askov1,051
- 55705Aurora3,211
- 55706Babbitt1,703
- 55707Mahtowa3,470
- 55708Biwabik929
- 55709Taconite4,628
- 55710Mountain Iron1,362
- 55711Brookston540
- 55712Kerrick522
- 55713Buhl1,048
- 55716Calumet279
- 55717287
- 55718Carlton3,111
- 55719Chisholm5,613
- 55720Cloquet17,448
- 55721Cohasset4,044
- 55722Coleraine963
- 55723Cook1,927
- 55724707
- 5572589
- 55726Cromwell1,087
- 55731Winton5,361
- 55732Soudan1,453
- 55733Esko5,139
- 55734Iron Junction6,265
- 55735Finlayson1,814
- 55736Floodwood1,344
- 55738599
- 55741McKinley2,947
- 55742Goodland259
- 55744Grand Rapids20,295
- 55746Hibbing16,730
- 55748Hill City1,374
- 55749532
- 55750Hoyt Lakes2,068
- 55751Iron Junction1,388
- 55752446
- 55753Keewatin1,215
- 55756Kerrick309
- 55757Kettle River739
- 55758Kinney121
- 55760McGregor2,894
- 55763495
- 55764Marble541
- 55765Meadowlands803
- 55767Moose Lake4,582
- 55768Mountain Iron2,964
- 55769Nashwauk2,219
- 55771Orr1,484
- 55772Nett Lake77
- 55775Calumet1,309
- 55779Brookston3,905
- 55780Big Lake CDP277
- 55781821
- 55782Soudan420
- 55783Denham2,639
- 55784Warba149
- 55785Hill City271
- 55786Taconite118
- 55787Tamarack621
- 55790Tower1,847
- 55792Virginia9,663
- 55793Warba666
- 55795Rutledge1,807
- 55796Winton135
- 55797Wrenshall1,457
- 55798Wright627
- 55802Duluth2,399
- 55803Rice Lake city17,662
- 55804Knife River15,922
- 55805Duluth10,602
- 55806Duluth9,356
- 55807Duluth9,763
- 55808Duluth5,691
- 55810Proctor8,285
- 55811Hermantown28,118
- 55812Duluth10,859
- 55814Hermantown319
- 55901Rochester58,495
- 55902Rochester26,464
- 55904Marion29,639
- 55906Rochester20,437
- 55909Adams1,387
- 55910Elba1,171
- 55912Austin29,632
- 55917Blooming Prairie3,410
- 55918Brownsdale1,084
- 55919Brownsville1,040
- 55920Byron9,271
- 55921Caledonia4,659
- 55922Canton818
- 55923Chatfield4,375
- 55924Claremont1,170
- 55925Dakota1,336
- 55926Dexter799
- 55927Dodge Center4,297
- 55929Dover1,383
- 55931Eitzen392
- 55932Elgin1,999
- 55933Elkton215
- 55934Eyota3,466
- 55935Fountain1,006
- 55936Grand Meadow1,785
- 55939Harmony1,973
- 55940Hayfield2,791
- 55941Hokah1,072
- 55943Houston3,221
- 55944Kasson8,161
- 55945Kellogg1,321
- 55946Kenyon3,395
- 55947La Crescent7,403
- 55949Whalan1,923
- 55950Lansing129
- 55951Le Roy1,385
- 55952Lewiston2,585
- 55953Lyle901
- 55954Mabel1,332
- 55955Mantorville2,605
- 55956Mazeppa2,199
- 55957Millville748
- 55959Rollingstone1,889
- 55960Oronoco3,375
- 55961Ostrander520
- 55962Rushford Village756
- 55963Pine Island5,244
- 55964Plainview4,400
- 55965Preston2,300
- 55967Racine1,001
- 55968Wabasha151
- 55969Rollingstone1,169
- 55970Rose Creek1,068
- 55971Rushford3,018
- 55972St. Charles5,434
- 55973Sargeant251
- 55974Spring Grove1,902
- 55975Spring Valley4,433
- 55976Stewartville8,509
- 55977Taopi180
- 55979Utica1,053
- 55981Wabasha3,955
- 55982Waltham551
- 55983Wanamingo1,874
- 55985West Concord1,759
- 55987Homer34,072
- 55990Wykoff899
- 55991Zumbro Falls1,394
- 55992Zumbrota5,544
- 56001Skyline51,585
- 56003North Mankato15,258
- 56007Albert Lea21,377
- 56009Alden1,527
- 56010Amboy1,159
- 56011Belle Plaine9,921
- 56013Blue Earth4,535
- 56014Bricelyn727
- 56016Clarks Grove989
- 56017Cleveland1,763
- 56019Comfrey795
- 56020Conger74
- 56021Courtland1,108
- 56022Darfur63
- 56023Delavan559
- 56024Eagle Lake3,647
- 56025Easton483
- 56026Ellendale2,124
- 56027Elmore692
- 56028Elysian1,018
- 56029Emmons642
- 56030Essig30
- 56031Fairmont11,665
- 56032Freeborn407
- 56033Frost411
- 56034Garden City393
- 56035Geneva387
- 56036Myrtle1,740
- 56037Good Thunder1,374
- 56039Granada880
- 56041Hanska1,039
- 56042Hartland751
- 56043Hayward423
- 56044Henderson2,370
- 56045Hollandale922
- 56046Ellendale157
- 56048Janesville4,025
- 56050Kasota1,306
- 56051Kiester610
- 56052Kilkenny747
- 56054Lafayette853
- 56055Lake Crystal3,898
- 56056La Salle55
- 56057Le Center3,919
- 56058Le Sueur6,067
- 56060Lewisville400
- 56062Madelia3,234
- 56063Madison Lake3,221
- 56065Mapleton2,766
- 56068Minnesota Lake1,041
- 56069Montgomery4,991
- 56071New Prague13,157
- 56072New Richland2,228
- 56073New Ulm17,339
- 56074Nicollet1,845
- 56075Northrop176
- 56078Pemberton451
- 56080St. Clair672
- 56081St. James6,172
- 56082St. Peter14,606
- 56083Sanborn741
- 56085Sleepy Eye5,047
- 56087Springfield3,105
- 56088Truman2,071
- 56089Twin Lakes city214
- 56090Vernon Center596
- 56091Waldorf256
- 56093Waseca12,672
- 56096Waterville2,953
- 56097Wells3,487
- 56098Winnebago1,970
- 56101Windom6,157
- 56110Adrian1,633
- 56111Alpha356
- 56113Arco208
- 56114Avoca309
- 56115Balaton1,123
- 56116Beaver Creek559
- 56117Bigelow400
- 56118Bingham Lake457
- 56119Brewster1,188
- 56120Butterfield983
- 56121Ceylon590
- 56122Chandler660
- 56123Dovray420
- 56125Dovray41
- 56127Dunnell474
- 56128Edgerton1,768
- 56129Ellsworth761
- 56131Fulda2,238
- 56132Garvin462
- 56134Hardwick441
- 56136Hendricks1,203
- 56137Heron Lake1,039
- 56138Hills927
- 56139Holland474
- 56140Ihlen81
- 56141Iona362
- 56142Ivanhoe1,036
- 56143Jackson4,509
- 56144Jasper1,143
- 56145Jeffers510
- 56146Magnolia55
- 56147Kenneth135
- 56149Lake Benton1,318
- 56150Lakefield2,802
- 56151Lake Wilson643
- 56152Lamberton1,431
- 56153Leota173
- 56155Lismore411
- 56156Luverne6,371
- 56157Lynd707
- 56158Magnolia322
- 56159Mountain Lake2,668
- 56160Odin224
- 56161Okabena356
- 56162Ormsby313
- 56164Pipestone5,516
- 56165Wilmont333
- 56166Revere178
- 56167Round Lake555
- 56168Rushmore858
- 56169Russell780
- 56170Ruthton546
- 56171Sherburn1,632
- 56172Slayton2,987
- 56173Steen307
- 56174Storden352
- 56175Tracy2,972
- 56176Trimont888
- 56178Tyler1,669
- 56180Walnut Grove1,287
- 56181Welcome1,280
- 56183Westbrook1,241
- 56185Wilmont500
- 56186Woodstock450
- 56187Worthington15,214
- 56201Willmar25,146
- 56207Alberta211
- 56208Appleton2,113
- 56209Atwater2,570
- 56210Barry16
- 56211Beardsley484
- 56212Bellingham475
- 56214Belview648
- 56215Benson4,677
- 56216Blomkest592
- 56218Boyd435
- 56219Browns Valley697
- 56220Canby2,617
- 56221Chokio731
- 56222Clara City1,972
- 56223Clarkfield1,351
- 56224Clements259
- 56225Clinton734
- 56226Clontarf215
- 56227Correll215
- 56228Cosmos922
- 56229Cottonwood1,672
- 56230Danube779
- 56231Danvers405
- 56232Dawson2,379
- 56235Donnelly523
- 56236Dumont493
- 56237Echo553
- 56239Ghent587
- 56240Graceville796
- 56241Granite Falls3,933
- 56243Grove City1,921
- 56244Hancock1,832
- 56245Hanley Falls441
- 56248Herman761
- 56249Holloway301
- 56251Kandiyohi949
- 56252Kerkhoven1,310
- 56253Lake Lillian740
- 56255Lucan389
- 56256Madison2,446
- 56257Marietta377
- 56258Marshall15,888
- 56260Maynard913
- 56262Milan871
- 56263Milroy446
- 56264Minneota2,277
- 56265Montevideo7,225
- 56266Morgan1,583
- 56267Morris6,783
- 56270Morton1,076
- 56271Murdock1,334
- 56273New London4,956
- 56274Norcross170
- 56276Odessa256
- 56277Olivia2,905
- 56278Ortonville2,698
- 56279Pennock1,126
- 56280Porter530
- 56281Prinsburg786
- 56282Raymond1,471
- 56283Redwood Falls6,481
- 56284Renville2,168
- 56285Sacred Heart983
- 56287Seaforth98
- 56288Spicer4,697
- 56289Sunburg599
- 56291Taunton397
- 56292Vesta577
- 56293Wabasso1,147
- 56294Wanda104
- 56295Watson305
- 56296Wheaton1,956
- 56297Wood Lake811
- 56301St. Cloud35,580
- 56303St. Cloud25,827
- 56304St. Cloud17,473
- 56307Albany5,385
- 56308Alexandria27,008
- 56309Ashby1,296
- 56310Avon5,431
- 56311Barrett666
- 56312Belgrade2,270
- 56313Bock49
- 56314Bowlus1,393
- 56315Brandon1,803
- 56316Brooten1,461
- 56318Burtrum1,191
- 56319Miltona1,283
- 56320Cold Spring8,482
- 56321St. John's University1,526
- 56323Cyrus612
- 56324Dalton1,028
- 56325Elrosa217
- 56326Evansville1,716
- 56327Farwell729
- 56328Flensburg144
- 56329Gilman7,778
- 56330Foreston2,097
- 56331Freeport2,057
- 56332Garfield1,627
- 56334Sedan5,776
- 56335Greenwald270
- 56336Grey Eagle1,566
- 56338Hillman1,636
- 56339Hoffman1,115
- 56340Holdingford2,309
- 56342Isle2,788
- 56343Kensington759
- 56345Little Falls15,008
- 56347Long Prairie8,042
- 56349Lowry829
- 56350McGrath471
- 56352Melrose6,112
- 56353Milaca9,546
- 56354Miltona1,337
- 56355Carlos737
- 56356New Munich266
- 56357Ronneby1,230
- 56358Ogilvie3,107
- 56359Onamia3,521
- 56360Osakis3,721
- 56361Parkers Prairie2,592
- 56362Paynesville5,773
- 56363Pease238
- 56364Lastrup5,708
- 56367Rice7,209
- 56368Richmond4,262
- 56369Rockville582
- 56371Roscoe95
- 56373Royalton3,329
- 56374St. Joseph10,029
- 56375St. Stephen694
- 56376St. Martin313
- 56377Sartell21,063
- 56378Sauk Centre8,649
- 56379Sauk Rapids17,607
- 56381Starbuck2,344
- 56382Swanville1,365
- 56384Upsala303
- 56385Westport917
- 56386Wahkon661
- 56387Waite Park7,756
- 56389West Union74
- 56401Brainerd31,841
- 56425Baxter8,932
- 56431Aitkin9,312
- 56433Akeley1,614
- 56434Aldrich182
- 56435Backus2,801
- 56437Bertha1,410
- 56438Browerville2,942
- 56440Clarissa1,395
- 56441Trommald3,348
- 56442Crosslake2,762
- 56443Randall1,537
- 56444Deerwood3,331
- 56446Eagle Bend1,418
- 56447Emily843
- 56448Fifty Lakes476
- 56449Fort Ripley1,710
- 56450Vineland983
- 56452Hackensack1,936
- 56453Hewitt841
- 56455Riverton1,688
- 56458Lake George301
- 56461Laporte3,337
- 56464Menahga5,053
- 56465Trommald2,476
- 56466Motley3,284
- 56467Nevis2,827
- 56468Nisswa4,520
- 56469Palisade967
- 56470Park Rapids11,186
- 56472Pequot Lakes8,830
- 56473Pillager3,518
- 56474Pine River4,475
- 56475Randall1,750
- 56477Sebeka2,594
- 56479Staples5,021
- 56481Verndale2,255
- 56482Wadena7,619
- 56484Walker3,252
- 56501Detroit Lakes18,004
- 56510Ada2,292
- 56511Audubon2,006
- 56514Barnesville3,994
- 56515Battle Lake2,723
- 56516Bejou352
- 56517Beltrami255
- 56518Bluffton494
- 56519Borup287
- 56520Breckenridge3,852
- 56521Callaway692
- 56522Campbell604
- 56523Climax382
- 56524Clitherall694
- 56525Comstock100
- 56527Deer Creek881
- 56528Dent1,623
- 56529Dilworth4,713
- 56531Elbow Lake city2,063
- 56533Elizabeth286
- 56534Erhard1,201
- 56535Erskine1,307
- 56536Felton502
- 56537Fergus Falls19,856
- 56540Fertile1,891
- 56541Twin Valley31
- 56542Fosston2,486
- 56543Foxhome222
- 56544Frazee5,726
- 56545Gary676
- 56546Georgetown210
- 56547Glyndon2,762
- 56548Halstad611
- 56549Hawley5,028
- 56550Hendrum413
- 56551Henning2,387
- 56552Hitterdal527
- 56553Kent261
- 56554Lake Park2,752
- 56556McIntosh1,312
- 56557Beaulieu2,758
- 56560Moorhead44,405
- 56562Moorhead528
- 56563Moorhead1,285
- 56565Nashua83
- 56566Naytahwaush613
- 56567New York Mills3,367
- 56568Nielsville140
- 56569White Earth1,324
- 56570Pine Point1,173
- 56571Ottertail1,745
- 56572Pelican Rapids5,827
- 56573Perham7,221
- 56574Perley264
- 56575Pine Point665
- 56576Dent820
- 56578654
- 56579Rothsay1,050
- 56580Baker1,305
- 56581Shelly276
- 56583Tintah150
- 56584Twin Valley1,297
- 56585Ulen1,064
- 56586Underwood1,873
- 56587Vergas1,339
- 56588Vining483
- 56589Twin Lakes CDP1,760
- 56590Wendell367
- 56591White Earth429
- 56592Winger550
- 56594Wolverton442
- 56601Bemidji34,784
- 56621Rice Lake CDP4,336
- 56623Baudette2,733
- 56626Bena254
- 56627192
- 56628Bigfork1,675
- 56629224
- 56630Blackduck2,180
- 56633Cass Lake4,802
- 56634Clearbrook1,801
- 56636Deer River4,643
- 56637Inger153
- 56639Effie359
- 56641Federal Dam339
- 56644Gonvick830
- 56646Gully266
- 56647Tenstrike822
- 566498,825
- 56650Kelliher831
- 56651Pine Bend667
- 56652Leonard437
- 56653Littlefork1,239
- 56654109
- 56655Longville1,351
- 56657251
- 56659Inger122
- 56660Mizpah193
- 56661Northome895
- 56662Emily624
- 56663282
- 56666Ponemah816
- 56667770
- 56668Ranier217
- 56669264
- 56670Redby1,477
- 566712,961
- 56672Remer2,052
- 56673Roosevelt642
- 56676Shevlin1,780
- 56678Solway1,730
- 56680Inger137
- 56681Squaw Lake267
- 56683Tenstrike677
- 56684Trail280
- 5668591
- 56686Williams905
- 5668894
- 56701Thief River Falls12,705
- 56710Alvarado483
- 5671185
- 56713Argyle777
- 56714Badger1,065
- 56715Brooks329
- 56716Crookston8,903
- 56720Donaldson15
- 56721East Grand Forks10,679
- 56722377
- 56723Fisher838
- 56724112
- 56725Goodridge941
- 56726Greenbush1,494
- 56727858
- 56728Hallock1,116
- 56729Halma121
- 56731Humboldt137
- 56732Karlstad951
- 56733Kennedy380
- 56734Lake Bronson601
- 56735Lancaster683
- 56736Mentor687
- 56737Middle River811
- 56738Newfolden1,228
- 56742Oklee744
- 56744Oslo571
- 56748Plummer673
- 56750Red Lake Falls2,324
- 56751Roseau5,761
- 56754St. Hilaire491
- 56755Humboldt82
- 56756581
- 56757Stephen861
- 56758Strandquist385
- 56759Strathcona421
- 56760Viking496
- 56761458
- 56762Warren2,433
- 56763Warroad5,180
Towns and townships
Each of the 1,775 with people in it, from ACS 2020–2024 5-year estimates: the county subdivisions that are governments of their own. A city, borough or village that is one too is listed with the places above.
- Aastad township230
- Acoma township1,280
- Acton township323
- Adams township476
- Adrian township136
- Aetna township161
- Agassiz township104
- Agder township92
- Agram township510
- Aitkin township862
- Akeley township640
- Akron township (Big Stone County)199
- Akron township (Wilkin County)135
- Alango township249
- Alaska township240
- Alba township210
- Albany township1,076
- Albert Lea township428
- Alberta township720
- Albin township249
- Albion township1,343
- Alborn township442
- Alden township (Freeborn County)298
- Alden township (St. Louis County)239
- Aldrich township679
- Alexandria township3,027
- Alfsborg township339
- Alliance township193
- Alma township77
- Almond township117
- Alta Vista township185
- Alton township446
- Altona township87
- Alvwood township20
- Amador township804
- Amboy township109
- Amherst township400
- Amiret township168
- Amo township103
- Amor township588
- Andover township119
- Andrea township43
- Angora township272
- Angus township56
- Ann Lake township414
- Ann township143
- Ansel township75
- Anthony township43
- Antrim township266
- Appleton township248
- Arago township800
- Arbo township959
- Arctander township316
- Ardenhurst township135
- Arena township131
- Arendahl township343
- Arlington township430
- Arlone township413
- Arna township100
- Arrowhead township211
- Arthur township (Kanabec County)1,597
- Arthur township (Traverse County)43
- Artichoke township82
- Arveson township69
- Ash Lake township166
- Ashland township388
- Ashley township227
- Athens township2,203
- Atherton township190
- Atkinson township383
- Atlanta township206
- Audubon township857
- Augsburg township109
- Augusta township100
- Ault township201
- Aurdal township1,586
- Aurora township484
- Austin township880
- Automba township136
- Avon township2,004
- Badger township185
- Badoura township106
- Baker township87
- Baldwin township7,076
- Balkan township843
- Ball Bluff township327
- Balsam township (Aitkin County)52
- Balsam township (Itasca County)783
- Bancroft township752
- Bandon township126
- Bangor township141
- Barber township257
- Barclay township569
- Barnesville township178
- Barnett township165
- Barnum township1,172
- Barry township482
- Barsness township115
- Bartlett township409
- Barto township117
- Bashaw township188
- Bassett township57
- Bath township363
- Battle Plain township157
- Battle township75
- Baxter township149
- Bay Lake township1,035
- Baytown township2,223
- Bear Creek township111
- Bear Park township190
- Bearville township186
- Beatty township349
- Beauford township427
- Beaulieu township100
- Beaver Bay township561
- Beaver Creek township363
- Beaver Falls township256
- Beaver township (Aitkin County)51
- Beaver township (Fillmore County)236
- Beaver township (Roseau County)94
- Becker township (Cass County)682
- Becker township (Sherburne County)5,601
- Bejou township91
- Belfast township137
- Belgium township73
- Belgrade township1,137
- Belle Creek township415
- Belle Plaine township1,063
- Belle Prairie township579
- Belle River township406
- Bellevue township1,332
- Belmont township206
- Belvidere township396
- Bemidji township3,363
- Ben Wade township250
- Bennington township116
- Benson township261
- Benton township713
- Benville township67
- Bergen township1,143
- Berlin township497
- Bernadotte township248
- Bertha township375
- Beseman township141
- Beulah township81
- Big Bend township223
- Big Lake township8,147
- Big Stone township243
- Big Woods township55
- Bigelow township393
- Bigfork township287
- Birch Cooley township173
- Birch Creek township218
- Birch Lake township529
- Birch township60
- Birchdale township969
- Bird Island township208
- Bismarck township334
- Biwabik township812
- Black Hammer township269
- Black River township29
- Blackberry township849
- Blackhoof township1,039
- Blakeley township388
- Blind Lake township86
- Bloom township111
- Bloomer township75
- Bloomfield township423
- Blooming Grove township604
- Blooming Prairie township454
- Blowers township253
- Blue Earth City township558
- Blue Hill township2,571
- Blue Mounds township188
- Blueberry township706
- Bluffton township677
- Bogus Brook township1,844
- Bondin township227
- Boon Lake township400
- Borgholm township1,742
- Bowstring township177
- Boxville township32
- Boy Lake township318
- Boy River township98
- Bradbury township181
- Bradford township (Isanti County)3,473
- Bradford township (Wilkin County)66
- Brandon township916
- Brandrup township195
- Brandsvold township270
- Brandt township44
- Bray township62
- Breckenridge township273
- Breitung township651
- Bremen township328
- Brevator township1,064
- Bridgewater township1,892
- Brighton township152
- Brislet township28
- Bristol township357
- Brockway township2,951
- Brook Park township581
- Brookfield township146
- Brookville township174
- Browns Creek township57
- Browns Valley township152
- Brownsville township443
- Bruce township465
- Bruno township147
- Brunswick township1,484
- Brush Creek township147
- Buckman township888
- Buffalo township1,808
- Buh township592
- Bull Moose township150
- Bullard township221
- Bungo township117
- Burbank township458
- Burke township181
- Burleene township285
- Burlington township1,784
- Burnhamville township782
- Burnstown township316
- Burton township140
- Buse township612
- Butler township272
- Butterfield township137
- Butternut Valley township272
- Buzzle township307
- Bygland township272
- Byron township (Cass County)169
- Byron township (Waseca County)238
- Cairo township206
- Caledonia township596
- Callaway township250
- Cambria township392
- Cambridge township2,534
- Camden township984
- Cameron township68
- Camp 5 township22
- Camp Lake township159
- Camp Release township243
- Camp township149
- Campbell township44
- Candor township578
- Canisteo township570
- Cannon City township1,073
- Cannon Falls township920
- Cannon township17
- Canosia township2,305
- Canton township576
- Caribou township37
- Carimona township289
- Carlisle township287
- Carlos township2,337
- Carlston township277
- Carpenter township126
- Carrolton township422
- Carson township262
- Carsonville township267
- Cascade township2,826
- Cashel township294
- Castle Rock township1,502
- Cedar Lake township3,061
- Cedar Mills township397
- Cedar township (Marshall County)80
- Cedar township (Martin County)216
- Cedar Valley township165
- Cedarbend township220
- Center Creek township180
- Center township1,343
- Ceresco township138
- Cerro Gordo township197
- Champion township50
- Chanarambie township186
- Charlestown township152
- Chatfield township779
- Chatham township1,546
- Chengwatana township815
- Cherry Grove township341
- Cherry township792
- Chester township (Polk County)107
- Chester township (Wabasha County)367
- Chief township128
- Chippewa Falls township284
- Chisago Lake township4,908
- Christiania township293
- Claremont township397
- Clark township (Aitkin County)183
- Clark township (Faribault County)247
- Clay township57
- Clayton township161
- Clear Lake township1,521
- Clearwater township1,334
- Cleveland township846
- Clifton township (Lyon County)209
- Clifton township (Traverse County)72
- Clinton Falls township321
- Clinton township (Rock County)223
- Clinton township (St. Louis County)949
- Clitherall township505
- Clontarf township158
- Clover township (Clearwater County)56
- Clover township (Hubbard County)150
- Clover township (Mahnomen County)126
- Clover township (Pine County)425
- Cloverleaf township82
- Clow township65
- Cokato township1,106
- Colfax township624
- Collegeville township3,351
- Collins township449
- Collinwood township1,168
- Columbia township482
- Colvin township262
- Comfort township1,111
- Como township33
- Compton township804
- Comstock township132
- Concord township477
- Connelly township105
- Coon Creek township283
- Copley township825
- Cordova township486
- Corinna township2,559
- Corliss township515
- Cormant township130
- Cormorant township1,031
- Cornish township (Aitkin County)66
- Cornish township (Sibley County)236
- Cosmos township255
- Cotton township356
- Cottonwood township861
- Courtland township503
- Crane Lake township81
- Crate township229
- Croke township84
- Cromwell township458
- Crooked Creek township253
- Crooked Lake township655
- Crooks township128
- Crookston township511
- Crosby township109
- Crow Lake township311
- Crow River township335
- Crow Wing Lake township407
- Crow Wing township2,075
- Crystal Bay township469
- Cuba township324
- Culdrum township414
- Culver township278
- Cushing township828
- Custer township161
- Daggett Brook township632
- Dahlgren township1,026
- Dailey township232
- Dalbo township794
- Dale township123
- Dane Prairie township912
- Danforth township82
- Danielson township226
- Danville township235
- Darling township516
- Darnen township395
- Darwin township526
- Dassel township1,690
- Davis township59
- Dead Lake township624
- Decoria township1,314
- Deer Creek township487
- Deer Park township94
- Deer River township610
- Deer township145
- Deerfield township (Cass County)157
- Deerfield township (Steele County)485
- Deerhorn township97
- Deerwood township (Crow Wing County)1,471
- Deerwood township (Kittson County)110
- Delafield township213
- Delavan township241
- Delaware township73
- Delhi township349
- Dell Grove township919
- Delton township66
- Denmark township1,883
- Denver township137
- Derrynane township845
- Des Moines River township151
- Des Moines township234
- Detroit township1,891
- Dewald township182
- Dewey township140
- Dexter township257
- Diamond Lake township228
- Dieter township165
- Dollymount township48
- Donnelly township (Marshall County)9
- Donnelly township (Stevens County)77
- Dora township580
- Douglas township773
- Dover township446
- Dovray township124
- Dovre township2,214
- Drammen township84
- Dresbach township407
- Dryden township198
- Dublin township260
- Dudley township519
- Duluth township2,158
- Dunbar township274
- Dunn township929
- Durand township237
- Eagle Lake township509
- Eagle Point township13
- Eagle township554
- Eagle Valley township399
- Eagle View township132
- Eagles Nest township258
- East Chain township289
- East Lake Lillian township178
- East Park township26
- East Side township749
- East Valley township52
- Eastern township148
- Echo township164
- Eckles township1,898
- Eckvoll township87
- Eddy township418
- Eden Lake township1,640
- Eden township (Brown County)206
- Eden township (Pipestone County)138
- Eden township (Polk County)177
- Edison township127
- Edna township869
- Edwards township235
- Effington township205
- Eglon township698
- Eidsvold township148
- Elba township287
- Elbow Lake township100
- Eldorado township64
- Elgin township724
- Elizabeth township894
- Elk Lake township309
- Elk township235
- Elkton township354
- Ellington township260
- Ellsborough township132
- Ellsburg township254
- Ellsworth township792
- Elm Creek township151
- Elmdale township996
- Elmer township (Pipestone County)266
- Elmer township (St. Louis County)129
- Elmira township323
- Elmo township356
- Elmore township180
- Elmwood township433
- Elysian township739
- Emardville township190
- Embarrass township653
- Emerald township174
- Emmet township162
- Enstrom township430
- Enterprise township195
- Equality township126
- Erdahl township437
- Erhards Grove township489
- Ericson township212
- Erie township1,402
- Erin township768
- Espelie township26
- Esther township150
- Euclid township138
- Eureka township1,178
- Evansville township224
- Everglade township108
- Evergreen township398
- Everts township599
- Ewington township171
- Excel township250
- Eyota township615
- Fahlun township406
- Fair Haven township1,488
- Fairbanks township131
- Fairfax township172
- Fairfield township (Crow Wing County)264
- Fairfield township (Swift County)135
- Fairmont township311
- Fairview township (Cass County)1,005
- Fairview township (Lyon County)519
- Falk township310
- Fall Lake township538
- Falun township214
- Fanny township87
- Farden township1,014
- Farley township61
- Farm Island township947
- Farming township942
- Farmington township477
- Fawn Lake township630
- Faxon township836
- Fayal township1,938
- Featherstone township819
- Feeley township346
- Felton township107
- Fenton township194
- Fergus Falls township860
- Fern township383
- Field township285
- Fieldon township207
- Fillmore township492
- Fine Lakes township108
- Finlayson township501
- Fish Lake township2,470
- Fisher township132
- Fleming township (Aitkin County)403
- Fleming township (Pine County)98
- Flom township159
- Floodwood township196
- Flora township134
- Florence township1,553
- Florida township79
- Flowing township143
- Foldahl township66
- Folden township272
- Folsom township81
- Ford township204
- Forest City township707
- Forest Prairie township1,049
- Forest township (Becker County)110
- Forest township (Rice County)1,377
- Forestville township405
- Fork township2
- Fort Ripley township1,054
- Fortier township127
- Fossum township203
- Foster township (Big Stone County)130
- Foster township (Faribault County)236
- Fountain Prairie township131
- Fountain township242
- Fox Lake township193
- Foxhome township78
- Framnas township459
- Franconia township1,817
- Frankford township462
- Franklin township2,904
- Fraser township264
- Fredenberg township1,393
- Freeborn township197
- Freedom township406
- Freeland township109
- Freeman township502
- Fremont township231
- French Lake township1,585
- French township610
- Friberg township768
- Friendship township145
- Frohn township1,515
- Gail Lake township139
- Galena township253
- Gales township133
- Garden City township652
- Garden township206
- Garfield township (Lac qui Parle County)104
- Garfield township (Polk County)590
- Garnes township198
- Garrison township856
- Geneva township488
- Gennessee township458
- Gentilly township205
- Georgetown township116
- Germania township569
- Germantown township179
- Gervais township250
- Getty township386
- Gilchrist township222
- Gillford township558
- Gilmanton township906
- Girard township794
- Glasgow township227
- Glen township499
- Glencoe township496
- Glendorado township846
- Glenwood township1,053
- Glyndon township475
- Gnesen township2,018
- Godfrey township216
- Golden Valley township238
- Good Hope township (Itasca County)85
- Good Hope township (Norman County)16
- Goodhue township527
- Goodland township433
- Goodridge township39
- Goose Prairie township142
- Gordon township582
- Gorman township542
- Gorton township32
- Gould township206
- Grace township62
- Graceville township57
- Grafton township221
- Graham Lakes township189
- Graham township507
- Granby township227
- Grand Forks township178
- Grand Lake township2,715
- Grand Meadow township329
- Grand Plain township52
- Grand Prairie township207
- Grandview township199
- Grange township149
- Granite Falls township275
- Granite Ledge township926
- Granite Rock township179
- Granite township399
- Grant Valley township2,206
- Granville township58
- Grass Lake township931
- Grattan township35
- Gray township208
- Great Bend township352
- Great Scott township471
- Green Isle township622
- Green Lake township1,543
- Green Meadow township60
- Green Prairie township675
- Green Valley township494
- Greenbush township1,384
- Greenfield township1,222
- Greenleaf township897
- Greenvale township825
- Greenway township2,039
- Greenwood township (Clearwater County)104
- Greenwood township (St. Louis County)975
- Gregory township72
- Grey Cloud Island township262
- Grey Eagle township564
- Grimstad township96
- Grove Lake township304
- Grove Park-Tilden township153
- Grove township480
- Gully township66
- Guthrie township547
- Hagali township399
- Hagen township179
- Halden township121
- Hale township802
- Hallock township95
- Halstad township77
- Hamden township212
- Hamlin township151
- Hammer township169
- Hammond township23
- Hampden township29
- Hampton township829
- Hamre township55
- Hancock township323
- Hansonville township137
- Hantho township98
- Harmony township323
- Harris township3,332
- Harrison township531
- Hart Lake township482
- Hart township386
- Hartford township637
- Hartland township246
- Harvey township437
- Hassan Valley township715
- Haugen township249
- Havana township479
- Havelock township204
- Haven township2,164
- Haverhill township1,622
- Hawk Creek township124
- Hawley township636
- Hay Brook township211
- Hay Creek township1,014
- Hayes township175
- Hayfield township435
- Hayland township477
- Hayward township340
- Hazel Run township161
- Hazelton township (Aitkin County)677
- Hazelton township (Kittson County)218
- Hector township241
- Hegbert township36
- Hegne township77
- Heier township145
- Height of Land township771
- Helen township950
- Helena township1,776
- Helga township1,734
- Helgeland township22
- Henderson township929
- Hendricks township174
- Hendrickson township338
- Hendrum township87
- Henning township309
- Henrietta township1,389
- Henryville township128
- Hereim township239
- Heron Lake township361
- Hersey township226
- Hickory township98
- Higdem township84
- High Forest township894
- Highland Grove township258
- Highland township325
- Highlanding township200
- Highwater township103
- Hill Lake township441
- Hill River township140
- Hill township20
- Hillman township (Kanabec County)535
- Hillman township (Morrison County)224
- Hillsdale township833
- Hinckley township738
- Hines township616
- Hiram township503
- Hobart township796
- Hodges township269
- Hoff township248
- Hokah township378
- Holden township447
- Holding township1,379
- Holland township387
- Holly township88
- Hollywood township992
- Holmes City township670
- Holmesville township580
- Holst township271
- Holt township (Fillmore County)311
- Holt township (Marshall County)119
- Holy Cross township95
- Holyoke township192
- Home Brook township290
- Home Lake township58
- Home township489
- Homer township1,101
- Homestead township321
- Hope township170
- Hornet township237
- Horton township171
- Houston township411
- Hubbard township (Hubbard County)984
- Hubbard township (Polk County)54
- Hudson township1,099
- Humboldt township272
- Hunter township220
- Huntersville township88
- Huntly township88
- Huntsville township550
- Huss township99
- Hutchinson township1,111
- Hyde Park township309
- Ida township1,539
- Ideal township1,266
- Idun township220
- Indian Lake township162
- Industrial township680
- Inguadona township184
- Inman township327
- Iona township (Murray County)120
- Iona township (Todd County)645
- Iosco township495
- Irondale township1,203
- Irving township1,018
- Isanti township1,871
- Island Lake township (Lyon County)162
- Island Lake township (Mahnomen County)358
- Isle Harbor township545
- Itasca township208
- Jackson township1,521
- Jadis township604
- Jamestown township696
- Janesville township535
- Jay township275
- Jefferson township117
- Jenkins township572
- Jessenland township474
- Jevne township412
- Jo Daviess township262
- Johnson township18
- Johnsonville township209
- Jones township453
- Jordan township388
- Judson township481
- Jupiter township135
- Kabetogama township105
- Kalevala township271
- Kalmar township1,496
- Kanabec township1,005
- Kanaranzi township324
- Kandiyohi township607
- Kandota township914
- Kasota township1,521
- Kathio township1,424
- Keene township153
- Kego township500
- Kelliher township212
- Kelsey township120
- Kelso township356
- Kenyon township454
- Kerkhoven township153
- Kerrick township240
- Kertsonville township81
- Kettle River township531
- Keystone township61
- Kiester township150
- Kildare township107
- Kilkenny township467
- Kimball township77
- Kimberly township185
- King township162
- Kinghurst township222
- Kingman township171
- Kingston township1,436
- Kintire township162
- Knife Lake township1,351
- Knute township535
- Kragero township126
- Kragnes township218
- Krain township990
- Kratka township216
- Kroschel township168
- Kugler township170
- Kurtz township246
- La Crescent township1,169
- La Crosse township128
- La Garde township171
- La Prairie township364
- Lac qui Parle township198
- Lafayette township704
- LaGrand township4,281
- Lake Alice township130
- Lake Andrew township909
- Lake Belt township190
- Lake Benton township203
- Lake Edward township2,129
- Lake Elizabeth township271
- Lake Emma township1,005
- Lake Eunice township1,517
- Lake Fremont township174
- Lake George township (Hubbard County)318
- Lake George township (Stearns County)275
- Lake Grove township198
- Lake Hanska township276
- Lake Hattie township164
- Lake Henry township237
- Lake Ida township133
- Lake Jessie township200
- Lake Johanna township169
- Lake Lillian township129
- Lake Marshall township642
- Lake Mary township1,074
- Lake Park township540
- Lake Pleasant township103
- Lake Prairie township651
- Lake Sarah township308
- Lake Shore township131
- Lake Stay township165
- Lake township (Roseau County)1,775
- Lake township (Wabasha County)442
- Lake Valley township332
- Lake View township1,939
- Lakeport township834
- Lakeside township (Aitkin County)488
- Lakeside township (Cottonwood County)431
- Laketown township2,124
- Lakeview township238
- Lakewood township2,248
- Lakin township477
- Lambert township94
- Lamberton township136
- Lammers township691
- Land township210
- Lanesburgh township1,995
- Langhei township251
- Langola township980
- Langor township197
- Lansing township833
- Laona township533
- Larkin township153
- Lavell township325
- Lawrence township (Grant County)92
- Lawrence township (Itasca County)541
- Le Ray township780
- Le Roy township349
- Le Sauk township1,446
- Leaf Lake township620
- Leaf Mountain township340
- Leaf River township804
- Leaf Valley township511
- Leavenworth township291
- Lee township (Aitkin County)42
- Lee township (Beltrami County)101
- Lee township (Norman County)134
- Leech Lake township595
- Leeds township134
- Leenthrop township254
- Leiding township402
- Leigh township245
- Lemond township569
- Leon township (Clearwater County)341
- Leon township (Goodhue County)823
- Leonardsville township110
- Leota township383
- Leslie township607
- Lessor township180
- Leven township495
- Lewis township74
- Lexington township712
- Libby township56
- Liberty township (Beltrami County)913
- Liberty township (Polk County)126
- Lida township827
- Lien township85
- Lime Lake township129
- Lime township889
- Limestone township125
- Lincoln township (Blue Earth County)205
- Lincoln township (Marshall County)81
- Lind township27
- Linden Grove township94
- Linden township299
- Linsell township15
- Linwood township5,235
- Lisbon township159
- Lismore township105
- Litchfield township786
- Little Elbow township236
- Little Elk township386
- Little Falls township1,825
- Little Pine township66
- Little Rock township172
- Little Sauk township1,082
- Livonia township6,308
- Lockhart township18
- Lodi township228
- Logan township (Aitkin County)210
- Logan township (Grant County)75
- London township270
- Lone Pine township523
- Lone Tree township177
- Long Lake township (Crow Wing County)1,202
- Long Lake township (Watonwan County)367
- Long Lost Lake township47
- Long Prairie township1,126
- Loon Lake township831
- Lorain township244
- Louisville township (Red Lake County)216
- Louisville township (Scott County)1,439
- Louriston township308
- Lowell township284
- Lowville township184
- Lucas township162
- Lund township281
- Lura township169
- Lutsen township471
- Luverne township606
- Luxemburg township751
- Lyle township379
- Lynd township399
- Lynden township1,889
- Lynn township378
- Lyons township (Lyon County)144
- Lyons township (Wadena County)324
- Lyra township266
- Macsville township128
- Macville township159
- Madelia township334
- Madison township203
- Magnolia township180
- Mahtowa township690
- Maine Prairie township1,965
- Maine township567
- Malmo township325
- Malta township103
- Malung township495
- Mamre township289
- Manannah township587
- Manchester township436
- Mandt township115
- Manfred township53
- Mankato township1,748
- Mansfield township255
- Manston township23
- Mantorville township1,808
- Mantrap township727
- Manyaska township334
- Maple Grove township (Becker County)448
- Maple Grove township (Crow Wing County)670
- Maple Lake township2,490
- Maple Ridge township (Beltrami County)138
- Maple Ridge township (Isanti County)802
- Maple township525
- Mapleton township352
- Maplewood township264
- Marble township126
- Marcell township383
- Marion township4,105
- Marsh Creek township133
- Marsh Grove township128
- Marshall township310
- Marshan township1,381
- Marshfield township242
- Martin township262
- Martinsburg township145
- Mary township47
- Marysland township83
- Marysville township2,292
- Mason township232
- Max township141
- Maxwell township243
- May township (Cass County)938
- May township (Washington County)2,637
- Mayfield township44
- Mayhew Lake township1,031
- Mayville township324
- Maywood township1,041
- Mazeppa township658
- McCauleyville township50
- McCrea township217
- McDavitt township534
- McDonaldsville township132
- McGregor township38
- McKinley township140
- McPherson township346
- Meadow Brook township216
- Meadow township322
- Meadowlands township328
- Meadows township67
- Medford township985
- Medo township285
- Mehurin township64
- Melrose township1,198
- Melville township178
- Meriden township551
- Merton township349
- Mickinock township321
- Middle River township60
- Middletown township313
- Middleville township1,045
- Midway township (Cottonwood County)215
- Midway township (St. Louis County)1,252
- Milaca township1,947
- Milford township760
- Millerville township449
- Millward township41
- Millwood township1,038
- Milo township1,304
- Milton township800
- Miltona township920
- Minden township1,428
- Minerva township238
- Minneiska township184
- Minneola township677
- Minneota township325
- Minnesota Falls township396
- Minnesota Lake township171
- Minnewaska township533
- Minnie township8
- Mission Creek township458
- Mission township783
- Mitchell township113
- Moe township703
- Moland township341
- Moltke township296
- Money Creek township641
- Monroe township261
- Monson township124
- Montgomery township757
- Monticello township3,328
- Moonshine township97
- Moore township260
- Moorhead township149
- Moose Creek township235
- Moose Lake township (Beltrami County)310
- Moose Lake township (Carlton County)1,036
- Moose Lake township (Cass County)197
- Moose Park township108
- Moose River township39
- Moose township88
- Moran township424
- Moranville township810
- Morcom township45
- Morgan township256
- Morken township111
- Morrill township699
- Morris township370
- Morrison township145
- Morristown township642
- Morse township (Itasca County)639
- Morse township (St. Louis County)1,143
- Moscow township511
- Motley township174
- Moulton township98
- Mound Prairie township542
- Mound township253
- Mount Morris township109
- Mount Pleasant township493
- Mount Vernon township266
- Mountain Lake township223
- Moyer township90
- Moylan township104
- Mudgett township51
- Mulligan township269
- Munch township467
- Munson township1,403
- Murray township162
- Nashville township157
- Nashwauk township1,463
- Nebish township236
- Nelson Park township136
- Nelson township255
- Nereson township40
- Nesbit township182
- Ness township46
- Nessel township1,836
- Nevada township445
- Nevis township1,106
- New Auburn township353
- New Avon township227
- New Dosey township70
- New Folden township245
- New Hartford township817
- New Haven township1,127
- New Independence township343
- New London township2,936
- New Maine township185
- New Market township3,556
- New Prairie township233
- New Richland township421
- New Solum township357
- New Sweden township284
- Newburg township381
- Newry township341
- Newton township728
- Nickerson township256
- Nicollet township559
- Nidaros township346
- Nilsen township56
- Nininger township908
- Nokay Lake township839
- Nora township (Clearwater County)457
- Nora township (Pope County)191
- Norden township470
- Nordick township51
- Nordland township (Aitkin County)1,108
- Nordland township (Lyon County)134
- Nore township83
- Norfolk township163
- Norman township (Pine County)342
- Norman township (Yellow Medicine County)291
- Normania township156
- Normanna township915
- North Branch township1,779
- North Fork township218
- North Germany township257
- North Hero township133
- North Ottawa township48
- North Star township (Brown County)273
- North Star township (St. Louis County)164
- North township520
- Northern township3,659
- Northfield township812
- Northland township (Polk County)172
- Northland township (St. Louis County)190
- Norton township494
- Norway Lake township296
- Norway township (Fillmore County)365
- Norway township (Kittson County)97
- Norwegian Grove township313
- Numedal township161
- Nunda township369
- O'Brien township43
- Oak Lawn township1,833
- Oak Park township87
- Oak township474
- Oak Valley township323
- Oakland township (Freeborn County)477
- Oakland township (Mahnomen County)292
- Oakport township448
- Oakwood township405
- Odessa township143
- Odin township156
- Ogema township504
- Olney township128
- Omro township54
- Onamia township549
- Onstad township64
- Orange township383
- Orion township493
- Oronoco township2,497
- Orrock township3,642
- Orton township213
- Ortonville township68
- Orwell township199
- Osage township896
- Osakis township686
- Osborne township261
- Oscar township237
- Osceola township83
- Oshawa township560
- Oshkosh township165
- Oteneagen township277
- Otisco township597
- Otrey township153
- Ottawa township239
- Otter Tail Peninsula township78
- Otter Tail township520
- Otto township565
- Owatonna township728
- Owens township378
- Oxford township910
- Paddock township294
- Page township972
- Palmer township2,581
- Palmville township38
- Palmyra township252
- Park township46
- Parke township519
- Parker township (Marshall County)59
- Parker township (Morrison County)531
- Parkers Prairie township588
- Parnell township (Polk County)71
- Parnell township (Traverse County)47
- Partridge township690
- Paxton township702
- Paynesville township1,539
- Peace township922
- Pelan township23
- Pelican Lake township578
- Pelican township (Crow Wing County)581
- Pelican township (Otter Tail County)486
- Pembina township660
- Penn township309
- Pepin township380
- Pepperton township121
- Pequaywan township130
- Perch Lake township985
- Percy township91
- Perham township1,115
- Perry Lake township281
- Perry township84
- Petersburg township186
- Pickerel Lake township742
- Pierz township577
- Pike Bay township1,811
- Pike Creek township925
- Pike township399
- Pillsbury township259
- Pilot Grove township199
- Pilot Mound township319
- Pine City township1,456
- Pine Island township669
- Pine Lake township (Cass County)251
- Pine Lake township (Clearwater County)598
- Pine Lake township (Otter Tail County)703
- Pine Lake township (Pine County)481
- Pine Point township296
- Pine River township1,058
- Plainview township354
- Platte Lake township371
- Platte township431
- Pleasant Grove township715
- Pleasant Hill township936
- Pleasant Mound township140
- Pleasant Prairie township225
- Pleasant Valley township264
- Pleasant View township99
- Pliny township137
- Pohlitz township34
- Pokegama township2,847
- Polk Centre township37
- Polonia township18
- Pomme de Terre township138
- Pomroy township (Itasca County)25
- Pomroy township (Kanabec County)381
- Ponto Lake township721
- Poplar Grove township93
- Poplar River township104
- Poplar township145
- Popple Grove township189
- Popple township407
- Poppleton township87
- Port Hope township516
- Portage township173
- Posen township282
- Powers township858
- Prairie Lake township51
- Prairie View township214
- Prairieville township278
- Preble township198
- Prescott township224
- Preston Lake township195
- Preston township280
- Princeton township2,038
- Prior township303
- Providence township99
- Pulaski township328
- Queen township117
- Quincy township302
- Quiring township81
- Rabbit Lake township388
- Racine township646
- Randolph township913
- Ransom township198
- Rapidan township941
- Ravenna township2,092
- Raymond township249
- Red Eye township526
- Red Lake Falls township151
- Red Rock township660
- Redpath township20
- Redwood Falls township186
- Reine township113
- Reiner township127
- Reis township121
- Remer township187
- Rendsville township86
- Reno township410
- Reynolds township842
- Rheiderland township242
- Rhinehart township139
- Rice River township111
- Rice township165
- Riceland township471
- Riceville township71
- Rich Valley township579
- Richardson township446
- Richardville township53
- Richland township480
- Richmond township478
- Richwood township900
- Ridgely township100
- Ripley township (Dodge County)150
- Ripley township (Morrison County)666
- River Falls township222
- River township52
- Riverdale township312
- Riverside township270
- Riverton township530
- Roberts township104
- Rochester township2,483
- Rock Dell township772
- Rock Lake township248
- Rock township168
- Rockford township3,407
- Rocksbury township1,201
- Rockwell township57
- Rockwood township (Hubbard County)544
- Rockwood township (Wadena County)323
- Rogers township69
- Rolling Forks township148
- Rolling Green township175
- Rollingstone township856
- Rollis township58
- Rome township117
- Roome township143
- Roosevelt township (Beltrami County)192
- Roosevelt township (Crow Wing County)644
- Roscoe township896
- Rose Dell township104
- Rose Hill township98
- Rosebud township321
- Rosedale township128
- Roseland township325
- Rosendale township351
- Roseville township (Grant County)83
- Roseville township (Kandiyohi County)789
- Rosewood township286
- Rosing township194
- Ross Lake township274
- Ross township369
- Rost township205
- Round Grove township308
- Round Lake township (Becker County)191
- Round Lake township (Jackson County)123
- Round Prairie township756
- Royal township140
- Royalton township916
- Runeberg township637
- Rush Lake township940
- Rushseba township963
- Russia township52
- Rutland township292
- Sacred Heart township257
- Sago township277
- Salem township (Cass County)109
- Salem township (Olmsted County)1,038
- Salo township59
- San Francisco township833
- Sand Creek township1,265
- Sand Lake township223
- Sanders township198
- Sandnes township229
- Sandstone township728
- Sandsville township82
- Sandy township330
- Sanford township133
- Santiago township1,841
- Saratoga township692
- Sargeant township290
- Sauk Centre township1,328
- Sauk Rapids township453
- Savannah township236
- Scambler township628
- Scandia township41
- Scandia Valley township1,427
- Schoolcraft township164
- Schroeder township232
- Sciota township471
- Scott township102
- Seavey township50
- Seely township156
- Selma township140
- Severance township223
- Seward township157
- Shafer township1,222
- Shamrock township1,290
- Shaokatan township252
- Sharon township625
- Shelburne township230
- Shelby township265
- Sheldon township280
- Shell Lake township365
- Shell River township170
- Shell Rock township282
- Shelly township56
- Sheridan township224
- Sherman township300
- Shetek township348
- Shevlin township416
- Shible township89
- Shieldsville township895
- Shingobee township1,455
- Shooks township125
- Shotley township44
- Sibley township307
- Sigel township299
- Silver Brook township544
- Silver Creek township (Lake County)1,213
- Silver Creek township (Wright County)2,582
- Silver Lake township334
- Silver Leaf township445
- Silver township373
- Silverton township265
- Sinclair township95
- Sinnott township29
- Sioux Agency township218
- Sioux Valley township201
- Six Mile Grove township155
- Skagen township226
- Skandia township96
- Skane township83
- Skelton township477
- Skree township156
- Slater township186
- Slayton township273
- Sletten township156
- Smiley township471
- Smoky Hollow township180
- Sodus township198
- Solem township201
- Soler township78
- Solway township1,989
- Somerset township727
- South Bend township1,458
- South Branch township249
- South Fork township839
- South Harbor township924
- South Red River township18
- Southbrook township54
- Southside township1,360
- Spalding township288
- Spang township229
- Sparta township678
- Spencer Brook township1,952
- Spencer township562
- Split Rock township175
- Splithand township171
- Spring Brook township39
- Spring Creek township (Becker County)112
- Spring Creek township (Norman County)54
- Spring Grove township274
- Spring Hill township278
- Spring Lake township3,478
- Spring Prairie township394
- Spring Valley township564
- Springdale township198
- Springfield township127
- Springvale township1,762
- Springwater township239
- Spruce Grove township (Becker County)331
- Spruce Grove township (Beltrami County)67
- Spruce Hill township439
- Spruce township511
- Spruce Valley township185
- St. Charles township667
- St. George township1,162
- St. James township251
- St. Johns township288
- St. Joseph township (Kittson County)39
- St. Joseph township (Stearns County)910
- St. Lawrence township612
- St. Martin township423
- St. Mary township484
- St. Mathias township580
- St. Olaf township367
- St. Vincent township70
- St. Wendel township2,315
- Stafford township264
- Stanchfield township1,071
- Stanford township2,457
- Stanley township166
- Stanton township1,032
- Staples township935
- Star Lake township490
- Star township61
- Stark township224
- Stately township92
- Steamboat River township84
- Steenerson township33
- Sterling township278
- Stevens township49
- Stillwater township1,724
- Stockholm township991
- Stokes township (Itasca County)169
- Stokes township (Roseau County)189
- Stoneham township227
- Stoney Brook township302
- Stony Brook township99
- Stony River township232
- Stony Run township366
- Storden township147
- Stowe Prairie township439
- Straight River township790
- Strand township105
- Sturgeon Lake township476
- Sturgeon township148
- Sugar Bush township (Becker County)548
- Sugar Bush township (Beltrami County)196
- Sullivan township154
- Summit Lake township293
- Summit township (Beltrami County)185
- Summit township (Steele County)458
- Sumner township501
- Sumter township546
- Sundal township119
- Sundown township187
- Sunnyside township68
- Sunrise township1,983
- Svea township5
- Sverdrup township565
- Swan Lake township191
- Swan River township573
- Swanville township481
- Swede Grove township362
- Swede Prairie township116
- Swedes Forest township79
- Sweet township385
- Swenoda township87
- Sylvan township2,982
- Synnes township181
- Tabor township111
- Tamarac township83
- Tanberg township52
- Tansem township233
- Tara township (Swift County)102
- Tara township (Traverse County)87
- Taylor township (Beltrami County)137
- Taylor township (Traverse County)50
- Tegner township33
- Teien township130
- Ten Lake township979
- Ten Mile Lake township95
- Tenhassen township276
- Terrebonne township109
- Thief Lake township34
- Third River township48
- Thomastown township738
- Thompson township100
- Thomson township5,534
- Thorpe township50
- Three Lakes township138
- Thunder Lake township238
- Timothy township194
- Tintah township70
- Toad Lake township436
- Todd township1,414
- Tofte township346
- Toivola township155
- Toqua township37
- Tordenskjold township502
- Torning township402
- Torrey township176
- Transit township231
- Traverse township291
- Trelipe township180
- Trondhjem township152
- Trout Lake township1,125
- Troy township (Pipestone County)245
- Troy township (Renville County)347
- Tumuli township394
- Tunsberg township163
- Turner township129
- Turtle Creek township236
- Turtle Lake township (Beltrami County)1,305
- Turtle Lake township (Cass County)714
- Turtle River township1,082
- Twin Lakes township (Carlton County)2,259
- Twin Lakes township (Mahnomen County)754
- Two Inlets township212
- Two Rivers township899
- Tynsid township40
- Tyro township115
- Tyrone township506
- Udolpho township497
- Ulen township206
- Underwood township187
- Union Grove township634
- Union township263
- Urness township288
- Utica township680
- Vail township177
- Vallers township210
- Valley township128
- Van Buren township121
- Vasa township904
- Vega township143
- Veldt township42
- Verdi township130
- Verdon township40
- Vermilion Lake township243
- Vermillion township1,396
- Vernon Center township268
- Vernon township705
- Verona township286
- Vesta township154
- Victor township961
- Viding township28
- Vienna township111
- Viking township197
- Villard township698
- Vineland township68
- Viola township553
- Vivian township156
- Waasa township250
- Wabana township661
- Wabedo township452
- Waconia township1,168
- Wacouta township366
- Wadena township1,023
- Wagner township448
- Wakefield township2,800
- Walcott township1,106
- Walden township (Cass County)432
- Walden township (Pope County)159
- Walls township103
- Walnut Lake township234
- Walter township125
- Waltham township329
- Walworth township179
- Wanamingo township428
- Wang township271
- Wanger township42
- Ward township396
- Warren township540
- Warrenton township69
- Warsaw township (Goodhue County)656
- Warsaw township (Rice County)1,161
- Washington Lake township406
- Washington township944
- Wasioja township913
- Waskish township97
- Watab township3,433
- Waterbury township161
- Waterford township543
- Watertown township988
- Waterville township666
- Watopa township273
- Waukenabo township385
- Waukon township113
- Waverly township141
- Wawina township49
- Wealthwood township254
- Webster township1,747
- Weimer township175
- Welch township774
- Wellington township146
- Wells township1,529
- Wergeland township164
- West Albany township330
- West Bank township98
- West Heron Lake township184
- West Lakeland township3,941
- West Newton township388
- West Union township226
- West Valley township96
- Westbrook township201
- Westerheim township221
- Western township97
- Westfield township425
- Westford township320
- Westline township192
- Westport township267
- Westside township137
- Wheatland township1,202
- Wheeling township529
- White Bear Lake township512
- White Bear township10,656
- White Earth township770
- White Oak township344
- White Pine township23
- White township3,109
- Whited township989
- Whitefield township525
- Whiteford township55
- Whitewater township239
- Wild Rice township230
- Wildwood township178
- Wilkinson township544
- Williams township105
- Willmar township547
- Willow Lake township229
- Willow Valley township83
- Wilma township105
- Wilmington township385
- Wilmont township211
- Wilson township (Cass County)542
- Wilson township (Winona County)1,174
- Wilton township302
- Winchester township44
- Windemere township1,702
- Windom township499
- Windsor township18
- Winfield township203
- Wing River township419
- Winger township275
- Winnebago City township203
- Winnebago township242
- Winsor township134
- Winsted township893
- Wirt township60
- Wisconsin township170
- Wiscoy township301
- Wolf Lake township351
- Wolford township409
- Wolverton township79
- Wood Lake township222
- Woodland township1,120
- Woodrow township (Beltrami County)32
- Woodrow township (Cass County)763
- Woods township193
- Woodside township (Otter Tail County)238
- Woodside township (Polk County)396
- Woodville township1,304
- Workman township164
- Worthington township438
- Wrenshall township422
- Wright township63
- Wuori township541
- Wyandotte township63
- Wyanett township1,739
- Wykeham township325
- Wylie township32
- Yellow Bank township115
- York township367
- Young America township629
- Yucatan township293
- Zion township218
- Zumbro township534
- Zumbrota township692
School districts
Each of the 330 with people in it, from ACS 2020–2024 5-year estimates. Elementary districts teach the lower grades and secondary districts the upper ones, under them; the rest are unified, teaching every grade.
- A.C.G.C. Public School District6,078
- Ada-Borup-West Public Schools3,897
- Adrian Public School District2,211
- Aitkin Public School District9,896
- Albany Public School District9,449
- Albert Lea Public School District23,459
- Alden-Conger Public School District1,427
- Alexandria Public School District32,374
- Annandale Public School District10,600
- Anoka-Hennepin Public School District248,857
- Ashby Public School District1,517
- Austin Public School District29,375
- Badger Public School District1,002
- Bagley Public School District5,786
- Barnesville Public School District4,687
- Barnum Public School District3,917
- Battle Lake Public School District4,109
- Becker Public School District12,914
- Belgrade-Brooten-Elrosa Public School District4,145
- Belle Plaine Public School District10,040
- Bemidji Public School District39,427
- Benson Public School District5,543
- Bertha-Hewitt Public School District3,687
- Big Lake Public School District20,430
- Bird Island-Olivia-Lake Lillian Public School District4,540
- Blackduck Public School District3,807
- Blooming Prairie Public School District4,020
- Bloomington Public School District88,515
- Blue Earth Area Public Schools7,953
- Braham Public School District5,828
- Brainerd Public School District46,195
- Brandon-Evansville Public Schools3,645
- Breckenridge Public School District4,819
- Brooklyn Center School District8,972
- Browerville Public School District3,948
- Browns Valley Public School Districtelementary489
- Buffalo Lake-Hector-Stewart Public Schools4,175
- Buffalo-Hanover-Montrose Public Schools35,165
- Burnsville-Eagan-Savage School District71,946
- Butterfield-Odin Public School District1,069
- Byron Public School District9,814
- Caledonia Public School District5,988
- Cambridge-Isanti Public School District32,911
- Campbell-Tintah Public School District684
- Canby Public School District3,242
- Cannon Falls Public School District7,657
- Carlton Public School District4,566
- Cass Lake-Bena Public Schools4,555
- Cedar Mountain School District2,293
- Centennial Public School District35,427
- Central Public School District8,845
- Chatfield Public Schools4,887
- Chisago Lakes School District22,943
- Chisholm Public School District5,555
- Chokio-Alberta Public School District1,199
- Clearbrook-Gonvick School District2,829
- Cleveland Public School District2,777
- Climax-Shelly Public Schools771
- Clinton-Graceville-Beardsley2,259
- Cloquet Public School District14,761
- Columbia Heights Public School District28,266
- Comfrey Public School District896
- Cook County Public Schools5,635
- Cromwell-Wright Public Schools1,916
- Crookston Public School District9,126
- Crosby-Ironton Public School District10,715
- Dassel-Cokato Public School District10,441
- Dawson-Boyd Public School District2,820
- Deer River Public School District4,840
- Delano Public School District12,017
- Detroit Lakes Public School District18,290
- Dilworth-Glyndon-Felton6,833
- Dover-Eyota Public School District4,339
- Duluth Public School District95,074
- East Central School District6,820
- East Grand Forks Public School District10,532
- Eastern Carver County Public Schools65,075
- Eden Prairie Public School District59,082
- Eden Valley-Watkins School District4,741
- Edgerton Public School District1,993
- Edina Public School District42,936
- Elk River School District82,523
- Ellsworth Public School District876
- Ely Public School District4,729
- Esko Public School District5,534
- Fairmont Area School District12,178
- Faribault Public School District31,179
- Farmington Public School District38,884
- Fergus Falls Public School District20,377
- Fertile-Beltrami School District2,687
- Fillmore Central4,926
- Fisher Public School District922
- Floodwood Public School District1,346
- Foley Public School District9,771
- Forest Lake Public School District50,384
- Fosston Public School District3,486
- Franconia Public School District228
- Frazee-Vergas Public School District7,278
- Fridley Public School District18,061
- Fulda Public School District2,385
- G.F.W.6,113
- Glencoe-Silver Lake School District12,429
- Glenville-Emmons School District2,382
- Goodhue Public School District2,845
- Goodridge Public School District774
- Granada-Huntley-East Chain1,434
- Grand Meadow Public School District1,775
- Grand Rapids Public School District28,325
- Greenbush-Middle River School District2,666
- Greenway Public School District8,370
- Grygla Public School District1,057
- Hancock Public School District1,467
- Hastings Public School District31,589
- Hawley Public School District4,718
- Hayfield Public School District4,742
- Hendricks Public School District978
- Henning Public School District3,109
- Herman-Norcross School District932
- Hermantown Public School District12,175
- Heron Lake-Okabena School District1,501
- Hibbing Public School District17,237
- Hill City Public School District1,525
- Hills-Beaver Creek School District1,909
- Hinckley-Finlayson School District6,772
- Holdingford Public School District5,097
- Hopkins Public School District67,263
- Houston Public School District2,927
- Howard Lake-Waverly-Winsted9,400
- Hutchinson Public School District18,506
- International Falls School District9,091
- Inver Grove Heights Schools29,638
- Isle Public School District3,311
- Ivanhoe Public School Districtelementary1,348
- Jackson County Central School District7,649
- Janesville-Waldorf-Pemberton4,846
- Jordan Public School District10,229
- Kasson-Mantorville School District10,742
- Kelliher Public School District1,087
- Kenyon-Wanamingo School District5,967
- Kerkhoven-Murdock-Sunburg2,909
- Kimball Public School District4,556
- Kingsland Public School District5,138
- Kittson Central School District1,849
- La Crescent-Hokah School District8,342
- Lac Qui Parle Valley School District6,538
- Lake Benton Public School District1,348
- Lake City Public School District8,648
- Lake Crystal-Wellcome Memorial5,812
- Lake of the Woods School District3,521
- Lake Park Audubon School District5,028
- Lake Superior Public School District13,791
- Lakeview School District2,483
- Lakeville Public School District65,088
- Lancaster Public School District707
- Lanesboro Public School District1,734
- Laporte Public School District1,709
- Le Sueur-Henderson School District8,089
- LeRoy-Ostrander Public Schools1,926
- Lester Prairie Public School District3,332
- Lewiston-Altura Public School District4,497
- Litchfield Public School District11,757
- Little Falls Public School District17,771
- Littlefork-Big Falls School District1,434
- Long Prairie-Grey Eagle School District9,470
- Luverne Public School District7,249
- Lyle Public School District1,170
- Lynd Public School Districtelementary967
- Mabel-Canton Public School District2,269
- MACCRAY School District4,280
- Madelia Public School District3,428
- Mahnomen Public School District3,669
- Mahtomedi Public School District14,261
- Mankato Public School District70,678
- Maple Lake Public School District5,206
- Maple River School District5,810
- Marshall County Central Schools1,937
- Marshall Public School District15,980
- Martin County West School District4,445
- McGregor Public School District4,080
- Medford Public School District3,290
- Melrose Public School District9,270
- Menahga Public School District4,051
- Mesabi East School District7,330
- Milaca Public School District12,502
- Milroy Public School Districtelementary616
- Minneapolis Public School District427,246
- Minneota Public School District2,607
- Minnetonka Public School District40,838
- Minnewaska School District9,623
- Montevideo Public School District7,153
- Monticello Public School District23,315
- Moorhead Public School District48,515
- Moose Lake Public School District5,828
- Mora Public School District11,058
- Morris Area Public Schools7,900
- Mounds View Public School District79,429
- Mountain Iron-Buhl School District4,588
- Mountain Lake Public Schools2,872
- Murray County Central School District4,686
- Nashwauk-Keewatin School District3,910
- Nett Lake Public School Districtelementary274
- Nevis Public School District2,954
- New London-Spicer School District9,413
- New Prague Area Schools20,880
- New Ulm Public School District19,847
- New York Mills Public School District3,764
- Nicollet Public School District2,310
- Norman County East School District1,966
- North Branch Public Schools21,393
- North St. Paul-Maplewood-Oakdale School District81,104
- Northfield Public School District29,658
- Northland Community Schools4,752
- NRHEG School District5,105
- Ogilvie Public School District3,535
- Onamia Public School District5,208
- Orono Public School District12,631
- Ortonville Public Schools3,476
- Osakis Public School District3,743
- Osseo Public School District154,618
- Owatonna Public School District30,190
- Park Rapids Public School District12,930
- Park Rapids Public School District in Pine Point (9-12)secondary243
- Parkers Prairie Public School District2,940
- Paynesville Public School District6,100
- Pelican Rapids Public School District7,706
- Pequot Lakes Public Schools11,395
- Perham-Dent Public School District11,331
- Pierz Public School District5,371
- Pillager Public School District5,856
- Pine City Public School District11,278
- Pine Island Public School District6,367
- Pine Point Public School Districtelementary243
- Pine River-Backus Public School District8,060
- Pipestone Area School District7,539
- Plainview-Elgin-Millville7,821
- Princeton Public School District22,358
- Prinsburg Public School District939
- Prior Lake-Savage Area Schools47,168
- Proctor Public School District12,455
- Randolph Public School District2,558
- Red Lake County Central Public Schools1,977
- Red Lake Falls Public School District2,214
- Red Lake Public School District5,433
- Red Rock Central School District3,166
- Red Wing Public School District20,146
- Redwood Area School District8,083
- Renville County West School District4,077
- Richfield Public School District43,046
- Robbinsdale Public School District100,936
- Rochester Public School District137,394
- Rock Ridge Public Schools18,757
- Rockford Public School District10,172
- Rocori Public School District12,842
- Roseau Public School District6,762
- Rosemount-Apple Valley-Eagan162,464
- Roseville Public School District57,328
- Rothsay Public School District973
- Round Lake-Brewster Public Schoolselementary1,655
- Royalton Public School District4,291
- RTR Public Schools3,355
- Rush City Public School District6,923
- Rushford-Peterson Public Schools4,088
- Sartell-St. Stephen School District21,161
- Sauk Centre Public School District8,390
- Sauk Rapids-Rice Public Schools24,743
- Sebeka Public School District3,028
- Shakopee Public School District51,919
- Sibley East School District7,078
- Sleepy Eye Public School District5,157
- South Koochiching School District1,190
- South St. Paul Public School District20,377
- South Washington County School District113,794
- Southland Public School District3,425
- Spring Grove School District1,947
- Spring Lake Park Public Schools35,825
- Springfield Public School District3,211
- St. Anthony-New Brighton Schools10,919
- St. Charles Public School District6,131
- St. Clair Public School District2,566
- St. Cloud Public School District103,484
- St. Francis Area Schools34,557
- St. James Public School District6,640
- St. Louis County School District17,271
- St. Louis Park Public School District47,982
- St. Michael-Albertville School District28,015
- St. Paul Public School District307,284
- St. Peter Public School District15,308
- Staples-Motley School District9,782
- Stephen-Argyle Central Schools1,621
- Stewartville Public School District9,807
- Stillwater Area Public School District69,665
- Swanville Public School District1,685
- Thief River Falls School District13,331
- Tracy Area Public School District4,887
- Tri-City United School District13,956
- Tri-County School District1,993
- Triton School District6,923
- Truman Public School District2,407
- Ulen-Hitterdal Public School District1,782
- Underwood Public School District2,327
- United South Central School District5,792
- Upsala Public School District1,982
- Verndale Public School District1,896
- Wabasha-Kellogg Public School District5,263
- Wabasso Public School District2,410
- Waconia Public School District22,791
- Wadena-Deer Creek School District8,737
- Walker-Hackensack-Akeley School District7,105
- Warren-Alvarado-Oslo School District3,566
- Warroad Public School District5,867
- Waseca Public School District12,254
- Watertown-Mayer Public School District11,096
- Waterville-Elysian-Morristown Public School District6,583
- Waubun-Ogema-White Earth Public Schools3,331
- Wayzata Public School District74,798
- West Central Area5,015
- West St. Paul-Mendota Heights-Eagan46,207
- Westbrook-Walnut Grove Schools2,730
- Westonka Public School District20,244
- Wheaton Area Public School District2,237
- White Bear Lake School District64,865
- Willmar Public School District27,331
- Willow River Public School District3,628
- Win-E-Mac School District3,417
- Windom Public School District6,389
- Winona Area Public School District38,233
- Worthington Public School District16,800
- Wrenshall Public School District1,754
- Yellow Medicine East6,551
- Zumbrota-Mazeppa School District7,685
Congressional districts
As drawn for the 119th Congress (2025–2027).
- Congressional District 1715,713
- Congressional District 2730,253
- Congressional District 3708,294
- Congressional District 4705,537
- Congressional District 5707,022
- Congressional District 6734,184
- Congressional District 7716,373
- Congressional District 8722,069
State senate districts
The upper chamber’s districts, as drawn in 2024.
- State Senate District 184,164
- State Senate District 285,070
- State Senate District 384,328
- State Senate District 485,577
- State Senate District 587,662
- State Senate District 686,654
- State Senate District 785,161
- State Senate District 885,621
- State Senate District 984,756
- State Senate District 1087,522
- State Senate District 1186,148
- State Senate District 1286,683
- State Senate District 1387,079
- State Senate District 1486,927
- State Senate District 1584,739
- State Senate District 1685,398
- State Senate District 1785,076
- State Senate District 1885,982
- State Senate District 1985,472
- State Senate District 2084,438
- State Senate District 2184,336
- State Senate District 2285,821
- State Senate District 2384,771
- State Senate District 2485,959
- State Senate District 2586,210
- State Senate District 2685,209
- State Senate District 2787,684
- State Senate District 2887,087
- State Senate District 2988,451
- State Senate District 3091,107
- State Senate District 3187,626
- State Senate District 3289,055
- State Senate District 3385,058
- State Senate District 3483,065
- State Senate District 3585,859
- State Senate District 3684,946
- State Senate District 3789,016
- State Senate District 3884,886
- State Senate District 3985,281
- State Senate District 4083,733
- State Senate District 4188,930
- State Senate District 4282,833
- State Senate District 4382,099
- State Senate District 4483,516
- State Senate District 4585,440
- State Senate District 4683,916
- State Senate District 4788,324
- State Senate District 4888,246
- State Senate District 4983,585
- State Senate District 5082,329
- State Senate District 5186,436
- State Senate District 5286,148
- State Senate District 5385,506
- State Senate District 5488,502
- State Senate District 5585,022
- State Senate District 5685,482
- State Senate District 5789,641
- State Senate District 5886,344
- State Senate District 5984,675
- State Senate District 6083,276
- State Senate District 6184,438
- State Senate District 6283,200
- State Senate District 6386,485
- State Senate District 6483,371
- State Senate District 6584,844
- State Senate District 6684,514
- State Senate District 6782,726
State house districts
The lower chamber’s districts, as drawn in 2024.
- State House District 1A42,086
- State House District 1B42,078
- State House District 2A43,905
- State House District 2B41,165
- State House District 3A41,857
- State House District 3B42,471
- State House District 4A43,096
- State House District 4B42,481
- State House District 5A43,963
- State House District 5B43,699
- State House District 6A43,482
- State House District 6B43,172
- State House District 7A42,785
- State House District 7B42,376
- State House District 8A41,192
- State House District 8B44,429
- State House District 9A42,706
- State House District 9B42,050
- State House District 10A43,279
- State House District 10B44,243
- State House District 11A42,680
- State House District 11B43,468
- State House District 12A42,241
- State House District 12B44,442
- State House District 13A43,507
- State House District 13B43,572
- State House District 14A45,173
- State House District 14B41,754
- State House District 15A42,479
- State House District 15B42,260
- State House District 16A42,460
- State House District 16B42,938
- State House District 17A41,925
- State House District 17B43,151
- State House District 18A42,286
- State House District 18B43,696
- State House District 19A42,867
- State House District 19B42,605
- State House District 20A42,113
- State House District 20B42,325
- State House District 21A41,709
- State House District 21B42,627
- State House District 22A42,473
- State House District 22B43,348
- State House District 23A42,444
- State House District 23B42,327
- State House District 24A43,610
- State House District 24B42,349
- State House District 25A43,418
- State House District 25B42,792
- State House District 26A42,350
- State House District 26B42,859
- State House District 27A43,232
- State House District 27B44,452
- State House District 28A43,638
- State House District 28B43,449
- State House District 29A44,764
- State House District 29B43,687
- State House District 30A45,274
- State House District 30B45,833
- State House District 31A43,553
- State House District 31B44,073
- State House District 32A44,901
- State House District 32B44,154
- State House District 33A43,590
- State House District 33B41,468
- State House District 34A43,085
- State House District 34B39,980
- State House District 35A42,104
- State House District 35B43,755
- State House District 36A43,389
- State House District 36B41,557
- State House District 37A45,267
- State House District 37B43,749
- State House District 38A42,385
- State House District 38B42,501
- State House District 39A42,818
- State House District 39B42,463
- State House District 40A41,784
- State House District 40B41,949
- State House District 41A45,831
- State House District 41B43,099
- State House District 42A42,000
- State House District 42B40,833
- State House District 43A40,402
- State House District 43B41,697
- State House District 44A39,882
- State House District 44B43,634
- State House District 45A42,873
- State House District 45B42,567
- State House District 46A41,625
- State House District 46B42,291
- State House District 47A42,456
- State House District 47B45,868
- State House District 48A45,077
- State House District 48B43,169
- State House District 49A42,754
- State House District 49B40,831
- State House District 50A41,494
- State House District 50B40,835
- State House District 51A42,341
- State House District 51B44,095
- State House District 52A44,213
- State House District 52B41,935
- State House District 53A42,735
- State House District 53B42,771
- State House District 54A44,941
- State House District 54B43,561
- State House District 55A42,854
- State House District 55B42,168
- State House District 56A42,571
- State House District 56B42,911
- State House District 57A43,404
- State House District 57B46,237
- State House District 58A43,343
- State House District 58B43,001
- State House District 59A40,718
- State House District 59B43,957
- State House District 60A42,953
- State House District 60B40,323
- State House District 61A41,203
- State House District 61B43,235
- State House District 62A42,725
- State House District 62B40,475
- State House District 63A44,396
- State House District 63B42,089
- State House District 64A41,548
- State House District 64B41,823
- State House District 65A41,356
- State House District 65B43,488
- State House District 66A44,150
- State House District 66B40,364
- State House District 67A40,853
- State House District 67B41,873
PUMAs
Public Use Microdata Areas: areas of 100,000 people or more that the state draws from census tracts, for the Census Bureau’s microdata.
- Aitkin, Carlton, Kanabec, Pine & St. Louis (Southwest) Counties PUMA108,325
- Anoka County (North)–Andover, Ramsey, Ham Lake & East Bethel Cities PUMA122,270
- Anoka County (Southeast)–Blaine & Lino Lakes Cities PUMA106,274
- Anoka County (Southwest)–Coon Rapids, Fridley, Columbia Heights & Anoka Cities PUMA141,805
- Benton (Northwest) & Stearns (West) Counties PUMA106,736
- Benton (Southwest), Sherburne (Northwest) & Stearns (East) Counties–St. Cloud City PUMA106,924
- Blue Earth & Nicollet Counties–Mankato City PUMA104,282
- Brown, Martin, Faribault, Freeborn & Watonwan Counties PUMA101,322
- Carver County PUMA110,041
- Chisago, Isanti & Mille Lacs Counties PUMA127,712
- Clay, Otter Tail & Wilkin Counties PUMA132,905
- Cook, Lake & St. Louis (North) Counties PUMA104,292
- Crow Wing, Morrison, Todd & Wadena Counties PUMA141,766
- Dakota County (Northeast)–Inver Grove Heights, Rosemount, Hastings & South St. Paul PUMA111,404
- Dakota County (Northwest)–Eagan, West St. Paul & Mendota Heights Cities PUMA101,973
- Dakota County (South)–Lakeville & Farmington Cities PUMA112,252
- Dakota County (West)–Burnsville & Apple Valley Cities PUMA120,142
- Dodge, Fillmore, Houston & Mower Counties PUMA101,455
- Goodhue, Wabasha & Winona Counties PUMA119,287
- Hennepin County (West)–Champlin, Rogers Cities & Lake Minnetonka PUMA123,230
- Hennepin County–Bloomington & Richfield Cities PUMA125,834
- Hennepin County–Brooklyn Center, Crystal, Golden Valley, New Hope & Robbinsdale PUMA112,095
- Hennepin County–Brooklyn Park, Maple Grove (East) & Osseo Cities PUMA120,065
- Hennepin County–Eden Prairie & Minnetonka Cities PUMA116,100
- Hennepin County–Edina, St. Louis Park & Hopkins Cities PUMA121,675
- Hennepin County–Minneapolis (North) & St. Anthony Cities PUMA110,525
- Hennepin County–Minneapolis City (Central) PUMA102,392
- Hennepin County–Minneapolis City (East) PUMA113,083
- Hennepin County–Minneapolis City (Southwest) PUMA107,113
- Hennepin County–Plymouth, Maple Grove (West) & Medicine Lake Cities PUMA117,384
- Kandiyohi, McLeod, Meeker, Renville & Sibley Counties PUMA133,908
- Le Sueur, Rice, Steele & Waseca Counties PUMA153,354
- North Central Minnesota PUMA146,448
- Northwest Minnesota PUMA146,206
- Olmsted County–Rochester City PUMA164,498
- Ramsey County (Central & Far Southeast)–Maplewood, Roseville & North St. Paul Cities PUMA106,868
- Ramsey County (North)–Shoreview, White Bear Lake & New Brighton Cities PUMA128,793
- Ramsey County–St. Paul City (East) PUMA102,711
- Ramsey County–St. Paul City (Northwest) PUMA102,479
- Ramsey County–St. Paul City (Southwest) PUMA102,094
- Scott County PUMA154,557
- Sherburne (East) & Wright (North) Counties PUMA105,928
- Southwest Minnesota PUMA116,890
- St. Louis County (Southeast)–Duluth, Hermantown & Proctor Cities PUMA102,624
- Washington County (North)–Oakdale, Forest Lake, Stillwater & Hugo Cities PUMA138,204
- Washington County (South)–Woodbury & Cottage Grove Cities PUMA138,034
- West Central Minnesota PUMA113,487
- Wright (South) County PUMA131,699
Urban areas
Each that reaches into Minnesota, with its whole population. Urban areas are the densely settled land the Census Bureau draws after each census, whatever the city lines.
- Albert Lea, MN17,897
- Alexandria, MN19,324
- Austin, MN25,894
- Belle Plaine, MN7,005
- Bemidji, MN14,821
- Big Lake, MN12,511
- Brainerd, MN20,925
- Buffalo, MN16,809
- Byron, MN6,687
- Cambridge, MN10,815
- Chisholm, MN4,516
- Cloquet, MN13,430
- Cold Spring, MN5,189
- Crookston, MN7,525
- Delano, MN6,683
- Detroit Lakes, MN10,547
- Duluth, MN–WI120,208
- Fairmont, MN8,083
- Fargo, ND–MN224,096
- Faribault, MN24,048
- Fergus Falls, MN13,084
- Forest Lake, MN21,875
- Glencoe, MN5,695
- Glenwood, MN4,119
- Grand Forks, ND–MN67,973
- Grand Rapids, MN10,500
- Hastings, MN21,364
- Hibbing, MN11,849
- Hudson, WI–MN23,396
- Hutchinson, MN14,770
- International Falls, MN6,227
- Isanti, MN6,993
- Jordan, MN6,771
- Kasson, MN7,749
- La Crosse, WI–MN98,440
- Lake City, MN4,770
- Lindstrom–Chisago City, MN8,666
- Litchfield, MN6,499
- Little Falls, MN9,494
- Luverne, MN4,702
- Mankato, MN61,070
- Marshall, MN13,831
- Minneapolis–St. Paul, MN2.92M
- Montevideo, MN5,332
- Monticello, MN16,115
- Montrose, MN6,313
- Morris, MN5,130
- New Prague, MN8,232
- New Ulm, MN13,522
- North Branch, MN6,786
- Northfield, MN22,864
- Owatonna, MN26,445
- Princeton, MN5,179
- Red Wing, MN15,673
- Redwood Falls, MN4,487
- Rochester, MN122,056
- Sauk Centre, MN4,956
- Spicer–New London, MN3,503
- St. Cloud, MN119,815
- St. Francis, MN5,404
- St. Peter, MN12,127
- Stewartville, MN6,807
- Stillwater, MN–WI31,956
- Thief River Falls, MN8,935
- Virginia, MN12,697
- Waconia, MN13,068
- Wadena, MN4,192
- Wahpeton, ND–MN11,292
- Waseca, MN9,234
- Willmar, MN22,074
- Winona, MN29,257
- Worthington, MN13,698
- Zimmerman, MN6,646
Tribal areas
Each that reaches into Minnesota, with its whole population.
- Bois Forte Reservation and Off-Reservation Trust Land, MN784
- Fond du Lac Reservation and Off-Reservation Trust Land, MN–WI3,799
- Grand Portage Reservation and Off-Reservation Trust Land, MN589
- Ho-Chunk Nation Reservation and Off-Reservation Trust Land, WI–MN1,131
- Leech Lake Reservation and Off-Reservation Trust Land, MN10,983
- Lower Sioux Indian Community and Off-Reservation Trust Land, MN446
- Mille Lacs Reservation and Off-Reservation Trust Land, MN4,504
- Prairie Island Indian Community and Off-Reservation Trust Land, MN210
- Red Lake Reservation, MN5,433
- Shakopee Mdewakanton Sioux Community and Off-Reservation Trust Land, MN–SD448
- Upper Sioux Community and Off-Reservation Trust Land, MN139
- White Earth Reservation and Off-Reservation Trust Land, MN9,456
Turn Minnesota into your planning report.
Social Explorer Studio builds an editable profile of any place, with tables and charts beside the county and state, and exports to Word, PDF and Excel.
Questions about Minnesota
What is the population of Minnesota?
5,830,405 people, according to the ACS 2025 1-year estimates, which the Census Bureau adjusts to match its own population estimate. That’s the 22nd largest of the 50 states and DC.
What is the FIPS code for Minnesota?
27. Every county’s and place’s FIPS code in Minnesota starts with it. The Census Bureau’s full geographic identifier (GEOID) is 0400000US27.
What is the largest city in Minnesota?
Minneapolis, with 430,340 people. Other large cities here include St. Paul, Rochester and Bloomington.
What is the median household income in Minnesota?
$92,297 (±$1,085), according to the ACS 2025 1-year estimates, higher than the US ($84,780).
What is the median age in Minnesota?
39.5 years (±0.3), according to the ACS 2025 1-year estimates, about the same as the US (39.5).
How much does housing cost in Minnesota?
Minnesota’s median home value is $353,800 (±$2,300) and its median gross rent is $1,357 (±$17) a month, according to the ACS 2025 1-year estimates. 46.1% (±1.4%) of its renters pay 30% or more of their income on rent.
Is Minnesota growing?
Minnesota’s population grew 6.2%, from 5,489,594 in 2015 to 5,830,405 in 2025, according to the ACS 1-year estimates.
Where do people who work in Minnesota live?
2,759,177 of its 2,868,846 jobs are held by people who live here. Of those who commute in, the most come from Wisconsin, North Dakota, Iowa.
Where does this census data come from?
The U.S. Census Bureau’s American Community Survey, through Social Explorer’s tables: the latest 1-year estimates where they exist, for the most recent numbers, and 5-year estimates otherwise. Each table lists its code, so you can find it again.
Is this data free to use?
Yes. You can read it, cite it, download the CSV and embed the charts, with no account. To map other variables, compare your own areas or build a report, see Social Explorer’s plans in a live demo.
Sources and how to cite
American Community Survey 2025 1-year estimates, or 2020–2024 5-year estimates where noted, U.S. Census Bureau, from Social Explorer’s tables A00001, A00002, A01004, A04001, A06001, A08001, A09005, A10001, A10003, A10008, A10030, A10036, A10040, A10047, A10055, A10060, A12001, A13004, A14006, A14024, A14028, A16002, A17005, A18002, A18009, A20001, B02002, B09001, B13002, B18101, C16001. Maps by census tract use 2020–2024 5-year estimates, since the 1-year survey doesn’t cover tracts. Commuting: LEHD LODES 2023. These are estimates from a sample, each with its margin of error. Data retrieved November 14, 2026. How these profiles are made.
U.S. Census Bureau, American Community Survey 2025 1-year estimates, or 2020–2024 5-year estimates where noted, via Social Explorer. “Minnesota.” https://www.socialexplorer.com/places/minnesota. Accessed November 14, 2026.