

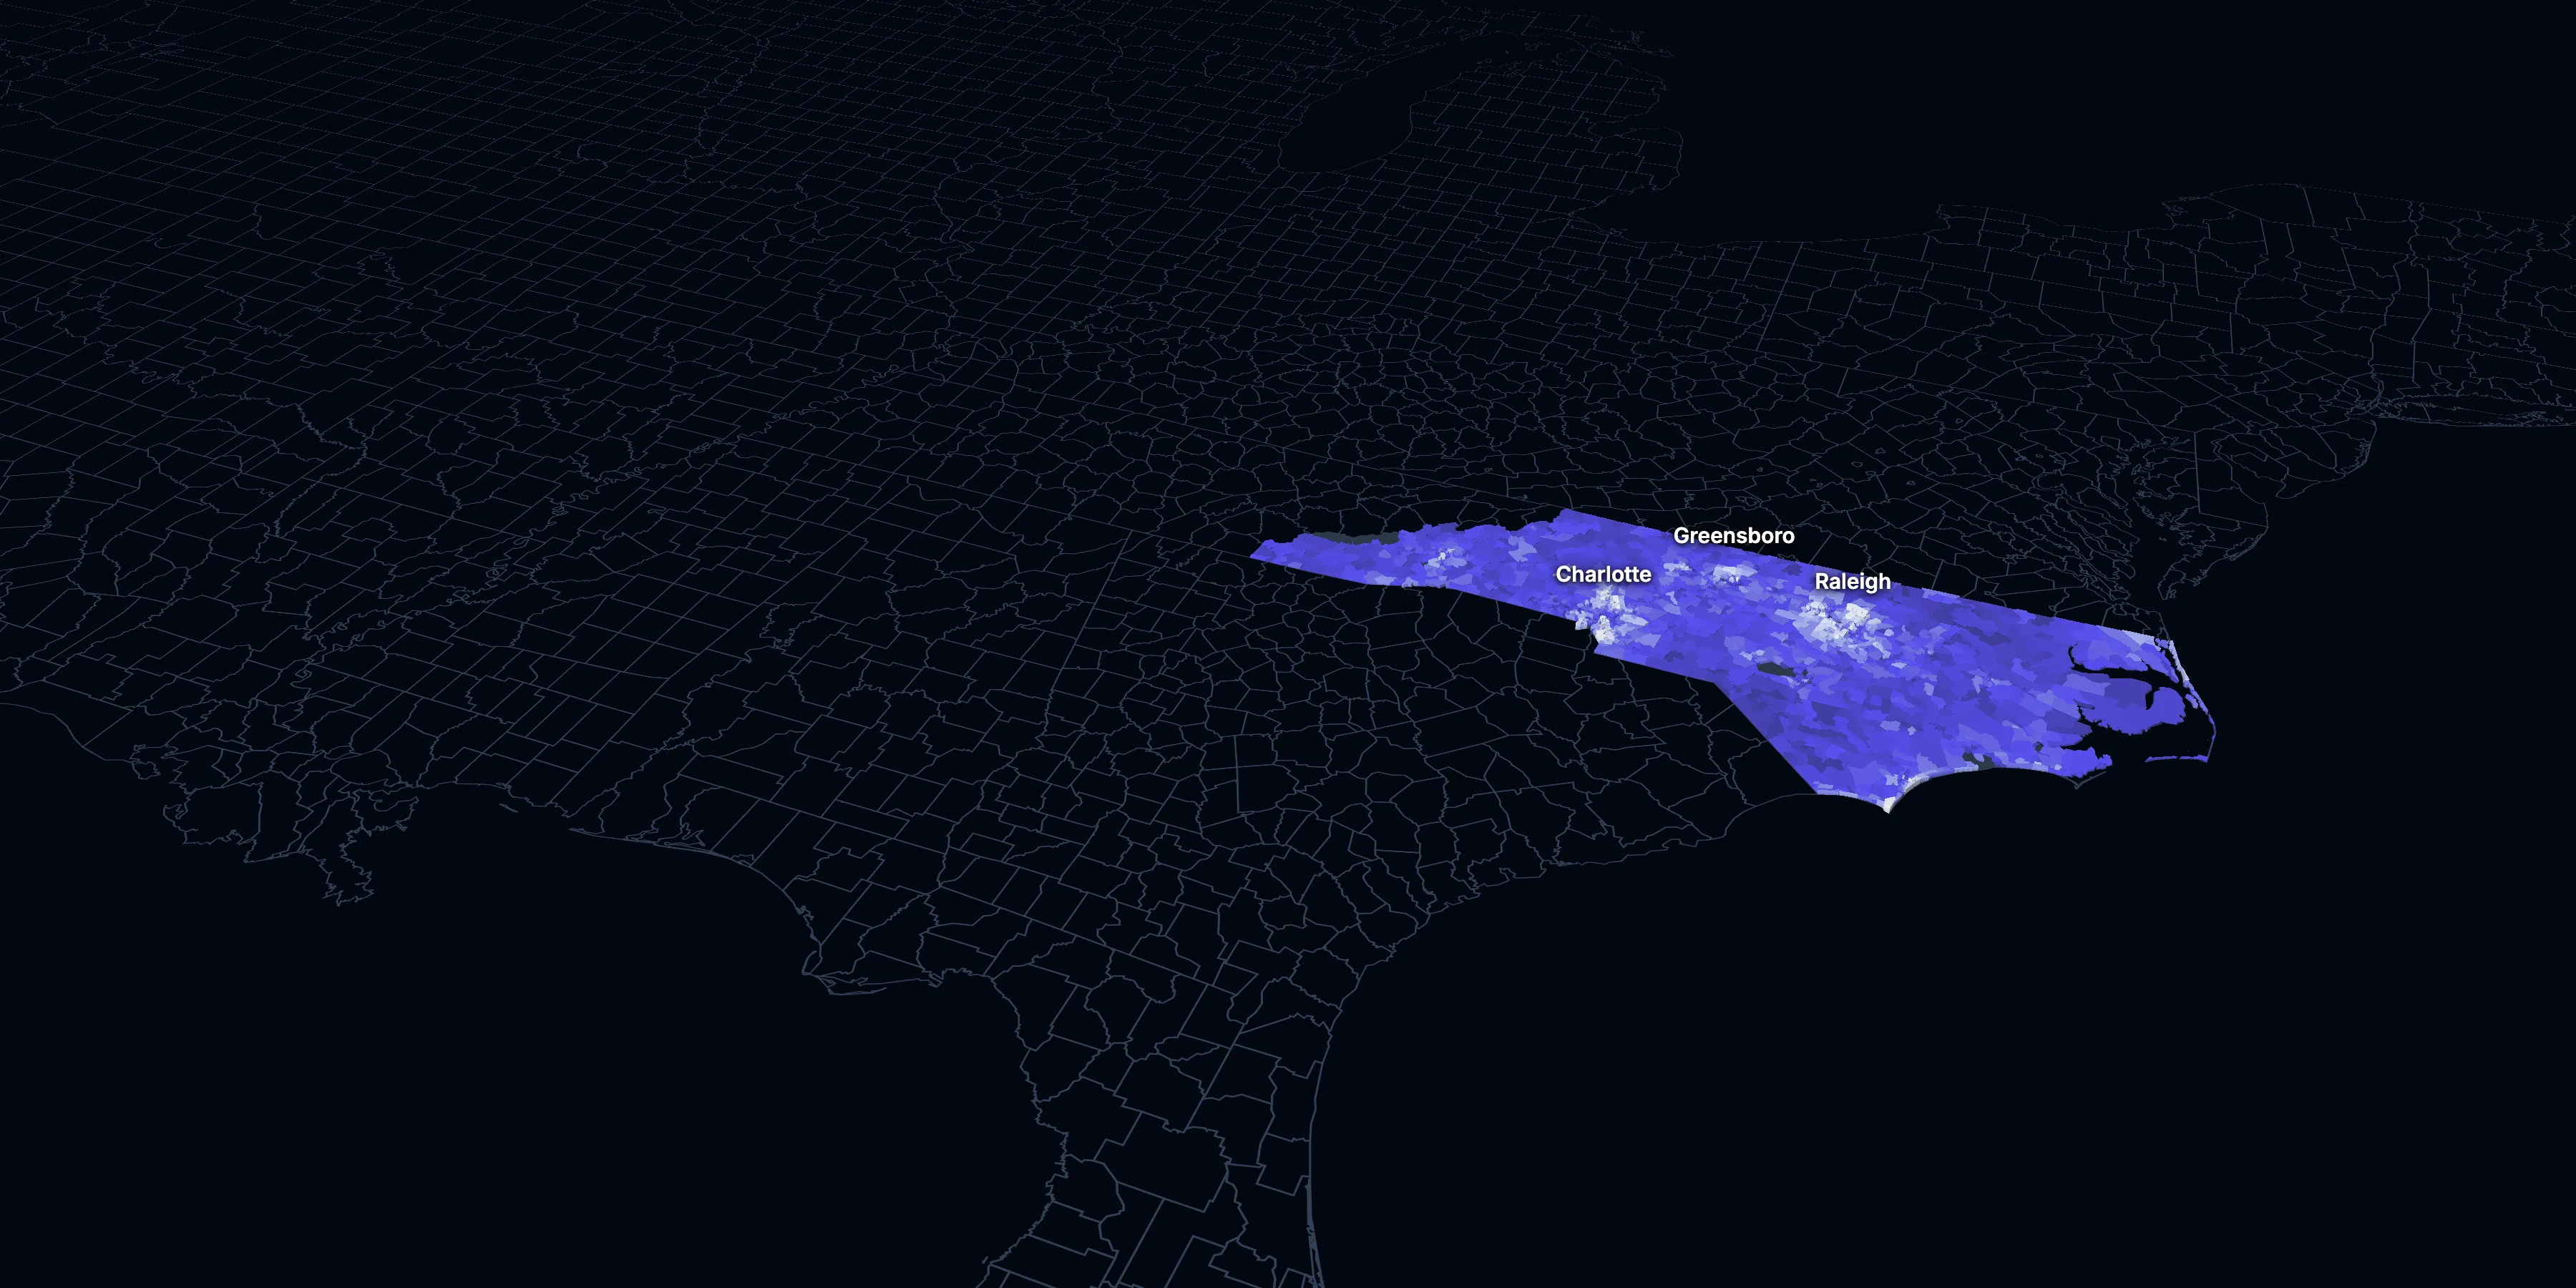
North Carolina: Population, demographics and census data
Home to 11,197,968 people, the 9th largest of the 50 states and DC, anchored by Charlotte. It grew 11.5% between 2015 and 2025.
- Population
- 11.20M. Census Bureau estimate · Rank 9 of the 50 states and DC
- Median household income
- $77,638 ±$876. US $84,780
- Median age
- 39.6 ±0.2. US 39.5
ACS 2025 1-year estimates, U.S. Census Bureau
Taller, lighter tracts have higher household incomes
About North Carolina
North Carolina’s median household income is $77,638 (±$876), lower than the US ($84,780), and its median age is 39.6 (±0.2), according to the ACS 2025 1-year estimates. Its largest city is Charlotte.
± is each figure’s margin of error, at 90% confidence, and † marks one too uncertain to lean on. Under each percentage in the tables is the number it counts. How the margins are worked out.
FIPS code 37
Highlights
What stands out in North Carolina
The numbers where North Carolina sits furthest from the nation, or past a recognized policy benchmark.
Past a policy benchmark
+6 points
ElevatedRent growth ahead of income
After inflation, rent grew 25% from 2015 to 2025, and household income 18%. The dots show rent growth.
Furthest from the national picture
7.4%
Higher than the USVeterans (adults)
That’s higher than the US (5.9%).
14.7%
Lower than the USSpeak a language other than English at home
That’s lower than the US (22.9%).
9.9%
Lower than the USBorn outside the US
That’s lower than the US (14.7%).
1.0%
Very lowTake public transit
That’s lower than the US (4.3%).
19.2%
1.5× the USBlack, not Hispanic
That’s higher than the US (11.7%).
2015 to 2025
How North Carolina changed in ten years
The state added 1,155,166 people. It got older, more foreign-born and better educated, and poverty fell 4.4 points.
Population, change since 2015
+11.5% in the state and +6.3% in the US.
Source: ACS 1-year, 2015 to 2025, table A00001.
Show data
| North Carolina | United States | |
|---|---|---|
| 2015 | 0.0% | 0.0% |
| 2016 | +1.0% | +0.5% |
| 2017 | +2.3% | +1.3% |
| 2018 | +3.4% | +1.8% |
| 2019 | +4.4% | +2.1% |
| 2021 | +5.1% | +3.3% |
| 2022 | +6.5% | +3.7% |
| 2023 | +7.9% | +4.2% |
| 2024 | +10.0% | +5.8% |
| 2025 | +11.5% | +6.3% |
Embed
Median household income, in 2025 dollars
+18.5% in the state and +10.9% in the US.
Source: ACS 1-year, 2015 to 2025, table A14006.
Show data
| North Carolina | United States | |
|---|---|---|
| 2015 | $65,528 | $76,413 |
| 2016 | $68,419 | $77,931 |
| 2017 | $69,849 | $79,891 |
| 2018 | $69,612 | $80,059 |
| 2019 | $72,799 | $83,427 |
| 2021 | $74,242 | $83,521 |
| 2022 | $74,753 | $82,811 |
| 2023 | $75,327 | $82,683 |
| 2024 | $76,437 | $84,339 |
| 2025 | $77,638 | $84,780 |
Embed
Living in poverty
−4.4 points in the state and −3.0 points in the US.
Source: ACS 1-year, 2015 to 2025, table A13004.
Show data
| North Carolina | United States | |
|---|---|---|
| 2015 | 16.4% | 14.7% |
| 2016 | 15.4% | 14.0% |
| 2017 | 14.7% | 13.4% |
| 2018 | 14.0% | 13.1% |
| 2019 | 13.6% | 12.3% |
| 2021 | 13.4% | 12.8% |
| 2022 | 12.8% | 12.6% |
| 2023 | 12.8% | 12.5% |
| 2024 | 12.5% | 12.1% |
| 2025 | 12.1% | 11.8% |
Embed
Bachelor’s degree or more
+8.6 points in the state and +6.7 points in the US.
Source: ACS 1-year, 2015 to 2025, table A12001.
Show data
| North Carolina | United States | |
|---|---|---|
| 2015 | 29.4% | 30.6% |
| 2016 | 30.4% | 31.3% |
| 2017 | 31.3% | 32.0% |
| 2018 | 31.9% | 32.6% |
| 2019 | 32.3% | 33.1% |
| 2021 | 34.9% | 35.0% |
| 2022 | 35.9% | 35.7% |
| 2023 | 36.8% | 36.2% |
| 2024 | 37.1% | 36.8% |
| 2025 | 38.1% | 37.4% |
Embed
Median gross rent, in 2025 dollars
+24.6% in the state and +18.5% in the US.
Source: ACS 1-year, 2015 to 2025, table A18009.
Show data
| North Carolina | United States | |
|---|---|---|
| 2015 | $1,133 | $1,314 |
| 2016 | $1,135 | $1,327 |
| 2017 | $1,140 | $1,340 |
| 2018 | $1,163 | $1,368 |
| 2019 | $1,182 | $1,393 |
| 2021 | $1,229 | $1,427 |
| 2022 | $1,253 | $1,440 |
| 2023 | $1,325 | $1,496 |
| 2024 | $1,383 | $1,537 |
| 2025 | $1,412 | $1,557 |
Embed
Median home value, in 2025 dollars
+56.3% in the state and +39.3% in the US.
Source: ACS 1-year, 2015 to 2025, table A10036.
Show data
| North Carolina | United States | |
|---|---|---|
| 2015 | $219,340 | $266,469 |
| 2016 | $223,716 | $277,278 |
| 2017 | $226,686 | $288,124 |
| 2018 | $233,442 | $296,908 |
| 2019 | $245,284 | $305,336 |
| 2021 | $283,805 | $337,116 |
| 2022 | $310,838 | $355,481 |
| 2023 | $328,312 | $361,931 |
| 2024 | $344,160 | $372,685 |
| 2025 | $342,800 | $371,100 |
Embed
ACS 1-year estimates. The dotted stretch of each line spans 2020, when the Census Bureau released no standard 1-year estimates. Dollar values are in 2025 dollars.
| Indicator | 2015 | 2025 | Change |
|---|---|---|---|
| Population | 10,042,802 | 11,197,968 | +11.5% |
| Median age | 38.4 | 39.6 | +1.2 years |
| 65 and over | 15.1% | 19.0% | +4.0 points |
| Born outside the US | 7.9% | 9.9% | +2.0 points |
| Hispanic or Latino | 9.1% | 12.6% | +3.5 points |
| Median household income | $65,528 | $77,638 | +18.5% |
| Living in poverty | 16.4% | 12.1% | −4.4 points |
| Bachelor’s degree or more | 29.4% | 38.1% | +8.6 points |
| Households that rent | 36.1% | 33.0% | −3.1 points |
| Median gross rent | $1,133 | $1,412 | +24.6% |
| Median home value | $219,340 | $342,800 | +56.3% |
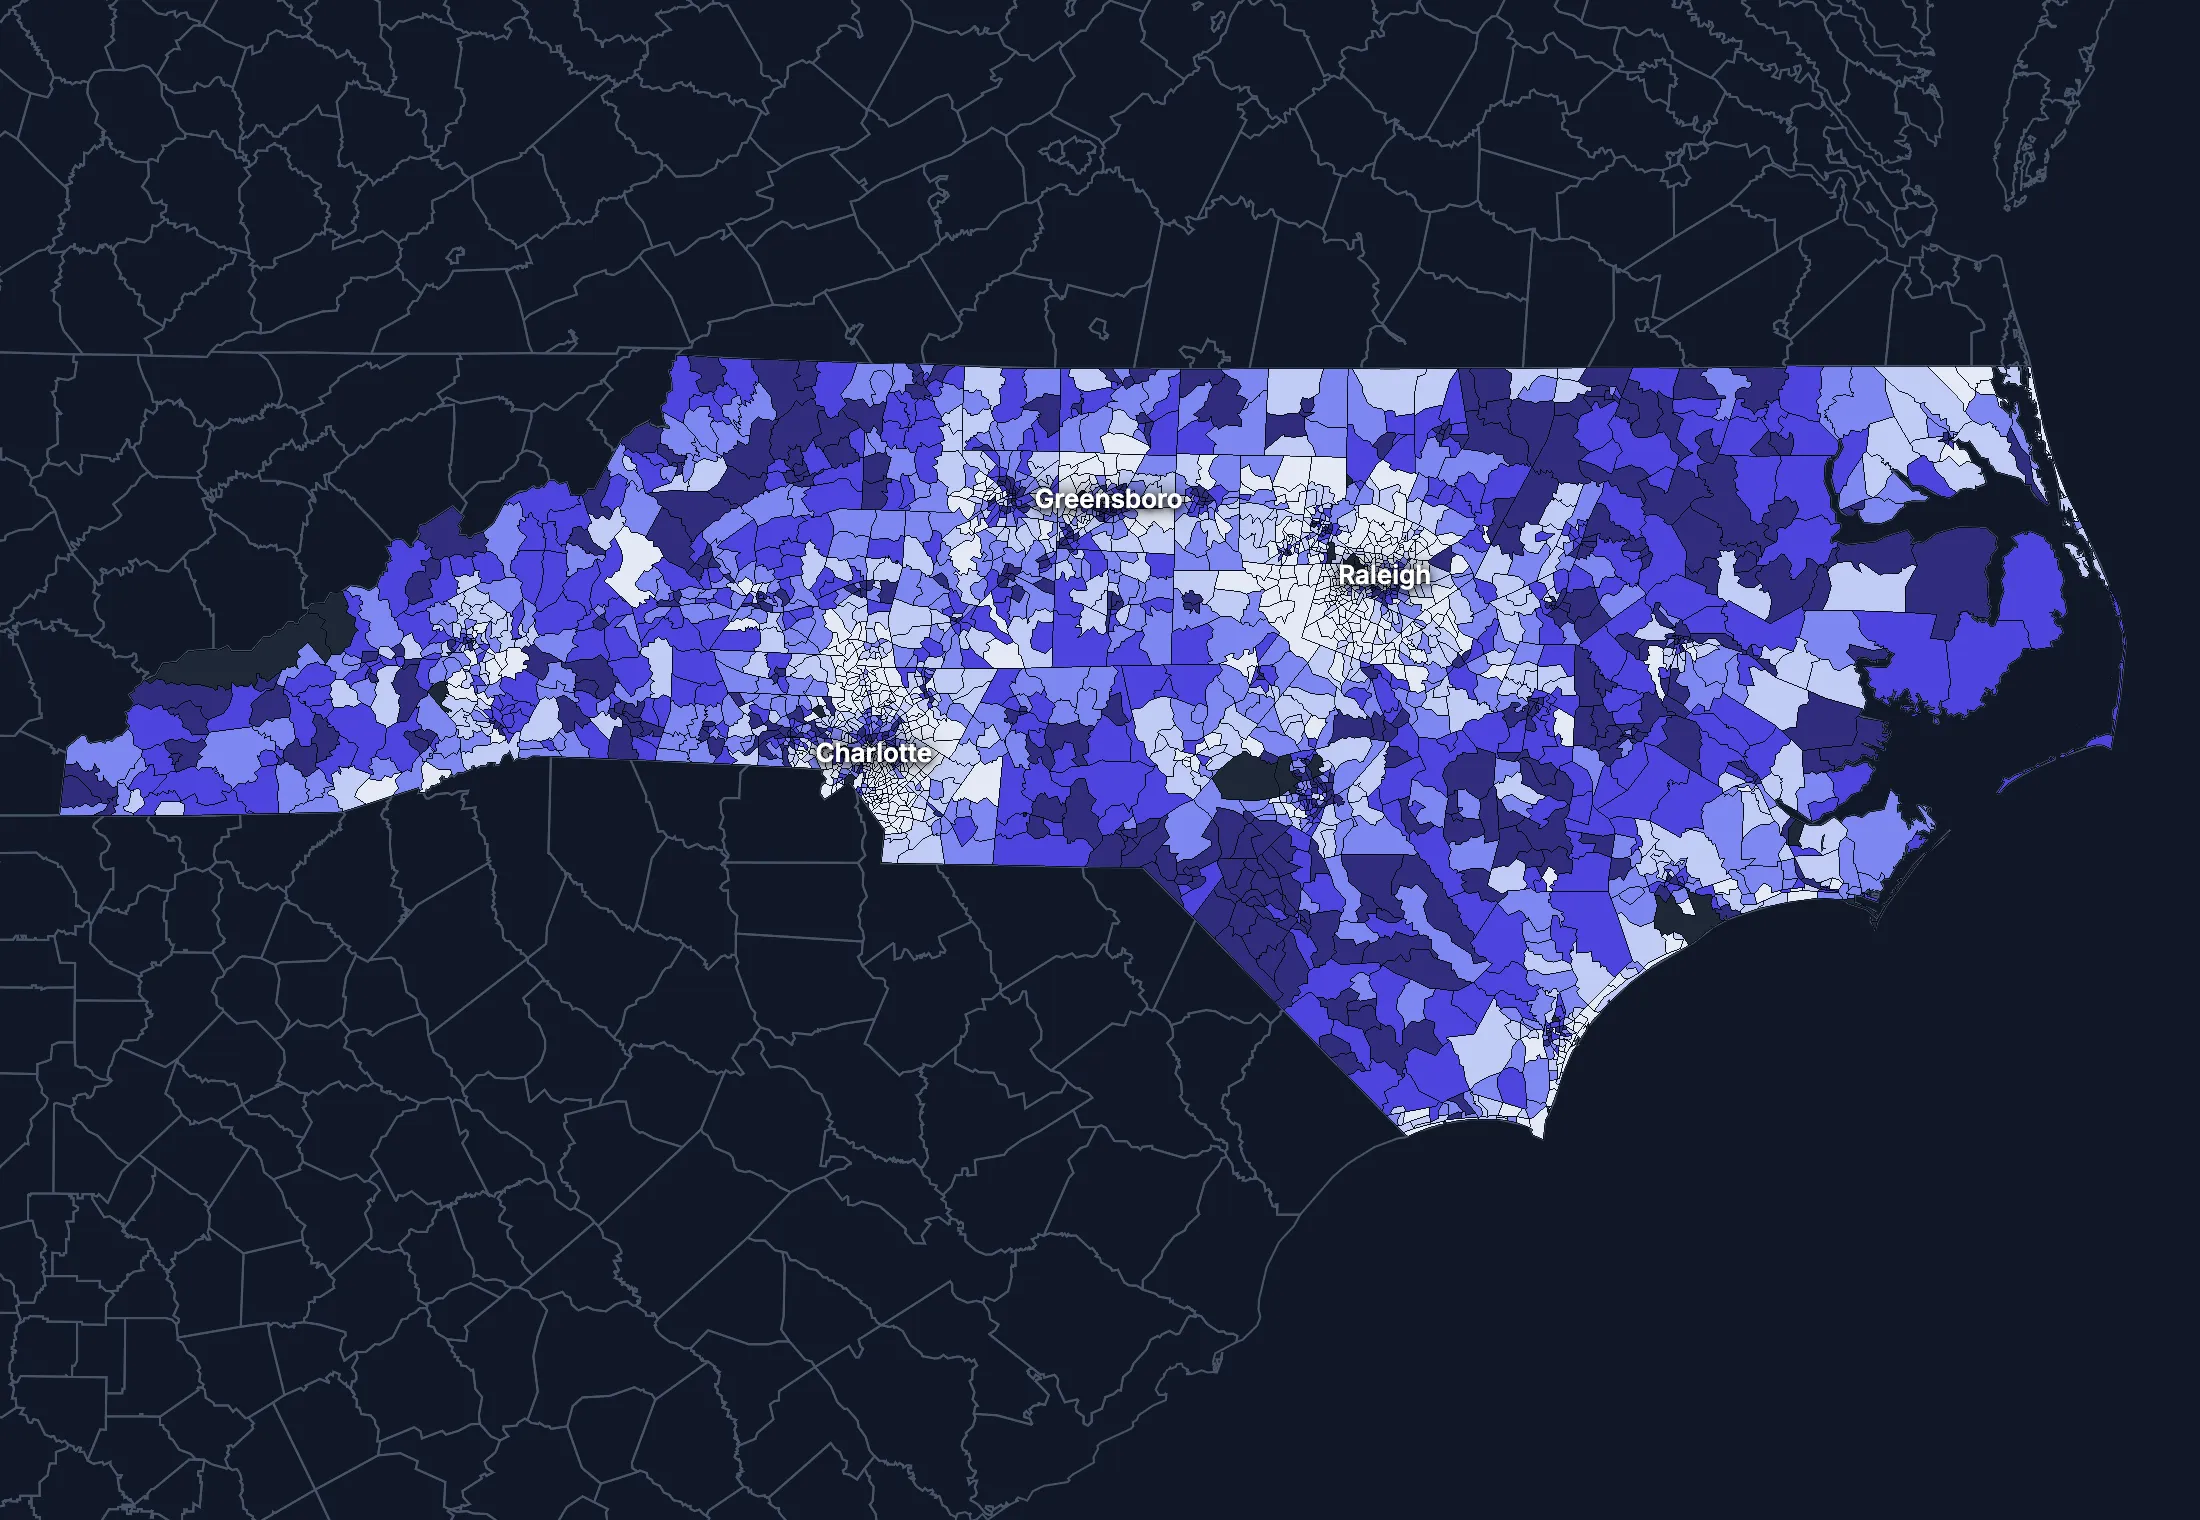
2672 census tracts
North Carolina, tract by tract
State averages hide a lot. These census tracts are the closest the census comes to neighborhoods.
Where the state’s average misleads
Each tick is one census tract, and the dark line marks the state. Hover over a tick or tap it to see the tract.
Poverty
623 of 2637 tracts are at least 1.5 times the state’s overall 13.0%, and 896 are at two-thirds of it or less.
Highest: Tract 1.01, 68.9%. Lowest: Tract 9706.02, 0.0%.
Renters paying 30% or more of income
176 of 2578 tracts are at least 1.5 times the state’s overall 44.7%, and 635 are at two-thirds of it or less.
Highest: Tract 401.03, 100.0%. Lowest: Tract 205.15, 0.0%.
Adults with a bachelor’s degree
502 of 2646 tracts are at least 1.5 times the state’s overall 35.7%, and 1036 are at two-thirds of it or less.
Highest: Tract 15.01, 100.0%. Lowest: Tract 9802, 0.0%.
Median household income
447 of 2634 tracts are at least 1.5 times the typical tract’s $68,502, and 355 are at two-thirds of it or less.
Highest: Tract 27.01, $250,000 or more. Lowest: Tract 56.22, $14,821.
American Community Survey 2020–2024 5-year estimates, by census tract. Income is capped at $250,000+ by the Census Bureau.
People
Who lives in North Carolina
Its median age of 39.6 is about the same as the US (39.5). 9.9% of residents were born outside the US, and 14.7% speak a language other than English at home.
Age
Source: ACS 2025 1-year, table A01001.
Show data
| North Carolina | United States | |
|---|---|---|
| Under 18 | 21.0% ±0.2% , number 2,346,609 ±24,780 | 21.0% ±<0.1% , number 71,689,151 ±111,800 |
| 18 to 24 | 9.5% ±0.2% , number 1,062,342 ±20,380 | 9.3% ±<0.1% , number 31,716,680 ±98,660 |
| 25 to 34 | 13.2% ±0.1% , number 1,483,668 ±13,320 | 13.6% ±<0.1% , number 46,357,354 ±55,690 |
| 35 to 44 | 13.1% ±0.2% , number 1,461,469 ±19,570 | 13.4% ±<0.1% , number 45,746,189 ±105,700 |
| 45 to 54 | 12.0% ±0.1% , number 1,346,916 ±12,960 | 11.8% ±<0.1% , number 40,257,563 ±53,540 |
| 55 to 64 | 12.2% ±0.2% , number 1,364,554 ±19,040 | 12.1% ±<0.1% , number 41,242,904 ±104,700 |
| 65 to 74 | 10.9% ±0.1% , number 1,223,193 ±16,520 | 10.8% ±<0.1% , number 36,895,650 ±91,520 |
| 75 and over | 8.1% ±0.1% , number 909,217 ±14,520 | 8.2% ±<0.1% , number 27,879,368 ±78,140 |
Embed
Race and ethnicity
Source: ACS 2025 1-year, table A04001.
Show data
| North Carolina | United States | |
|---|---|---|
| White, not Hispanic | 57.8% ±0.1% , number 6,474,515 ±8,972 | 55.0% ±<0.1% , number 187,959,031 ±58,340 |
| Hispanic or Latino | 12.6% ±<0.1% , number 1,406,434 ±1,711 | 20.5% ±<0.1% , number 69,975,516 ±13,270 |
| Black, not Hispanic | 19.2% ±0.2% , number 2,152,323 ±21,400 | 11.7% ±<0.1% , number 40,096,453 ±106,200 |
| Asian, not Hispanic | 3.9% ±0.1% , number 440,453 ±7,505 | 6.5% ±<0.1% , number 22,096,709 ±58,340 |
| Other or multiracial | 6.5% ±0.2% , number 724,243 ±26,530 | 6.3% ±<0.1% , number 21,657,150 ±150,100 |
Embed
Language spoken at home
Source: ACS 2025 1-year, table C16001.
Show data
| North Carolina | United States | |
|---|---|---|
| English only | 85.3% ±0.3% , number 9,042,230 ±28,630 | 77.1% ±0.1% , number 249,390,588 ±275,300 |
| Spanish | 9.5% ±0.2% , number 1,003,846 ±22,830 | 13.9% ±0.1% , number 44,921,985 ±177,800 |
| Other Indo-European | 2.2% ±0.1% , number 237,388 ±15,030 | 4.0% ±<0.1% , number 12,862,980 ±113,500 |
| Asian and Pacific Island | 2.2% ±0.1% , number 233,504 ±14,980 | 3.8% ±<0.1% , number 12,288,841 ±99,740 |
| Arabic and other | 0.8% ±0.1% , number 81,367 ±10,330 | 1.3% ±<0.1% , number 4,116,949 ±71,480 |
Embed
Marital status
Source: ACS 2025 1-year, table A11001.
Show data
| North Carolina | United States | |
|---|---|---|
| Now married | 49.5% ±0.4% , number 4,588,780 ±33,650 | 47.9% ±0.1% , number 135,567,564 ±223,300 |
| Never married | 32.9% ±0.3% , number 3,049,925 ±26,100 | 34.8% ±0.1% , number 98,647,238 ±152,600 |
| Divorced | 9.9% ±0.2% , number 921,332 ±18,880 | 10.2% ±<0.1% , number 28,879,967 ±112,900 |
| Widowed | 5.9% ±0.1% , number 542,919 ±11,820 | 5.5% ±<0.1% , number 15,599,094 ±69,430 |
| Separated | 1.8% ±0.1% , number 168,414 ±8,331 | 1.6% ±<0.1% , number 4,441,399 ±49,160 |
Embed
Where people lived a year ago
Source: ACS 2025 1-year, table A08001.
Show data
| North Carolina | United States | |
|---|---|---|
| Same home | 88.0% ±0.3% , number 9,756,918 ±35,930 | 88.4% ±0.1% , number 298,889,697 ±214,800 |
| Same county | 5.1% ±0.2% , number 569,172 ±26,470 | 6.0% ±<0.1% , number 20,202,671 ±166,300 |
| Another county in the state | 3.6% ±0.2% , number 398,154 ±20,640 | 3.0% ±<0.1% , number 10,168,097 ±89,190 |
| Another state | 2.8% ±0.2% , number 306,553 ±18,110 | 2.1% ±<0.1% , number 7,025,589 ±81,660 |
| Another country | 0.5% ±0.1% , number 57,364 ±8,034 | 0.6% ±<0.1% , number 1,984,943 ±47,210 |
Embed
Top countries of birth, among those born abroad
Source: ACS 2025 1-year, table A07001.
Show data
| North Carolina | |
|---|---|
| Mexico | 19.3% , number 213,183 |
| India | 10.5% , number 115,989 |
| Honduras | 5.0% , number 54,959 |
| El Salvador | 3.9% , number 42,727 |
| Guatemala | 3.1% , number 33,995 |
| Colombia | 2.9% , number 31,853 |
Embed
All the numbers
| Indicator | North Carolina | US | Rank among states* | Table |
|---|---|---|---|---|
| Population | 11,197,968 | 341,784,859 | 9th | A00001 |
| People per square mile | 230 | 97 | 15th | A00002 |
| Land area (square miles) | 48,624 | – | – | A00002 |
| Median age | 39.6 ±0.2 | 39.5 ±0.1 | 23rd | A01004 |
| Under 18 | 21.0% ±0.2% , number 2,346,609 ±24,780 | 21.0% ±<0.1% , number 71,689,151 ±111,800 | 27th | B02002 |
| 65 and over | 19.0% ±0.2% , number 2,132,410 ±21,990 | 19.0% ±<0.1% , number 64,775,018 ±120,300 | 29th | B02002 |
| Born outside the US | 9.9% ±0.2% , number 1,105,839 ±26,730 | 14.7% ±0.1% , number 50,409,320 ±204,800 | 22nd | A06001 |
| Speak a language other than English at home | 14.7% ±0.3% , number 1,556,105 ±32,840 | 22.9% ±0.1% , number 74,190,755 ±244,000 | 24th | C16001 |
| Veterans (adults) | 7.4% ±0.2% , number 646,491 ±13,460 | 5.9% ±<0.1% , number 15,746,228 ±85,320 | 18th | A16002 |
| Living with a disability | 14.1% ±0.2% , number 1,544,720 ±23,870 | 13.7% ±<0.1% , number 46,271,455 ±126,000 | 28th | B18101 |
| Women 15–50 who had a baby in the past year | 4.7% ±0.3% , number 124,589 ±7,939 | 5.0% ±0.1% , number 4,016,759 ±44,040 | 26th | B13002 |
| Lived in the same home a year ago | 88.0% ±0.3% , number 9,756,918 ±35,930 | 88.4% ±0.1% , number 298,889,697 ±214,800 | 28th | A08001 |
| White, not Hispanic | 57.8% ±0.1% , number 6,474,515 ±8,972 | 55.0% ±<0.1% , number 187,959,031 ±58,340 | 33rd | A04001 |
| Hispanic or Latino | 12.6% ±<0.1% , number 1,406,434 ±1,711 | 20.5% ±<0.1% , number 69,975,516 ±13,270 | 23rd | A04001 |
| Black, not Hispanic | 19.2% ±0.2% , number 2,152,323 ±21,400 | 11.7% ±<0.1% , number 40,096,453 ±106,200 | 9th | A04001 |
| Asian, not Hispanic | 3.9% ±0.1% , number 440,453 ±7,505 | 6.5% ±<0.1% , number 22,096,709 ±58,340 | 23rd | A04001 |
*1 is the highest. Population is ranked among all states, and the rest among those of 1,000 people or more, whose figures can be ranked. Ranks use 5-year estimates, the only ones covering every state, so they can differ slightly from the figures here.
Income and work
Lower incomes than the US
The median household income is $77,638, lower than the US ($84,780). 12.1% of people live in poverty, and 8.4% have no health insurance, about the same as the US (8.4%).
Household income
Source: ACS 2025 1-year, table A14001.
Show data
| North Carolina | United States | |
|---|---|---|
| Under $25,000 | 14.3% ±0.3% , number 651,346 ±15,490 | 14.0% ±0.1% , number 18,727,548 ±88,990 |
| $25,000 to $49,999 | 17.6% ±0.4% , number 796,724 ±19,250 | 15.4% ±0.1% , number 20,665,585 ±101,400 |
| $50,000 to $74,999 | 16.4% ±0.4% , number 745,471 ±18,010 | 15.3% ±0.1% , number 20,513,565 ±88,500 |
| $75,000 to $99,999 | 12.9% ±0.3% , number 587,422 ±15,890 | 12.5% ±0.1% , number 16,814,245 ±87,520 |
| $100,000 to $149,999 | 17.4% ±0.4% , number 788,800 ±16,810 | 17.9% ±0.1% , number 24,018,984 ±99,670 |
| $150,000 to $199,999 | 9.4% ±0.3% , number 425,734 ±12,570 | 10.1% ±0.1% , number 13,521,827 ±70,660 |
| $200,000 or more | 12.0% ±0.3% , number 544,034 ±14,780 | 14.8% ±0.1% , number 19,801,668 ±84,120 |
Embed
What residents do for work
Source: ACS 2025 1-year, table A17004.
Show data
| North Carolina | United States | |
|---|---|---|
| Education and health care | 23.7% ±0.4% , number 1,281,994 ±24,230 | 24.4% ±0.1% , number 40,862,193 ±140,800 |
| Professional and business services | 12.9% ±0.3% , number 698,588 ±16,770 | 12.8% ±0.1% , number 21,375,231 ±87,110 |
| Retail trade | 10.8% ±0.3% , number 585,092 ±15,500 | 10.6% ±0.1% , number 17,781,181 ±96,660 |
| Manufacturing | 10.8% ±0.3% , number 583,952 ±16,990 | 9.6% ±0.1% , number 16,064,394 ±91,270 |
| Arts, food and lodging | 8.6% ±0.3% , number 466,035 ±16,310 | 8.9% ±0.1% , number 14,811,502 ±87,840 |
| Finance, insurance and real estate | 7.3% ±0.3% , number 394,903 ±14,900 | 6.6% ±<0.1% , number 11,025,569 ±68,570 |
| Construction | 7.3% ±0.2% , number 394,630 ±12,590 | 6.7% ±<0.1% , number 11,254,981 ±79,620 |
| Transportation and warehousing | 5.4% ±0.2% , number 292,328 ±13,510 | 5.9% ±<0.1% , number 9,832,211 ±73,020 |
Embed
Where workers come from and go
North Carolina has 4,760,483 jobs and 4,727,318 employed residents. 220,943 people commute in to work and 187,778 commute out, while 4,539,540 both live and work here. The most commuters come from South Carolina.
Most commuters come from
- South Carolina: 121,587
- Virginia: 35,115
- Georgia: 11,446
Most residents commute to
- South Carolina: 68,193
- Virginia: 46,168
- Georgia: 12,201
Show data
| North Carolina | |
|---|---|
| Live and work here | 4,539,540 |
| Work here, live elsewhere | 220,943 |
| Live here, work elsewhere | 187,778 |
Embed
All the numbers
| Indicator | North Carolina | US | Rank among states* | Table |
|---|---|---|---|---|
| Median household income | $77,638 ±$876 | $84,780 ±$215 | 38th | A14006 |
| Income per person | $44,003 ±$435 | $47,171 ±$115 | 29th | A14024 |
| Income inequality (Gini index) | 0.469 ±0.003 | 0.482 ±0.001 | 14th | A14028 |
| Living in poverty | 12.1% ±0.4% , number 1,316,451 ±38,560 | 11.8% ±0.1% , number 39,264,183 ±277,400 | 17th | A13004 |
| Unemployment rate | 4.4% ±0.2% , number 248,116 ±13,300 | 4.9% ±<0.1% , number 8,574,594 ±64,350 | 31st | A17005 |
| No health insurance | 8.4% ±0.2% , number 919,963 ±24,810 | 8.4% ±<0.1% , number 28,323,306 ±152,000 | 11th | A20001 |
*1 is the highest. Population is ranked among all states, and the rest among those of 1,000 people or more, whose figures can be ranked. Ranks use 5-year estimates, the only ones covering every state, so they can differ slightly from the figures here.
Education
College degrees close to the US
38.1% of adults 25 and over have a bachelor’s degree or more, higher than the US (37.4%).
Highest level of education
Source: ACS 2025 1-year, table A12001.
Show data
| North Carolina | United States | |
|---|---|---|
| Less than high school | 8.7% ±0.3% , number 680,350 ±19,510 | 9.4% ±0.1% , number 22,321,002 ±120,500 |
| High school only | 24.0% ±0.4% , number 1,867,276 ±30,940 | 25.6% ±0.1% , number 61,096,726 ±203,400 |
| Some college | 29.2% ±0.4% , number 2,277,127 ±31,510 | 27.7% ±0.1% , number 65,920,977 ±173,500 |
| Bachelor’s degree | 23.3% ±0.4% , number 1,812,670 ±29,070 | 22.3% ±0.1% , number 53,224,312 ±196,700 |
| Graduate degree | 14.8% ±0.3% , number 1,151,594 ±20,200 | 15.0% ±0.1% , number 35,816,011 ±159,400 |
Embed
All the numbers
| Indicator | North Carolina | US | Rank among states* | Table |
|---|---|---|---|---|
| Bachelor’s degree or more | 38.1% ±0.5% , number 2,964,264 ±35,400 | 37.4% ±0.1% , number 89,040,323 ±253,200 | 21st | A12001 |
| High school graduate or more | 91.3% ±0.7% , number 7,108,667 ±56,590 | 90.6% ±0.2% , number 216,058,026 ±368,200 | 33rd | A12001 |
*1 is the highest. Population is ranked among all states, and the rest among those of 1,000 people or more, whose figures can be ranked. Ranks use 5-year estimates, the only ones covering every state, so they can differ slightly from the figures here.
Housing
Home values outran incomes
33.0% of households rent, lower than the US (34.7%). The median home is worth $342,800 and the median rent is $1,412. After inflation, home values rose 56% from 2015 to 2025, while household income rose 18%.
Housing costs and income, 2015 to 2025, after inflation
Source: ACS 1-year, table A10036, A18009, A14006.
Show data
| North Carolina | United States | |
|---|---|---|
| Median home value | +56.3% | +39.3% |
| Median rent | +24.6% | +18.5% |
| Median household income | +18.5% | +10.9% |
Embed
Types of homes
Source: ACS 2025 1-year, table A10032.
Show data
| North Carolina | United States | |
|---|---|---|
| Single-family, detached | 65.3% ±0.5% , number 3,372,726 ±23,340 | 60.9% ±0.1% , number 90,335,844 ±173,300 |
| Single-family, attached | 5.2% ±0.2% , number 269,171 ±11,550 | 6.4% ±<0.1% , number 9,527,703 ±51,230 |
| 2 to 4 units | 4.3% ±0.2% , number 221,156 ±10,100 | 7.5% ±0.1% , number 11,109,005 ±75,790 |
| 5 to 19 units | 8.0% ±0.3% , number 413,462 ±14,880 | 8.7% ±0.1% , number 12,829,882 ±97,590 |
| 20 or more units | 7.0% ±0.3% , number 362,364 ±15,130 | 11.1% ±0.1% , number 16,381,450 ±92,310 |
| Mobile homes and other | 10.2% ±0.3% , number 528,986 ±14,080 | 5.4% ±<0.1% , number 8,045,083 ±53,680 |
Embed
When homes were built
Source: ACS 2025 1-year, table A10055.
Show data
| North Carolina | United States | |
|---|---|---|
| 2010 or later | 22.5% ±0.5% , number 1,020,465 ±21,330 | 15.1% ±0.1% , number 20,257,912 ±101,300 |
| 2000 to 2009 | 18.3% ±0.4% , number 832,371 ±17,350 | 13.8% ±0.1% , number 18,535,840 ±92,260 |
| 1980 to 1999 | 28.3% ±0.5% , number 1,284,680 ±21,550 | 24.1% ±0.1% , number 32,332,570 ±118,900 |
| 1960 to 1979 | 18.5% ±0.4% , number 840,538 ±17,810 | 22.9% ±0.1% , number 30,726,302 ±110,000 |
| Before 1960 | 12.4% ±0.4% , number 561,477 ±16,110 | 24.0% ±0.1% , number 32,210,798 ±121,500 |
Embed
All the numbers
| Indicator | North Carolina | US | Rank among states* | Table |
|---|---|---|---|---|
| Housing units | 5,167,865 | – | – | A10001 |
| Households | 4,539,531 ±17,010 | – | – | A10008 |
| People per household | 2.40 ±0.01 | 2.49 ±0.01 | 27th | A10003 |
| Households that rent | 33.0% ±0.5% , number 1,499,411 ±21,880 | 34.7% ±0.1% , number 46,551,688 ±193,200 | 19th | A10060 |
| Vacant homes | 12.2% ±0.3% , number 628,334 ±17,060 | 9.6% ±0.1% , number 14,165,545 ±137,100 | 15th | A10047, A10060 |
| Median gross rent | $1,412 ±$15 | $1,557 ±$4 | 27th | A18009 |
| Median home value | $342,800 ±$2,737 | $371,100 ±$646 | 28th | A10036 |
| Renters paying 30% or more of income | 46.5% ±1.1% , number 696,749 ±19,840 | 48.3% ±0.2% , number 22,486,693 ±122,100 | 27th | A18002 |
| Owners paying 30% or more of income | 21.5% ±0.6% , number 655,079 ±17,750 | 24.2% ±0.1% , number 21,201,943 ±93,050 | 33rd | A10040 |
| Homes built before 1960 | 12.4% ±0.4% , number 561,477 ±16,110 | 24.0% ±0.1% , number 32,210,798 ±121,500 | 42nd | A10055 |
*1 is the highest. Population is ranked among all states, and the rest among those of 1,000 people or more, whose figures can be ranked. Ranks use 5-year estimates, the only ones covering every state, so they can differ slightly from the figures here.
Getting around
A driving state with short commutes
71.8% of workers drive alone and 15.1% work from home. 35.9% of those who travel to work spend 30 minutes or more getting there, and 5.4% of households have no vehicle.
How people get to work
Source: ACS 2025 1-year, table A09005.
Show data
| North Carolina | United States | |
|---|---|---|
| Drive alone | 71.8% ±0.4% , number 3,890,450 ±31,550 | 69.8% ±0.1% , number 115,297,377 ±192,900 |
| Carpool | 9.1% ±0.3% , number 494,687 ±16,500 | 8.9% ±0.1% , number 14,712,170 ±97,240 |
| Public transit | 1.0% ±0.1% , number 55,005 ±6,340 | 4.3% ±<0.1% , number 7,100,386 ±63,330 |
| Walk | 1.7% ±0.1% , number 92,769 ±6,735 | 2.4% ±<0.1% , number 4,016,469 ±41,070 |
| Work from home | 15.1% ±0.3% , number 819,624 ±18,930 | 12.9% ±0.1% , number 21,288,393 ±105,700 |
| Other | 1.2% ±0.1% , number 66,863 ±6,215 | 1.7% ±<0.1% , number 2,799,658 ±41,510 |
Embed
Time spent getting to work
Source: ACS 2025 1-year, table B09001.
Show data
| North Carolina | United States | |
|---|---|---|
| Under 10 minutes | 11.9% ±0.4% , number 549,074 ±17,070 | 12.0% ±0.1% , number 17,199,225 ±93,440 |
| 10 to 19 minutes | 29.5% ±0.5% , number 1,359,063 ±25,600 | 27.8% ±0.1% , number 40,059,540 ±137,700 |
| 20 to 29 minutes | 22.6% ±0.4% , number 1,039,255 ±21,190 | 21.0% ±0.1% , number 30,221,743 ±111,100 |
| 30 to 39 minutes | 17.4% ±0.5% , number 798,331 ±22,340 | 17.1% ±0.1% , number 24,659,138 ±103,800 |
| 40 to 59 minutes | 11.7% ±0.4% , number 536,103 ±17,300 | 12.6% ±0.1% , number 18,104,709 ±97,070 |
| 60 minutes or more | 6.9% ±0.3% , number 317,948 ±12,140 | 9.5% ±0.1% , number 13,681,705 ±84,440 |
Embed
Vehicles per household
Source: ACS 2025 1-year, table A10030.
Show data
| North Carolina | United States | |
|---|---|---|
| None | 5.4% ±0.2% , number 245,908 ±10,290 | 8.8% ±0.1% , number 11,781,997 ±77,240 |
| One | 31.5% ±0.5% , number 1,429,999 ±22,270 | 33.1% ±0.1% , number 44,424,682 ±160,700 |
| Two | 37.3% ±0.5% , number 1,692,892 ±24,930 | 36.0% ±0.1% , number 48,200,889 ±176,800 |
| Three or more | 25.8% ±0.5% , number 1,170,732 ±21,200 | 22.1% ±0.1% , number 29,655,854 ±113,300 |
Embed
All the numbers
| Indicator | North Carolina | US | Rank among states* | Table |
|---|---|---|---|---|
| Drive to work alone | 71.8% ±0.4% , number 3,890,450 ±31,550 | 69.8% ±0.1% , number 115,297,377 ±192,900 | 26th | A09005 |
| Take public transit | 1.0% ±0.1% , number 55,005 ±6,340 | 4.3% ±<0.1% , number 7,100,386 ±63,330 | 33rd | A09005 |
| Work from home | 15.1% ±0.3% , number 819,624 ±18,930 | 12.9% ±0.1% , number 21,288,393 ±105,700 | 15th | A09005 |
| Commute 30 minutes or more | 35.9% ±0.6% , number 1,652,382 ±30,760 | 39.2% ±0.1% , number 56,445,552 ±165,300 | 26th | B09001 |
| Households with no vehicle | 5.4% ±0.2% , number 245,908 ±10,340 | 8.8% ±<0.1% , number 11,781,997 ±64,240 | 42nd | A10030 |
*1 is the highest. Population is ranked among all states, and the rest among those of 1,000 people or more, whose figures can be ranked. Ranks use 5-year estimates, the only ones covering every state, so they can differ slightly from the figures here.
Places
The largest cities in North Carolina
Population, from the latest estimates available. Figures cover the whole of each place.
Largest places
- Charlotte: 964,769
- Raleigh: 506,124
- Greensboro: 308,666
- Durham: 305,672
- Winston-Salem: 257,275
- Fayetteville: 209,130
- Cary: 182,798
- Wilmington: 126,808
States like this one
- Pennsylvania: 13,018,639
- Georgia: 10,940,407
- Tennessee: 7,066,383
- Wisconsin: 5,914,872
States at least a third this size, with the closest income, education, age, housing and origins.
Every county and place in North Carolina
Find any county, city, town, metro area, ZIP code, school district or district in North Carolina.
Counties
Each of the 100 counties with its population, from ACS 2020–2024 5-year estimates.
- Alamance County176,893
- Alexander County36,412
- Alleghany County11,174
- Anson County22,289
- Ashe County26,950
- Avery County17,680
- Beaufort County44,499
- Bertie County17,170
- Bladen County29,566
- Brunswick County152,568
- Buncombe County274,360
- Burke County87,795
- Cabarrus County236,133
- Caldwell County80,536
- Camden County10,927
- Carteret County69,148
- Caswell County22,404
- Catawba County163,573
- Chatham County80,151
- Cherokee County29,562
- Chowan County13,836
- Clay County11,610
- Cleveland County100,991
- Columbus County50,140
- Craven County102,612
- Cumberland County338,545
- Currituck County30,601
- Dare County37,875
- Davidson County172,954
- Davie County44,122
- Duplin County49,335
- Durham County332,353
- Edgecombe County48,736
- Forsyth County389,977
- Franklin County74,386
- Gaston County234,881
- Gates County10,376
- Graham County8,072
- Granville County60,877
- Greene County20,486
- Guilford County547,940
- Halifax County47,675
- Harnett County139,150
- Haywood County62,662
- Henderson County118,484
- Hertford County19,908
- Hoke County53,835
- Hyde County4,592
- Iredell County196,544
- Jackson County43,771
- Johnston County234,263
- Jones County9,302
- Lee County65,816
- Lenoir County54,919
- Lincoln County92,716
- Macon County37,941
- Madison County21,867
- Martin County21,644
- McDowell County44,817
- Mecklenburg County1.15M
- Mitchell County14,992
- Montgomery County26,007
- Moore County104,876
- Nash County96,216
- New Hanover County235,229
- Northampton County16,931
- Onslow County207,906
- Orange County149,678
- Pamlico County12,390
- Pasquotank County40,834
- Pender County65,550
- Perquimans County13,244
- Person County39,542
- Pitt County177,193
- Polk County19,891
- Randolph County146,348
- Richmond County42,344
- Robeson County116,902
- Rockingham County92,131
- Rowan County149,875
- Rutherford County64,930
- Sampson County59,470
- Scotland County33,590
- Stanly County64,651
- Stokes County45,139
- Surry County71,425
- Swain County14,013
- Transylvania County33,691
- Tyrrell County3,423
- Union County250,958
- Vance County42,322
- Wake County1.18M
- Warren County18,795
- Washington County10,812
- Watauga County55,123
- Wayne County118,652
- Wilkes County65,935
- Wilson County79,290
- Yadkin County37,574
- Yancey County18,797
Cities, towns and other places
Each of the 772 with its population, from ACS 2020–2024 5-year estimates. Census-designated places are communities without a local government of their own, drawn by the Census Bureau so they can be counted.
- Aberdeen9,228
- Advance1,408
- Ahoskie4,764
- Alamance1,267
- Albemarle16,762
- Alexis635
- Alliance709
- Altamahaw491
- Anderson Creek13,927
- Andrews1,998
- Angier6,241
- Ansonville651
- Apex70,630
- Aquadale156
- Arapahoe397
- Archdale12,087
- Archer Lodge5,186
- Arrowhead Beach1,242
- Asheboro27,580
- Asheville94,535
- Ashley Heights282
- Askewville155
- Atkinson485
- Atlantic522
- Atlantic Beach1,719
- Aulander689
- Aurora560
- Autryville177
- Avery Creek2,887
- Avon339
- Ayden5,150
- Badin2,184
- Bailey422
- Bakersville747
- Bald Head Island190
- Balfour1,134
- Banner Elk1,473
- Barbecue5,910
- Barker Heights1,074
- Barker Ten Mile1,156
- Barnardsville445
- Bath391
- Bayboro1,266
- Bayshore2,949
- Bayview253
- Bear Grass133
- Beaufort4,689
- Beech Mountain987
- Belhaven1,577
- Bell Arthur374
- Belmont15,546
- Belville2,573
- Belvoir272
- Belwood893
- Bennett262
- Benson4,282
- Bent Creek1,384
- Bermuda Run3,211
- Bessemer City5,580
- Bethania443
- Bethel1,544
- Bethlehem4,101
- Beulaville1,307
- Biltmore Forest1,587
- Biscoe2,116
- Black Creek749
- Black Mountain8,513
- Bladenboro2,249
- Blowing Rock992
- Blue Clay Farms94
- Boardman210
- Bogue756
- Boiling Spring Lakes6,347
- Boiling Springs4,757
- Bolivia247
- Bolton504
- Bonnetsville1,063
- Boone20,032
- Boonville1,593
- Bostic433
- Bowdens122
- Bowmore88
- Brandywine Bay1,313
- Brevard7,897
- Briar Chapel6,049
- Brices Creek3,415
- Bridgeton427
- Broad Creek1,836
- Broadway1,657
- Brogden2,733
- Brookford390
- Brunswick937
- Bryson City1,902
- Buies Creek3,746
- Bunn466
- Bunnlevel844
- Burgaw3,850
- Burlington59,610
- Burnsville2,082
- Butner8,065
- Butters62
- Buxton1,267
- Cajah's Mountain2,704
- Calabash2,377
- Calypso385
- Camden1,115
- Cameron364
- Candor1,160
- Canton4,419
- Cape Carteret2,703
- Cape Colony509
- Caroleen116
- Carolina Beach6,745
- Carolina Meadows555
- Carolina Shores5,017
- Carrboro21,204
- Carthage2,896
- Cary179,306
- Casar373
- Cashiers683
- Castalia247
- Castle Hayne897
- Caswell Beach491
- Catawba628
- Cedar Point1,917
- Cedar Rock306
- Centerville202
- Cerro Gordo319
- Chadbourn1,352
- Chapel Hill61,607
- Charlotte903,844
- Cherokee2,059
- Cherry Branch1,684
- Cherryville6,226
- Chimney Rock Village122
- China Grove4,530
- Chinquapin83
- Chocowinity903
- Chowan Beach325
- Claremont1,922
- Clarkton740
- Clayton29,320
- Clemmons21,871
- Cleveland1,080
- Cliffside438
- Clinton8,304
- Clyde1,359
- Coats1,664
- Cofield300
- Coinjock543
- Colerain239
- Columbia759
- Columbus1,071
- Como123
- Concord108,719
- Conetoe561
- Connelly Springs2,427
- Conover8,580
- Conway832
- Cooleemee988
- Cordova1,372
- Cornelius32,783
- Cove City504
- Cove Creek1,629
- Cramerton5,450
- Creedmoor4,997
- Creswell217
- Cricket2,317
- Crossnore115
- Crouse408
- Cullowhee7,973
- Cypress Landing1,044
- Dallas6,104
- Dana4,147
- Danbury197
- Davidson15,660
- Davis261
- Deep Run662
- Deercroft718
- Delco258
- Dellview26
- Delway167
- Denton1,506
- Denver2,497
- Dillsboro195
- Dobbins Heights560
- Dobson1,652
- Dortches1,158
- Dover404
- Drexel2,146
- Dublin349
- Duck669
- Dudley2,305
- Dunn8,559
- Durham291,467
- Earl309
- East Arcadia444
- East Bend715
- East Flat Rock6,323
- East Rockingham2,779
- East Spencer1,434
- Eastover3,666
- Eden15,356
- Edenton4,494
- Edneyville2,716
- Efland1,611
- Elizabeth City18,871
- Elizabethtown3,277
- Elk Park560
- Elkin4,043
- Ellenboro901
- Ellerbe1,036
- Elm City1,292
- Elon11,032
- Elrod246
- Elroy3,251
- Emerald Isle3,934
- Emma2,657
- Enfield2,153
- Engelhard174
- Enochville3,321
- Erwin4,687
- Etowah7,968
- Eureka224
- Everetts193
- Evergreen421
- Fair Bluff695
- Fairfield81
- Fairfield Harbour2,948
- Fairmont2,463
- Fairplains1,803
- Fairview CDP2,298
- Fairview town3,619
- Faison660
- Faith917
- Falcon272
- Falkland120
- Fallston616
- Farmington409
- Farmville4,514
- Fayetteville210,815
- Fearrington Village2,356
- Five Points940
- Flat Rock CDP1,062
- Flat Rock village3,530
- Fletcher8,098
- Forest City7,363
- Forest Hills329
- Forest Oaks4,293
- Foscoe1,226
- Fountain409
- Four Oaks2,459
- Foxfire1,925
- Franklin4,268
- Franklinton2,645
- Franklinville1,131
- Fremont943
- Frisco664
- Fruitland2,398
- Fuquay-Varina40,485
- Gamewell3,689
- Garland704
- Garner34,473
- Garysburg572
- Gaston912
- Gastonia82,884
- Gatesville320
- Germanton1,087
- Gerton110
- Gibson745
- Gibsonville9,467
- Glen Alpine1,991
- Glen Raven3,506
- Glenville138
- Glenwood226
- Gloucester385
- Godwin203
- Gold Hill914
- Goldsboro34,383
- Goldston379
- Gorman1,591
- Governors Club1,787
- Governors Village2,295
- Graham18,048
- Graingers27
- Grandfather Village14
- Grandy2,245
- Granite Falls4,929
- Granite Quarry3,043
- Grantsboro645
- Green Level3,230
- Greenevers648
- Greensboro301,198
- Greenville92,857
- Grifton2,515
- Grimesland650
- Grover621
- Gulf178
- Half Moon7,378
- Halifax294
- Hallsboro291
- Hamilton243
- Hamlet5,961
- Hampstead9,292
- Harkers Island1,060
- Harmony967
- Harrells175
- Harrellsville196
- Harrisburg19,633
- Hassell45
- Hatteras152
- Havelock17,691
- Haw River2,824
- Hayesville1,208
- Hays1,053
- Hemby Bridge2,096
- Henderson14,885
- Hendersonville15,408
- Henrietta197
- Hertford1,618
- Hickory44,258
- Hiddenite290
- High Point116,245
- High Shoals534
- Highlands1,074
- Hightsville397
- Hildebran2,207
- Hillsborough9,724
- Hobgood207
- Hobucken5
- Hoffman821
- Holden Beach962
- Hollister819
- Holly Ridge4,904
- Holly Springs45,248
- Hookerton573
- Hoopers Creek1,683
- Hope Mills17,939
- Horse Shoe1,490
- Hot Springs567
- Hudson3,772
- Huntersville63,969
- Icard2,153
- Indian Beach211
- Indian Trail42,036
- Ingold599
- Iron Station934
- Ivanhoe275
- JAARS715
- Jackson777
- Jackson Heights794
- Jackson Springs250
- Jacksonville71,279
- James City4,789
- Jamestown3,708
- Jamesville457
- Jefferson1,864
- Jonesville2,860
- Kannapolis57,890
- Keener271
- Kelford177
- Kelly616
- Kenansville1,090
- Kenly2,359
- Kernersville27,830
- Kill Devil Hills7,761
- King7,408
- Kings Grant9,003
- Kings Mountain12,039
- Kingstown381
- Kinston19,505
- Kittrell57
- Kitty Hawk3,724
- Knightdale20,214
- Kure Beach2,466
- La Grange2,756
- Lake Junaluska3,175
- Lake Lure1,543
- Lake Norman of Catawba9,906
- Lake Norman of Iredell12,494
- Lake Park3,431
- Lake Royale3,168
- Lake Santeetlah82
- Lake Waccamaw1,770
- Landis3,765
- Lansing165
- Lasker152
- Lattimore526
- Laurel Hill986
- Laurel Park2,408
- Laurinburg15,087
- Lawndale739
- Leggett43
- Leland29,607
- Lenoir18,299
- Lewiston Woodville447
- Lewisville13,828
- Lexington19,690
- Liberty2,682
- Light Oak277
- Lilesville971
- Lillington4,709
- Lincolnton11,783
- Linden129
- Linville291
- Littleton549
- Locust5,840
- Long Creek206
- Long View5,011
- Louisburg3,263
- Love Valley159
- Lowell3,768
- Lowesville3,874
- Lowgap264
- Lucama1,205
- Lumber Bridge75
- Lumberton18,859
- Macclesfield391
- Macon66
- Madison2,242
- Maggie Valley2,112
- Magnolia1,024
- Maiden3,788
- Mamers669
- Manns Harbor926
- Manteo2,020
- Mar-Mac2,877
- Marble472
- Marietta106
- Marion7,579
- Mars Hill3,025
- Marshall961
- Marshallberg398
- Marshville2,615
- Marvin6,692
- Matthews30,577
- Maury1,339
- Maxton2,330
- Mayodan2,401
- Maysville1,022
- McAdenville1,010
- McDonald106
- McFarlan164
- McLeansville688
- Mebane19,538
- Mesic205
- Micro573
- Middleburg141
- Middlesex867
- Midland4,860
- Midway4,897
- Millers Creek1,689
- Millingport522
- Mills River7,281
- Milton133
- Milwaukee139
- Mineral Springs3,314
- Minnesott Beach593
- Mint Hill27,556
- Misenheimer659
- Mocksville6,068
- Momeyer398
- Moncure1,039
- Monroe36,759
- Montreat630
- Mooresboro190
- Mooresville52,381
- Moravian Falls1,285
- Morehead City9,806
- Morganton17,646
- Morrisville31,422
- Morven362
- Mount Airy10,633
- Mount Gilead1,197
- Mount Holly18,208
- Mount Olive4,453
- Mount Pleasant2,230
- Mountain Home3,437
- Mountain View3,982
- Moyock5,684
- Mulberry2,037
- Murfreesboro3,170
- Murphy1,604
- Murraysville16,339
- Myrtle Grove12,637
- Nags Head3,160
- Nashville5,729
- Navassa2,039
- Nebo1,670
- Neuse Forest2,671
- New Bern32,734
- New Hope1,487
- New London608
- Newland866
- Newport4,441
- Newton13,333
- Newton Grove498
- Norlina1,087
- Norman89
- North Topsail Beach784
- North Wilkesboro4,421
- Northchase5,896
- Northlakes1,716
- Northwest885
- Norwood2,433
- Oak City353
- Oak Island9,030
- Oak Ridge7,744
- Oakboro2,683
- Ocean Isle Beach903
- Ocracoke723
- Ogden8,249
- Old Fort555
- Old Hundred131
- Oriental873
- Orrum56
- Ossipee795
- Oxford8,914
- Pantego493
- Parkton529
- Parmele374
- Patterson Springs845
- Peachland443
- Peletier1,009
- Pembroke2,822
- Pikeville776
- Pilot Mountain1,483
- Pine Knoll Shores1,351
- Pine Level2,031
- Pinebluff1,806
- Pinehurst18,256
- Pinetops1,426
- Pinetown19
- Pineville11,055
- Piney Green14,078
- Pink Hill527
- Pinnacle540
- Pittsboro4,752
- Plain View1,741
- Pleasant Garden5,060
- Pleasant Hill793
- Plymouth3,250
- Polkton2,555
- Polkville536
- Pollocksville463
- Porters Neck7,654
- Potters Hill595
- Powellsville277
- Princeton1,658
- Princeville1,619
- Proctorville109
- Prospect907
- Pumpkin Center1,636
- Raeford4,552
- Raemon288
- Raleigh481,031
- Ramseur2,150
- Randleman4,644
- Ranlo4,617
- Raynham42
- Red Cross903
- Red Oak3,405
- Red Springs3,125
- Reidsville14,585
- Rennert292
- Rex59
- Rhodhiss1,166
- Rich Square880
- Richfield937
- Richlands2,335
- Riegelwood649
- River Bend2,874
- River Road3,366
- Roanoke Rapids14,856
- Robbins1,893
- Robbinsville577
- Roberdel279
- Robersonville1,220
- Rockfish3,574
- Rockingham8,967
- Rockwell2,782
- Rocky Mount54,297
- Rocky Point1,020
- Rodanthe781
- Rolesville10,766
- Ronda436
- Roper384
- Rose Hill1,309
- Roseboro1,123
- Rosman699
- Rougemont703
- Rowland946
- Roxboro8,182
- Roxobel326
- Royal Pines4,325
- Ruffin423
- Rural Hall3,466
- Ruth510
- Rutherford College1,374
- Rutherfordton3,680
- Salem2,377
- Salemburg550
- Salisbury35,825
- Saluda683
- Salvo220
- Sandy Creek300
- Sandyfield763
- Sanford31,478
- Saratoga291
- Sawmills5,042
- Saxapahaw1,301
- Scotch Meadows370
- Scotland Neck2,006
- Sea Breeze1,849
- Seaboard585
- Seagrove407
- Sedalia772
- Selma6,817
- Seven Devils425
- Seven Lakes4,535
- Seven Springs32
- Severn158
- Shallotte4,639
- Shannon125
- Sharpsburg1,605
- Shelby22,100
- Siler City7,995
- Silver City592
- Silver Lake6,563
- Simpson432
- Sims522
- Skippers Corner3,792
- Smithfield12,116
- Smithtown211
- Sneads Ferry2,728
- Snow Hill2,438
- South Henderson981
- South Mills230
- South Rosemary2,475
- South Weldon500
- Southern Pines16,420
- Southern Shores3,139
- Southmont1,525
- Southport4,205
- Sparta1,928
- Speed64
- Spencer3,349
- Spindale4,131
- Spivey's Corner954
- Spout Springs11,242
- Spring Hope1,387
- Spring Lake11,573
- Springdale1,075
- Spruce Pine2,398
- St. Helena544
- St. James7,072
- St. Pauls2,688
- St. Stephens9,457
- Staley456
- Stallings16,886
- Stanfield1,522
- Stanley4,069
- Stantonsburg958
- Star1,282
- Statesville29,894
- Stedman1,670
- Stem1,249
- Stokes210
- Stokesdale6,004
- Stoneville1,094
- Stonewall131
- Stony Point1,372
- Stovall235
- Sugar Mountain539
- Summerfield11,116
- Sunbury251
- Sunset Beach4,351
- Surf City4,396
- Swan Quarter458
- Swannanoa6,901
- Swansboro3,997
- Swepsonville2,517
- Sylva2,646
- Tabor City3,777
- Tar Heel69
- Tarboro10,770
- Taylorsville2,201
- Taylortown764
- Teachey427
- Thomasville27,321
- Toast893
- Tobaccoville2,664
- Topsail Beach406
- Trent Woods4,032
- Trenton319
- Trinity7,111
- Troutman3,995
- Troy2,926
- Tryon1,810
- Turkey391
- Tyro3,833
- Unionville6,954
- Valdese4,704
- Valle Crucis242
- Valley Hill2,675
- Vanceboro1,030
- Vandemere209
- Vander1,922
- Vann Crossroads187
- Varnamtown782
- Vass1,644
- Waco171
- Wade518
- Wadesboro4,972
- Wagram754
- Wake Forest52,844
- Wakulla142
- Walkertown5,873
- Wallace3,457
- Wallburg3,150
- Walnut Cove2,115
- Walnut Creek1,422
- Walstonburg313
- Wanchese1,956
- Warrenton772
- Warsaw2,746
- Washington9,726
- Washington Park456
- Watha271
- Waves153
- Waxhaw22,275
- Waynesville10,502
- Weaverville4,687
- Webster470
- Weddington13,805
- Welcome3,521
- Weldon1,642
- Wendell13,064
- Wentworth2,692
- Wesley Chapel9,090
- West Canton1,412
- West Jefferson1,436
- West Marion1,066
- Westport5,915
- Whispering Pines5,211
- Whitakers494
- White Lake970
- White Oak191
- White Plains795
- Whiteville4,696
- Whitsett569
- Wilkesboro3,646
- Williamston5,112
- Wilmington120,805
- Wilson48,370
- Wilson's Mills2,753
- Windsor3,269
- Winfall697
- Wingate4,425
- Winston-Salem252,037
- Winterville10,725
- Winton593
- Woodfin8,048
- Woodland497
- Woodlawn1,085
- Wrightsboro6,287
- Wrightsville Beach2,665
- Yadkin College400
- Yadkinville3,004
- Yanceyville2,215
- Youngsville3,011
- Zebulon8,711
Metro and micro areas
Each of the 39 that reach into North Carolina, with its whole population, from ACS 2020–2024 5-year estimates. Metro and micro areas are counties tied together by commuting, drawn by the Office of Management and Budget.
- Albemarle, NC Micro Area64,651
- Anderson Creek, NC Micro Area139,150
- Asheville, NC Metro Area414,711
- Boone, NC Micro Area55,123
- Brevard, NC Micro Area33,691
- Burlington, NC Metro Area176,893
- Charlotte-Concord-Gastonia, NC-SC Metro Area2.77M
- Durham-Chapel Hill, NC Metro Area601,724
- Elizabeth City, NC Micro Area40,834
- Fayetteville, NC Metro Area392,380
- Forest City, NC Micro Area64,930
- Goldsboro, NC Metro Area118,652
- Greensboro-High Point, NC Metro Area786,419
- Greenville, NC Metro Area177,193
- Henderson, NC Micro Area42,322
- Hickory-Lenoir-Morganton, NC Metro Area368,316
- Jacksonville, NC Metro Area207,906
- Kill Devil Hills, NC Micro Area37,875
- Kinston, NC Micro Area54,919
- Laurinburg, NC Micro Area33,590
- Lumberton, NC Micro Area116,902
- Marion, NC Micro Area44,817
- Morehead City, NC Micro Area69,148
- Mount Airy, NC Micro Area71,425
- New Bern, NC Micro Area124,304
- North Wilkesboro, NC Micro Area65,935
- Pinehurst-Southern Pines, NC Metro Area104,876
- Raleigh-Cary, NC Metro Area1.49M
- Roanoke Rapids, NC Micro Area64,606
- Rockingham, NC Micro Area42,344
- Rocky Mount, NC Metro Area144,952
- Sanford, NC Micro Area65,816
- Shelby-Kings Mountain, NC Micro Area100,991
- Virginia Beach-Chesapeake-Norfolk, VA-NC Metro Area1.79M
- Washington, NC Micro Area44,499
- Waynesville, NC Micro Area62,662
- Wilmington, NC Metro Area453,347
- Wilson, NC Micro Area79,290
- Winston-Salem, NC Metro Area689,766
ZIP codes
Each of the 836 with people in it, by the town it's centered in, from ACS 2020–2024 5-year estimates. These are the Census Bureau's ZIP Code Tabulation Areas, which follow the Postal Service's ZIP codes as closely as census blocks allow.
- 27006Advance16,247
- 27007White Plains2,095
- 27009Stokesdale2,939
- 27011Boonville5,582
- 27012Clemmons30,543
- 27013Cleveland6,575
- 27014Cooleemee939
- 27016Danbury1,900
- 27017Dobson10,085
- 27018East Bend7,388
- 27019Germanton3,544
- 27020Jonesville6,207
- 27021King17,106
- 27022Danbury1,285
- 27023Lewisville14,414
- 27024Lowgap2,387
- 27025Madison12,537
- 27027Mayodan3,836
- 27028Mocksville26,566
- 27030Toast36,241
- 27040Bethania12,665
- 27041Pilot Mountain8,303
- 27042Madison278
- 27043Pinnacle6,295
- 27045Rural Hall10,863
- 27046Mayodan2,032
- 27047Smithtown1,247
- 27048Stoneville7,814
- 27050Tobaccoville3,823
- 27051Walkertown7,873
- 27052Walnut Cove10,506
- 27053Pilot Mountain3,068
- 27054Cooleemee1,931
- 27055Yadkinville14,674
- 27101Winston-Salem22,973
- 27103Winston-Salem33,325
- 27104Winston-Salem31,783
- 27105Winston-Salem40,678
- 27106Winston-Salem49,670
- 27107Wallburg50,769
- 27109Winston-Salem2,823
- 27110Winston-Salem2,181
- 27127Winston-Salem41,443
- 27201Alamance139
- 27202Altamahaw135
- 27203Asheboro23,224
- 27205Asheboro36,947
- 27207Goldston4,367
- 27208Bennett1,979
- 27209Biscoe3,906
- 27212Milton1,997
- 27213Goldston60
- 27214McLeansville14,766
- 27215Alamance47,102
- 27217Green Level41,406
- 27229Candor3,456
- 27231Efland2,331
- 27233Pleasant Garden3,178
- 27235Greensboro5,237
- 27239Denton7,954
- 27242Candor1,674
- 27243Efland5,677
- 27244Altamahaw16,329
- 27247Star42
- 27248Franklinville4,234
- 27249Ossipee13,741
- 27252Goldston1,425
- 27253Saxapahaw33,114
- 27256Gulf64
- 27258Haw River6,391
- 27259Robbins14
- 27260High Point25,299
- 27262High Point28,353
- 27263Archdale21,446
- 27265High Point48,798
- 27268High Point1,611
- 27278Hillsborough27,925
- 27281Jackson Springs3,864
- 27282Jamestown15,927
- 27283Forest Oaks3,366
- 27284Kernersville58,065
- 27288Eden22,926
- 27291Milton1,656
- 27292Lexington40,311
- 27295Yadkin College39,267
- 27298Liberty10,090
- 27299Tyro5,034
- 27301McLeansville11,067
- 27302Woodlawn35,418
- 27305Milton1,397
- 27306Mount Gilead5,486
- 27310Oak Ridge8,622
- 27311Ruffin3,842
- 27312Pittsboro23,341
- 27313Pleasant Garden7,781
- 27314594
- 27315Yanceyville1,751
- 27316Ramseur7,084
- 27317Randleman17,870
- 27320Reidsville38,896
- 27325Robbins6,737
- 27326Ruffin3,396
- 27330Sanford39,778
- 27332Cameron36,947
- 27340Saxapahaw48
- 27341Seagrove5,350
- 27342Sedalia96
- 27343Milton1,232
- 27344Siler City19,198
- 27349Saxapahaw7,061
- 27350Randleman5,882
- 27351Southmont145
- 27355Staley2,291
- 27356Star3,193
- 27357Stokesdale9,922
- 27358Summerfield15,685
- 27360Thomasville49,510
- 27370Trinity15,001
- 27371Troy7,572
- 27374Welcome105
- 27376Seven Lakes9,317
- 27377Sedalia10,885
- 27379Yanceyville4,479
- 27401Greensboro21,920
- 27403Greensboro22,557
- 27405McLeansville54,303
- 27406Pleasant Garden60,651
- 27407Jamestown51,697
- 27408Greensboro16,519
- 27409Greensboro17,551
- 27410Greensboro54,921
- 27411Greensboro1,433
- 27412Greensboro3,055
- 27455Summerfield29,302
- 27501Angier24,806
- 27502Apex48,530
- 27503Rougemont5,374
- 27504Benson17,079
- 27505Mamers8,152
- 27506Buies Creek1,056
- 27507Stovall1,811
- 27508Bunn2,362
- 27509Butner7,766
- 27510Carrboro13,868
- 27511Cary33,221
- 27513Cary46,979
- 27514Chapel Hill32,951
- 27516Carrboro47,358
- 27517Governors Club29,564
- 27518Cary19,735
- 27519Cary69,836
- 27520Clayton48,014
- 27521Coats6,549
- 27522Creedmoor13,083
- 27523Apex20,269
- 27524Four Oaks13,999
- 27525Franklinton17,110
- 27526Angier61,588
- 27527Archer Lodge39,256
- 27529Garner55,242
- 27530Mar-Mac37,634
- 27531Goldsboro555
- 27533Goldsboro664
- 27534New Hope30,415
- 27536Henderson15,298
- 27537Henderson24,708
- 27539Holly Springs25,878
- 27540Holly Springs47,771
- 275413,399
- 27542Kenly9,850
- 27544Kittrell3,329
- 27545Knightdale34,163
- 27546Lillington21,419
- 27549Louisburg25,543
- 27551Macon1,836
- 27553Middleburg1,506
- 27555Micro573
- 27556Middleburg142
- 27557Middlesex8,657
- 27559Moncure2,312
- 27560Morrisville40,792
- 27562Moncure5,659
- 27563Norlina5,205
- 27565Oxford23,826
- 27568Pine Level1,542
- 27569Princeton8,833
- 27571Rolesville9,095
- 27572Rougemont6,131
- 27573Roxboro11,537
- 2757414,928
- 27576Selma21,624
- 27577Smithfield28,354
- 27581Stem3,880
- 27582Stovall254
- 27583Roxboro7,242
- 27584Stovall178
- 27587Wake Forest82,886
- 27589Warrenton6,739
- 27591Wendell29,838
- 27592Angier21,114
- 27594Norlina61
- 27596Youngsville22,232
- 27597Zebulon30,184
- 27601Raleigh9,905
- 27603Garner53,972
- 27604Raleigh44,514
- 27605Raleigh6,286
- 27606Garner45,444
- 27607Raleigh28,438
- 27608Raleigh12,604
- 27609Raleigh35,573
- 27610Knightdale81,419
- 27612Raleigh41,952
- 27613Raleigh45,235
- 27614Wake Forest34,226
- 27615Raleigh46,019
- 27616Raleigh63,520
- 27617Morrisville20,237
- 27695Raleigh1,993
- 27701Durham24,793
- 27703Durham63,458
- 27704Gorman40,102
- 27705Durham49,923
- 27707Durham51,274
- 27708Durham3,253
- 27712Gorman24,299
- 27713Durham59,197
- 27801Rocky Mount19,532
- 27803Sharpsburg20,055
- 27804Rocky Mount30,713
- 27805Aulander2,517
- 27806Aurora2,152
- 27807Bailey5,958
- 27808Bayview2,220
- 27809Rocky Mount3,930
- 27810Belhaven3,336
- 27812Bethel2,188
- 27813Black Creek743
- 27814Bayview1,671
- 27816Castalia3,019
- 27817Cypress Landing7,834
- 27818Como850
- 27819Conetoe561
- 27820Conway2,201
- 27821Aurora64
- 27822Elm City7,838
- 27823Enfield6,553
- 27824Engelhard1,109
- 27825Everetts100
- 27826Fairfield821
- 27827Falkland112
- 27828Farmville7,909
- 27829Fountain1,664
- 27830Fremont4,006
- 27831Garysburg2,362
- 27832South Rosemary2,783
- 27834Greenville56,347
- 27837Grimesland6,489
- 27839Halifax3,279
- 27840Hamilton306
- 27841Hassell45
- 27842Littleton1,538
- 27843Hobgood876
- 27844Hollister3,334
- 27845Jackson2,033
- 27846Jamesville3,022
- 27847Kelford1,044
- 27849Lewiston Woodville1,089
- 27850Littleton7,053
- 27851Lucama5,343
- 27852Macclesfield2,269
- 27853Severn585
- 27855Murfreesboro5,783
- 27856Nashville17,081
- 27857Oak City1,099
- 27858Simpson58,774
- 27860Pantego1,546
- 27861Parmele120
- 27862Severn615
- 27863Pikeville13,729
- 27864Pinetops4,446
- 27865Pinetown2,387
- 27866Seaboard577
- 27869Rich Square1,834
- 27870South Rosemary24,958
- 27871Robersonville3,471
- 27872Roxobel326
- 27873Saratoga200
- 27874Scotland Neck3,464
- 27875Belhaven379
- 27876Seaboard1,164
- 27878Sharpsburg1,094
- 27879Simpson307
- 27880Sims3,953
- 27881Speed32
- 27882Spring Hope8,358
- 27883Stantonsburg4,128
- 27884Stokes1,892
- 27885Swan Quarter1,003
- 27886Princeville18,381
- 27888Walstonburg2,054
- 27889Washington24,371
- 27890South Weldon2,258
- 27891Whitakers4,865
- 27892Williamston13,262
- 27893Wilson38,512
- 27896Wilson19,455
- 27897Woodland1,194
- 27909Elizabeth City40,869
- 27910Ahoskie10,487
- 27915Avon339
- 27916Coinjock1,258
- 27917Coinjock725
- 27919Winfall936
- 27920Buxton1,267
- 27921Camden5,063
- 27922Harrellsville758
- 27923Coinjock745
- 27924Colerain2,708
- 27925Columbia3,382
- 27926Sunbury1,983
- 27927Coinjock1,199
- 27928Creswell1,834
- 27929Coinjock3,281
- 27932Edenton12,745
- 27935Winton1,464
- 27936Frisco664
- 27937Gatesville2,936
- 27938Gatesville1,790
- 27939Grandy2,206
- 27941Southern Shores641
- 27942Harrellsville766
- 27943Hatteras152
- 27944Hertford11,358
- 27946Sunbury1,008
- 27947Grandy1,028
- 27948Kill Devil Hills12,436
- 27949Southern Shores8,251
- 279501,796
- 27953Manns Harbor999
- 27954Manteo7,237
- 27956Coinjock117
- 27957Edenton1,012
- 27958Moyock14,408
- 27959Manteo3,170
- 27960Ocracoke723
- 27962Plymouth7,043
- 27964Southern Shores554
- 27965Coinjock648
- 27966Southern Shores1,540
- 27967Powellsville618
- 27968Rodanthe781
- 27969Gatesville111
- 27970Roper2,439
- 27972Salvo229
- 27973Coinjock1,117
- 27974Grandy858
- 27976South Mills4,309
- 27978237
- 27979Sunbury1,161
- 27980Arrowhead Beach1,647
- 27981Wanchese1,969
- 27982Waves144
- 27983Windsor8,007
- 27985Winfall317
- 27986Winton1,283
- 28001Albemarle26,424
- 28006Alexis1,518
- 28007Ansonville879
- 28009Badin1,456
- 28012Belmont26,556
- 28016Bessemer City13,109
- 28017Boiling Springs663
- 280185,034
- 28020Casar2,240
- 28021Dellview13,865
- 28023Landis15,495
- 28024Cliffside31
- 28025Mount Pleasant58,334
- 28027Concord81,772
- 28031Cornelius31,733
- 28032Cramerton2,869
- 28033Crouse3,481
- 28034Dallas18,979
- 28036Davidson22,963
- 28037Westport28,768
- 28039East Spencer39
- 28040Ellenboro6,961
- 28041Faith3
- 28042Fallston299
- 28043Forest City20,930
- 28052Gastonia36,272
- 28054Gastonia41,707
- 28056Gastonia36,200
- 28071Gold Hill4,219
- 28072Granite Quarry672
- 28073Grover5,890
- 28074Henrietta15
- 28075Harrisburg21,517
- 28076Cliffside105
- 28077High Shoals258
- 28078Huntersville71,657
- 28079Hemby Bridge43,035
- 28080Iron Station7,606
- 28081Enochville29,075
- 28083Kannapolis28,095
- 28086Kings Mountain29,460
- 28088Landis3,054
- 28089Lattimore167
- 28090Belwood7,268
- 28091Lilesville2,285
- 28092Lincolnton40,350
- 28097Locust8,303
- 28098Lowell3,851
- 28101McAdenville898
- 28102McFarlan164
- 28103Marshville10,714
- 28104Indian Trail36,641
- 28105Matthews46,817
- 28107Midland10,244
- 28108Mineral Springs34
- 28109Misenheimer664
- 28110Unionville56,971
- 28112Monroe28,461
- 28114Cliffside7,104
- 28115Mooresville43,544
- 28117Mooresville48,826
- 28119Morven2,182
- 28120Mount Holly25,805
- 28124Mount Pleasant7,010
- 28125Cleveland2,765
- 28127New London8,506
- 28128Norwood6,587
- 28129Oakboro5,852
- 281332,060
- 28134Pineville13,245
- 28135Polkton4,655
- 28136Polkville66
- 28137Richfield2,664
- 28138Rockwell10,271
- 28139Rutherfordton20,008
- 28144Spencer27,977
- 28146Granite Quarry31,292
- 28147Salisbury25,812
- 28150Kingstown28,142
- 28152Boiling Springs26,134
- 28159Spencer3,250
- 28160Spindale3,665
- 28163Stanfield6,491
- 28164Lowesville16,874
- 28166Troutman11,875
- 28167Glenwood2,253
- 28168Belwood10,484
- 28169Waco108
- 28170Wadesboro10,103
- 28173Waxhaw65,274
- 28174Wingate9,573
- 28202Charlotte17,653
- 28203Charlotte18,823
- 28204Charlotte9,314
- 28205Charlotte51,806
- 28206Charlotte15,375
- 28207Charlotte9,527
- 28208Charlotte40,197
- 28209Charlotte24,331
- 28210Charlotte47,359
- 28211Charlotte33,925
- 28212Charlotte42,440
- 28213Charlotte45,904
- 28214Charlotte43,837
- 28215Charlotte66,674
- 28216Mount Holly57,507
- 28217Charlotte32,064
- 28223Charlotte4,953
- 28226Charlotte39,381
- 28227Mint Hill60,482
- 28262Charlotte50,003
- 28269Charlotte79,586
- 28270Charlotte32,448
- 28273Charlotte50,966
- 28274Charlotte747
- 28277Charlotte73,882
- 28278Belmont37,420
- 28301Fayetteville16,798
- 28303Fayetteville30,965
- 28304Fayetteville37,140
- 28305Fayetteville5,710
- 28306Hope Mills43,042
- 28307Fayetteville14,263
- 28308Spring Lake323
- 28310Fayetteville9,583
- 28311Spring Lake36,629
- 28312Stedman19,793
- 28314Fayetteville55,834
- 28315Pinebluff14,084
- 28318Autryville3,644
- 28320Bladenboro7,962
- 28323Bunnlevel4,758
- 28325Calypso384
- 28326Spout Springs26,068
- 28327Carthage19,386
- 28328Clinton26,927
- 28330Cordova313
- 28331Falcon123
- 28332Dublin645
- 28333Brogden10,534
- 28334Plain View22,873
- 28337Elizabethtown8,357
- 28338Ellerbe3,265
- 28339Bunnlevel6,894
- 28340Fairmont9,265
- 28341Faison2,886
- 28342Falcon145
- 28343Gibson1,574
- 28344Falcon4,806
- 28345Hamlet12,372
- 28347Hoffman2,212
- 28348Hope Mills39,196
- 28349Kenansville3,775
- 28350Vass197
- 28351Old Hundred4,535
- 28352Laurinburg23,837
- 28356Linden6,579
- 28357Lumber Bridge2,852
- 28358Lumberton33,071
- 28359Lumberton877
- 28360Lumberton12,550
- 28362Marietta35
- 28363Deercroft962
- 28364Maxton12,819
- 28365Mount Olive15,999
- 28366Newton Grove3,769
- 28367Norman89
- 28368Barbecue50
- 28369Orrum1,878
- 28371Parkton7,055
- 28372Pembroke12,483
- 28373Pinebluff2,589
- 28374Pinehurst19,782
- 28375Proctorville182
- 28376Silver City44,880
- 28377Red Springs11,590
- 28379Rockingham23,417
- 28382Roseboro6,961
- 28383Elrod6,825
- 28384St. Pauls11,379
- 28385Salemburg2,575
- 28386Shannon5,451
- 28387Southern Pines16,059
- 28390Anderson Creek24,000
- 28391Stedman5,963
- 28392Tar Heel1,758
- 28393Turkey1,707
- 28394Vass5,936
- 28395Wade2,688
- 28396Deercroft2,666
- 28398Warsaw6,417
- 28399White Oak1,819
- 28401Hightsville22,007
- 28403Wilmington40,319
- 28405Kings Grant35,467
- 28409Myrtle Grove36,163
- 28411Porters Neck37,233
- 28412Wilmington44,166
- 28420Shallotte2,658
- 28421Atkinson2,010
- 28422Bolivia10,059
- 28423Bolton2,388
- 28424Brunswick90
- 28425Burgaw11,380
- 28428Carolina Beach7,136
- 28429Skippers Corner9,662
- 28430Cerro Gordo1,573
- 28431Chadbourn5,901
- 28432Tabor City1,656
- 28433Clarkton4,313
- 28434Kelly710
- 28435Long Creek1,889
- 28436Delco1,922
- 28438Evergreen1,582
- 28439Fair Bluff1,190
- 28441Garland2,532
- 28442Hallsboro1,810
- 28443Surf City28,416
- 28444Harrells2,479
- 28445Holly Ridge10,797
- 28447Ivanhoe1,507
- 28448Kelly767
- 28449Kure Beach2,131
- 28450Lake Waccamaw2,337
- 28451Sandy Creek46,933
- 28452Carolina Shores1,152
- 28453Magnolia3,206
- 284542,895
- 284551,644
- 28456Sandyfield3,860
- 28457Rocky Point11,464
- 28458Rose Hill5,446
- 28460Sneads Ferry13,532
- 28461Southport23,762
- 28462Shallotte12,340
- 28463Tabor City7,522
- 28464Teachey2,185
- 28465Oak Island8,756
- 28466Wallace8,893
- 28467Carolina Shores13,313
- 28468Sunset Beach5,154
- 28469Ocean Isle Beach10,404
- 28470Shallotte11,219
- 28472Brunswick16,780
- 28478Watha5,017
- 28479Boiling Spring Lakes6,581
- 28480Wrightsville Beach2,776
- 28501Kinston17,642
- 28504Jackson Heights20,407
- 28508Pink Hill1,813
- 28509Alliance17
- 28510Minnesott Beach1,718
- 28511Atlantic610
- 28512Pine Knoll Shores3,358
- 28513Ayden10,573
- 28515Vandemere2,822
- 2851611,289
- 28518Beulaville7,651
- 28519Bridgeton392
- 28520101
- 28521Chinquapin1,593
- 28523Cove City2,753
- 28524Davis261
- 28525Deep Run3,613
- 28526Dover1,842
- 28527Vanceboro1,588
- 28528Gloucester407
- 28529Grantsboro1,804
- 28530Grifton6,484
- 28531Harkers Island1,060
- 28532Havelock20,908
- 28533Havelock2,452
- 28537Hobucken5
- 28538Hookerton1,989
- 28539Swansboro18,351
- 28540Jacksonville49,141
- 28542Jacksonville3,508
- 28543Jacksonville6,069
- 28544Piney Green4,386
- 28546Pumpkin Center47,256
- 28547Jacksonville21,346
- 28551La Grange14,078
- 28552Hobucken201
- 28553Marshallberg413
- 28554Maury54
- 28555Maysville5,914
- 28556Vandemere752
- 28557Morehead City15,253
- 28560Bridgeton28,661
- 28562Trent Woods39,082
- 28570Newport22,197
- 28571Oriental2,678
- 28572Pink Hill6,658
- 28573Pollocksville1,874
- 28574Richlands20,990
- 28575Indian Beach169
- 28577Atlantic318
- 28578Seven Springs4,219
- 28579Davis331
- 28580Snow Hill11,644
- 28581Davis118
- 28582Swansboro1,658
- 28584Peletier14,939
- 28585Trenton3,893
- 28586Vanceboro7,992
- 28587Vandemere209
- 28589Davis32
- 28590Winterville27,471
- 28594Bogue3,934
- 28601Hickory53,329
- 28602Mountain View31,113
- 28604Banner Elk7,869
- 28605Blowing Rock3,883
- 28606Moravian Falls2,187
- 28607Boone35,679
- 28609Catawba6,615
- 28610Claremont10,192
- 28611Linville424
- 28612Icard11,290
- 28613Conover23,357
- 28615Lansing1,878
- 28616Crossnore115
- 28617Jefferson1,839
- 28618Boone2,208
- 28619Drexel487
- 28621Elkin9,403
- 28622Elk Park2,565
- 28623Lowgap1,814
- 286241,438
- 28625Statesville39,574
- 28626West Jefferson3,173
- 28627Sparta1,193
- 28628Glen Alpine60
- 28629West Jefferson72
- 28630Granite Falls19,382
- 28631Lansing684
- 28634Harmony5,353
- 28635Hays2,669
- 28636Hiddenite4,496
- 28637Hildebran1,911
- 28638Hudson12,363
- 28640Jefferson4,820
- 28641Crossnore59
- 28642Jonesville5,602
- 28643Lansing3,615
- 286441,433
- 28645Lenoir45,997
- 28646Linville382
- 28649Mulberry1,355
- 28650Maiden12,746
- 286515,578
- 28652Newland132
- 28653Linville26
- 28654Moravian Falls3,168
- 28655Glen Alpine55,100
- 28657Crossnore8,188
- 28658Newton26,336
- 28659Mulberry21,422
- 28660Harmony2,501
- 28663802
- 28664Crossnore55
- 28665Millers Creek2,483
- 28666Icard273
- 28667Rhodhiss301
- 28668Lowgap40
- 28669Ronda2,935
- 28670Ronda2,124
- 28671Rutherford College375
- 28672Jefferson136
- 28673Lake Norman of Catawba6,874
- 28675Sparta6,745
- 28676Elkin3,100
- 28677Troutman38,819
- 28678Stony Point5,064
- 28679Cove Creek2,454
- 28681Taylorsville25,566
- 28682Lake Norman of Catawba1,701
- 286831,614
- 28684West Jefferson1,961
- 28685Hays2,181
- 28689Love Valley2,188
- 28690Valdese9,196
- 28692Cove Creek4,367
- 28693Lansing1,071
- 28694West Jefferson7,626
- 28697Wilkesboro13,412
- 28698Cove Creek2,320
- 28701Weaverville5,786
- 28702588
- 28704Avery Creek24,138
- 28705Bakersville6,732
- 28707Waynesville461
- 28708Brevard456
- 28709Barnardsville2,260
- 28710Chimney Rock Village78
- 28711Black Mountain12,663
- 28712Rosman19,977
- 28713Bryson City8,425
- 28714Burnsville16,397
- 28715Bent Creek30,328
- 28716Canton16,863
- 28717Cashiers1,265
- 28718Brevard654
- 28719Bryson City6,786
- 28720Chimney Rock Village138
- 28721Clyde10,698
- 28722Columbus6,086
- 28723Cullowhee12,756
- 28725Dillsboro90
- 28726East Flat Rock4,363
- 28729Etowah3,681
- 28730Fairview CDP7,605
- 28731Dana8,672
- 28732Hoopers Creek19,279
- 28733Lake Santeetlah63
- 28734Franklin29,659
- 28735Gerton124
- 28736Glenville1,000
- 28739Valley Hill20,843
- 28740Burnsville2,158
- 28741Highlands4,257
- 28742Mills River2,710
- 28743Hot Springs2,211
- 28745Lake Junaluska670
- 28746Lake Lure2,744
- 28747Rosman2,021
- 28748Canton12,230
- 28751Maggie Valley4,159
- 28752Marion30,292
- 28753Marshall10,389
- 28754Mars Hill9,682
- 28756Lake Lure4,706
- 28757Montreat630
- 28758Mountain Home41
- 28759Mills River7,555
- 28761Nebo8,150
- 28762Old Fort6,599
- 287632,688
- 28766Etowah1,259
- 28768Brevard6,759
- 28771Lake Santeetlah7,567
- 28772Rosman1,375
- 28773Saluda3,441
- 28774Cashiers1,451
- 28775Highlands674
- 28777Spruce Pine10,178
- 28778Swannanoa13,536
- 28779Webster18,064
- 28781881
- 28782Columbus6,519
- 28783Glenville1,785
- 287858,311
- 28786Waynesville22,056
- 28787Weaverville22,809
- 28788Webster198
- 28789Dillsboro5,788
- 28790Flat Rock village3,241
- 28791Mountain Home15,108
- 28792Edneyville36,645
- 28801Asheville14,691
- 28803Asheville33,718
- 28804Asheville25,776
- 28805Asheville19,993
- 28806Asheville43,433
- 28901Andrews5,552
- 28902Murphy986
- 28904Hayesville10,050
- 28905Marble3,056
- 28906Murphy20,526
- 28909Hayesville1,002
School districts
Each of the 118 with people in it, from ACS 2020–2024 5-year estimates.
- Alamance-Burlington Schools176,893
- Alexander County Schools36,412
- Alleghany County Schools11,174
- Anson County Schools22,289
- Ashe County Schools26,950
- Asheboro City Schools31,258
- Asheville City Schools43,043
- Avery County Schools17,680
- Beaufort County Schools44,499
- Bertie County Schools17,170
- Bladen County Schools29,566
- Brunswick County Schools152,568
- Buncombe County Schools231,317
- Burke County Schools87,795
- Cabarrus County Schools211,639
- Caldwell County Schools80,536
- Camden County Schools10,927
- Camp Lejeune Schools34,332
- Carteret County Schools69,148
- Caswell County Schools22,404
- Catawba County Schools112,894
- Chapel Hill-Carrboro Schools91,059
- Charlotte-Mecklenburg Schools1.15M
- Chatham County Schools80,151
- Cherokee Central Schools6,703
- Cherokee County Schools29,562
- Clay County Schools11,610
- Cleveland County Schools100,991
- Clinton City Schools16,133
- Columbus County Schools37,544
- Craven County Schools102,612
- Cumberland County Schools314,050
- Currituck County Schools30,601
- Dare County Schools37,875
- Davidson County Schools137,114
- Davie County Schools44,122
- Duplin County Schools49,335
- Durham Public Schools332,353
- Edenton-Chowan Schools13,836
- Edgecombe County Schools39,154
- Elkin City Schools6,066
- Forsyth County Schools389,977
- Fort Bragg Schools24,495
- Franklin County Schools74,386
- Gaston County Schools234,881
- Gates County Schools10,376
- Graham County Schools8,072
- Granville County Schools60,877
- Greene County Schools20,486
- Guilford County Schools547,940
- Halifax County Schools26,692
- Harnett County Schools139,150
- Haywood County Schools62,662
- Henderson County Schools118,484
- Hertford County Schools19,908
- Hickory City Schools32,560
- Hoke County Schools53,835
- Hyde County Schools4,592
- Iredell-Statesville Schools160,678
- Jackson County Schools40,902
- Johnston County Schools234,263
- Jones County Schools9,302
- Kannapolis City Schools34,081
- Lee County Schools65,816
- Lenoir County Schools54,919
- Lexington City Schools21,201
- Lincoln County Schools92,716
- Macon County Schools37,941
- Madison County Schools21,867
- Martin County Schools21,644
- McDowell County Schools44,817
- Mitchell County Schools14,992
- Montgomery County Schools26,007
- Moore County Schools104,876
- Mooresville City Schools35,866
- Mount Airy City Schools10,441
- Nash-Rocky Mount Schools105,798
- New Hanover County Schools235,229
- Newton-Conover City Schools18,119
- Northampton County Schools16,931
- Onslow County Schools173,574
- Orange County Schools58,619
- Pamlico County Schools12,390
- Pasquotank County Schools40,834
- Pender County Schools65,550
- Perquimans County Schools13,244
- Person County Schools39,542
- Pitt County Schools177,193
- Polk County Schools19,891
- Randolph County Schools115,090
- Richmond County Schools42,344
- Roanoke Rapids City Schools14,554
- Robeson County Schools116,902
- Rockingham County Schools92,131
- Rowan-Salisbury Schools140,288
- Rutherford County Schools64,930
- Sampson County Schools43,337
- Scotland County Schools33,590
- Stanly County Schools64,651
- Stokes County Schools45,139
- Surry County Schools54,918
- Swain County Schools10,179
- Thomasville City Schools14,639
- Transylvania County Schools33,691
- Tyrrell County Schools3,423
- Union County Public Schools250,958
- Vance County Schools42,322
- Wake County Schools1.18M
- Warren County Schools18,795
- Washington County Schools10,812
- Watauga County Schools55,123
- Wayne County Public Schools118,652
- Weldon City Schools6,429
- Whiteville City Schools12,596
- Wilkes County Schools65,935
- Wilson County Schools79,290
- Yadkin County Schools37,574
- Yancey County Schools18,797
Congressional districts
As drawn for the 119th Congress (2025–2027).
- Congressional District 1747,584
- Congressional District 2766,292
- Congressional District 3760,895
- Congressional District 4769,729
- Congressional District 5751,008
- Congressional District 6769,663
- Congressional District 7778,792
- Congressional District 8765,329
- Congressional District 9765,958
- Congressional District 10766,029
- Congressional District 11758,211
- Congressional District 12770,963
- Congressional District 13792,542
- Congressional District 14767,409
State senate districts
The upper chamber’s districts, as drawn in 2024.
- State Senate District 1201,289
- State Senate District 2198,892
- State Senate District 3202,030
- State Senate District 4218,428
- State Senate District 5225,929
- State Senate District 6207,906
- State Senate District 7206,076
- State Senate District 8231,861
- State Senate District 9209,859
- State Senate District 10234,263
- State Senate District 11212,924
- State Senate District 12208,330
- State Senate District 13214,004
- State Senate District 14211,772
- State Senate District 15202,721
- State Senate District 16195,610
- State Senate District 17205,104
- State Senate District 18210,319
- State Senate District 19218,110
- State Senate District 20211,380
- State Senate District 21225,311
- State Senate District 22201,124
- State Senate District 23211,624
- State Senate District 24204,327
- State Senate District 25222,855
- State Senate District 26215,027
- State Senate District 27212,982
- State Senate District 28212,062
- State Senate District 29222,478
- State Senate District 30217,076
- State Senate District 31224,376
- State Senate District 32210,740
- State Senate District 33214,526
- State Senate District 34224,286
- State Senate District 35231,353
- State Senate District 36211,346
- State Senate District 37230,280
- State Senate District 38223,741
- State Senate District 39236,469
- State Senate District 40226,850
- State Senate District 41224,715
- State Senate District 42209,170
- State Senate District 43218,332
- State Senate District 44210,256
- State Senate District 45222,447
- State Senate District 46198,883
- State Senate District 47207,317
- State Senate District 48203,305
- State Senate District 49208,089
- State Senate District 50222,250
State house districts
The lower chamber’s districts, as drawn in 2024.
- State House District 186,078
- State House District 289,100
- State House District 385,794
- State House District 483,323
- State House District 582,045
- State House District 692,794
- State House District 789,390
- State House District 889,255
- State House District 987,938
- State House District 1084,664
- State House District 1184,859
- State House District 1284,707
- State House District 1385,966
- State House District 1488,540
- State House District 1591,834
- State House District 1693,082
- State House District 17102,889
- State House District 1894,798
- State House District 1995,103
- State House District 2095,007
- State House District 2194,832
- State House District 2289,036
- State House District 2387,550
- State House District 2484,251
- State House District 2591,255
- State House District 2696,531
- State House District 2783,401
- State House District 2895,213
- State House District 2994,576
- State House District 3094,376
- State House District 3193,843
- State House District 3288,195
- State House District 3392,225
- State House District 3491,711
- State House District 3588,212
- State House District 3683,910
- State House District 37101,161
- State House District 3887,516
- State House District 3992,779
- State House District 4087,815
- State House District 4194,260
- State House District 4285,824
- State House District 4388,154
- State House District 4481,910
- State House District 4582,657
- State House District 4683,271
- State House District 4783,771
- State House District 4887,425
- State House District 4984,653
- State House District 5086,808
- State House District 5186,421
- State House District 5286,673
- State House District 5388,875
- State House District 5487,043
- State House District 5586,268
- State House District 5685,274
- State House District 5791,856
- State House District 5889,464
- State House District 5993,332
- State House District 6092,572
- State House District 6191,515
- State House District 6289,201
- State House District 6386,451
- State House District 6490,442
- State House District 6592,131
- State House District 6694,720
- State House District 6790,658
- State House District 6893,109
- State House District 6993,870
- State House District 7088,696
- State House District 7187,650
- State House District 7283,647
- State House District 7393,991
- State House District 7486,878
- State House District 7591,271
- State House District 7693,296
- State House District 7792,443
- State House District 7890,702
- State House District 7985,194
- State House District 8087,371
- State House District 8185,583
- State House District 8295,000
- State House District 8392,974
- State House District 8492,077
- State House District 8591,522
- State House District 8687,795
- State House District 8785,401
- State House District 8888,161
- State House District 8988,652
- State House District 9087,712
- State House District 9185,670
- State House District 92101,279
- State House District 9388,382
- State House District 9486,060
- State House District 9589,031
- State House District 9690,357
- State House District 9792,716
- State House District 9885,351
- State House District 9985,299
- State House District 10088,870
- State House District 10187,474
- State House District 10288,873
- State House District 10390,299
- State House District 10483,722
- State House District 10584,627
- State House District 10686,761
- State House District 10789,080
- State House District 10893,120
- State House District 10991,323
- State House District 11089,129
- State House District 11186,453
- State House District 11294,885
- State House District 11391,984
- State House District 11487,063
- State House District 11599,061
- State House District 11688,236
- State House District 11791,932
- State House District 11884,529
- State House District 11991,475
- State House District 12087,185
PUMAs
Public Use Microdata Areas: areas of 100,000 people or more that the state draws from census tracts, for the Census Bureau’s microdata.
- Alamance County–Burlington City PUMA176,893
- Boone High Country–Watauga, Ashe, Yancey, Avery & Mitchell Counties PUMA133,542
- Brunswick County PUMA152,568
- Buncombe County (Northwest) PUMA139,781
- Buncombe County (Southeast)–Asheville City PUMA134,627
- Burke & McDowell Counties PUMA132,612
- Cabarrus County (West)–Concord, Kannapolis Cities & Harrisburg Town PUMA174,507
- Caldwell & Alexander Counties PUMA116,948
- Catawba County–Hickory City PUMA163,573
- Charlotte City (Central) PUMA133,339
- Charlotte City (Northeast) PUMA123,272
- Charlotte City (Northwest) PUMA128,725
- Charlotte City (South) PUMA155,992
- Charlotte City (Southwest) PUMA129,779
- Chatham & Lee Counties PUMA145,967
- Columbus, Bladen & Robeson Counties PUMA196,608
- Craven & Carteret Counties PUMA171,760
- Cumberland County (Central)–Fayetteville City (Central & East) PUMA108,895
- Cumberland County (East)–Hope Mills & Spring Lake Towns PUMA119,701
- Cumberland County (West)–Fayetteville City (West) PUMA109,949
- Davidson County PUMA173,166
- Davie, Yadkin & Iredell (North) Counties PUMA107,941
- Durham County (North)–Durham City (North) PUMA148,174
- Durham County (South)–Durham City (South) PUMA184,179
- Forsyth County (Outside Winston-Salem City)–Kernersville Town & Clemmons Village PUMA147,512
- Franklin & Vance Counties PUMA116,708
- Gaston County (Northwest)–Mount Holly City PUMA111,761
- Gaston County (Southeast)–Gastonia & Belmont Cities PUMA123,120
- Granville, Person & Caswell Counties PUMA122,823
- Greensboro City (North) PUMA138,207
- Greensboro City (South) PUMA122,593
- Guilford County (North)–Summerfield Town PUMA143,073
- Guilford County (South)–High Point City PUMA144,067
- Halifax, Hertford, Northampton & Warren Counties PUMA103,309
- Harnett County PUMA139,150
- Haywood, Madison, Swain, Graham & Jackson (North) Counties PUMA106,614
- Henderson & Transylvania Counties PUMA152,127
- Hoke, Richmond & Scotland Counties PUMA129,769
- Iredell (South)–Mooresville Town & Statesville City PUMA170,299
- Jackson (South), Macon, Cherokee & Clay Counties PUMA122,884
- Johnston County (West) PUMA177,152
- Lenoir, Onslow (North) & Jones Counties PUMA113,588
- Lincoln & Cleveland (East) Counties PUMA142,662
- Mecklenburg County (East)–Mint Hill & Matthews (North) Towns PUMA146,091
- Mecklenburg County (North)–Huntersville, Cornelius & Davidson Towns PUMA182,444
- Mecklenburg County (South)–Matthews Town (South) PUMA155,039
- Moore & Montgomery Counties PUMA130,883
- Nash & Edgecombe Counties–Rocky Mount City PUMA144,952
- New Hanover County (South)–Wilmington City PUMA173,412
- Northeast Albemarle Sound Region PUMA119,818
- Onslow County (South)–Jacksonville City PUMA158,539
- Orange County–Chapel Hill Town PUMA149,678
- Pender & New Hanover (North) Counties PUMA127,367
- Pitt County–Greenville City PUMA177,193
- Raleigh City (North) PUMA142,375
- Raleigh City (South & Central) PUMA152,107
- Randolph County PUMA146,348
- Rockingham & Stokes Counties PUMA137,270
- Rowan County PUMA149,875
- Rutherford, Cleveland (West) & Polk Counties–Shelby City PUMA135,866
- Sampson & Duplin Counties PUMA108,805
- South & West Albemarle Sound & Outer Banks Regions PUMA152,405
- Stanly & Cabarrus (East) Counties PUMA126,277
- Union (East) & Anson Counties–Monroe City PUMA120,124
- Union County (West)–Indian Trail & Stallings Towns PUMA153,123
- Wake County (East)–Raleigh City (East), Knightdale & Garner (North) Towns PUMA152,052
- Wake County (Northeast)–Raleigh City (Northeast), Wake Forest & Rolesville Towns PUMA146,103
- Wake County (Northwest)–Raleigh City (Northwest) & Morrisville Town PUMA141,971
- Wake County (Southeast)–Garner (South) & Fuquay-Varina Towns PUMA140,403
- Wake County (Southwest)–Apex & Holly Springs Towns PUMA166,611
- Wake County (West Central)–Cary Town PUMA137,031
- Wayne County PUMA118,652
- Wilkesboro High Country–Surry, Wilkes & Alleghany Counties PUMA148,534
- Wilson, Greene & Johnston (East) Counties–Wilson City PUMA156,887
- Winston-Salem City (North) PUMA110,333
- Winston-Salem City (South) PUMA131,920
Urban areas
Each that reaches into North Carolina, with its whole population. Urban areas are the densely settled land the Census Bureau draws after each census, whatever the city lines.
- Ahoskie, NC4,723
- Albemarle, NC16,888
- Asheboro, NC37,742
- Asheville, NC296,024
- Blowing Rock, NC1,002
- Boone, NC27,143
- Brevard, NC13,246
- Buies Creek–Lillington, NC7,533
- Burlington, NC151,034
- Canton, NC9,823
- Charlotte, NC–SC1.43M
- Cherryville, NC6,529
- Clayton, NC58,050
- Clinton, NC9,727
- Concord, NC292,734
- Creedmoor, NC7,290
- Cullowhee, NC9,973
- Danville, VA–NC46,495
- Dunn, NC14,044
- Durham, NC403,119
- Eden, NC16,424
- Edenton, NC4,469
- Elizabeth City, NC25,327
- Farmville, NC4,514
- Fayetteville, NC326,916
- Forest City–Spindale, NC19,799
- Franklin, NC9,292
- Gastonia, NC180,621
- Goldsboro, NC54,159
- Governors Club, NC4,919
- Greensboro, NC341,628
- Greenville, NC127,239
- Hampstead, NC25,142
- Havelock, NC18,260
- Henderson, NC20,001
- Hickory, NC204,431
- High Point, NC169,250
- Hillsborough, NC15,977
- Holden Beach, NC8,816
- Jacksonville, NC112,415
- Kill Devil Hills–Nags Head, NC23,747
- Kings Mountain, NC13,675
- Kinston, NC20,756
- Lake Royale, NC2,490
- Landrum–Tryon, SC–NC4,924
- Laurinburg, NC15,972
- Lincolnton, NC24,725
- Lumberton, NC22,768
- Manteo, NC6,870
- Marion, NC11,230
- Mayodan, NC4,746
- Mocksville, NC5,982
- Morehead City–Emerald Isle–Atlantic Beach, NC45,814
- Mount Airy, NC16,222
- Myrtle Beach–North Myrtle Beach, SC–NC324,794
- New Bern, NC46,478
- Oak Island, NC17,306
- Oxford, NC9,152
- Pembroke, NC4,926
- Pinehurst–Southern Pines, NC51,983
- Raleigh, NC1.15M
- Reidsville, NC14,740
- Roanoke Rapids, NC23,587
- Rockingham, NC22,129
- Rocky Mount, NC63,163
- Roxboro, NC10,015
- Sanford, NC38,752
- Shelby, NC26,382
- Siler City, NC8,823
- Smithfield, NC24,022
- Spout Springs, NC18,342
- St. James, NC7,670
- Statesville, NC43,885
- Swansboro–Cedar Point, NC22,103
- Sylva, NC5,048
- Tarboro, NC12,403
- Wadesboro, NC4,886
- Washington, NC14,818
- Waynesville, NC24,396
- Wendell, NC10,734
- Whiteville, NC5,154
- Wilkesboro–North Wilkesboro, NC19,844
- Williamston, NC5,533
- Wilmington, NC270,286
- Wilson, NC49,286
- Winston-Salem, NC428,093
- Zebulon, NC9,165
Tribal areas
Each that reaches into North Carolina, with its whole population.
- Coharie SDTSA, NC62,204
- Eastern Cherokee Reservation and Off-Reservation Trust Land, NC7,707
- Haliwa-Saponi SDTSA, NC7,669
- Lumbee SDTSA, NC514,268
- Meherrin SDTSA, NC6,978
- Occaneechi-Saponi SDTSA, NC9,575
- Sappony SDTSA, NC2,813
- Waccamaw Siouan SDTSA, NC1,609
Turn North Carolina into your planning report.
Social Explorer Studio builds an editable profile of any place, with tables and charts beside the county and state, and exports to Word, PDF and Excel.
Questions about North Carolina
What is the population of North Carolina?
11,197,968 people, according to the ACS 2025 1-year estimates, which the Census Bureau adjusts to match its own population estimate. That’s the 9th largest of the 50 states and DC.
What is the FIPS code for North Carolina?
37. Every county’s and place’s FIPS code in North Carolina starts with it. The Census Bureau’s full geographic identifier (GEOID) is 0400000US37.
What is the largest city in North Carolina?
Charlotte, with 964,769 people. Other large places here include Raleigh, Greensboro and Durham.
What is the median household income in North Carolina?
$77,638 (±$876), according to the ACS 2025 1-year estimates, lower than the US ($84,780).
What is the median age in North Carolina?
39.6 years (±0.2), according to the ACS 2025 1-year estimates, about the same as the US (39.5).
How much does housing cost in North Carolina?
North Carolina’s median home value is $342,800 (±$2,737) and its median gross rent is $1,412 (±$15) a month, according to the ACS 2025 1-year estimates. 46.5% (±1.1%) of its renters pay 30% or more of their income on rent.
Is North Carolina growing?
North Carolina’s population grew 11.5%, from 10,042,802 in 2015 to 11,197,968 in 2025, according to the ACS 1-year estimates.
Where do people who work in North Carolina live?
4,539,540 of its 4,760,483 jobs are held by people who live here. Of those who commute in, the most come from South Carolina, Virginia, Georgia.
Where does this census data come from?
The U.S. Census Bureau’s American Community Survey, through Social Explorer’s tables: the latest 1-year estimates where they exist, for the most recent numbers, and 5-year estimates otherwise. Each table lists its code, so you can find it again.
Is this data free to use?
Yes. You can read it, cite it, download the CSV and embed the charts, with no account. To map other variables, compare your own areas or build a report, see Social Explorer’s plans in a live demo.
Sources and how to cite
American Community Survey 2025 1-year estimates, or 2020–2024 5-year estimates where noted, U.S. Census Bureau, from Social Explorer’s tables A00001, A00002, A01004, A04001, A06001, A08001, A09005, A10001, A10003, A10008, A10030, A10036, A10040, A10047, A10055, A10060, A12001, A13004, A14006, A14024, A14028, A16002, A17005, A18002, A18009, A20001, B02002, B09001, B13002, B18101, C16001. Maps by census tract use 2020–2024 5-year estimates, since the 1-year survey doesn’t cover tracts. Commuting: LEHD LODES 2023. These are estimates from a sample, each with its margin of error. Data retrieved November 14, 2026. How these profiles are made.
U.S. Census Bureau, American Community Survey 2025 1-year estimates, or 2020–2024 5-year estimates where noted, via Social Explorer. “North Carolina.” https://www.socialexplorer.com/places/north-carolina. Accessed November 14, 2026.