

Social equity analysis that shows where burdens fall
Social equity analysis shows how burdens and resources are shared across a community, so you can see who carries the most. In Social Explorer, put demographic, health and environmental data on one map, down to the tract and block group, to target interventions and back up your reporting.
How do you run a social equity analysis?
-
1
Map the population
Map income, race and ethnicity, age, language, disability and health insurance coverage by tract or block group.
-
2
Layer library
The layer library’s 198 reference layers include more than 80 for equity work, such as the Environmental Health Index, Wildfire Potential and Historic Places. Each layer shows its description, source and publication date.
-
3
Premium collections
Add the CDC Social Vulnerability Index and the Air Quality Index.
-
4
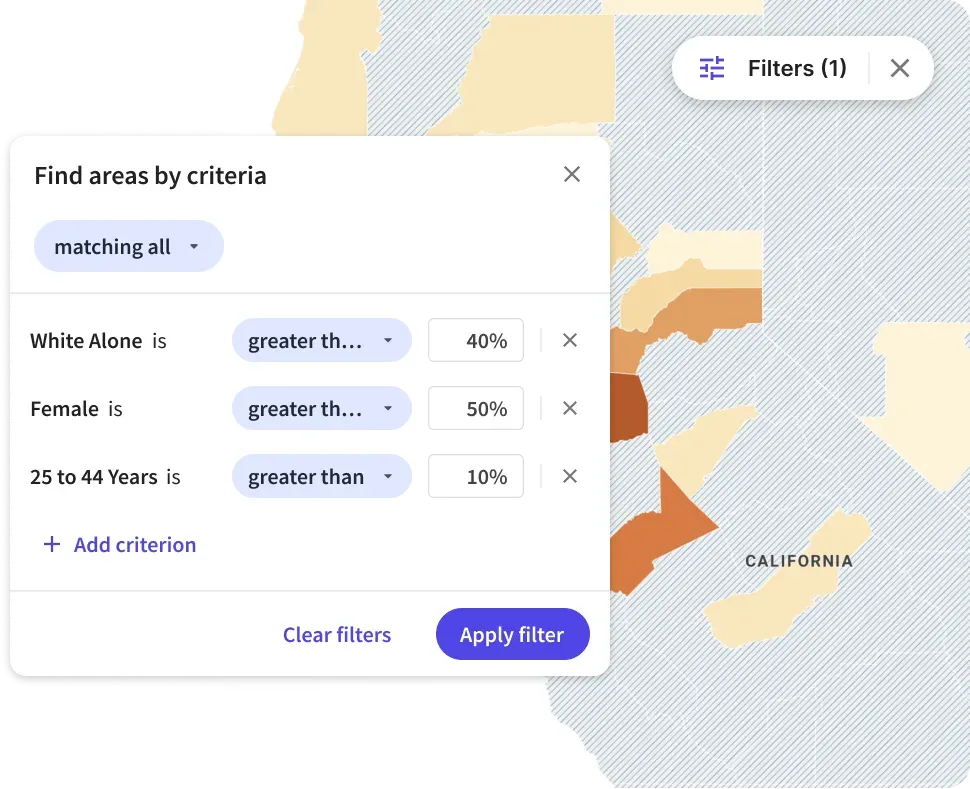
Filter areas by criteria
Find where burdens overlap, such as tracts with high social vulnerability and below-median income.
-
5
Create a mask
Keep the analysis to your jurisdiction.
-
6
Citations and stories
Export the supporting tables with citations, and publish what you found as a story anyone can open.
The data behind it
Part of a library of 610,000+ variables, each one with its source.
- CDC Social Vulnerability Index Premium collection
- Air Quality Index Premium collection
-
Environmental Health Index and Wildfire Potential Map layers
- County Health Rankings Health outcomes and factors by county
- American Community Survey, 5-year estimates Tract and block group detail
-
Change-over-time data From 1970 on, to show how burdens have shifted
Good to know
- Social Explorer overlays and filters data. It doesn’t calculate its own environmental justice scores or stand in for federal screening tools.
- The CDC Social Vulnerability Index and the Air Quality Index are premium collections, and every plan includes them, Pro too.
Tools for this work


Questions about social equity analysis
What is social equity analysis?
Social equity analysis compares how burdens and resources, such as poverty, pollution, poor health and access to services, fall on different groups and places, so a plan or program can direct help where it’s needed most. It usually maps demographic data beside health and environmental measures, at the census tract or block group level.
What is the Social Vulnerability Index?
The CDC Social Vulnerability Index ranks census tracts on 16 social factors from the census, such as poverty, lack of a vehicle and crowded housing, to show which communities may need the most support before, during and after a disaster. In Social Explorer it’s a premium collection, mapped beside the rest of the data.
What data can I use for an equity analysis in Social Explorer?
Social Explorer maps income, race and ethnicity, age, language, disability and health insurance from the American Community Survey down to block groups, with County Health Rankings for counties, map layers such as the Environmental Health Index and Wildfire Potential, and the CDC Social Vulnerability Index and Air Quality Index as premium collections.
Does Social Explorer calculate environmental justice scores?
No. Social Explorer overlays and filters published data, such as the CDC Social Vulnerability Index and environmental layers, so you can find where burdens overlap. It doesn’t calculate its own environmental justice scores or stand in for federal screening tools. Every layer shows its source and publication date, so you can cite it.
Other solutions
- Site selection Compare candidate areas on the demographics that drive your business.
- Market analysis Trade area analysis: size a market and track how it is changing.
- Community needs & grants Build citable evidence of need for a grant or program.
- Data storytelling Turn a question into an interactive map or story.
- Planning & policy Understand who lives where and how that is changing.
- Community change Show how a place has changed, with comparable data across decades.
- Census data Every census since 1790 and the latest American Community Survey, ready to map and analyze.
Try it on a place you know
In a live demo, we’ll show you how it fits your team or campus.