

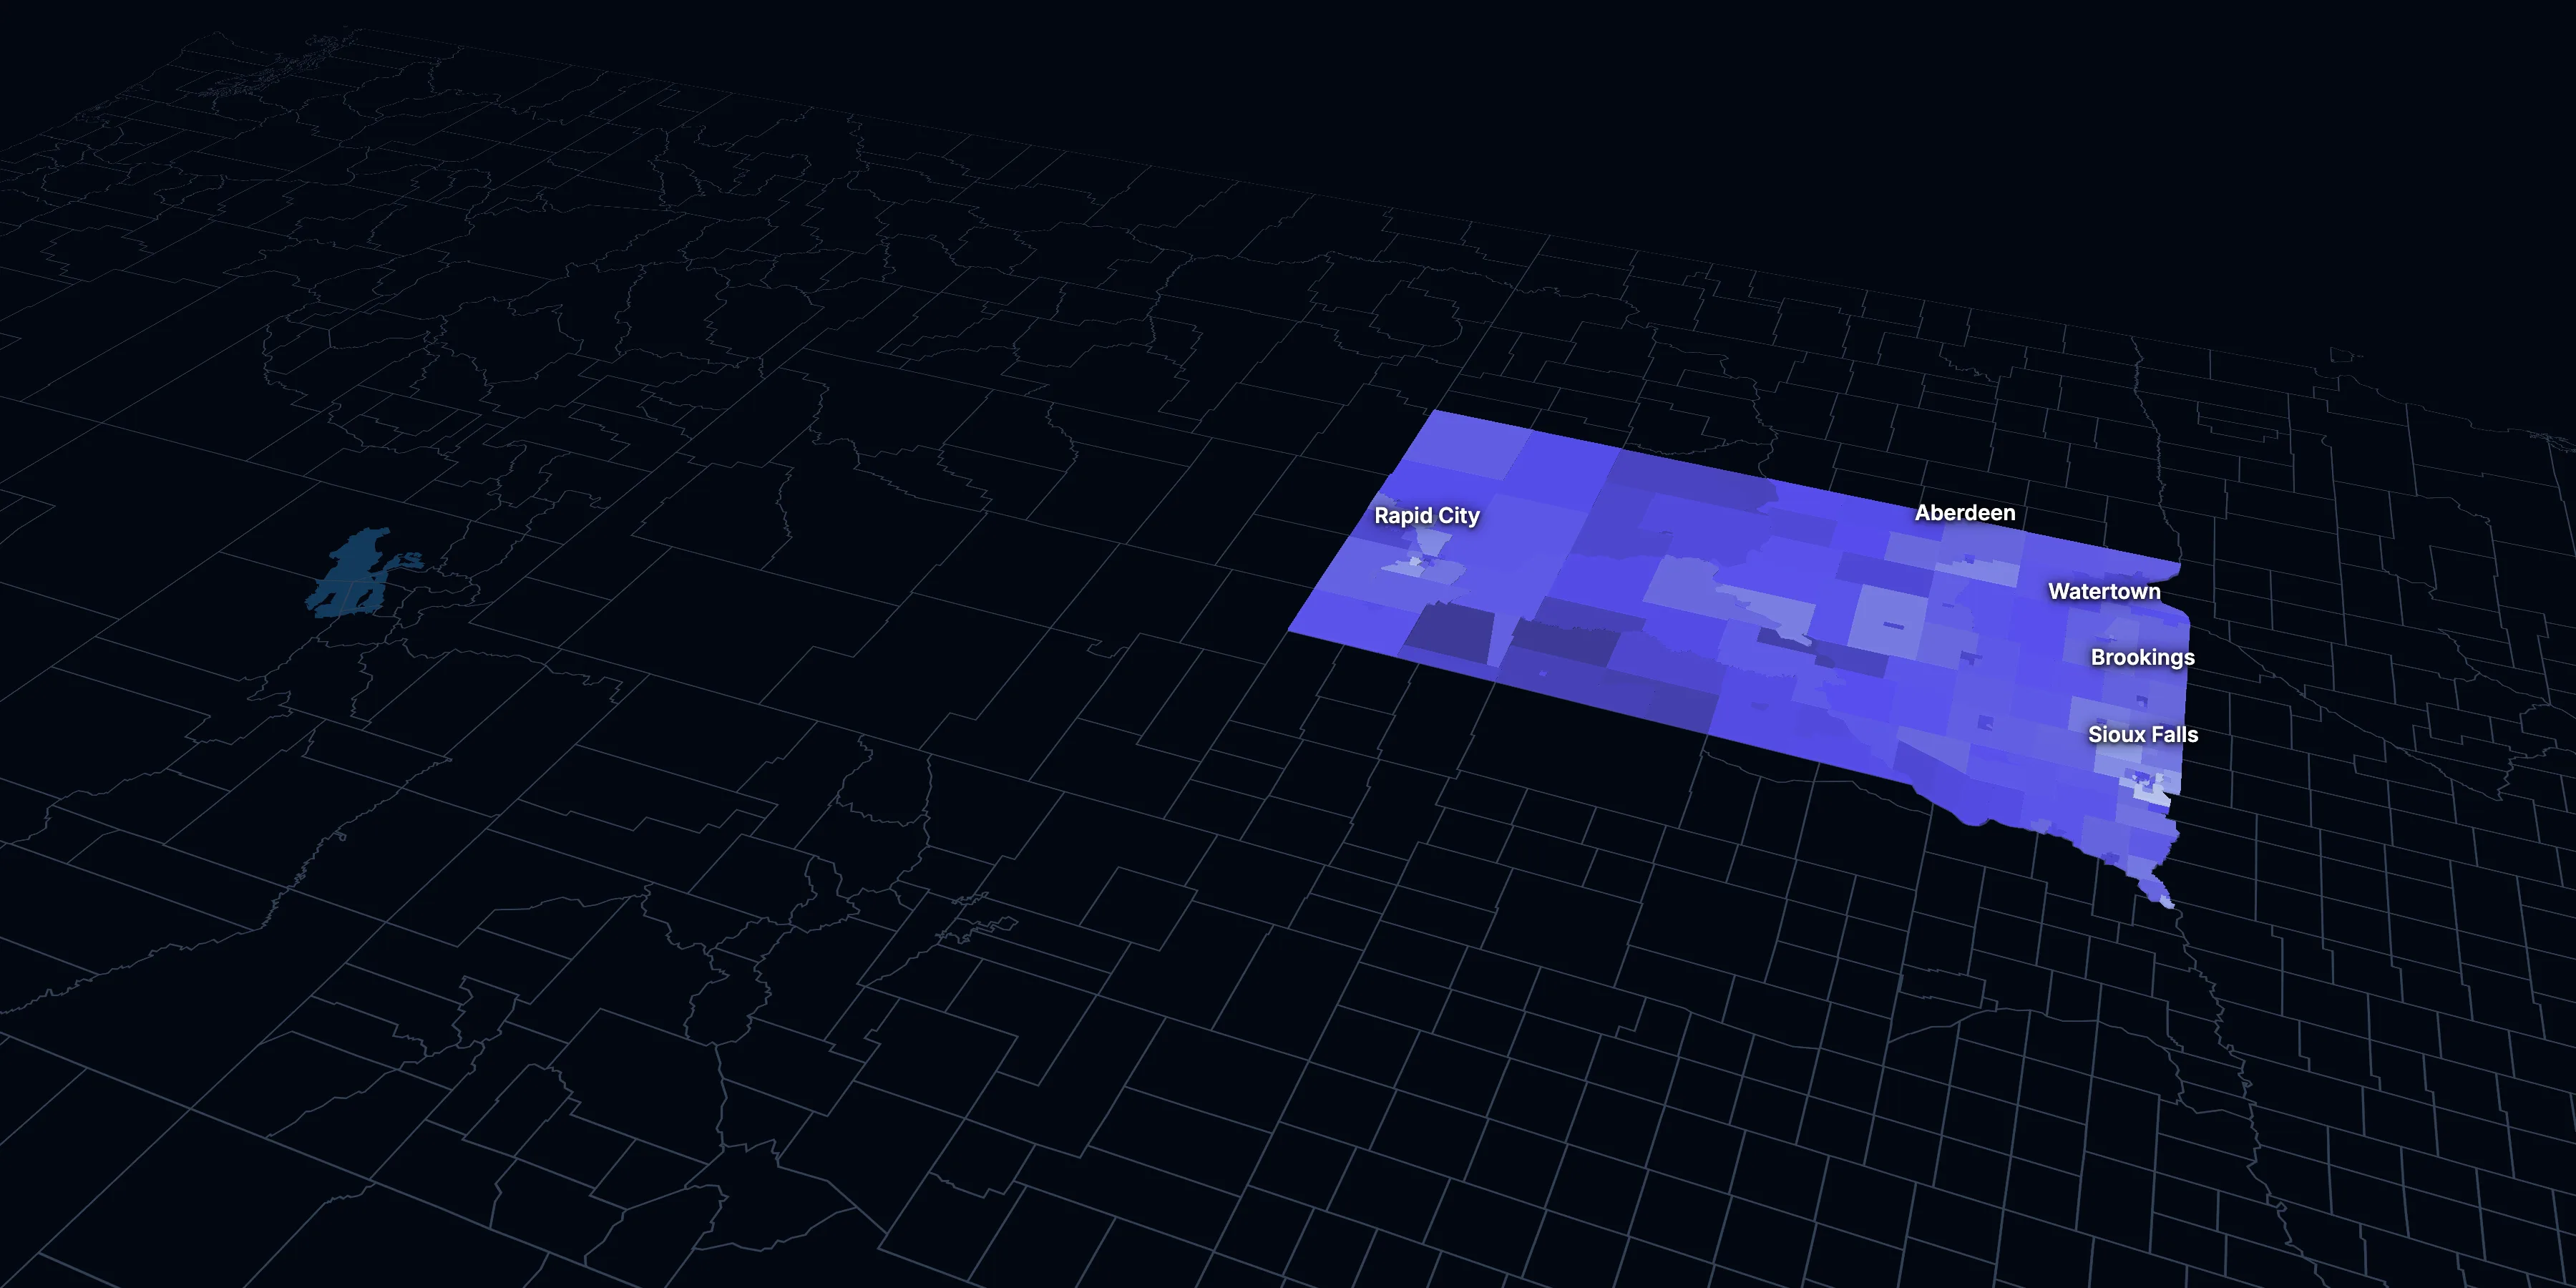
South Dakota: Population, demographics and census data
Home to 935,094 people, the 46th largest of the 50 states and DC, anchored by Sioux Falls and Rapid City. It grew 8.9% between 2015 and 2025.
- Population
- 935,094. Census Bureau estimate · Rank 46 of the 50 states and DC
- Median household income
- $80,506 ±$1,946. US $84,780
- Median age
- 38.5 ±0.4. US 39.5
ACS 2025 1-year estimates, U.S. Census Bureau
Taller, lighter tracts have higher household incomes
About South Dakota
South Dakota’s median household income is $80,506 (±$1,946), lower than the US ($84,780), and its median age is 38.5 (±0.4), according to the ACS 2025 1-year estimates. Its largest city is Sioux Falls.
± is each figure’s margin of error, at 90% confidence, and † marks one too uncertain to lean on. Under each percentage in the tables is the number it counts. How the margins are worked out.
FIPS code 46
Highlights
What stands out in South Dakota
The numbers where South Dakota sits furthest from the nation, or past a recognized policy benchmark.
Past a policy benchmark
+7 points
ElevatedRent growth ahead of income
After inflation, rent grew 18% from 2015 to 2025, and household income 11%. The dots show rent growth.
Furthest from the national picture
16.4%
2nd lowest among statesCommute 30 minutes or more
That’s lower than the US (39.2%). It’s the 2nd lowest of the 50 states and DC.
3.8%
Very lowBorn outside the US
That’s lower than the US (14.7%). It’s the 5th lowest of the 50 states and DC.
6.8%
Very lowSpeak a language other than English at home
That’s lower than the US (22.9%).
$1,089
2nd lowest among statesMedian gross rent
That’s lower than the US ($1,557). It’s the 2nd lowest of the 50 states and DC.
7.8%
Higher than the USVeterans (adults)
That’s higher than the US (5.9%).
2015 to 2025
How South Dakota changed in ten years
The state added 76,625 people. It got older, more foreign-born and better educated, and poverty fell 2.0 points.
Population, change since 2015
+8.9% in the state and +6.3% in the US.
Source: ACS 1-year, 2015 to 2025, table A00001.
Show data
| South Dakota | United States | |
|---|---|---|
| 2015 | 0.0% | 0.0% |
| 2016 | +0.8% | +0.5% |
| 2017 | +1.3% | +1.3% |
| 2018 | +2.8% | +1.8% |
| 2019 | +3.1% | +2.1% |
| 2021 | +4.3% | +3.3% |
| 2022 | +6.0% | +3.7% |
| 2023 | +7.1% | +4.2% |
| 2024 | +7.7% | +5.8% |
| 2025 | +8.9% | +6.3% |
Embed
Median household income, in 2025 dollars
+10.8% in the state and +10.9% in the US.
Source: ACS 1-year, 2015 to 2025, table A14006.
Show data
| South Dakota | United States | |
|---|---|---|
| 2015 | $72,634 | $76,413 |
| 2016 | $73,671 | $77,931 |
| 2017 | $74,839 | $79,891 |
| 2018 | $72,739 | $80,059 |
| 2019 | $75,582 | $83,427 |
| 2021 | $79,239 | $83,521 |
| 2022 | $77,242 | $82,811 |
| 2023 | $76,397 | $82,683 |
| 2024 | $79,458 | $84,339 |
| 2025 | $80,506 | $84,780 |
Embed
Living in poverty
−2.0 points in the state and −3.0 points in the US.
Source: ACS 1-year, 2015 to 2025, table A13004.
Show data
| South Dakota | United States | |
|---|---|---|
| 2015 | 13.7% | 14.7% |
| 2016 | 13.3% | 14.0% |
| 2017 | 13.0% | 13.4% |
| 2018 | 13.1% | 13.1% |
| 2019 | 11.9% | 12.3% |
| 2021 | 12.3% | 12.8% |
| 2022 | 12.5% | 12.6% |
| 2023 | 11.8% | 12.5% |
| 2024 | 10.4% | 12.1% |
| 2025 | 11.8% | 11.8% |
Embed
Bachelor’s degree or more
+5.5 points in the state and +6.7 points in the US.
Source: ACS 1-year, 2015 to 2025, table A12001.
Show data
| South Dakota | United States | |
|---|---|---|
| 2015 | 27.5% | 30.6% |
| 2016 | 28.9% | 31.3% |
| 2017 | 28.1% | 32.0% |
| 2018 | 29.2% | 32.6% |
| 2019 | 29.7% | 33.1% |
| 2021 | 31.7% | 35.0% |
| 2022 | 31.6% | 35.7% |
| 2023 | 33.3% | 36.2% |
| 2024 | 34.2% | 36.8% |
| 2025 | 33.0% | 37.4% |
Embed
Median gross rent, in 2025 dollars
+17.7% in the state and +18.5% in the US.
Source: ACS 1-year, 2015 to 2025, table A18009.
Show data
| South Dakota | United States | |
|---|---|---|
| 2015 | $925 | $1,314 |
| 2016 | $955 | $1,327 |
| 2017 | $956 | $1,340 |
| 2018 | $949 | $1,368 |
| 2019 | $976 | $1,393 |
| 2021 | $994 | $1,427 |
| 2022 | $959 | $1,440 |
| 2023 | $980 | $1,496 |
| 2024 | $1,032 | $1,537 |
| 2025 | $1,089 | $1,557 |
Embed
Median home value, in 2025 dollars
+42.9% in the state and +39.3% in the US.
Source: ACS 1-year, 2015 to 2025, table A10036.
Show data
| South Dakota | United States | |
|---|---|---|
| 2015 | $209,339 | $266,469 |
| 2016 | $217,359 | $277,278 |
| 2017 | $221,919 | $288,124 |
| 2018 | $221,679 | $296,908 |
| 2019 | $234,874 | $305,336 |
| 2021 | $263,439 | $337,116 |
| 2022 | $271,402 | $355,481 |
| 2023 | $285,332 | $361,931 |
| 2024 | $299,306 | $372,685 |
| 2025 | $299,100 | $371,100 |
Embed
ACS 1-year estimates. The dotted stretch of each line spans 2020, when the Census Bureau released no standard 1-year estimates. Dollar values are in 2025 dollars.
| Indicator | 2015 | 2025 | Change |
|---|---|---|---|
| Population | 858,469 | 935,094 | +8.9% |
| Median age | 36.9 | 38.5 | +1.6 years |
| 65 and over | 15.7% | 19.6% | +3.9 points |
| Born outside the US | 3.2% | 3.8% | +0.6 points |
| Hispanic or Latino | 3.5% | 5.4% | +1.9 points |
| Median household income | $72,634 | $80,506 | +10.8% |
| Living in poverty | 13.7% | 11.8% | −2.0 points |
| Bachelor’s degree or more | 27.5% | 33.0% | +5.5 points |
| Households that rent | 31.8% | 33.7% | +1.9 points |
| Median gross rent | $925 | $1,089 | +17.7% |
| Median home value | $209,339 | $299,100 | +42.9% |
242 census tracts
South Dakota, tract by tract
State averages hide a lot. These census tracts are the closest the census comes to neighborhoods.
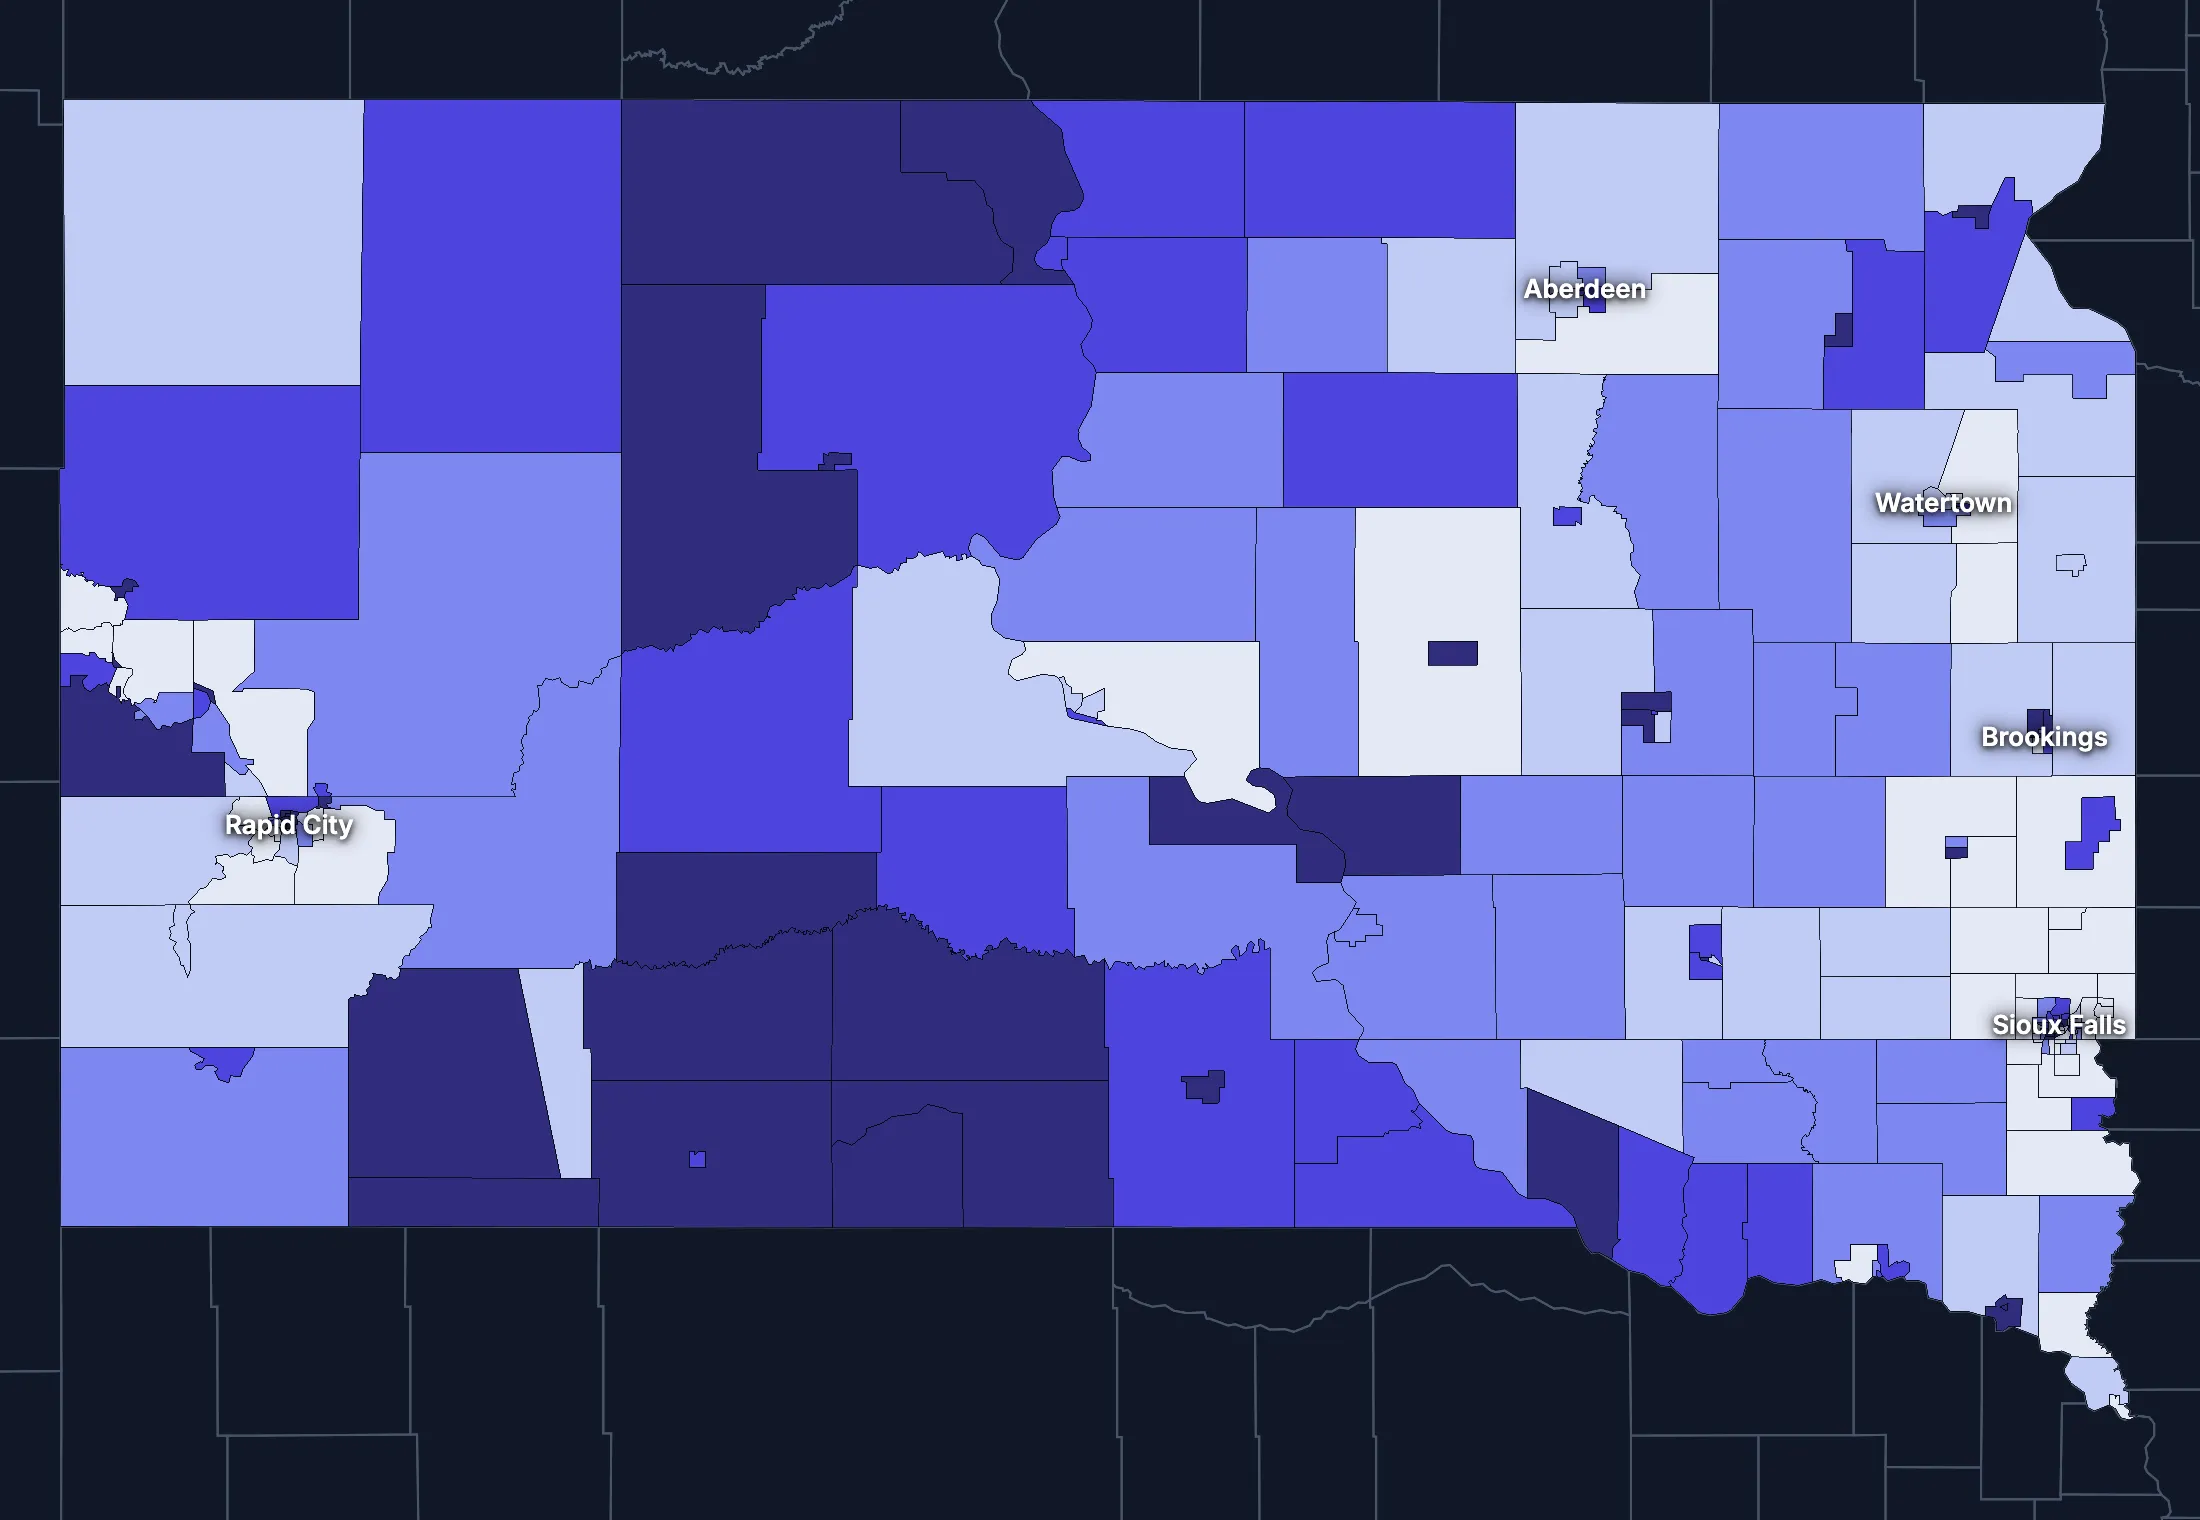
Where the state’s average misleads
Each tick is one census tract, and the dark line marks the state. Hover over a tick or tap it to see the tract.
Poverty
47 of 242 tracts are at least 1.5 times the state’s overall 11.9%, and 70 are at two-thirds of it or less.
Highest: Tract 9411, 83.0%. Lowest: Tract 101.11, 0.3%.
Renters paying 30% or more of income
18 of 240 tracts are at least 1.5 times the state’s overall 36.4%, and 75 are at two-thirds of it or less.
Highest: Tract 9568, 86.7%. Lowest: Tract 9756, 0.0%.
Adults with a bachelor’s degree
22 of 242 tracts are at least 1.5 times the state’s overall 31.9%, and 54 are at two-thirds of it or less.
Highest: Tract 16, 64.1%. Lowest: Tract 9411, 7.3%.
Median household income
13 of 242 tracts are at least 1.5 times the typical tract’s $74,567, and 31 are at two-thirds of it or less.
Highest: Tract 101.14, $152,958. Lowest: Tract 9411, $23,659.
American Community Survey 2020–2024 5-year estimates, by census tract. Income is capped at $250,000+ by the Census Bureau.
People
Who lives in South Dakota
Its median age of 38.5 is lower than the US (39.5). 3.8% of residents were born outside the US, and 6.8% speak a language other than English at home.
Age
Source: ACS 2025 1-year, table A01001.
Show data
| South Dakota | United States | |
|---|---|---|
| Under 18 | 23.3% ±0.7% , number 218,283 ±6,421 | 21.0% ±<0.1% , number 71,689,151 ±111,800 |
| 18 to 24 | 9.3% ±0.5% , number 86,589 ±4,924 | 9.3% ±<0.1% , number 31,716,680 ±98,660 |
| 25 to 34 | 12.6% ±0.4% , number 117,561 ±3,810 | 13.6% ±<0.1% , number 46,357,354 ±55,690 |
| 35 to 44 | 12.9% ±0.5% , number 120,196 ±4,760 | 13.4% ±<0.1% , number 45,746,189 ±105,700 |
| 45 to 54 | 10.8% ±0.3% , number 101,140 ±3,211 | 11.8% ±<0.1% , number 40,257,563 ±53,540 |
| 55 to 64 | 11.6% ±0.5% , number 108,462 ±4,879 | 12.1% ±<0.1% , number 41,242,904 ±104,700 |
| 65 to 74 | 11.4% ±0.5% , number 106,366 ±4,210 | 10.8% ±<0.1% , number 36,895,650 ±91,520 |
| 75 and over | 8.2% ±0.4% , number 76,497 ±3,428 | 8.2% ±<0.1% , number 27,879,368 ±78,140 |
Embed
Race and ethnicity
Source: ACS 2025 1-year, table A04001.
Show data
| South Dakota | United States | |
|---|---|---|
| White, not Hispanic | 77.7% ±0.3% , number 726,734 ±2,342 | 55.0% ±<0.1% , number 187,959,031 ±58,340 |
| Hispanic or Latino | 5.4% ±0.2% , number 50,554 ±1,531 | 20.5% ±<0.1% , number 69,975,516 ±13,270 |
| Black, not Hispanic | 2.0% ±0.3% , number 18,375 ±2,487 | 11.7% ±<0.1% , number 40,096,453 ±106,200 |
| Asian, not Hispanic | 1.4% ±0.2% , number 13,222 ±1,934 | 6.5% ±<0.1% , number 22,096,709 ±58,340 |
| Other or multiracial | 13.5% ±0.8% , number 126,209 ±7,380 | 6.3% ±<0.1% , number 21,657,150 ±150,100 |
Embed
Language spoken at home
Source: ACS 2025 1-year, table C16001.
Show data
| South Dakota | United States | |
|---|---|---|
| English only | 93.2% ±0.6% , number 821,437 ±5,486 | 77.1% ±0.1% , number 249,390,588 ±275,300 |
| Spanish | 2.8% ±0.3% , number 24,783 ±3,045 | 13.9% ±0.1% , number 44,921,985 ±177,800 |
| Other Indo-European | 1.5% ±0.3% , number 13,190 ±3,081 | 4.0% ±<0.1% , number 12,862,980 ±113,500 |
| Asian and Pacific Island | 1.0% ±0.3% , number 8,565 ±2,252 | 3.8% ±<0.1% , number 12,288,841 ±99,740 |
| Arabic and other | 1.5% ±0.3% , number 13,000 ±3,069 | 1.3% ±<0.1% , number 4,116,949 ±71,480 |
Embed
Marital status
Source: ACS 2025 1-year, table A11001.
Show data
| South Dakota | United States | |
|---|---|---|
| Now married | 51.2% ±1.3% , number 386,622 ±9,621 | 47.9% ±0.1% , number 135,567,564 ±223,300 |
| Never married | 31.9% ±1.0% , number 241,074 ±7,391 | 34.8% ±0.1% , number 98,647,238 ±152,600 |
| Divorced | 10.5% ±0.7% , number 79,665 ±5,146 | 10.2% ±<0.1% , number 28,879,967 ±112,900 |
| Widowed | 5.4% ±0.4% , number 40,444 ±3,223 | 5.5% ±<0.1% , number 15,599,094 ±69,430 |
| Separated | 1.0% ±0.2% , number 7,875 ±1,720 | 1.6% ±<0.1% , number 4,441,399 ±49,160 |
Embed
Where people lived a year ago
Source: ACS 2025 1-year, table A08001.
Show data
| South Dakota | United States | |
|---|---|---|
| Same home | 85.3% ±1.1% , number 787,310 ±10,270 | 88.4% ±0.1% , number 298,889,697 ±214,800 |
| Same county | 6.8% ±0.8% , number 63,006 ±7,350 | 6.0% ±<0.1% , number 20,202,671 ±166,300 |
| Another county in the state | 4.5% ±0.7% , number 41,917 ±6,023 | 3.0% ±<0.1% , number 10,168,097 ±89,190 |
| Another state | 2.8% ±0.5% , number 25,397 ±4,414 | 2.1% ±<0.1% , number 7,025,589 ±81,660 |
| Another country | 0.6% ±0.2% , number 5,644 ±1,803 | 0.6% ±<0.1% , number 1,984,943 ±47,210 |
Embed
Top countries of birth, among those born abroad
Source: ACS 2020–2024 5-year, table A07001.
Show data
| South Dakota | |
|---|---|
| Mexico | 11.9% , number 4,297 |
| Guatemala | 7.0% , number 2,526 |
| Ethiopia | 6.4% , number 2,308 |
| Philippines | 5.6% , number 2,003 |
| El Salvador | 4.8% , number 1,742 |
| Ukraine | 4.1% , number 1,472 |
Embed
All the numbers
| Indicator | South Dakota | US | Rank among states* | Table |
|---|---|---|---|---|
| Population | 935,094 | 341,784,859 | 46th | A00001 |
| People per square mile | 12 | 97 | 47th | A00002 |
| Land area (square miles) | 75,808 | – | – | A00002 |
| Median age | 38.5 ±0.4 | 39.5 ±0.1 | 38th | A01004 |
| Under 18 | 23.3% ±0.7% , number 218,283 ±6,421 | 21.0% ±<0.1% , number 71,689,151 ±111,800 | 4th | B02002 |
| 65 and over | 19.6% ±0.6% , number 182,863 ±5,430 | 19.0% ±<0.1% , number 64,775,018 ±120,300 | 21st | B02002 |
| Born outside the US | 3.8% ±0.4% , number 35,497 ±3,965 | 14.7% ±0.1% , number 50,409,320 ±204,800 | 47th | A06001 |
| Speak a language other than English at home | 6.8% ±0.6% , number 59,538 ±5,767 | 22.9% ±0.1% , number 74,190,755 ±244,000 | 41st | C16001 |
| Veterans (adults) | 7.8% ±0.5% , number 55,558 ±3,526 | 5.9% ±<0.1% , number 15,746,228 ±85,320 | 12th | A16002 |
| Living with a disability | 13.4% ±0.6% , number 122,430 ±5,598 | 13.7% ±<0.1% , number 46,271,455 ±126,000 | 36th | B18101 |
| Women 15–50 who had a baby in the past year | 6.9% ±1.0% , number 14,402 ±2,152 | 5.0% ±0.1% , number 4,016,759 ±44,040 | 1st | B13002 |
| Lived in the same home a year ago | 85.3% ±1.1% , number 787,310 ±10,270 | 88.4% ±0.1% , number 298,889,697 ±214,800 | 32nd | A08001 |
| White, not Hispanic | 77.7% ±0.3% , number 726,734 ±2,342 | 55.0% ±<0.1% , number 187,959,031 ±58,340 | 10th | A04001 |
| Hispanic or Latino | 5.4% ±0.2% , number 50,554 ±1,531 | 20.5% ±<0.1% , number 69,975,516 ±13,270 | 43rd | A04001 |
| Black, not Hispanic | 2.0% ±0.3% , number 18,375 ±2,487 | 11.7% ±<0.1% , number 40,096,453 ±106,200 | 41st | A04001 |
| Asian, not Hispanic | 1.4% ±0.2% , number 13,222 ±1,934 | 6.5% ±<0.1% , number 22,096,709 ±58,340 | 45th | A04001 |
*1 is the highest. Population is ranked among all states, and the rest among those of 1,000 people or more, whose figures can be ranked. Ranks use 5-year estimates, the only ones covering every state, so they can differ slightly from the figures here.
Income and work
Lower incomes than the US
The median household income is $80,506, lower than the US ($84,780). 11.8% of people live in poverty, and 8.6% have no health insurance, about the same as the US (8.4%).
Household income
Source: ACS 2025 1-year, table A14001.
Show data
| South Dakota | United States | |
|---|---|---|
| Under $25,000 | 13.0% ±1.1% , number 50,460 ±4,211 | 14.0% ±0.1% , number 18,727,548 ±88,990 |
| $25,000 to $49,999 | 17.4% ±1.3% , number 67,372 ±4,931 | 15.4% ±0.1% , number 20,665,585 ±101,400 |
| $50,000 to $74,999 | 16.5% ±1.1% , number 64,055 ±4,203 | 15.3% ±0.1% , number 20,513,565 ±88,500 |
| $75,000 to $99,999 | 13.9% ±1.1% , number 54,013 ±4,486 | 12.5% ±0.1% , number 16,814,245 ±87,520 |
| $100,000 to $149,999 | 20.3% ±1.3% , number 78,827 ±5,046 | 17.9% ±0.1% , number 24,018,984 ±99,670 |
| $150,000 to $199,999 | 9.9% ±0.8% , number 38,180 ±3,235 | 10.1% ±0.1% , number 13,521,827 ±70,660 |
| $200,000 or more | 8.9% ±0.7% , number 34,673 ±2,830 | 14.8% ±0.1% , number 19,801,668 ±84,120 |
Embed
What residents do for work
Source: ACS 2025 1-year, table A17004.
Show data
| South Dakota | United States | |
|---|---|---|
| Education and health care | 26.5% ±1.3% , number 127,331 ±6,508 | 24.4% ±0.1% , number 40,862,193 ±140,800 |
| Retail trade | 11.6% ±1.0% , number 55,571 ±4,981 | 10.6% ±0.1% , number 17,781,181 ±96,660 |
| Manufacturing | 8.6% ±0.8% , number 41,358 ±3,741 | 9.6% ±0.1% , number 16,064,394 ±91,270 |
| Arts, food and lodging | 8.3% ±0.9% , number 39,851 ±4,442 | 8.9% ±0.1% , number 14,811,502 ±87,840 |
| Professional and business services | 7.8% ±0.9% , number 37,549 ±4,214 | 12.8% ±0.1% , number 21,375,231 ±87,110 |
| Construction | 7.6% ±0.8% , number 36,645 ±3,651 | 6.7% ±<0.1% , number 11,254,981 ±79,620 |
| Agriculture and mining | 6.6% ±0.6% , number 31,796 ±3,070 | 1.4% ±<0.1% , number 2,287,596 ±30,080 |
| Finance, insurance and real estate | 5.4% ±0.6% , number 26,066 ±2,884 | 6.6% ±<0.1% , number 11,025,569 ±68,570 |
Embed
Where workers come from and go
South Dakota has 442,545 jobs and 434,174 employed residents. 29,668 people commute in to work and 21,297 commute out, while 412,877 both live and work here. The most commuters come from Iowa.
Most commuters come from
- Iowa: 8,036
- Minnesota: 7,772
- Nebraska: 5,252
Most residents commute to
- Iowa: 5,752
- Minnesota: 4,371
- Nebraska: 3,298
Show data
| South Dakota | |
|---|---|
| Live and work here | 412,877 |
| Work here, live elsewhere | 29,668 |
| Live here, work elsewhere | 21,297 |
Embed
All the numbers
| Indicator | South Dakota | US | Rank among states* | Table |
|---|---|---|---|---|
| Median household income | $80,506 ±$1,946 | $84,780 ±$215 | 31st | A14006 |
| Income per person | $43,435 ±$1,417 | $47,171 ±$115 | 38th | A14024 |
| Income inequality (Gini index) | 0.447 ±0.012 | 0.482 ±0.001 | 45th | A14028 |
| Living in poverty | 11.8% ±0.9% , number 106,660 ±7,996 | 11.8% ±0.1% , number 39,264,183 ±277,400 | 25th | A13004 |
| Unemployment rate | 2.5% ±0.5% , number 12,228 ±2,304 | 4.9% ±<0.1% , number 8,574,594 ±64,350 | 50th | A17005 |
| No health insurance | 8.6% ±0.7% , number 78,406 ±5,996 | 8.4% ±<0.1% , number 28,323,306 ±152,000 | 17th | A20001 |
*1 is the highest. Population is ranked among all states, and the rest among those of 1,000 people or more, whose figures can be ranked. Ranks use 5-year estimates, the only ones covering every state, so they can differ slightly from the figures here.
Education
Fewer college degrees than the US
33.0% of adults 25 and over have a bachelor’s degree or more, lower than the US (37.4%).
Highest level of education
Source: ACS 2025 1-year, table A12001.
Show data
| South Dakota | United States | |
|---|---|---|
| Less than high school | 6.3% ±0.6% , number 39,451 ±3,818 | 9.4% ±0.1% , number 22,321,002 ±120,500 |
| High school only | 28.7% ±1.0% , number 180,592 ±6,706 | 25.6% ±0.1% , number 61,096,726 ±203,400 |
| Some college | 32.1% ±1.3% , number 202,122 ±8,320 | 27.7% ±0.1% , number 65,920,977 ±173,500 |
| Bachelor’s degree | 22.2% ±0.9% , number 140,063 ±5,918 | 22.3% ±0.1% , number 53,224,312 ±196,700 |
| Graduate degree | 10.8% ±0.7% , number 67,994 ±4,389 | 15.0% ±0.1% , number 35,816,011 ±159,400 |
Embed
All the numbers
| Indicator | South Dakota | US | Rank among states* | Table |
|---|---|---|---|---|
| Bachelor’s degree or more | 33.0% ±1.2% , number 208,057 ±7,368 | 37.4% ±0.1% , number 89,040,323 ±253,200 | 35th | A12001 |
| High school graduate or more | 93.7% ±2.0% , number 590,771 ±12,980 | 90.6% ±0.2% , number 216,058,026 ±368,200 | 12th | A12001 |
*1 is the highest. Population is ranked among all states, and the rest among those of 1,000 people or more, whose figures can be ranked. Ranks use 5-year estimates, the only ones covering every state, so they can differ slightly from the figures here.
Housing
Home values outran incomes
33.7% of households rent, about the same as the US (34.7%). The median home is worth $299,100 and the median rent is $1,089. After inflation, home values rose 43% from 2015 to 2025, while household income rose 11%.
Housing costs and income, 2015 to 2025, after inflation
Source: ACS 1-year, table A10036, A18009, A14006.
Show data
| South Dakota | United States | |
|---|---|---|
| Median home value | +42.9% | +39.3% |
| Median rent | +17.7% | +18.5% |
| Median household income | +10.8% | +10.9% |
Embed
Types of homes
Source: ACS 2025 1-year, table A10032.
Show data
| South Dakota | United States | |
|---|---|---|
| Single-family, detached | 65.6% ±1.1% , number 281,953 ±4,912 | 60.9% ±0.1% , number 90,335,844 ±173,300 |
| Single-family, attached | 5.0% ±0.5% , number 21,316 ±2,151 | 6.4% ±<0.1% , number 9,527,703 ±51,230 |
| 2 to 4 units | 5.0% ±0.7% , number 21,386 ±3,099 | 7.5% ±0.1% , number 11,109,005 ±75,790 |
| 5 to 19 units | 8.8% ±1.0% , number 37,711 ±4,250 | 8.7% ±0.1% , number 12,829,882 ±97,590 |
| 20 or more units | 9.3% ±1.0% , number 40,007 ±4,418 | 11.1% ±0.1% , number 16,381,450 ±92,310 |
| Mobile homes and other | 6.3% ±0.6% , number 27,256 ±2,552 | 5.4% ±<0.1% , number 8,045,083 ±53,680 |
Embed
When homes were built
Source: ACS 2025 1-year, table A10055.
Show data
| South Dakota | United States | |
|---|---|---|
| 2010 or later | 20.1% ±1.2% , number 77,875 ±4,555 | 15.1% ±0.1% , number 20,257,912 ±101,300 |
| 2000 to 2009 | 15.0% ±1.1% , number 58,276 ±4,185 | 13.8% ±0.1% , number 18,535,840 ±92,260 |
| 1980 to 1999 | 19.5% ±1.3% , number 75,536 ±5,062 | 24.1% ±0.1% , number 32,332,570 ±118,900 |
| 1960 to 1979 | 20.5% ±1.2% , number 79,510 ±4,769 | 22.9% ±0.1% , number 30,726,302 ±110,000 |
| Before 1960 | 24.9% ±1.3% , number 96,383 ±5,039 | 24.0% ±0.1% , number 32,210,798 ±121,500 |
Embed
All the numbers
| Indicator | South Dakota | US | Rank among states* | Table |
|---|---|---|---|---|
| Housing units | 429,629 ±702 | – | – | A10001 |
| Households | 387,580 ±3,932 | – | – | A10008 |
| People per household | 2.33 ±0.02 | 2.49 ±0.01 | 39th | A10003 |
| Households that rent | 33.7% ±1.3% , number 130,691 ±5,292 | 34.7% ±0.1% , number 46,551,688 ±193,200 | 33rd | A10060 |
| Vacant homes | 9.8% ±1.0% , number 42,049 ±4,100 | 9.6% ±0.1% , number 14,165,545 ±137,100 | 24th | A10047, A10060 |
| Median gross rent | $1,089 ±$33 | $1,557 ±$4 | 50th | A18009 |
| Median home value | $299,100 ±$6,467 | $371,100 ±$646 | 34th | A10036 |
| Renters paying 30% or more of income | 41.8% ±3.3% , number 54,666 ±4,808 | 48.3% ±0.2% , number 22,486,693 ±122,100 | 50th | A18002 |
| Owners paying 30% or more of income | 17.5% ±1.3% , number 44,926 ±3,552 | 24.2% ±0.1% , number 21,201,943 ±93,050 | 44th | A10040 |
| Homes built before 1960 | 24.9% ±1.3% , number 96,383 ±5,039 | 24.0% ±0.1% , number 32,210,798 ±121,500 | 23rd | A10055 |
*1 is the highest. Population is ranked among all states, and the rest among those of 1,000 people or more, whose figures can be ranked. Ranks use 5-year estimates, the only ones covering every state, so they can differ slightly from the figures here.
Getting around
A driving state with short commutes
76.8% of workers drive alone and 9.8% work from home. 16.4% of those who travel to work spend 30 minutes or more getting there, and 6.1% of households have no vehicle.
How people get to work
Source: ACS 2025 1-year, table A09005.
Show data
| South Dakota | United States | |
|---|---|---|
| Drive alone | 76.8% ±1.3% , number 364,984 ±8,198 | 69.8% ±0.1% , number 115,297,377 ±192,900 |
| Carpool | 8.5% ±1.0% , number 40,490 ±4,591 | 8.9% ±0.1% , number 14,712,170 ±97,240 |
| Public transit | 0.3% ±0.2% , number 1,487 ±770 | 4.3% ±<0.1% , number 7,100,386 ±63,330 |
| Walk | 3.1% ±0.4% , number 14,853 ±1,761 | 2.4% ±<0.1% , number 4,016,469 ±41,070 |
| Work from home | 9.8% ±0.8% , number 46,703 ±4,050 | 12.9% ±0.1% , number 21,288,393 ±105,700 |
| Other | 1.4% ±0.3% , number 6,831 ±1,286 | 1.7% ±<0.1% , number 2,799,658 ±41,510 |
Embed
Time spent getting to work
Source: ACS 2025 1-year, table B09001.
Show data
| South Dakota | United States | |
|---|---|---|
| Under 10 minutes | 27.0% ±1.3% , number 115,703 ±6,095 | 12.0% ±0.1% , number 17,199,225 ±93,440 |
| 10 to 19 minutes | 39.0% ±1.8% , number 167,068 ±8,079 | 27.8% ±0.1% , number 40,059,540 ±137,700 |
| 20 to 29 minutes | 17.6% ±0.9% , number 75,382 ±4,193 | 21.0% ±0.1% , number 30,221,743 ±111,100 |
| 30 to 39 minutes | 8.2% ±0.7% , number 35,086 ±3,158 | 17.1% ±0.1% , number 24,659,138 ±103,800 |
| 40 to 59 minutes | 4.6% ±0.6% , number 19,874 ±2,461 | 12.6% ±0.1% , number 18,104,709 ±97,070 |
| 60 minutes or more | 3.6% ±0.5% , number 15,532 ±2,130 | 9.5% ±0.1% , number 13,681,705 ±84,440 |
Embed
Vehicles per household
Source: ACS 2025 1-year, table A10030.
Show data
| South Dakota | United States | |
|---|---|---|
| None | 6.1% ±0.8% , number 23,545 ±2,940 | 8.8% ±0.1% , number 11,781,997 ±77,240 |
| One | 29.3% ±1.5% , number 113,454 ±5,787 | 33.1% ±0.1% , number 44,424,682 ±160,700 |
| Two | 35.4% ±1.5% , number 137,170 ±5,937 | 36.0% ±0.1% , number 48,200,889 ±176,800 |
| Three or more | 29.3% ±1.4% , number 113,411 ±5,643 | 22.1% ±0.1% , number 29,655,854 ±113,300 |
Embed
All the numbers
| Indicator | South Dakota | US | Rank among states* | Table |
|---|---|---|---|---|
| Drive to work alone | 76.8% ±1.3% , number 364,984 ±8,198 | 69.8% ±0.1% , number 115,297,377 ±192,900 | 8th | A09005 |
| Take public transit | 0.3% ±0.2% , number 1,487 ±770 | 4.3% ±<0.1% , number 7,100,386 ±63,330 | 41st | A09005 |
| Work from home | 9.8% ±0.8% , number 46,703 ±4,050 | 12.9% ±0.1% , number 21,288,393 ±105,700 | 42nd | A09005 |
| Commute 30 minutes or more | 16.4% ±1.0% , number 70,492 ±4,535 | 39.2% ±0.1% , number 56,445,552 ±165,300 | 50th | B09001 |
| Households with no vehicle | 6.1% ±0.8% , number 23,545 ±2,950 | 8.8% ±<0.1% , number 11,781,997 ±64,240 | 43rd | A10030 |
*1 is the highest. Population is ranked among all states, and the rest among those of 1,000 people or more, whose figures can be ranked. Ranks use 5-year estimates, the only ones covering every state, so they can differ slightly from the figures here.
Places
The largest cities in South Dakota
Population, from the latest estimates available. Figures cover the whole of each place.
Largest cities
- Sioux Falls: 213,749
- Rapid City: 80,584
- Aberdeen: 28,189
- Brookings: 23,948
- Watertown: 23,044
- Mitchell: 15,649
- Yankton: 15,540
- Huron: 14,385
Every county and place in South Dakota
Find any county, city, town, metro area, ZIP code, school district or district in South Dakota.
Counties
Each of the 66 counties with its population, from ACS 2020–2024 5-year estimates.
- Aurora County2,642
- Beadle County19,309
- Bennett County3,345
- Bon Homme County7,044
- Brookings County35,353
- Brown County37,877
- Brule County5,283
- Buffalo County1,808
- Butte County10,676
- Campbell County1,593
- Charles Mix County9,281
- Clark County3,917
- Clay County15,219
- Codington County28,767
- Corson County3,806
- Custer County8,892
- Davison County19,952
- Day County5,437
- Deuel County4,328
- Dewey County5,205
- Douglas County2,828
- Edmunds County4,048
- Fall River County7,258
- Faulk County2,126
- Grant County7,563
- Gregory County4,016
- Haakon County1,722
- Hamlin County6,373
- Hand County3,140
- Hanson County3,472
- Harding County1,148
- Hughes County17,664
- Hutchinson County7,404
- Hyde County1,191
- Jackson County2,802
- Jerauld County1,772
- Jones County1,004
- Kingsbury County5,244
- Lake County10,972
- Lawrence County27,233
- Lincoln County70,638
- Lyman County3,724
- Marshall County4,344
- McCook County5,751
- McPherson County2,145
- Meade County30,546
- Mellette County1,943
- Miner County2,300
- Minnehaha County203,289
- Moody County6,397
- Oglala Lakota County13,491
- Pennington County113,512
- Perkins County3,001
- Potter County2,388
- Roberts County10,221
- Sanborn County2,384
- Spink County6,219
- Stanley County3,015
- Sully County1,526
- Todd County9,244
- Tripp County5,611
- Turner County8,882
- Union County17,081
- Walworth County5,271
- Yankton County23,414
- Ziebach County2,377
Cities, towns and other places
Each of the 439 with its population, from ACS 2020–2024 5-year estimates. Census-designated places are communities without a local government of their own, drawn by the Census Bureau so they can be counted.
- Aberdeen28,189
- Agar81
- Agency Village980
- Akaska104
- Albee4
- Alcester989
- Alexandria692
- Allen783
- Alpena317
- Altamont46
- Anderson219
- Andover31
- Angostura144
- Antelope706
- Ardmore5
- Arlington920
- Armour675
- Artas3
- Artesian148
- Ashland Heights1,105
- Ashton204
- Astoria142
- Aurora1,444
- Aurora Center16
- Avon704
- Badger162
- Baltic1,502
- Bancroft16
- Batesland89
- Bath91
- Bath Corner72
- Belle Fourche5,804
- Belvidere114
- Beresford2,360
- Big Stone City706
- Bison406
- Blackhawk2,934
- Blucksberg Mountain692
- Blunt216
- Bonesteel286
- Boulder Canyon841
- Bowdle475
- Box Elder12,902
- Bradley78
- Brandon10,996
- Brandt82
- Brant Lake63
- Brant Lake South211
- Brentford83
- Brentwood Colony57
- Bridger66
- Bridgewater451
- Bristol275
- Britton988
- Broadland15
- Brookings23,948
- Bruce290
- Bryant727
- Buffalo278
- Buffalo Gap131
- Bullhead294
- Burbank110
- Burke708
- Bushnell66
- Butler2
- Cameron Colony77
- Camp Crook41
- Canistota711
- Canova159
- Canton3,033
- Caputa27
- Carthage78
- Castlewood804
- Cavour186
- Centerville903
- Central City140
- Chamberlain2,588
- Chancellor421
- Chelsea61
- Cherry Creek224
- Chester152
- Claire City107
- Claremont106
- Clark1,359
- Clark Colony139
- Clear Lake CDP41
- Clear Lake city1,327
- Clearfield Colony106
- Colman948
- Colome338
- Colonial Pine Hills2,609
- Colton736
- Columbia161
- Conde128
- Corn Creek113
- Corona87
- Corsica699
- Cottonwood66
- Cow Creek69
- Cresbard122
- Crocker22
- Crook City279
- Crooks1,268
- Custer2,341
- Dakota Dunes3,936
- Dallas102
- Dante120
- Davis76
- De Smet943
- Deadwood1,209
- Dell Rapids3,905
- Delmont183
- Dimock104
- Doland209
- Dolton21
- Draper20
- Dudley8
- Dupree557
- Eagle Butte1,458
- Eden221
- Edgemont860
- Egan194
- Elk Point2,537
- Elkton977
- Emery539
- Enemy Swim301
- Erwin105
- Estelline831
- Ethan346
- Eureka778
- Evergreen Colony55
- Fairburn61
- Fairfax119
- Fairview102
- Faith297
- Farmer31
- Faulkton670
- Fedora65
- Flandreau2,392
- Florence317
- Forestburg113
- Fort Pierre2,410
- Fort Thompson1,147
- Frankfort128
- Frederick160
- Freeman1,565
- Fruitdale134
- Fulton84
- Gann Valley6
- Garden City78
- Garretson1,176
- Gary246
- Gayville519
- Geddes158
- Gettysburg1,260
- Glendale Colony112
- Glenham95
- Golden View Colony60
- Goodwin101
- Grassland Colony15
- Green Grass78
- Green Valley1,642
- Gregory1,379
- Grenville53
- Groton1,691
- Harrisburg8,519
- Harrold72
- Hartford3,478
- Hayti444
- Hazel199
- Hecla182
- Henry237
- Hermosa353
- Herreid560
- Herrick73
- Hetland10
- Highmore596
- Hill City834
- Hitchcock91
- Horse Creek162
- Hosmer289
- Hot Springs3,548
- Hoven329
- Howard943
- Hudson382
- Humboldt732
- Hurley394
- Huron14,385
- Hutterville Colony13
- Ideal40
- Interior77
- Ipswich1,048
- Irene456
- Iroquois389
- Isabel214
- Jamesville Colony101
- Java78
- Jefferson554
- Johnson Siding704
- Kadoka372
- Kaylor80
- Kenel163
- Kennebec296
- Keystone336
- Kidder8
- Kimball457
- Kranzburg175
- Kyle667
- La Bolt80
- La Plant240
- Lake Andes901
- Lake City40
- Lake Madison936
- Lake Norden889
- Lake Poinsett348
- Lake Preston596
- Lane28
- Langford481
- Lantry3
- Lead3,006
- Lebanon76
- Lemmon1,208
- Lennox2,468
- Leola381
- Lesterville91
- Letcher171
- Little Eagle275
- Long Hollow128
- Long Lake14
- Loomis13
- Lower Brule743
- Lowry1
- Lyons112
- Madison6,094
- Manderson-White Horse Creek833
- Mansfield12
- Marion981
- Martin947
- Marty305
- Marvin19
- Maverick Junction123
- Mayfield Colony77
- McIntosh80
- McLaughlin683
- Meadow View Addition879
- Meckling69
- Mellette199
- Menno653
- Midland135
- Milbank3,525
- Millbrook Colony47
- Miller1,363
- Millerdale Colony90
- Milltown4
- Mina767
- Mission1,539
- Mission Hill200
- Mitchell15,649
- Mobridge2,932
- Monroe233
- Montrose483
- Morningside90
- Morristown76
- Mound City90
- Mount Vernon442
- Mountain Plains350
- Murdo599
- Naples96
- New Effington269
- New Elm Spring Colony37
- New Holland4
- New Underwood509
- New Witten76
- Newell378
- Nisland109
- Norris140
- North Eagle Butte1,481
- North Sioux City3,045
- North Spearfish1,858
- Northville153
- Nunda40
- Oacoma548
- Oahe Acres399
- Oak Lane Colony34
- Oelrichs198
- Oglala1,071
- Okreek195
- Old Elm Spring Colony75
- Oldham75
- Olivet63
- Onaka25
- Onida644
- Oral55
- Orient91
- Orland Colony37
- Ortley73
- Parker1,280
- Parkston1,874
- Parmelee584
- Peever145
- Peever Flats119
- Pembrook Colony19
- Philip571
- Pickstown275
- Piedmont981
- Pierpont161
- Pierre13,948
- Pine Lakes Addition282
- Pine Ridge2,246
- Plankinton603
- Platte1,161
- Pollock270
- Porcupine424
- Prairie City20
- Prairiewood Village474
- Presho313
- Pringle206
- Pukwana300
- Quinn48
- Ramona538
- Rapid City77,946
- Rapid Valley6,975
- Ravinia45
- Raymond82
- Redfield1,989
- Ree Heights38
- Reliance211
- Renner Corner279
- Revillo88
- Richland107
- Rockham37
- Rockport Colony23
- Roscoe316
- Rosebud1,659
- Rosholt428
- Roslyn147
- Rowena225
- Running Water73
- Rustic Acres Colony30
- Salem1,216
- Scotland851
- Selby702
- Seneca22
- Shamrock Colony72
- Sherman65
- Shindler579
- Sicangu Village245
- Sinai215
- Sioux Falls201,469
- Sisseton2,670
- Smithwick25
- Soldier Creek201
- South Shore183
- Spearfish12,930
- Spencer103
- Spink Colony88
- Spring Creek330
- Spring Creek Colony209
- Spring Lake Colony35
- Springfield2,038
- St. Charles6
- St. Francis593
- St. Lawrence172
- St. Onge40
- Stephan13
- Stickney284
- Stockholm74
- Strandburg58
- Stratford62
- Sturgis7,086
- Summerset3,022
- Summit359
- Sunset Colony68
- Swift Bird35
- Tabor369
- Tea6,786
- Timber Lake779
- Tolstoy57
- Toronto238
- Trent341
- Tripp574
- Tschetter Colony148
- Tulare175
- Turton61
- Twin Brooks29
- Two Strike257
- Tyndall1,183
- Upland Colony30
- Utica68
- Vale73
- Valley Springs996
- Veblen455
- Verdon4
- Vermillion11,878
- Viborg958
- Vienna49
- Vilas21
- Virgil20
- Vivian50
- Volga2,408
- Volin139
- Wagner1,529
- Wakonda399
- Wakpala144
- Wall622
- Wallace66
- Wanblee534
- Ward52
- Warner512
- Wasta70
- Watertown23,044
- Waubay337
- Waverly7
- Webster1,896
- Wentworth138
- Wessington192
- Wessington Springs727
- West Brule471
- Westport93
- Wetonka7
- White484
- White Horse238
- White Lake469
- White River606
- White Rock12
- Whitehorse162
- Whitewood912
- Willow Lake433
- Wilmot381
- Winfred34
- Winner2,905
- Wolsey692
- Wonderland Homes745
- Wood40
- Woonsocket759
- Worthing1,036
- Wounded Knee524
- Yale122
- Yankton15,540
Metro and micro areas
Each of the 12 that reach into South Dakota, with its whole population, from ACS 2020–2024 5-year estimates. Metro and micro areas are counties tied together by commuting, drawn by the Office of Management and Budget.
- Aberdeen, SD Micro Area41,925
- Brookings, SD Micro Area35,353
- Huron, SD Micro Area19,309
- Mitchell, SD Micro Area25,808
- Pierre, SD Micro Area20,679
- Rapid City, SD Metro Area152,950
- Sioux City, IA-NE-SD Metro Area144,682
- Sioux Falls, SD-MN Metro Area298,181
- Spearfish, SD Micro Area27,233
- Vermillion, SD Micro Area15,219
- Watertown, SD Micro Area28,767
- Yankton, SD Micro Area23,414
ZIP codes
Each of the 372 with people in it, by the town it's centered in, from ACS 2020–2024 5-year estimates. These are the Census Bureau's ZIP Code Tabulation Areas, which follow the Postal Service's ZIP codes as closely as census blocks allow.
- 57001Alcester1,540
- 57002Aurora1,674
- 57003Baltic2,274
- 57004Beresford3,834
- 57005Brandon12,290
- 57006Brookings24,192
- 57007Brookings2,377
- 57010Burbank755
- 57012Canistota1,168
- 57013Canton4,504
- 57014Centerville1,667
- 57015Chancellor802
- 57016Chester676
- 57017Colman1,628
- 57018Colton1,495
- 57020Crooks1,622
- 57021Davis319
- 57022Dell Rapids5,339
- 57024Egan480
- 57025Elk Point3,120
- 57026Elkton1,531
- 57027Fairview199
- 57028Flandreau3,450
- 57029Freeman2,155
- 57030Garretson2,510
- 57031Gayville784
- 57032Harrisburg10,467
- 57033Hartford5,576
- 57034Hudson661
- 57035Humboldt1,591
- 57036Hurley667
- 57037Irene925
- 57038Jefferson1,796
- 57039Lennox3,622
- 57040Lesterville222
- 57041Lyons133
- 57042Madison7,756
- 57043Marion1,630
- 57045Menno1,151
- 57046Mission Hill521
- 57047Monroe389
- 57048Montrose1,237
- 57049North Sioux City7,962
- 57050Nunda176
- 57051Oldham163
- 57052Olivet478
- 57053Parker2,220
- 57054Ramona703
- 57055Renner Corner1,404
- 57057Nunda196
- 57058Salem1,881
- 57059Scotland1,242
- 57061Sinai215
- 57062Springfield2,484
- 57063Tabor882
- 57064Tea8,032
- 57065Trent383
- 57066Tyndall1,424
- 57067Jamesville Colony348
- 57068Valley Springs1,603
- 57069Meckling13,091
- 57070Viborg1,469
- 57071Volga3,149
- 57072Volin435
- 57073Wakonda564
- 57075Wentworth1,296
- 57076Winfred325
- 57077Worthing1,417
- 57078Yankton20,383
- 57103Sioux Falls35,582
- 57104Sioux Falls26,963
- 57105Sioux Falls23,287
- 57106Sioux Falls51,907
- 57107Crooks12,605
- 57108Harrisburg33,966
- 57110Sioux Falls23,313
- 57117Sioux Falls53
- 57197Sioux Falls388
- 57201Watertown26,781
- 57212Arlington1,819
- 57213Astoria505
- 57214Badger162
- 57216Big Stone City1,584
- 57217Bradley142
- 57218Brandt180
- 57219Bristol552
- 57220Bruce665
- 57221Bryant1,158
- 57223Castlewood1,429
- 57224Claire City164
- 57225Clark1,833
- 57226Clear Lake city1,953
- 57227Corona562
- 57231De Smet1,724
- 57232Eden651
- 57233Erwin350
- 57234Estelline1,339
- 57235Florence774
- 57236Garden City91
- 57237Gary731
- 57238Goodwin315
- 57239Grenville358
- 57241Hayti936
- 57242Hazel320
- 57243Henry549
- 57245Kranzburg151
- 57246La Bolt132
- 57247Lake City211
- 57248Lake Norden1,295
- 57249Lake Preston1,023
- 57251Marvin228
- 57252Milbank4,883
- 57255New Effington488
- 57256Ortley238
- 57257Peever637
- 57258Raymond510
- 57259Revillo477
- 57260Rosholt1,119
- 57261Roslyn277
- 57262Sisseton5,100
- 57263South Shore351
- 57264Stockholm191
- 57265Strandburg202
- 57266Summit626
- 57268Toronto435
- 57269Twin Brooks186
- 57270Veblen764
- 57271Naples246
- 57272Wallace201
- 57273Waubay1,165
- 57274Webster2,621
- 57276White942
- 57278Willow Lake1,011
- 57279Wilmot899
- 57301Mitchell19,104
- 57311Alexandria1,389
- 57312Alpena596
- 57313Armour1,220
- 57314Artesian572
- 57315Avon1,094
- 57317Bonesteel573
- 57319Bridgewater881
- 57321Canova390
- 57322Shamrock Colony378
- 57323Carthage126
- 57324Cavour410
- 57325Chamberlain3,335
- 57328Corsica1,290
- 57329Dante317
- 57330Delmont594
- 57331Dimock231
- 57332Emery903
- 57334Ethan1,081
- 57335Fairfax303
- 57337Fedora130
- 57339Fort Thompson1,390
- 57340Fulton244
- 57341Gann Valley79
- 57342Geddes393
- 57344New Holland39
- 57345Highmore941
- 57346Stephan13
- 57348Hitchcock776
- 57349Vilas1,513
- 57350Morningside16,199
- 57353Iroquois812
- 57354Kaylor86
- 57355Kimball1,120
- 57356Lake Andes1,959
- 57358Lane15
- 57359Letcher652
- 57361Marty278
- 57362Millerdale Colony1,967
- 57363Mount Vernon866
- 57364New Holland4
- 57365Oacoma599
- 57366Parkston2,598
- 57367Pickstown291
- 57368Plankinton1,068
- 57369Platte2,630
- 57370Pukwana894
- 57371Ree Heights238
- 57373St. Lawrence339
- 57374Spencer272
- 57375Stickney573
- 57376Tripp944
- 57379Virgil120
- 57380Wagner3,316
- 57381Wessington474
- 57382Wessington Springs1,180
- 57383White Lake899
- 57384Wolsey1,077
- 57385Woonsocket1,408
- 57386Yale240
- 57401Aberdeen31,939
- 57420Akaska260
- 57421Sunset Colony75
- 57422Andover174
- 57424Ashton437
- 57426Westport42
- 57427Bath384
- 57428Bowdle567
- 57429Brentford92
- 57430Kidder1,828
- 57432Claremont507
- 57433Columbia318
- 57434Conde506
- 57435Cresbard300
- 57436Doland440
- 57437Eureka1,074
- 57438Faulkton973
- 57440Frankfort466
- 57441Frederick670
- 574421,772
- 57445Groton2,072
- 57446Hecla223
- 57448Hosmer404
- 57449Claremont357
- 57450Hoven624
- 57451Ipswich2,485
- 57452Java136
- 57454Langford732
- 57455Lebanon137
- 57456Leola670
- 57457Long Lake108
- 57460Mansfield257
- 57461Mellette299
- 57465Chelsea438
- 57466Onaka192
- 57467Orient410
- 57468Pierpont279
- 57469Redfield2,866
- 57470Rockham242
- 57471Roscoe546
- 57472Selby1,165
- 57473Seneca246
- 57474Stratford237
- 57475Tolstoy99
- 57476Tulare349
- 57477Turton117
- 57479Warner625
- 57481Wetonka271
- 57501Oahe Acres17,326
- 57520Agar118
- 57521Belvidere314
- 57522Blunt521
- 57523Burke1,041
- 57528Colome833
- 57529Dallas245
- 57531Draper153
- 57532Fort Pierre2,929
- 57533Gregory1,674
- 57534130
- 57536Harrold277
- 57538Herrick236
- 57540Harrold223
- 57541Ideal163
- 57543Kadoka721
- 57544Kennebec421
- 57547383
- 57548Lower Brule1,442
- 57551Martin2,084
- 57552642
- 57553162
- 57555Mission3,740
- 57559Murdo735
- 57560Norris391
- 5756289
- 57563Okreek195
- 57564Onida962
- 57566Parmelee1,184
- 57567Philip1,056
- 57568Presho540
- 57569Reliance497
- 57570Two Strike2,071
- 57571St. Charles22
- 57572Spring Creek1,317
- 5757473
- 57576Vivian205
- 57577Wanblee940
- 57579White River1,277
- 575804,386
- 57584New Witten96
- 57585Wood114
- 576013,422
- 57620564
- 57621Bullhead294
- 57622Cherry Creek234
- 57623Dupree902
- 576253,775
- 57626Faith979
- 57630Whitehorse11
- 57631Glenham364
- 57632Herreid757
- 57633Isabel445
- 57634131
- 57636Lantry104
- 57638Lemmon1,852
- 57639Little Eagle290
- 5764041
- 57641McIntosh215
- 57642McLaughlin1,969
- 57644388
- 57645Morristown184
- 57646Mound City272
- 57648Pollock465
- 57649Prairie City273
- 5765017
- 57651191
- 57652La Plant265
- 57656Timber Lake1,000
- 57657247
- 57658Wakpala319
- 57659Bullhead16
- 57660111
- 57661Whitehorse177
- 57701Rapid City45,795
- 57702Johnson Siding35,595
- 57703Caputa18,013
- 57706Ashland Heights2,787
- 57714Allen1,144
- 57716Batesland201
- 577178,983
- 57718Summerset7,937
- 57719Ashland Heights12,221
- 57720Buffalo518
- 57722177
- 57724Camp Crook167
- 57725130
- 57730Custer5,596
- 57732Lead1,714
- 57735Edgemont1,727
- 5773777
- 57738Fairburn356
- 57741Sturgis141
- 57744Hermosa2,421
- 577451,894
- 57747Hot Springs5,839
- 57748Bridger369
- 57750365
- 57751Keystone893
- 57752Kyle1,553
- 57754Lead3,749
- 57755101
- 57756Manderson-White Horse Creek1,089
- 5775835
- 57759Piedmont398
- 57760966
- 57761New Underwood1,180
- 57762Nisland512
- 57763Oelrichs356
- 57764Oglala1,416
- 57766Smithwick176
- 57767Wasta234
- 57769Wonderland Homes4,029
- 57770Pine Ridge5,483
- 577722,493
- 57773Pringle206
- 57775191
- 57779St. Onge347
- 5778070
- 57782Smithwick58
- 57783Mountain Plains17,248
- 5778510,874
- 57787487
- 57788598
- 57790Wall1,147
- 5779197
- 57792114
- 57793Whitewood2,173
- 57794Wounded Knee1,191
- 57799Spearfish568
Towns and townships
Each of the 831 with people in it, from ACS 2020–2024 5-year estimates: the county subdivisions that are governments of their own. A city, borough or village that is one too is listed with the places above.
- Aberdeen township548
- Ada township7
- Adams township (Grant County)45
- Adams township (Miner County)23
- Afton township (Brookings County)129
- Afton township (Sanborn County)40
- Agency township128
- Alban township740
- Alcester township142
- Alden township29
- Allen township108
- Alliance township11
- Allison township14
- Alpena township58
- Altamont township63
- Alto township34
- Alton township150
- Altoona township103
- America township118
- Andover township140
- Anina township19
- Antelope township (Perkins County)15
- Antelope township (Spink County)260
- Antelope Valley township45
- Arcade township9
- Argentine township58
- Argo township84
- Ash township36
- Athol township34
- Aurora township (Aurora County)124
- Aurora township (Brookings County)134
- Bad Nation township19
- Badger township (Davison County)161
- Badger township (Kingsbury County)227
- Badus township81
- Bailey township26
- Baker township (Davison County)56
- Baker township (Kingsbury County)172
- Bangor township224
- Banner township33
- Barrett township (Beadle County)100
- Barrett township (Perkins County)28
- Bates township49
- Bath township446
- Beaver Creek township15
- Beaver township16
- Beck-Highland township21
- Becker township118
- Belford township64
- Belle Plaine township60
- Belle Prairie township35
- Belle township19
- Belleview township41
- Belmont township (Douglas County)97
- Belmont township (Spink County)33
- Benedict township23
- Benton township (McCook County)59
- Benton township (Minnehaha County)737
- Beotia township43
- Bethel township89
- Beulah township (Davison County)299
- Beulah township (Hanson County)94
- Big Sioux township4,917
- Big Springs township237
- Big Stone township426
- Bison township59
- Black township85
- Blackpipe township50
- Blaine township (Clark County)83
- Blaine township (Jerauld County)35
- Blendon township81
- Blinsmon township61
- Blom township65
- Blooming Valley township145
- Bonilla township47
- Bossko township31
- Bowdle township23
- Brainard township93
- Brandon township536
- Brandt township54
- Brantford township57
- Bridgewater township238
- Bristol township (Aurora County)22
- Bristol township (Day County)35
- Broadland township53
- Brookfield township232
- Brookings township617
- Brooklyn township216
- Brothersfield township141
- Brule township (Brule County)93
- Brule township (Union County)254
- Brunson township52
- Bryan township341
- Bryant township (Edmunds County)22
- Bryant township (Faulk County)8
- Bryant township (Roberts County)152
- Buffalo township (Jones County)20
- Buffalo township (Marshall County)164
- Buffalo township (Minnehaha County)246
- Buffalo township (Spink County)39
- Bull Creek township21
- Burdette township30
- Burk township416
- Burr Oak township29
- Butler township169
- Cambria township89
- Campbell township18
- Canistota township107
- Canova township122
- Canton township514
- Capital township29
- Capitola township192
- Carl township16
- Carlisle township13
- Carlyle township46
- Carter township214
- Carthage township28
- Cash township10
- Castlewood township193
- Cavour township152
- Cedar Butte township77
- Cedar township90
- Center township40
- Centerville township (Faulk County)6
- Centerville township (Turner County)282
- Central Point township85
- Chamberlain township307
- Chance township83
- Chaudoin township10
- Chery township20
- Chester township (Douglas County)145
- Chester township (Lake County)641
- Childstown township141
- Choteau Creek township347
- Civil Bend township191
- Clare township251
- Claremont township291
- Clark township (Douglas County)70
- Clark township (Faulk County)33
- Clarno township5
- Clayton township34
- Clear Lake township (Deuel County)218
- Clear Lake township (Edmunds County)92
- Clear Lake township (Minnehaha County)178
- Clearwater township117
- Cleveland township (Brule County)107
- Cleveland township (Hamlin County)298
- Clifton township (Beadle County)249
- Clifton township (Spink County)51
- Clinton township100
- Clyde township268
- Cody township23
- Collins township203
- Colman township334
- Colome township100
- Columbia township41
- Como township72
- Concord township56
- Conde township92
- Condon township72
- Cornwall township83
- Cortlandt township834
- Cottonwood Lake township17
- Cottonwood township10
- Crandon township101
- Crooked Creek township6
- Cross Plains township80
- Crow Lake township49
- Crow township15
- Crystal Lake township43
- Curlew township13
- Custer township (Beadle County)334
- Custer township (Corson County)41
- Dakota township51
- Daneville township207
- Darlington township (Charles Mix County)86
- Darlington township (Clark County)36
- Day township178
- Dayton township (Lincoln County)1,006
- Dayton township (Marshall County)21
- De Smet township384
- De Witt township38
- Dearborn township47
- Delapre township2,025
- Delaware township203
- Dell Rapids township704
- Dempster township95
- Denver township147
- Devoe township55
- Dexter township186
- Diana township15
- Dixon township (Gregory County)40
- Dixon township (Hamlin County)93
- Dog Ear township18
- Dolton township84
- Draper township48
- Dry Wood Lake township40
- Dudley township50
- Duell township16
- Dumarce township13
- Dunkel township6
- Eagle township53
- East Choteau township47
- East Hanson township47
- East Rondell township146
- Easter township43
- Eden township (Clark County)28
- Eden township (Codington County)79
- Eden township (Lincoln County)111
- Eden township (Marshall County)187
- Edens township73
- Edgerton township59
- Edison township288
- Egan township344
- Egeland township48
- Elk Point township91
- Elkton township80
- Elliott township121
- Elliston township21
- Ellisville township154
- Elmira township345
- Elrod township84
- Elvira township6
- Emerson township9
- Emery township61
- Emmet township140
- Englewood township5
- Enterprise township (Moody County)93
- Enterprise township (Roberts County)55
- Esmond township19
- Estelline township306
- Eureka township (Aurora County)8
- Eureka township (Brookings County)82
- Exline township97
- Fair township45
- Fairfax township98
- Fairfield township250
- Fairview township (Clay County)535
- Fairview township (Faulk County)46
- Fairview township (Hanson County)56
- Fairview township (Lincoln County)193
- Fairview township (Mellette County)22
- Fairview township (Pennington County)109
- Farmington township (Day County)28
- Farmington township (Grant County)59
- Farmington township (Lake County)130
- Firesteel township40
- Flandreau township422
- Flat Creek township69
- Florence township139
- Floyd township61
- Forbes township254
- Fordham township116
- Fort township75
- Foster township (Beadle County)32
- Foster township (Hutchinson County)211
- Foster township (Perkins County)80
- Fountain township146
- Foxton township21
- Frankfort township28
- Franklin township (Jerauld County)184
- Franklin township (Lake County)216
- Franklyn township28
- Frederick township39
- Freedom township26
- Fremont township77
- Fuller township245
- Gales township57
- Garden Prairie township91
- Garfield township (Clark County)37
- Garfield township (Clay County)317
- Garfield township (Douglas County)66
- Garfield township (Hamlin County)199
- Garfield township (Roberts County)83
- Garfield township (Spink County)144
- Garland township20
- Gayville township224
- Gem township245
- Geneseo township475
- Georgia township129
- German township33
- Germantown township (Codington County)50
- Germantown township (Turner County)145
- Gilbert township30
- Glen township12
- Glendale township82
- Glendo township33
- Glenwood township (Clay County)268
- Glenwood township (Deuel County)23
- Glover township29
- Goodwill township1,162
- Goodwin township98
- Goose Lake township167
- Graceland township111
- Grafton township73
- Grand Meadow township393
- Grand River township51
- Grand township55
- Grandview township (Douglas County)133
- Grandview township (Hutchinson County)104
- Grange township141
- Grant Center township296
- Grant township (Beadle County)34
- Grant township (Lincoln County)490
- Grant township (McCook County)204
- Grant township (Roberts County)177
- Great Bend township16
- Green Valley township27
- Greenfield township270
- Greenland township260
- Greenleaf township6
- Greenwood township14
- Grenville township186
- Groton township98
- Groveland township31
- Grovena township144
- Hague township46
- Hall township3
- Hamilton township (Charles Mix County)31
- Hamilton township (Marshall County)26
- Hamlin township291
- Hanson township454
- Harmon township248
- Harmony township (Edmunds County)110
- Harmony township (Jerauld County)4
- Harmony township (Spink County)7
- Harrison township42
- Hart township50
- Hartford township569
- Hartland township (Beadle County)51
- Hartland township (Kingsbury County)284
- Havana township173
- Hayti township167
- Henden township181
- Henry township (Brown County)52
- Henry township (Codington County)79
- Herman township844
- Herrick township235
- Hickman township38
- Hidewood township88
- Highland township (Brown County)130
- Highland township (Brule County)51
- Highland township (Charles Mix County)484
- Highland township (Day County)23
- Highland township (Lincoln County)389
- Highland township (Minnehaha County)148
- Hillsdale township170
- Hillside township50
- Hoffman township22
- Holden township33
- Holland township97
- Home township292
- Homer township24
- Hopper township39
- Horse Creek township15
- Howard township (Charles Mix County)208
- Howard township (Meade County)95
- Howard township (Miner County)195
- Hudson township32
- Hulbert township39
- Humboldt township348
- Huntley township5
- Hurley township71
- Huron township52
- Ideal township40
- Imlay township29
- Independence township (Day County)71
- Independence township (Douglas County)70
- Interior township45
- Iona township11
- Iowa township (Beadle County)2
- Iowa township (Douglas County)117
- Ipswich township23
- Iroquois township66
- Jackson township (Charles Mix County)74
- Jackson township (Sanborn County)99
- Jamesville township302
- Jasper township268
- Jefferson township (McCook County)72
- Jefferson township (Moody County)183
- Jefferson township (Spink County)119
- Jefferson township (Union County)1,088
- Jones township57
- Jordan township93
- Joubert township35
- Kampeska township227
- Kassel township55
- Kaylor township191
- Kellogg township85
- Kennedy township38
- Kent township53
- Kidder township70
- Kilborn township76
- Kimball township106
- King township78
- Kosciusko township229
- Kranzburg township360
- Kulm township141
- La Belle township59
- La Prairie township90
- La Roche township23
- La Valley township498
- Lafoon township48
- Lake Byron township163
- Lake Creek township7
- Lake Flat township60
- Lake George township61
- Lake Hendricks township192
- Lake Hill township47
- Lake Sinai township156
- Lake township (Aurora County)83
- Lake township (Clark County)51
- Lake township (Codington County)851
- Lake township (Marshall County)83
- Lake township (Roberts County)283
- Lake township (Spink County)39
- Lake township (Tripp County)41
- Lake View township676
- Lakeside township163
- Laketon township149
- Lamro township286
- Lansing township249
- Lawrence township (Charles Mix County)501
- Lawrence township (Roberts County)245
- Le Roy township152
- Le Sueur township109
- Lee township47
- Leola township80
- Letcher township102
- Liberty township (Beadle County)156
- Liberty township (Brown County)20
- Liberty township (Day County)10
- Liberty township (Hutchinson County)218
- Lien township188
- Lincoln township (Brown County)1,598
- Lincoln township (Clark County)29
- Lincoln township (Douglas County)5
- Lincoln township (Lincoln County)255
- Lincoln township (Perkins County)164
- Lincoln township (Spink County)274
- Lincoln township (Tripp County)17
- Linn township26
- Lisbon township199
- Lockwood township314
- Lodi township16
- Logan township (Beadle County)76
- Logan township (Clark County)5
- Logan township (Jerauld County)19
- Logan township (Minnehaha County)179
- Logan township (Sanborn County)194
- Lone Rock township51
- Lone Star township20
- Lone Tree township (Charles Mix County)333
- Lone Tree township (Perkins County)34
- Long Hollow township291
- Lowe township173
- Lowell township86
- Lura township53
- Lynn township (Day County)40
- Lynn township (Lincoln County)325
- Lynn township (Moody County)236
- Lyon township58
- Lyons township567
- Madison township (Edmunds County)8
- Madison township (Grant County)110
- Manchester township53
- Mapleton township2,481
- Marindahl township151
- Marion township113
- Marlar township8
- Marshfield township11
- Mathews township175
- Mayfield township104
- Mazeppa township84
- McKinley township79
- McNeely township83
- Meadow township10
- Meckling township273
- Medary township1,452
- Mellette township67
- Melrose township286
- Mercier township121
- Merton township53
- Middleton township248
- Midland township43
- Milford township60
- Miller township (Hand County)99
- Miller township (Marshall County)334
- Milltown township202
- Miner township26
- Minnesota township129
- Mission Hill township111
- Modena township9
- Molan township150
- Mondamin township4
- Monroe township136
- Montpelier township51
- Montrose township223
- Moore township91
- Moreau township29
- Morton township28
- Mosher township28
- Mount Vernon township198
- Mullen township6
- Myron township60
- Nance township17
- New Hope township80
- Newark township61
- Newport township58
- Norden township (Deuel County)280
- Norden township (Hamlin County)390
- Nordland township36
- Norris township172
- North Bryant township50
- Northville township127
- Norway township (Clay County)126
- Norway township (Lincoln County)164
- Norway township (Roberts County)61
- Norway township (Turner County)222
- Nunda township62
- Nutley township52
- O'Neil township5
- Oacoma township51
- Oak Gulch township19
- Oak Hollow township43
- Oak Lake township109
- Oakwood township246
- Odessa township20
- Ohio township127
- Okaton township22
- Ola township17
- One Road township8
- Oneida township7
- Oneota township107
- Ontario township63
- Opdahl township84
- Ordway township118
- Orient township17
- Orland township24
- Ortley township113
- Osceola township (Brown County)44
- Osceola township (Grant County)200
- Oslo township246
- Owanka township8
- Oxford township167
- Palatine township59
- Palisade township309
- Palmyra township61
- Park township133
- Parker township380
- Parnell township131
- Patten township97
- Pearl Creek township61
- Pearl township58
- Pelican township1,064
- Pembrook township54
- Perry township (Davison County)154
- Perry township (Lincoln County)677
- Phipps township65
- Plain Center township158
- Plainfield township4
- Plainview township11
- Plankinton township295
- Plano township194
- Plato township16
- Platte township596
- Pleasant Grove township22
- Pleasant Lake township33
- Pleasant Ridge township3
- Pleasant township (Clark County)161
- Pleasant township (Hanson County)174
- Pleasant township (Hutchinson County)3
- Pleasant township (Jerauld County)37
- Pleasant township (Lincoln County)428
- Pleasant Valley township (Aurora County)16
- Pleasant Valley township (Clay County)99
- Pleasant Valley township (Gregory County)250
- Pleasant Valley township (Hand County)10
- Pleasant Valley township (Marshall County)89
- Pleasant Valley township (Tripp County)56
- Pleasant View township (Beadle County)71
- Pleasant View township (Tripp County)126
- Plummer township15
- Portage township21
- Portland township98
- Powell township32
- Prairie Center township (Clay County)314
- Prairie Center township (Spink County)25
- Prairie township155
- Prairie View township12
- Prairiewood township474
- Preston township60
- Prosper township498
- Provo township5
- Pukwana township48
- Putney township40
- Quinn township7
- Raber township101
- Racine township54
- Rainbow township42
- Rainy Creek/Cheyenne township22
- Rames township29
- Ramsey township111
- Raritan township18
- Rauville township196
- Ravenna township12
- Ravinia township348
- Raymond township173
- Red Fish township28
- Red Iron Lake township142
- Red Lake township117
- Red Rock township215
- Redfield township462
- Ree township51
- Rex township16
- Rhoda township121
- Richfield township3
- Richland township (Beadle County)83
- Richland township (Brookings County)177
- Richland township (Brown County)52
- Richland township (Brule County)46
- Richland township (Clark County)52
- Richland township (Codington County)112
- Richland township (Edmunds County)19
- Richland township (McCook County)205
- Ridgeland township57
- Riverside township (Brown County)93
- Riverside township (Clay County)161
- Riverview township14
- Rock Creek township34
- Rockdale township90
- Rockford township12
- Rocky Ford township53
- Rolling Green township15
- Rome township (Davison County)185
- Rome township (Deuel County)41
- Rose Hill township23
- Rosedale township (Clark County)101
- Rosedale township (Hanson County)200
- Rosedale township (Tripp County)20
- Rosefield township232
- Rosette township37
- Roswell township32
- Rouse township185
- Running Bird township5
- Rusk township65
- Rutland township276
- Salem township (McCook County)199
- Salem township (Turner County)41
- Sangamon township71
- Saratoga township65
- Savo township17
- Scandinavia township351
- Scenic township53
- Schriever township8
- Scotch Cap township1
- Scotland township17
- Scovil township18
- Sharon township161
- Shelby township91
- Sheridan township445
- Sherman township (Brookings County)195
- Sherman township (Faulk County)73
- Sidney township11
- Signal township94
- Silver Creek township97
- Silver Lake township115
- Sioux Valley township112
- Sisseton township (Marshall County)122
- Sisseton township (Roberts County)573
- Smith township58
- South Detroit township30
- Spink township270
- Spirit Lake township256
- Spirit Mound township207
- Split Rock township3,143
- Spring Creek township33
- Spring Grove township150
- Spring Lake township (Hand County)55
- Spring Lake township (Hanson County)79
- Spring Lake township (Kingsbury County)161
- Spring township50
- Spring Valley township (Clark County)56
- Spring Valley township (McCook County)407
- Spring Valley township (Turner County)319
- Springdale township (Lincoln County)1,791
- Springdale township (Roberts County)104
- St. Lawrence township62
- St. Onge township347
- Star Prairie township74
- Star township98
- Star Valley township (Gregory County)96
- Star Valley township (Tripp County)45
- Starr township40
- Stena township137
- Sterling township345
- Stewart township153
- Stockholm township66
- Strool-Plateau township46
- Sully township75
- Summit township (Lake County)159
- Summit township (Roberts County)27
- Sumner township10
- Sun Prairie township216
- Sunnyside township63
- Surprise Valley township50
- Susquehanna township57
- Sverdrup township861
- Swan Lake township145
- Sweet township92
- Tamworth township74
- Taopi township340
- Taylor township (Hanson County)60
- Taylor township (Tripp County)77
- Tetonka township22
- Theresa township200
- Thorp township80
- Three Rivers township129
- Tobin township75
- Torrey Lake township205
- Trail township43
- Trenton township249
- Troy township (Day County)78
- Troy township (Grant County)33
- Truro township68
- Tulare township14
- Turkey Valley township127
- Turner township173
- Turton township24
- Twin Brooks township31
- Twin Lake township75
- Union township (Brule County)105
- Union township (Davison County)18
- Union township (Day County)55
- Union township (Edmunds County)88
- Union township (Faulk County)109
- Union township (McCook County)135
- Union township (Moody County)193
- Union township (Sanborn County)89
- Union township (Spink County)66
- Utica township831
- Vail township3
- Vale township73
- Valley Springs township223
- Valley township (Beadle County)285
- Valley township (Day County)99
- Valley township (Douglas County)133
- Valley township (Hutchinson County)198
- Valley township (Hyde County)14
- Valley township (Tripp County)8
- Veblen township136
- Vermillion township (Clay County)242
- Vermillion township (Miner County)84
- Vermont township14
- Vernon township (Beadle County)88
- Vernon township (Grant County)201
- Victor township (Marshall County)52
- Victor township (Roberts County)244
- Viewfield township116
- Viola township161
- Virgil township14
- Virginia township315
- Vivian township158
- Volga township124
- Volin township309
- Vrooman township4
- Wachter township10
- Wahehe township221
- Wakpala township144
- Waldro township89
- Wall Lake township1,130
- Wall township6
- Walnut Grove township183
- Walshtown township290
- Ward township23
- Warner township282
- Warren township (Clark County)16
- Warren township (Sanborn County)18
- Washington township (Aurora County)52
- Washington township (Clark County)105
- Washington township (Douglas County)73
- Wasta township26
- Watauga township29
- Waubay township653
- Waverly township (Codington County)250
- Waverly township (Marshall County)59
- Wayne township (Hanson County)224
- Wayne township (Lake County)30
- Wayne township (Minnehaha County)936
- Weaver township65
- Weber township262
- Webster township280
- Wellington township555
- Wells township22
- Wentworth township589
- Wesley township42
- Wessington Springs township60
- Wessington township51
- West Hanson township11
- West Point township193
- West Rondell township54
- Weston township60
- Westport township56
- Wheatland township74
- Wheaton township46
- White Lake township96
- White Rock township117
- White Swan township589
- White township8
- Whiteside township49
- Whitewood township96
- Wilbur township80
- Williams Creek township21
- Willow Creek township39
- Willow Lake township32
- Wilson township140
- Winfred township158
- Winsor township190
- Wismer township34
- Witten township20
- Wittenberg township258
- Wolf Creek township111
- Wolsey township75
- Woodland township18
- Woonsocket township184
- Worthen township264
- Wortman township8
- York township (Day County)54
- York township (Hand County)36
- Zell township39
- Zickrick township3
School districts
Each of the 148 with people in it, from ACS 2020–2024 5-year estimates.
- Aberdeen School District 06-132,231
- Agar-Blunt-Onida School District 58-31,929
- Alcester-Hudson School District 61-12,458
- Andes Central School District 11-12,141
- Arlington School District 38-11,911
- Armour School District 21-11,038
- Avon School District 04-11,320
- Baltic School District 49-12,439
- Belle Fourche School District 09-18,835
- Bennett County School District 03-13,345
- Beresford School District 61-24,034
- Big Stone City School District 25-11,054
- Bison School District 52-1809
- Bon Homme School District 04-24,578
- Bowdle School District 22-1571
- Brandon Valley School District 49-223,480
- Bridgewater-Emery School District 30-31,738
- Britton-Hecla School District 45-42,899
- Brookings School District 05-128,178
- Burke School District 26-21,242
- Canistota School District 43-11,305
- Canton School District 41-15,574
- Castlewood School District 28-11,486
- Centerville School District 60-11,751
- Chamberlain School District 07-16,337
- Chester School District 39-11,721
- Clark School District 12-22,461
- Colman-Egan School District 50-52,108
- Colome Consolidated School District 59-31,150
- Corsica-Stickney School District 21-32,080
- Custer School District 16-18,644
- Dakota Valley School District 61-88,312
- De Smet School District 38-21,828
- Dell Rapids School District 49-35,531
- Deubrook School District 05-61,966
- Deuel School District 19-43,303
- Doland School District 56-2933
- Douglas School District 51-118,206
- Dupree School District 64-21,656
- Eagle Butte School District 20-14,187
- Edgemont School District 23-11,390
- Edmunds Central School District 22-51,000
- Elk Mountain School District 16-2355
- Elk Point-Jefferson School District 61-74,690
- Elkton School District 05-31,591
- Estelline School District 28-21,523
- Ethan School District 17-1941
- Eureka School District 44-11,132
- Faith School District 46-2856
- Faulkton School District 24-41,757
- Flandreau School District 50-33,867
- Florence School District 14-1722
- Frederick Area School District 06-2750
- Freeman School District 33-12,597
- Garretson School District 49-42,222
- Gayville-Volin School District 63-11,165
- Gettysburg School District 53-11,405
- Gregory School District 26-41,843
- Groton Area School District 06-63,664
- Haakon School District 27-11,464
- Hamlin School District 28-33,702
- Hanson School District 30-11,665
- Harding County School District 31-11,148
- Harrisburg School District 41-235,638
- Henry School District 14-2542
- Herreid School District 10-1798
- Highmore-Harrold School District 34-21,425
- Hill City School District 51-23,435
- Hitchcock-Tulare School District 56-61,698
- Hot Springs School District 23-25,595
- Hoven School District 53-21,200
- Howard School District 48-32,268
- Huron School District 02-216,543
- Ipswich School District 22-62,538
- Irene-Wakonda School District 13-31,767
- Iroquois School District 02-31,285
- Jones County School District 37-31,009
- Kadoka School District 35-23,082
- Kimball School District 07-21,258
- Lake Preston School District 38-31,407
- Langford School District 45-51,785
- Lead-Deadwood School District 40-16,434
- Lemmon School District 52-42,193
- Lennox School District 41-46,144
- Leola School District 44-21,040
- Lyman School District 42-12,944
- Madison Central School District 39-28,249
- Marion School District 60-31,759
- McCook Central School District 43-72,188
- McIntosh School District 15-1711
- McLaughlin School District 15-22,460
- Meade School District 46-119,823
- Menno School District 33-21,478
- Milbank School District 25-46,601
- Miller Area School District 29-42,851
- Mitchell School District 17-219,130
- Mobridge-Pollock School District 62-63,876
- Montrose School District 43-21,145
- Mount Vernon School District 17-3909
- New Underwood School District 51-31,159
- Newell School District 09-22,077
- Northwestern Area School District 56-71,765
- Oelrichs School District 23-3481
- Oglala Lakota County School District 65-113,491
- Oldham-Ramona-Rutland 39-61,510
- Parker School District 60-42,553
- Parkston School District 33-32,986
- Pierre School District 32-217,018
- Plankinton School District 01-11,130
- Platte-Geddes School District 11-52,999
- Rapid City School District 51-4101,606
- Redfield School District 56-43,008
- Rosholt School District 54-41,062
- Sanborn Central School District 55-51,080
- Scotland School District 04-31,851
- Selby School District 62-51,915
- Sioux Falls School District 49-5167,455
- Sioux Valley School District 05-53,851
- Sisseton School District 54-27,604
- Smee School District 15-3372
- South Central School District 26-5931
- Spearfish School District 40-218,116
- Stanley County School District 57-13,015
- Summit School District 54-6642
- Tea Area School District 41-511,412
- Timber Lake School District 20-31,694
- Todd County School District 66-19,244
- Tri-Valley School District 49-65,255
- Tripp-Delmont School District 33-51,367
- Vermillion School District 13-113,340
- Viborg Hurley School District 60-62,414
- Wagner School District 11-43,938
- Wall School District 51-51,412
- Warner School District 06-51,158
- Watertown School District 14-426,696
- Waubay School District 18-31,170
- Waverly School District 14-5978
- Webster School District 18-53,458
- Wessington Springs School District 36-21,496
- West Central School District 49-77,114
- White Lake School District 01-3899
- White River School District 47-11,728
- Willow Lake School District 12-31,335
- Wilmot School District 54-71,453
- Winner School District 59-24,628
- Wolsey-Wessington School District 02-61,510
- Woonsocket School District 55-41,348
- Yankton School District 63-321,278
State senate districts
The upper chamber’s districts, as drawn in 2024.
- State Senate District 126,651
- State Senate District 227,974
- State Senate District 326,214
- State Senate District 426,630
- State Senate District 525,749
- State Senate District 627,592
- State Senate District 727,595
- State Senate District 826,132
- State Senate District 929,191
- State Senate District 1026,777
- State Senate District 1127,159
- State Senate District 1226,963
- State Senate District 1326,193
- State Senate District 1424,402
- State Senate District 1526,070
- State Senate District 1625,061
- State Senate District 1727,018
- State Senate District 1824,213
- State Senate District 1924,172
- State Senate District 2024,250
- State Senate District 2124,378
- State Senate District 2225,985
- State Senate District 2323,837
- State Senate District 2425,032
- State Senate District 2525,806
- State Senate District 2623,092
- State Senate District 2723,276
- State Senate District 2826,213
- State Senate District 2925,540
- State Senate District 3026,413
- State Senate District 3127,233
- State Senate District 3225,253
- State Senate District 3326,749
- State Senate District 3425,888
- State Senate District 3526,727
State house districts
The lower chamber’s districts, as drawn in 2024.
- State House District 126,651
- State House District 227,974
- State House District 326,214
- State House District 426,630
- State House District 525,749
- State House District 627,592
- State House District 727,595
- State House District 826,132
- State House District 929,191
- State House District 1026,777
- State House District 1127,159
- State House District 1226,963
- State House District 1326,193
- State House District 1424,402
- State House District 1526,070
- State House District 1625,061
- State House District 1727,018
- State House District 1824,213
- State House District 1924,172
- State House District 2024,250
- State House District 2124,378
- State House District 2225,985
- State House District 2323,837
- State House District 2425,032
- State House District 2525,806
- State House District 26A11,377
- State House District 26B11,715
- State House District 2723,276
- State House District 28A12,655
- State House District 28B13,558
- State House District 2925,540
- State House District 3026,413
- State House District 3127,233
- State House District 3225,253
- State House District 3326,749
- State House District 3425,888
- State House District 3526,727
PUMAs
Public Use Microdata Areas: areas of 100,000 people or more that the state draws from census tracts, for the Census Bureau’s microdata.
Urban areas
Each that reaches into South Dakota, with its whole population. Urban areas are the densely settled land the Census Bureau draws after each census, whatever the city lines.
- Aberdeen, SD27,400
- Belle Fourche, SD4,784
- Box Elder, SD12,686
- Brandon, SD11,002
- Brookings, SD24,006
- Harrisburg, SD8,270
- Huron, SD14,368
- Lead, SD4,285
- Madison, SD6,094
- Mitchell, SD15,653
- Pierre, SD15,454
- Rapid City, SD88,377
- Sioux City, IA–NE–SD113,986
- Sioux Falls, SD202,339
- Spearfish, SD13,444
- Sturgis, SD7,175
- Summerset, SD5,201
- Tea, SD6,536
- Vermillion, SD11,859
- Watertown, SD20,874
- Yankton, SD16,305
Tribal areas
Each that reaches into South Dakota, with its whole population.
- Cheyenne River Reservation and Off-Reservation Trust Land, SD7,582
- Crow Creek Reservation, SD1,752
- Flandreau Reservation, SD520
- Lake Traverse Reservation and Off-Reservation Trust Land, SD–ND11,084
- Lower Brule Reservation and Off-Reservation Trust Land, SD1,521
- Northern Cheyenne Indian Reservation and Off-Reservation Trust Land, MT–SD4,363
- Pine Ridge Reservation, SD–NE18,758
- Rosebud Indian Reservation and Off-Reservation Trust Land, SD10,180
- Shakopee Mdewakanton Sioux Community and Off-Reservation Trust Land, MN–SD448
- Standing Rock Reservation, SD–ND7,546
- Turtle Mountain Reservation and Off-Reservation Trust Land, ND–MT–SD7,447
- Yankton Reservation, SD6,584
Turn South Dakota into your planning report.
Social Explorer Studio builds an editable profile of any place, with tables and charts beside the county and state, and exports to Word, PDF and Excel.
Questions about South Dakota
What is the population of South Dakota?
935,094 people, according to the ACS 2025 1-year estimates, which the Census Bureau adjusts to match its own population estimate. That’s the 46th largest of the 50 states and DC.
What is the FIPS code for South Dakota?
46. Every county’s and place’s FIPS code in South Dakota starts with it. The Census Bureau’s full geographic identifier (GEOID) is 0400000US46.
What is the largest city in South Dakota?
Sioux Falls, with 213,749 people. Other large cities here include Rapid City, Aberdeen and Brookings.
What is the median household income in South Dakota?
$80,506 (±$1,946), according to the ACS 2025 1-year estimates, lower than the US ($84,780).
What is the median age in South Dakota?
38.5 years (±0.4), according to the ACS 2025 1-year estimates, lower than the US (39.5).
How much does housing cost in South Dakota?
South Dakota’s median home value is $299,100 (±$6,467) and its median gross rent is $1,089 (±$33) a month, according to the ACS 2025 1-year estimates. 41.8% (±3.3%) of its renters pay 30% or more of their income on rent.
Is South Dakota growing?
South Dakota’s population grew 8.9%, from 858,469 in 2015 to 935,094 in 2025, according to the ACS 1-year estimates.
Where do people who work in South Dakota live?
412,877 of its 442,545 jobs are held by people who live here. Of those who commute in, the most come from Iowa, Minnesota, Nebraska.
Where does this census data come from?
The U.S. Census Bureau’s American Community Survey, through Social Explorer’s tables: the latest 1-year estimates where they exist, for the most recent numbers, and 5-year estimates otherwise. Each table lists its code, so you can find it again.
Is this data free to use?
Yes. You can read it, cite it, download the CSV and embed the charts, with no account. To map other variables, compare your own areas or build a report, see Social Explorer’s plans in a live demo.
Sources and how to cite
American Community Survey 2025 1-year estimates, or 2020–2024 5-year estimates where noted, U.S. Census Bureau, from Social Explorer’s tables A00001, A00002, A01004, A04001, A06001, A08001, A09005, A10001, A10003, A10008, A10030, A10036, A10040, A10047, A10055, A10060, A12001, A13004, A14006, A14024, A14028, A16002, A17005, A18002, A18009, A20001, B02002, B09001, B13002, B18101, C16001. Maps by census tract use 2020–2024 5-year estimates, since the 1-year survey doesn’t cover tracts. Commuting: LEHD LODES 2023. These are estimates from a sample, each with its margin of error. Data retrieved November 14, 2026. How these profiles are made.
U.S. Census Bureau, American Community Survey 2025 1-year estimates, or 2020–2024 5-year estimates where noted, via Social Explorer. “South Dakota.” https://www.socialexplorer.com/places/south-dakota. Accessed November 14, 2026.