

Illinois: Population, demographics and census data
Home to 12,719,141 people, the 6th largest of the 50 states and DC, anchored by Chicago. It fell 1.1% between 2015 and 2025.
- Population
- 12.72M. Census Bureau estimate · Rank 6 of the 50 states and DC
- Median household income
- $86,676 ±$814. US $84,780
- Median age
- 39.7 ±0.1. US 39.5
ACS 2025 1-year estimates, U.S. Census Bureau
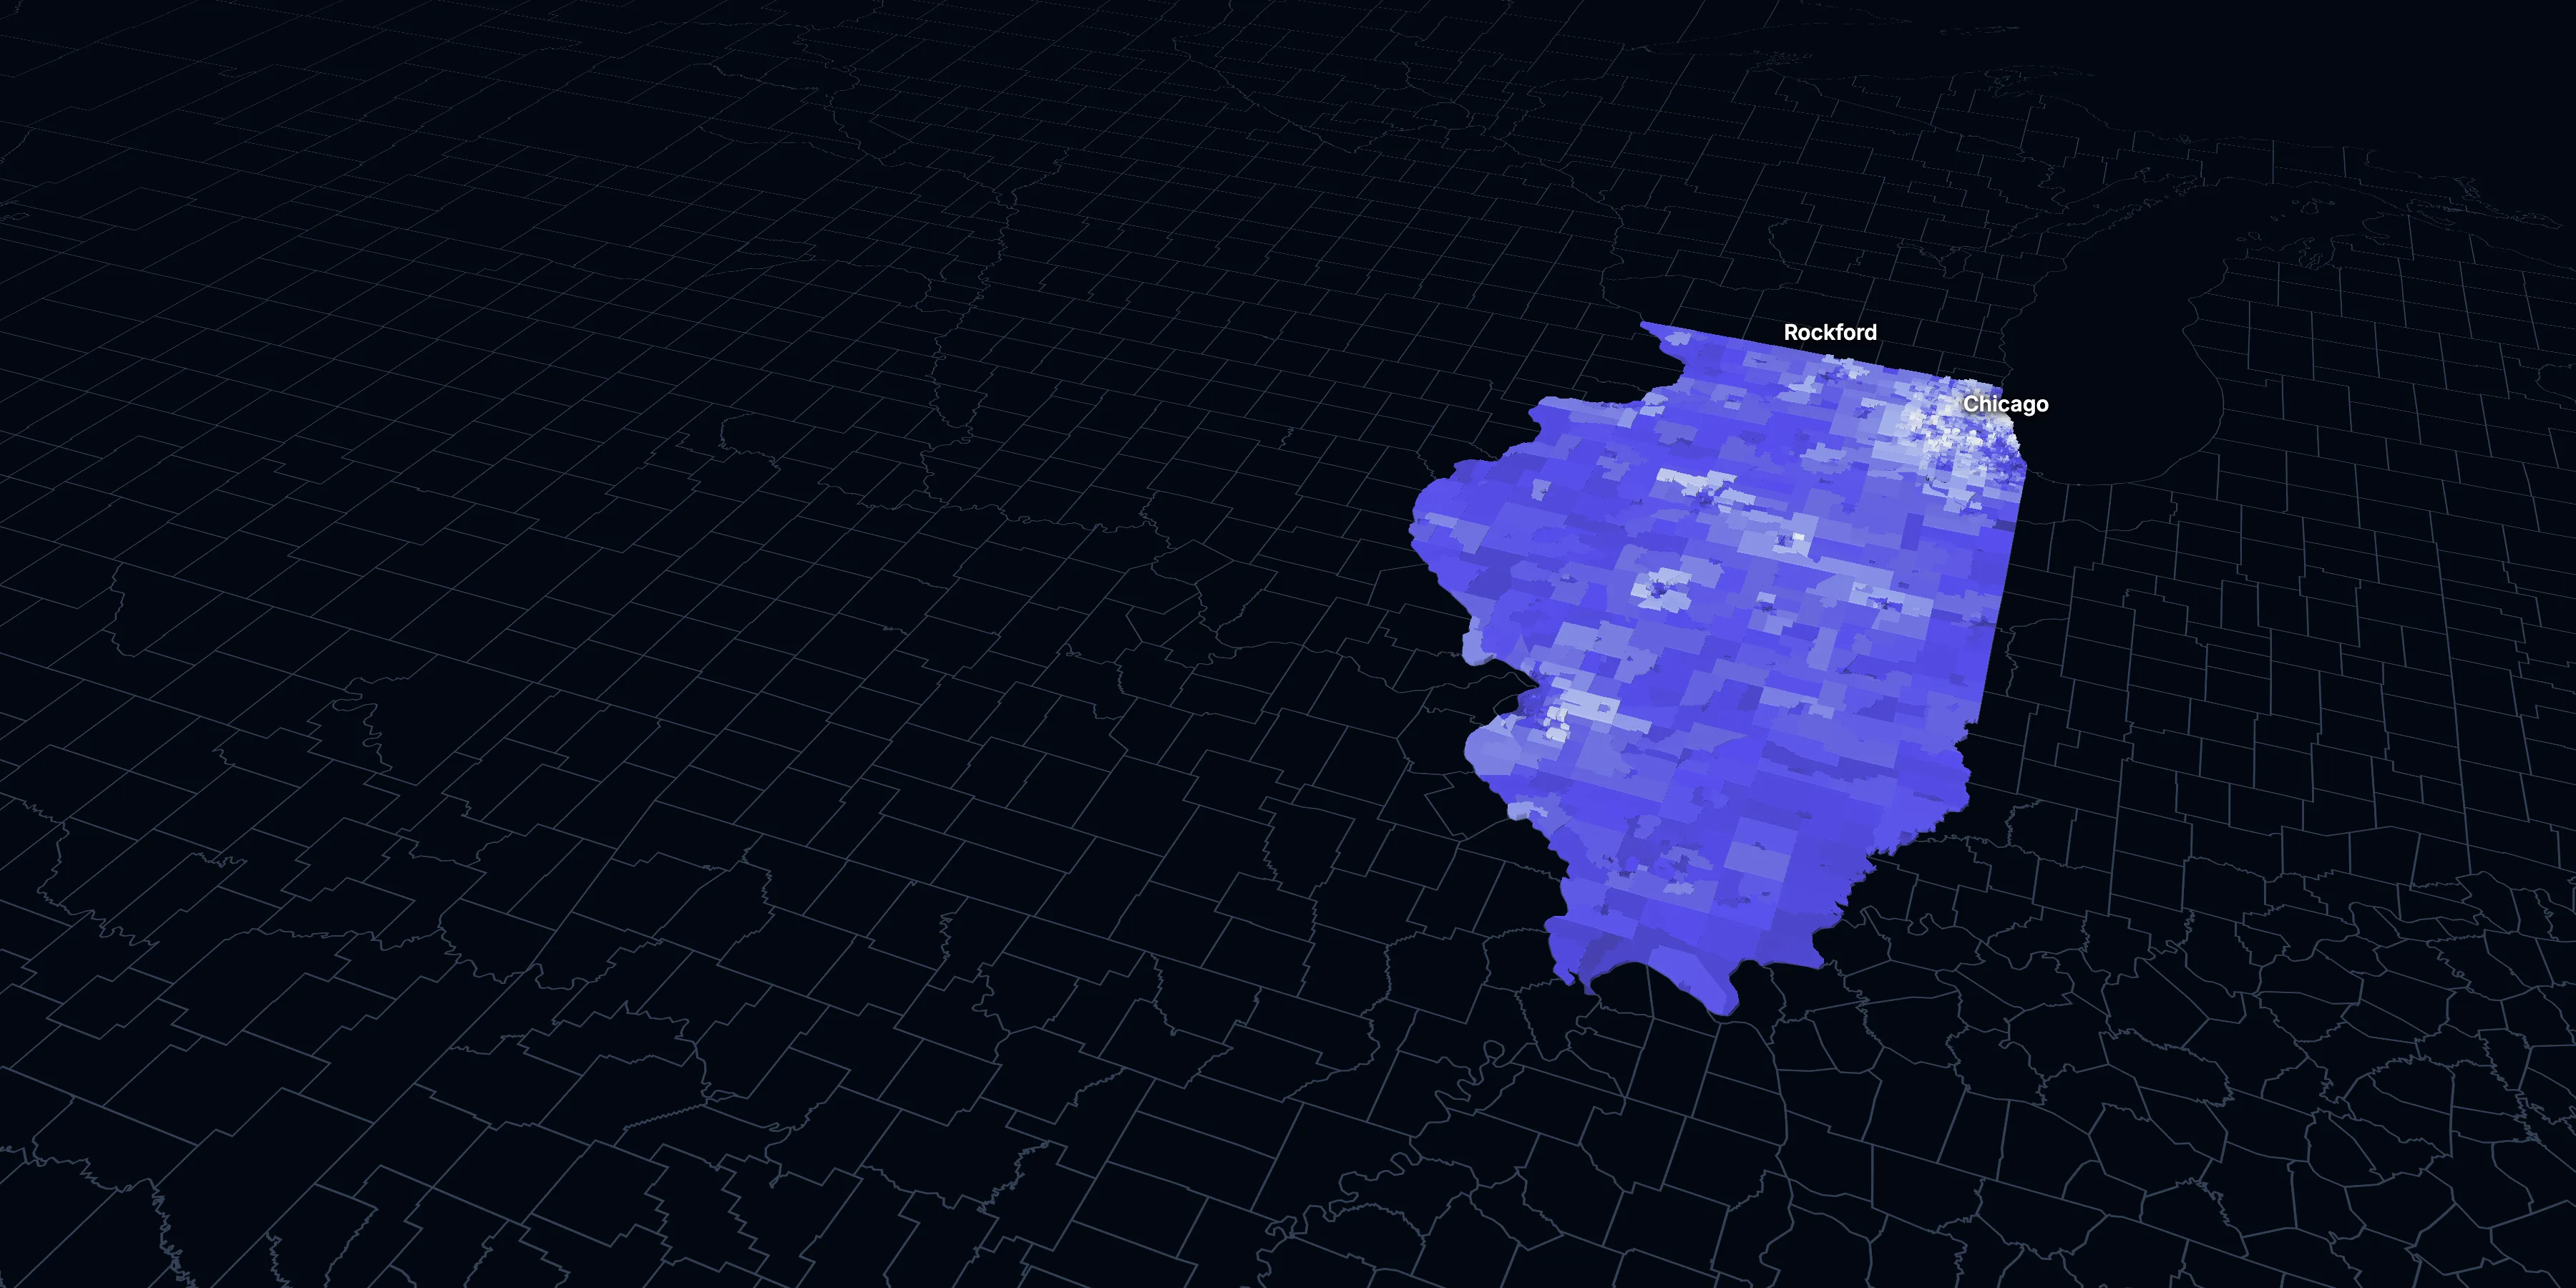
Taller, lighter tracts have higher household incomes
About Illinois
Illinois’s median household income is $86,676 (±$814), higher than the US ($84,780), and its median age is 39.7 (±0.1), according to the ACS 2025 1-year estimates. Its largest city is Chicago.
± is each figure’s margin of error, at 90% confidence, and † marks one too uncertain to lean on. Under each percentage in the tables is the number it counts. How the margins are worked out.
FIPS code 17
Highlights
What stands out in Illinois
The numbers where Illinois sits furthest from the nation, or past a recognized policy benchmark.
Past a policy benchmark
36.1%
Very highHomes built before 1960
That’s higher than the US (24.0%). Older homes carry more lead-paint risk: the EPA found lead paint in 69% of homes built from 1940 to 1959.
5.6%
ElevatedUnemployment rate
That’s higher than the US (4.9%). The Department of Labor uses 6% as its floor for a labor surplus area.
+5 points
ElevatedRent growth ahead of income
After inflation, rent grew 11% from 2015 to 2025, and household income 6%. The dots show rent growth.
Furthest from the national picture
4.5%
Lower than the USVeterans (adults)
That’s lower than the US (5.9%).
7.8%
2× the USTake public transit
That’s higher than the US (4.3%). It’s the 5th highest of the 50 states and DC.
12.5%
Lower than the USLiving with a disability
That’s lower than the US (13.7%).
2015 to 2025
How Illinois changed in ten years
The state lost 140,854 people. It got older, more foreign-born and better educated, and poverty fell 2.1 points.
Population, change since 2015
−1.1% in the state and +6.3% in the US.
Source: ACS 1-year, 2015 to 2025, table A00001.
Show data
| Illinois | United States | |
|---|---|---|
| 2015 | 0.0% | 0.0% |
| 2016 | −0.5% | +0.5% |
| 2017 | −0.5% | +1.3% |
| 2018 | −0.9% | +1.8% |
| 2019 | −1.5% | +2.1% |
| 2021 | −1.5% | +3.3% |
| 2022 | −2.2% | +3.7% |
| 2023 | −2.4% | +4.2% |
| 2024 | −1.2% | +5.8% |
| 2025 | −1.1% | +6.3% |
Embed
Median household income, in 2025 dollars
+6.2% in the state and +10.9% in the US.
Source: ACS 1-year, 2015 to 2025, table A14006.
Show data
| Illinois | United States | |
|---|---|---|
| 2015 | $81,637 | $76,413 |
| 2016 | $82,453 | $77,931 |
| 2017 | $83,408 | $79,891 |
| 2018 | $84,057 | $80,059 |
| 2019 | $87,839 | $83,427 |
| 2021 | $86,501 | $83,521 |
| 2022 | $84,974 | $82,811 |
| 2023 | $85,436 | $82,683 |
| 2024 | $86,000 | $84,339 |
| 2025 | $86,676 | $84,780 |
Embed
Living in poverty
−2.1 points in the state and −3.0 points in the US.
Source: ACS 1-year, 2015 to 2025, table A13004.
Show data
| Illinois | United States | |
|---|---|---|
| 2015 | 13.6% | 14.7% |
| 2016 | 13.0% | 14.0% |
| 2017 | 12.6% | 13.4% |
| 2018 | 12.1% | 13.1% |
| 2019 | 11.5% | 12.3% |
| 2021 | 12.1% | 12.8% |
| 2022 | 11.9% | 12.6% |
| 2023 | 11.6% | 12.5% |
| 2024 | 11.6% | 12.1% |
| 2025 | 11.5% | 11.8% |
Embed
Bachelor’s degree or more
+6.2 points in the state and +6.7 points in the US.
Source: ACS 1-year, 2015 to 2025, table A12001.
Show data
| Illinois | United States | |
|---|---|---|
| 2015 | 32.9% | 30.6% |
| 2016 | 34.0% | 31.3% |
| 2017 | 34.4% | 32.0% |
| 2018 | 35.1% | 32.6% |
| 2019 | 35.8% | 33.1% |
| 2021 | 37.1% | 35.0% |
| 2022 | 37.7% | 35.7% |
| 2023 | 38.3% | 36.2% |
| 2024 | 39.2% | 36.8% |
| 2025 | 39.1% | 37.4% |
Embed
Median gross rent, in 2025 dollars
+10.7% in the state and +18.5% in the US.
Source: ACS 1-year, 2015 to 2025, table A18009.
Show data
| Illinois | United States | |
|---|---|---|
| 2015 | $1,282 | $1,314 |
| 2016 | $1,285 | $1,327 |
| 2017 | $1,290 | $1,340 |
| 2018 | $1,286 | $1,368 |
| 2019 | $1,295 | $1,393 |
| 2021 | $1,325 | $1,427 |
| 2022 | $1,296 | $1,440 |
| 2023 | $1,317 | $1,496 |
| 2024 | $1,366 | $1,537 |
| 2025 | $1,419 | $1,557 |
Embed
Median home value, in 2025 dollars
+19.2% in the state and +39.3% in the US.
Source: ACS 1-year, 2015 to 2025, table A10036.
Show data
| Illinois | United States | |
|---|---|---|
| 2015 | $247,015 | $266,469 |
| 2016 | $252,255 | $277,278 |
| 2017 | $258,597 | $288,124 |
| 2018 | $262,913 | $296,908 |
| 2019 | $265,471 | $305,336 |
| 2021 | $277,336 | $337,116 |
| 2022 | $278,713 | $355,481 |
| 2023 | $280,119 | $361,931 |
| 2024 | $290,107 | $372,685 |
| 2025 | $294,400 | $371,100 |
Embed
ACS 1-year estimates. The dotted stretch of each line spans 2020, when the Census Bureau released no standard 1-year estimates. Dollar values are in 2025 dollars.
| Indicator | 2015 | 2025 | Change |
|---|---|---|---|
| Population | 12,859,995 | 12,719,141 | −1.1% |
| Median age | 37.7 | 39.7 | +2.0 years |
| 65 and over | 14.2% | 18.7% | +4.5 points |
| Born outside the US | 14.2% | 15.6% | +1.4 points |
| Hispanic or Latino | 16.9% | 19.8% | +2.9 points |
| Median household income | $81,637 | $86,676 | +6.2% |
| Living in poverty | 13.6% | 11.5% | −2.1 points |
| Bachelor’s degree or more | 32.9% | 39.1% | +6.2 points |
| Households that rent | 34.7% | 32.2% | −2.5 points |
| Median gross rent | $1,282 | $1,419 | +10.7% |
| Median home value | $247,015 | $294,400 | +19.2% |
3265 census tracts
Illinois, tract by tract
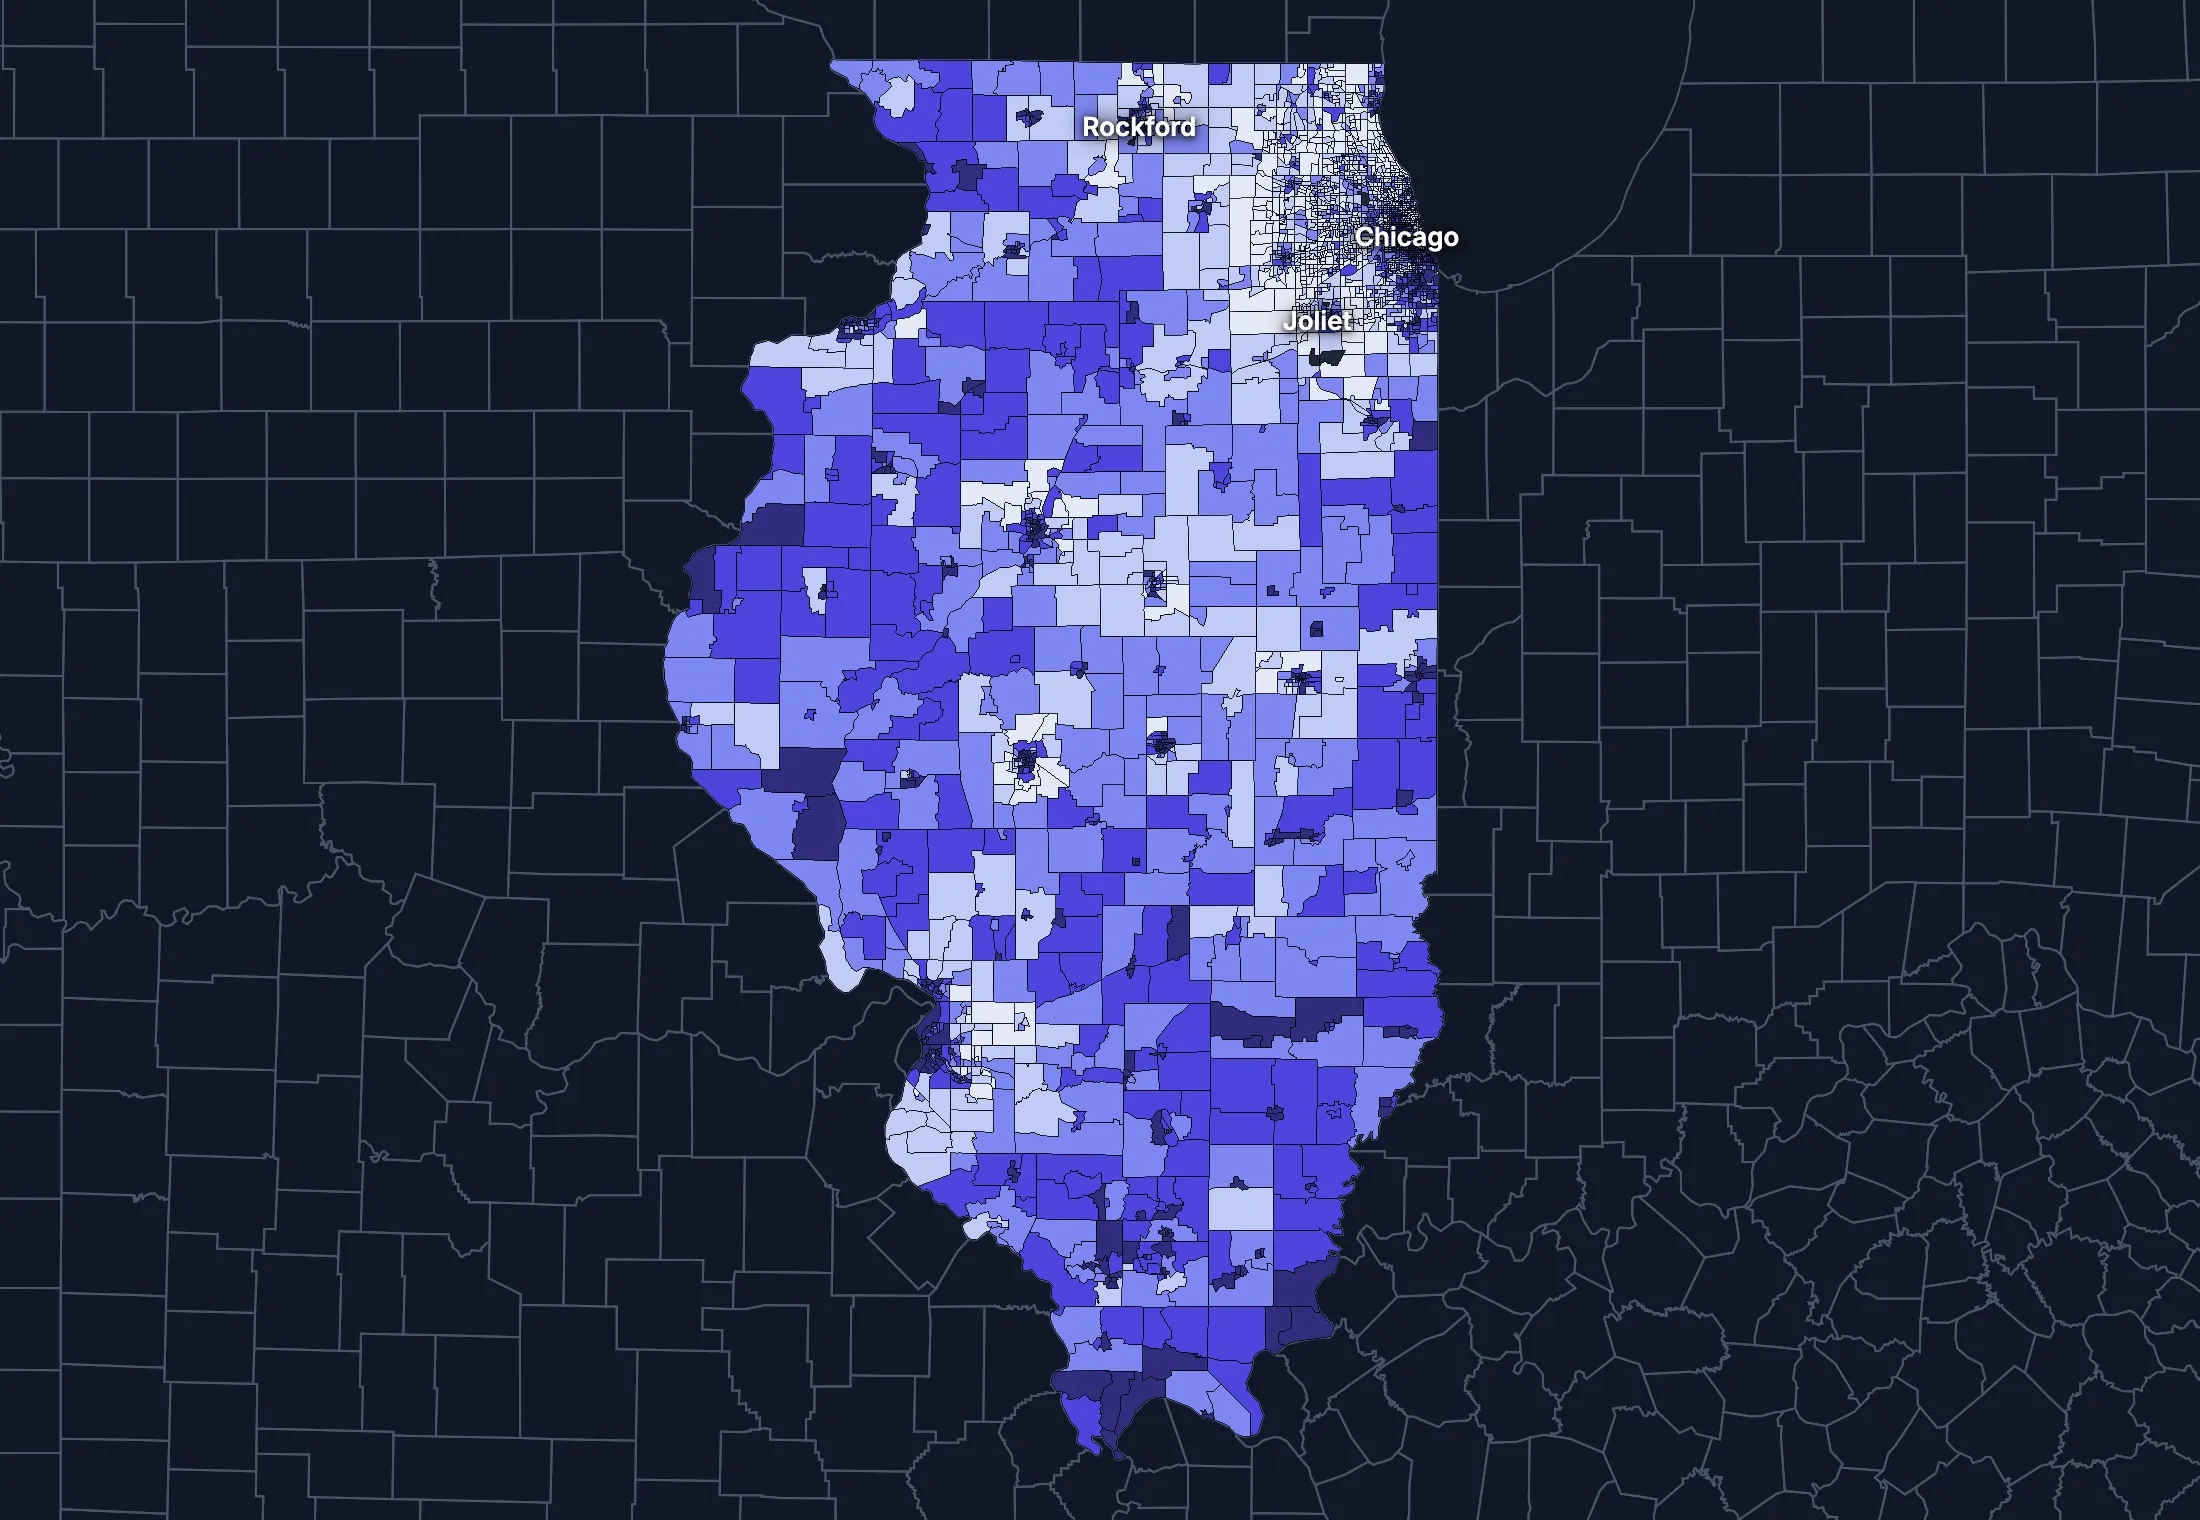
State averages hide a lot. These census tracts are the closest the census comes to neighborhoods.
Where the state’s average misleads
Each tick is one census tract, and the dark line marks the state. Hover over a tick or tap it to see the tract.
Poverty
813 of 3253 tracts are at least 1.5 times the state’s overall 11.8%, and 1075 are at two-thirds of it or less.
Highest: Tract 4.02, 89.0%. Lowest: Tract 7205, 0.0%.
Renters paying 30% or more of income
271 of 3114 tracts are at least 1.5 times the state’s overall 44.5%, and 724 are at two-thirds of it or less.
Highest: Tract 8278.04, 100.0%. Lowest: Tract 9719, 0.0%.
Adults with a bachelor’s degree
609 of 3257 tracts are at least 1.5 times the state’s overall 37.8%, and 1344 are at two-thirds of it or less.
Highest: Tract 2405, 97.3%. Lowest: Tract 9800, 0.0%.
Median household income
589 of 3231 tracts are at least 1.5 times the typical tract’s $79,091, and 536 are at two-thirds of it or less.
Highest: Tract 623, $250,000 or more. Lowest: Tract 4.01, under $2,500.
American Community Survey 2020–2024 5-year estimates, by census tract. Income is capped at $250,000+ by the Census Bureau.
People
Who lives in Illinois
Its median age of 39.7 is higher than the US (39.5). 15.6% of residents were born outside the US, and 25.0% speak a language other than English at home.
Age
Source: ACS 2025 1-year, table A01001.
Show data
| Illinois | United States | |
|---|---|---|
| Under 18 | 20.5% ±0.2% , number 2,609,568 ±20,180 | 21.0% ±<0.1% , number 71,689,151 ±111,800 |
| 18 to 24 | 9.3% ±0.1% , number 1,182,750 ±15,810 | 9.3% ±<0.1% , number 31,716,680 ±98,660 |
| 25 to 34 | 13.8% ±0.1% , number 1,756,232 ±7,872 | 13.6% ±<0.1% , number 46,357,354 ±55,690 |
| 35 to 44 | 13.4% ±0.2% , number 1,702,493 ±20,930 | 13.4% ±<0.1% , number 45,746,189 ±105,700 |
| 45 to 54 | 12.1% ±0.1% , number 1,540,844 ±6,516 | 11.8% ±<0.1% , number 40,257,563 ±53,540 |
| 55 to 64 | 12.2% ±0.2% , number 1,546,004 ±19,140 | 12.1% ±<0.1% , number 41,242,904 ±104,700 |
| 65 to 74 | 10.7% ±0.1% , number 1,362,189 ±16,900 | 10.8% ±<0.1% , number 36,895,650 ±91,520 |
| 75 and over | 8.0% ±0.1% , number 1,019,061 ±13,930 | 8.2% ±<0.1% , number 27,879,368 ±78,140 |
Embed
Race and ethnicity
Source: ACS 2025 1-year, table A04001.
Show data
| Illinois | United States | |
|---|---|---|
| White, not Hispanic | 55.8% ±0.1% , number 7,097,567 ±10,460 | 55.0% ±<0.1% , number 187,959,031 ±58,340 |
| Hispanic or Latino | 19.8% ±<0.1% , number 2,522,094 ±1,418 | 20.5% ±<0.1% , number 69,975,516 ±13,270 |
| Black, not Hispanic | 13.2% ±0.1% , number 1,681,738 ±13,800 | 11.7% ±<0.1% , number 40,096,453 ±106,200 |
| Asian, not Hispanic | 6.5% ±0.1% , number 830,337 ±9,558 | 6.5% ±<0.1% , number 22,096,709 ±58,340 |
| Other or multiracial | 4.6% ±0.2% , number 587,405 ±19,310 | 6.3% ±<0.1% , number 21,657,150 ±150,100 |
Embed
Language spoken at home
Source: ACS 2025 1-year, table C16001.
Show data
| Illinois | United States | |
|---|---|---|
| English only | 75.0% ±0.3% , number 9,060,095 ±34,500 | 77.1% ±0.1% , number 249,390,588 ±275,300 |
| Spanish | 14.5% ±0.2% , number 1,754,221 ±23,530 | 13.9% ±0.1% , number 44,921,985 ±177,800 |
| Other Indo-European | 5.9% ±0.2% , number 716,302 ±27,020 | 4.0% ±<0.1% , number 12,862,980 ±113,500 |
| Asian and Pacific Island | 3.3% ±0.1% , number 402,225 ±17,240 | 3.8% ±<0.1% , number 12,288,841 ±99,740 |
| Arabic and other | 1.2% ±0.1% , number 148,798 ±14,230 | 1.3% ±<0.1% , number 4,116,949 ±71,480 |
Embed
Marital status
Source: ACS 2025 1-year, table A11001.
Show data
| Illinois | United States | |
|---|---|---|
| Now married | 46.5% ±0.3% , number 4,923,727 ±35,550 | 47.9% ±0.1% , number 135,567,564 ±223,300 |
| Never married | 37.1% ±0.3% , number 3,933,448 ±27,240 | 34.8% ±0.1% , number 98,647,238 ±152,600 |
| Divorced | 9.6% ±0.2% , number 1,013,783 ±20,660 | 10.2% ±<0.1% , number 28,879,967 ±112,900 |
| Widowed | 5.6% ±0.1% , number 588,018 ±10,990 | 5.5% ±<0.1% , number 15,599,094 ±69,430 |
| Separated | 1.3% ±0.1% , number 133,980 ±8,221 | 1.6% ±<0.1% , number 4,441,399 ±49,160 |
Embed
Where people lived a year ago
Source: ACS 2025 1-year, table A08001.
Show data
| Illinois | United States | |
|---|---|---|
| Same home | 89.9% ±0.3% , number 11,318,775 ±34,490 | 88.4% ±0.1% , number 298,889,697 ±214,800 |
| Same county | 5.6% ±0.2% , number 710,352 ±28,190 | 6.0% ±<0.1% , number 20,202,671 ±166,300 |
| Another county in the state | 2.3% ±0.1% , number 286,578 ±16,310 | 3.0% ±<0.1% , number 10,168,097 ±89,190 |
| Another state | 1.7% ±0.1% , number 211,559 ±14,730 | 2.1% ±<0.1% , number 7,025,589 ±81,660 |
| Another country | 0.5% ±0.1% , number 68,956 ±8,387 | 0.6% ±<0.1% , number 1,984,943 ±47,210 |
Embed
Top countries of birth, among those born abroad
Source: ACS 2025 1-year, table A07001.
Show data
| Illinois | |
|---|---|
| Mexico | 31.6% , number 627,979 |
| India | 9.3% , number 184,712 |
| Poland | 5.8% , number 115,442 |
| Philippines | 4.7% , number 93,158 |
| China, Excluding Hong Kong and Taiwan | 4.3% , number 85,145 |
| Venezuela | 2.8% , number 55,313 |
Embed
All the numbers
| Indicator | Illinois | US | Rank among states* | Table |
|---|---|---|---|---|
| Population | 12,719,141 | 341,784,859 | 6th | A00001 |
| People per square mile | 229 | 97 | 13th | A00002 |
| Land area (square miles) | 55,514 | – | – | A00002 |
| Median age | 39.7 ±0.1 | 39.5 ±0.1 | 27th | A01004 |
| Under 18 | 20.5% ±0.2% , number 2,609,568 ±20,180 | 21.0% ±<0.1% , number 71,689,151 ±111,800 | 25th | B02002 |
| 65 and over | 18.7% ±0.2% , number 2,381,250 ±21,900 | 19.0% ±<0.1% , number 64,775,018 ±120,300 | 34th | B02002 |
| Born outside the US | 15.6% ±0.3% , number 1,984,938 ±34,740 | 14.7% ±0.1% , number 50,409,320 ±204,800 | 13th | A06001 |
| Speak a language other than English at home | 25.0% ±0.3% , number 3,021,546 ±42,230 | 22.9% ±0.1% , number 74,190,755 ±244,000 | 11th | C16001 |
| Veterans (adults) | 4.5% ±0.1% , number 450,893 ±9,624 | 5.9% ±<0.1% , number 15,746,228 ±85,320 | 44th | A16002 |
| Living with a disability | 12.5% ±0.2% , number 1,562,116 ±23,380 | 13.7% ±<0.1% , number 46,271,455 ±126,000 | 43rd | B18101 |
| Women 15–50 who had a baby in the past year | 4.6% ±0.3% , number 138,732 ±8,371 | 5.0% ±0.1% , number 4,016,759 ±44,040 | 35th | B13002 |
| Lived in the same home a year ago | 89.9% ±0.3% , number 11,318,775 ±34,490 | 88.4% ±0.1% , number 298,889,697 ±214,800 | 12th | A08001 |
| White, not Hispanic | 55.8% ±0.1% , number 7,097,567 ±10,460 | 55.0% ±<0.1% , number 187,959,031 ±58,340 | 36th | A04001 |
| Hispanic or Latino | 19.8% ±<0.1% , number 2,522,094 ±1,418 | 20.5% ±<0.1% , number 69,975,516 ±13,270 | 10th | A04001 |
| Black, not Hispanic | 13.2% ±0.1% , number 1,681,738 ±13,800 | 11.7% ±<0.1% , number 40,096,453 ±106,200 | 15th | A04001 |
| Asian, not Hispanic | 6.5% ±0.1% , number 830,337 ±9,558 | 6.5% ±<0.1% , number 22,096,709 ±58,340 | 11th | A04001 |
*1 is the highest. Population is ranked among all states, and the rest among those of 1,000 people or more, whose figures can be ranked. Ranks use 5-year estimates, the only ones covering every state, so they can differ slightly from the figures here.
Income and work
Incomes close to the US
The median household income is $86,676, higher than the US ($84,780). 11.5% of people live in poverty, and 7.2% have no health insurance, lower than the US (8.4%).
Household income
Source: ACS 2025 1-year, table A14001.
Show data
| Illinois | United States | |
|---|---|---|
| Under $25,000 | 14.1% ±0.4% , number 724,608 ±18,260 | 14.0% ±0.1% , number 18,727,548 ±88,990 |
| $25,000 to $49,999 | 14.7% ±0.3% , number 756,606 ±17,200 | 15.4% ±0.1% , number 20,665,585 ±101,400 |
| $50,000 to $74,999 | 14.7% ±0.3% , number 755,020 ±16,800 | 15.3% ±0.1% , number 20,513,565 ±88,500 |
| $75,000 to $99,999 | 12.7% ±0.3% , number 650,652 ±16,130 | 12.5% ±0.1% , number 16,814,245 ±87,520 |
| $100,000 to $149,999 | 18.4% ±0.4% , number 942,564 ±20,440 | 17.9% ±0.1% , number 24,018,984 ±99,670 |
| $150,000 to $199,999 | 10.3% ±0.2% , number 529,015 ±12,210 | 10.1% ±0.1% , number 13,521,827 ±70,660 |
| $200,000 or more | 15.1% ±0.3% , number 775,818 ±13,940 | 14.8% ±0.1% , number 19,801,668 ±84,120 |
Embed
What residents do for work
Source: ACS 2025 1-year, table A17004.
Show data
| Illinois | United States | |
|---|---|---|
| Education and health care | 24.9% ±0.4% , number 1,583,143 ±28,360 | 24.4% ±0.1% , number 40,862,193 ±140,800 |
| Professional and business services | 12.7% ±0.3% , number 808,267 ±16,450 | 12.8% ±0.1% , number 21,375,231 ±87,110 |
| Manufacturing | 11.4% ±0.3% , number 725,411 ±19,230 | 9.6% ±0.1% , number 16,064,394 ±91,270 |
| Retail trade | 9.8% ±0.2% , number 621,190 ±12,740 | 10.6% ±0.1% , number 17,781,181 ±96,660 |
| Arts, food and lodging | 8.2% ±0.2% , number 524,304 ±15,050 | 8.9% ±0.1% , number 14,811,502 ±87,840 |
| Finance, insurance and real estate | 7.5% ±0.2% , number 475,052 ±14,780 | 6.6% ±<0.1% , number 11,025,569 ±68,570 |
| Transportation and warehousing | 7.0% ±0.3% , number 448,231 ±16,520 | 5.9% ±<0.1% , number 9,832,211 ±73,020 |
| Construction | 5.2% ±0.2% , number 332,599 ±11,760 | 6.7% ±<0.1% , number 11,254,981 ±79,620 |
Embed
Where workers come from and go
Illinois has 5,943,827 jobs and 5,945,826 employed residents. 290,537 people commute in to work and 292,536 commute out, while 5,653,290 both live and work here. The most commuters come from Indiana.
Most commuters come from
- Indiana: 97,256
- Wisconsin: 58,086
- Missouri: 33,990
Most residents commute to
- Missouri: 99,437
- Wisconsin: 54,102
- Indiana: 51,033
Show data
| Illinois | |
|---|---|
| Live and work here | 5,653,290 |
| Work here, live elsewhere | 290,537 |
| Live here, work elsewhere | 292,536 |
Embed
All the numbers
| Indicator | Illinois | US | Rank among states* | Table |
|---|---|---|---|---|
| Median household income | $86,676 ±$814 | $84,780 ±$215 | 18th | A14006 |
| Income per person | $48,423 ±$405 | $47,171 ±$115 | 16th | A14024 |
| Income inequality (Gini index) | 0.478 ±0.004 | 0.482 ±0.001 | 9th | A14028 |
| Living in poverty | 11.5% ±0.3% , number 1,424,283 ±38,760 | 11.8% ±0.1% , number 39,264,183 ±277,400 | 26th | A13004 |
| Unemployment rate | 5.6% ±0.2% , number 375,861 ±15,030 | 4.9% ±<0.1% , number 8,574,594 ±64,350 | 9th | A17005 |
| No health insurance | 7.2% ±0.2% , number 903,164 ±25,240 | 8.4% ±<0.1% , number 28,323,306 ±152,000 | 28th | A20001 |
*1 is the highest. Population is ranked among all states, and the rest among those of 1,000 people or more, whose figures can be ranked. Ranks use 5-year estimates, the only ones covering every state, so they can differ slightly from the figures here.
Education
College degrees close to the US
39.1% of adults 25 and over have a bachelor’s degree or more, higher than the US (37.4%).
Highest level of education
Source: ACS 2025 1-year, table A12001.
Show data
| Illinois | United States | |
|---|---|---|
| Less than high school | 8.3% ±0.2% , number 741,888 ±18,920 | 9.4% ±0.1% , number 22,321,002 ±120,500 |
| High school only | 24.9% ±0.4% , number 2,222,895 ±35,050 | 25.6% ±0.1% , number 61,096,726 ±203,400 |
| Some college | 27.7% ±0.4% , number 2,471,147 ±33,500 | 27.7% ±0.1% , number 65,920,977 ±173,500 |
| Bachelor’s degree | 23.1% ±0.3% , number 2,058,151 ±29,760 | 22.3% ±0.1% , number 53,224,312 ±196,700 |
| Graduate degree | 16.0% ±0.3% , number 1,432,742 ±23,170 | 15.0% ±0.1% , number 35,816,011 ±159,400 |
Embed
All the numbers
| Indicator | Illinois | US | Rank among states* | Table |
|---|---|---|---|---|
| Bachelor’s degree or more | 39.1% ±0.4% , number 3,490,893 ±37,710 | 37.4% ±0.1% , number 89,040,323 ±253,200 | 13th | A12001 |
| High school graduate or more | 91.7% ±0.7% , number 8,184,935 ±61,430 | 90.6% ±0.2% , number 216,058,026 ±368,200 | 31st | A12001 |
*1 is the highest. Population is ranked among all states, and the rest among those of 1,000 people or more, whose figures can be ranked. Ranks use 5-year estimates, the only ones covering every state, so they can differ slightly from the figures here.
Housing
Home values outran incomes
32.2% of households rent, lower than the US (34.7%). The median home is worth $294,400 and the median rent is $1,419. After inflation, home values rose 19% from 2015 to 2025, while household income rose 6%.
Housing costs and income, 2015 to 2025, after inflation
Source: ACS 1-year, table A10036, A18009, A14006.
Show data
| Illinois | United States | |
|---|---|---|
| Median home value | +19.2% | +39.3% |
| Median rent | +10.7% | +18.5% |
| Median household income | +6.2% | +10.9% |
Embed
Types of homes
Source: ACS 2025 1-year, table A10032.
Show data
| Illinois | United States | |
|---|---|---|
| Single-family, detached | 58.0% ±0.3% , number 3,191,762 ±15,740 | 60.9% ±0.1% , number 90,335,844 ±173,300 |
| Single-family, attached | 6.2% ±0.2% , number 341,913 ±10,900 | 6.4% ±<0.1% , number 9,527,703 ±51,230 |
| 2 to 4 units | 11.2% ±0.3% , number 618,734 ±17,980 | 7.5% ±0.1% , number 11,109,005 ±75,790 |
| 5 to 19 units | 10.2% ±0.3% , number 561,205 ±17,110 | 8.7% ±0.1% , number 12,829,882 ±97,590 |
| 20 or more units | 12.3% ±0.3% , number 675,615 ±17,590 | 11.1% ±0.1% , number 16,381,450 ±92,310 |
| Mobile homes and other | 2.1% ±0.1% , number 114,303 ±5,678 | 5.4% ±<0.1% , number 8,045,083 ±53,680 |
Embed
When homes were built
Source: ACS 2025 1-year, table A10055.
Show data
| Illinois | United States | |
|---|---|---|
| 2010 or later | 7.3% ±0.3% , number 372,893 ±12,940 | 15.1% ±0.1% , number 20,257,912 ±101,300 |
| 2000 to 2009 | 11.5% ±0.3% , number 592,166 ±15,880 | 13.8% ±0.1% , number 18,535,840 ±92,260 |
| 1980 to 1999 | 19.8% ±0.4% , number 1,014,710 ±18,750 | 24.1% ±0.1% , number 32,332,570 ±118,900 |
| 1960 to 1979 | 25.3% ±0.4% , number 1,299,071 ±22,970 | 22.9% ±0.1% , number 30,726,302 ±110,000 |
| Before 1960 | 36.1% ±0.5% , number 1,855,443 ±25,930 | 24.0% ±0.1% , number 32,210,798 ±121,500 |
Embed
All the numbers
| Indicator | Illinois | US | Rank among states* | Table |
|---|---|---|---|---|
| Housing units | 5,503,532 | – | – | A10001 |
| Households | 5,134,283 ±13,760 | – | – | A10008 |
| People per household | 2.42 ±0.01 | 2.49 ±0.01 | 22nd | A10003 |
| Households that rent | 32.2% ±0.4% , number 1,655,530 ±22,540 | 34.7% ±0.1% , number 46,551,688 ±193,200 | 22nd | A10060 |
| Vacant homes | 6.7% ±0.3% , number 369,249 ±13,800 | 9.6% ±0.1% , number 14,165,545 ±137,100 | 45th | A10047, A10060 |
| Median gross rent | $1,419 ±$17 | $1,557 ±$4 | 24th | A18009 |
| Median home value | $294,400 ±$1,931 | $371,100 ±$646 | 32nd | A10036 |
| Renters paying 30% or more of income | 46.0% ±1.0% , number 761,428 ±20,090 | 48.3% ±0.2% , number 22,486,693 ±122,100 | 29th | A18002 |
| Owners paying 30% or more of income | 24.0% ±0.5% , number 836,007 ±17,280 | 24.2% ±0.1% , number 21,201,943 ±93,050 | 17th | A10040 |
| Homes built before 1960 | 36.1% ±0.5% , number 1,855,443 ±25,930 | 24.0% ±0.1% , number 32,210,798 ±121,500 | 8th | A10055 |
*1 is the highest. Population is ranked among all states, and the rest among those of 1,000 people or more, whose figures can be ranked. Ranks use 5-year estimates, the only ones covering every state, so they can differ slightly from the figures here.
Getting around
How people get around
66.4% of workers drive alone and 12.9% work from home. 42.9% of those who travel to work spend 30 minutes or more getting there, and 11.2% of households have no vehicle.
How people get to work
Source: ACS 2025 1-year, table A09005.
Show data
| Illinois | United States | |
|---|---|---|
| Drive alone | 66.4% ±0.5% , number 4,160,110 ±35,210 | 69.8% ±0.1% , number 115,297,377 ±192,900 |
| Carpool | 8.3% ±0.3% , number 522,173 ±17,630 | 8.9% ±0.1% , number 14,712,170 ±97,240 |
| Public transit | 7.8% ±0.3% , number 491,660 ±16,480 | 4.3% ±<0.1% , number 7,100,386 ±63,330 |
| Walk | 3.0% ±0.2% , number 188,701 ±11,070 | 2.4% ±<0.1% , number 4,016,469 ±41,070 |
| Work from home | 12.9% ±0.3% , number 809,769 ±17,560 | 12.9% ±0.1% , number 21,288,393 ±105,700 |
| Other | 1.6% ±0.1% , number 97,278 ±7,457 | 1.7% ±<0.1% , number 2,799,658 ±41,510 |
Embed
Time spent getting to work
Source: ACS 2025 1-year, table B09001.
Show data
| Illinois | United States | |
|---|---|---|
| Under 10 minutes | 11.8% ±0.3% , number 646,394 ±14,860 | 12.0% ±0.1% , number 17,199,225 ±93,440 |
| 10 to 19 minutes | 25.5% ±0.4% , number 1,390,606 ±24,070 | 27.8% ±0.1% , number 40,059,540 ±137,700 |
| 20 to 29 minutes | 19.8% ±0.4% , number 1,082,360 ±21,040 | 21.0% ±0.1% , number 30,221,743 ±111,100 |
| 30 to 39 minutes | 17.3% ±0.4% , number 946,322 ±20,880 | 17.1% ±0.1% , number 24,659,138 ±103,800 |
| 40 to 59 minutes | 14.8% ±0.3% , number 809,700 ±17,500 | 12.6% ±0.1% , number 18,104,709 ±97,070 |
| 60 minutes or more | 10.7% ±0.3% , number 584,540 ±15,580 | 9.5% ±0.1% , number 13,681,705 ±84,440 |
Embed
Vehicles per household
Source: ACS 2025 1-year, table A10030.
Show data
| Illinois | United States | |
|---|---|---|
| None | 11.2% ±0.3% , number 577,541 ±16,410 | 8.8% ±0.1% , number 11,781,997 ±77,240 |
| One | 36.0% ±0.5% , number 1,850,753 ±24,250 | 33.1% ±0.1% , number 44,424,682 ±160,700 |
| Two | 34.4% ±0.4% , number 1,765,335 ±23,090 | 36.0% ±0.1% , number 48,200,889 ±176,800 |
| Three or more | 18.3% ±0.3% , number 940,654 ±16,930 | 22.1% ±0.1% , number 29,655,854 ±113,300 |
Embed
All the numbers
| Indicator | Illinois | US | Rank among states* | Table |
|---|---|---|---|---|
| Drive to work alone | 66.4% ±0.5% , number 4,160,110 ±35,210 | 69.8% ±0.1% , number 115,297,377 ±192,900 | 40th | A09005 |
| Take public transit | 7.8% ±0.3% , number 491,660 ±16,480 | 4.3% ±<0.1% , number 7,100,386 ±63,330 | 5th | A09005 |
| Work from home | 12.9% ±0.3% , number 809,769 ±17,560 | 12.9% ±0.1% , number 21,288,393 ±105,700 | 19th | A09005 |
| Commute 30 minutes or more | 42.9% ±0.5% , number 2,340,562 ±31,390 | 39.2% ±0.1% , number 56,445,552 ±165,300 | 8th | B09001 |
| Households with no vehicle | 11.2% ±0.3% , number 577,541 ±16,580 | 8.8% ±<0.1% , number 11,781,997 ±64,240 | 5th | A10030 |
*1 is the highest. Population is ranked among all states, and the rest among those of 1,000 people or more, whose figures can be ranked. Ranks use 5-year estimates, the only ones covering every state, so they can differ slightly from the figures here.
Places
The largest cities in Illinois
Population, from the latest estimates available. Figures cover the whole of each place.
Largest cities
- Chicago: 2,731,618
- Aurora: 177,916
- Naperville: 152,469
- Joliet: 150,314
- Rockford: 146,207
- Elgin: 115,004
- Springfield: 112,437
- Peoria: 109,094
States like this one
- Georgia: 10,940,407
- Virginia: 8,705,170
- Washington: 7,816,116
- Oregon: 4,254,293
States at least a third this size, with the closest income, education, age, housing and origins.
Every county and place in Illinois
Find any county, city, town, metro area, ZIP code, school district or district in Illinois.
Counties
Each of the 102 counties with its population, from ACS 2020–2024 5-year estimates.
- Adams County64,754
- Alexander County4,875
- Bond County16,716
- Boone County53,230
- Brown County6,322
- Bureau County32,866
- Calhoun County4,330
- Carroll County15,576
- Cass County12,784
- Champaign County208,741
- Christian County33,538
- Clark County15,266
- Clay County13,052
- Clinton County36,954
- Coles County46,777
- Cook County5.18M
- Crawford County18,511
- Cumberland County10,334
- De Witt County15,373
- DeKalb County100,703
- Douglas County19,751
- DuPage County930,024
- Edgar County16,535
- Edwards County6,075
- Effingham County34,522
- Fayette County21,315
- Ford County13,406
- Franklin County37,323
- Fulton County33,020
- Gallatin County4,819
- Greene County11,683
- Grundy County53,219
- Hamilton County7,916
- Hancock County17,281
- Hardin County3,605
- Henderson County6,193
- Henry County48,643
- Iroquois County26,449
- Jackson County53,064
- Jasper County9,180
- Jefferson County36,550
- Jersey County21,274
- Jo Daviess County21,851
- Johnson County13,376
- Kane County517,255
- Kankakee County106,635
- Kendall County137,675
- Knox County49,046
- Lake County714,223
- LaSalle County108,714
- Lawrence County15,031
- Lee County33,869
- Livingston County35,565
- Logan County27,713
- Macon County101,849
- Macoupin County44,350
- Madison County264,238
- Marion County37,000
- Marshall County11,647
- Mason County12,745
- Massac County13,865
- McDonough County26,920
- McHenry County312,591
- McLean County171,556
- Menard County12,095
- Mercer County15,495
- Monroe County35,036
- Montgomery County27,942
- Morgan County33,021
- Moultrie County14,424
- Ogle County51,495
- Peoria County179,645
- Perry County20,639
- Piatt County16,695
- Pike County14,469
- Pope County3,739
- Pulaski County5,015
- Putnam County5,601
- Randolph County30,058
- Richland County15,598
- Rock Island County142,757
- Saline County23,213
- Sangamon County194,947
- Schuyler County6,787
- Scott County4,937
- Shelby County20,720
- St. Clair County253,694
- Stark County5,308
- Stephenson County43,768
- Tazewell County130,290
- Union County16,997
- Vermilion County72,386
- Wabash County11,119
- Warren County16,447
- Washington County13,627
- Wayne County15,973
- White County13,619
- Whiteside County54,947
- Will County701,462
- Williamson County66,876
- Winnebago County283,292
- Woodford County38,312
Cities, towns and other places
Each of the 1,445 with its population, from ACS 2020–2024 5-year estimates. Census-designated places are communities without a local government of their own, drawn by the Census Bureau so they can be counted.
- Abingdon3,443
- Adair215
- Adams106
- Addieville294
- Addison35,489
- Adeline82
- Albany776
- Albers1,280
- Albion2,001
- Alden48
- Aledo3,668
- Alexander239
- Alexis814
- Algonquin30,067
- Alhambra658
- Allendale499
- Allenville126
- Allerton205
- Alma285
- Alpha831
- Alsey258
- Alsip18,583
- Altamont2,282
- Alto Pass343
- Alton25,279
- Altona498
- Alvan (Alvin)230
- Amboy2,384
- Anchor206
- Andalusia1,021
- Andover434
- Andres41
- Anna4,196
- Annapolis54
- Annawan865
- Antioch14,859
- Apple Canyon Lake741
- Apple River290
- Arbury Hills1,519
- Arcola2,892
- Arenzville342
- Argenta879
- Argyle324
- Arlington157
- Arlington Heights76,005
- Armington343
- Aroma Park655
- Arrowsmith320
- Arthur2,083
- Ashkum918
- Ashland999
- Ashley412
- Ashmore721
- Ashton935
- Assumption1,205
- Astoria984
- Athens2,102
- Atkinson982
- Atlanta1,580
- Atwood1,144
- Auburn4,306
- Augusta669
- Aurora179,898
- Ava561
- Aviston2,387
- Avon694
- Baileyville99
- Baldwin355
- Banner157
- Bannockburn1,148
- Bardolph204
- Barrington11,077
- Barrington Hills3,879
- Barry1,512
- Barstow34
- Bartelso782
- Bartlett40,501
- Bartonville5,841
- Basco59
- Batavia27,151
- Batchtown237
- Bath224
- Bay View Gardens281
- Baylis102
- Beach Park14,115
- Beardstown6,169
- Beason142
- Beaverville289
- Beckemeyer993
- Bedford Park586
- Beecher4,728
- Beecher City414
- Belgium290
- Belknap115
- Belle Prairie City72
- Belle Rive382
- Belleville41,370
- Bellevue2,106
- Bellflower328
- Bellmont196
- Bellwood18,256
- Belvidere24,752
- Bement1,792
- Benld1,495
- Bensenville18,603
- Benson428
- Bentley22
- Benton6,863
- Berkeley5,199
- Berlin103
- Berwyn55,595
- Bethalto9,239
- Bethany1,176
- Big Rock1,548
- Biggsville294
- Bingham63
- Bishop Hill134
- Bismarck507
- Blairsville231
- Blandinsville666
- Bloomingdale22,457
- Bloomington78,907
- Blue Island21,741
- Blue Mound882
- Bluffs531
- Bluford483
- Bolingbrook74,096
- Bondville404
- Bone Gap220
- Bonfield473
- Bonnie461
- Bonnie Brae846
- Boody301
- Boulder Hill8,989
- Bourbonnais18,078
- Bowen552
- Braceville860
- Bradford772
- Bradley15,325
- Braidwood6,062
- Breese4,301
- Bridgeport1,826
- Bridgeview16,849
- Brighton2,306
- Brimfield750
- Broadlands274
- Broadview7,896
- Broadwell248
- Brocton275
- Brookfield19,331
- Brooklyn729
- Brookport733
- Broughton206
- Browning99
- Browns163
- Brownstown722
- Brussels214
- Bryant160
- Buckingham308
- Buckley422
- Buckner276
- Buda517
- Buffalo482
- Buffalo Grove42,891
- Buffalo Prairie9
- Bull Valley1,269
- Bulpitt185
- Buncombe329
- Bunker Hill1,178
- Burbank28,739
- Bureau Junction264
- Burlington425
- Burnham3,937
- Burnt Prairie43
- Burr Ridge11,141
- Burton149
- Burtons Bridge134
- Bush354
- Bushnell2,677
- Butler194
- Byron3,743
- Cabery235
- Cable122
- Cahokia Heights17,106
- Cairo1,682
- Caledonia226
- Calhoun227
- Calumet City35,100
- Calumet Park6,855
- Camargo456
- Cambria1,300
- Cambridge2,128
- Camden57
- Cameron280
- Camp Point1,230
- Campbell Hill328
- Campbell's Island203
- Campton Hills10,877
- Campus172
- Candlewick Lake5,448
- Canton13,144
- Cantrall142
- Capron1,311
- Carbon Cliff2,151
- Carbon Hill441
- Carbondale22,158
- Carlinville5,480
- Carlock500
- Carlyle2,980
- Carman250
- Carmi4,845
- Carol Stream39,460
- Carpentersville37,346
- Carrier Mills1,634
- Carrollton2,479
- Carterville5,818
- Carthage2,291
- Cary17,923
- Casey2,239
- Caseyville4,130
- Catlin2,160
- Cave-In-Rock210
- Cedar Point262
- Cedarville690
- Central City1,081
- Centralia11,856
- Cerro Gordo1,349
- Chadwick591
- Champaign89,996
- Chandlerville534
- Channahon13,927
- Channel Lake2,052
- Chapin668
- Charleston17,062
- Chatham14,639
- Chatsworth1,172
- Chebanse920
- Chemung239
- Chenoa1,647
- Cherry534
- Cherry Valley3,749
- Chester6,797
- Chesterfield201
- Chestnut347
- Chicago2.71M
- Chicago Heights26,736
- Chicago Ridge14,099
- Chillicothe5,900
- Chrisman1,214
- Christopher2,570
- Cicero82,797
- Cisco234
- Cisne627
- Cissna Park903
- Claremont195
- Clarendon Hills8,659
- Clay City723
- Clayton602
- Cleveland208
- Clifton1,385
- Clinton6,985
- Coal City5,317
- Coal Valley4,229
- Coalton357
- Coatsburg209
- Cobden1,170
- Coffeen592
- Colchester1,128
- Coleta169
- Colfax1,054
- Collinsville24,031
- Colona5,139
- Colp223
- Columbia11,127
- Columbus106
- Como535
- Compton259
- Concord162
- Congerville752
- Cooksville200
- Cordova666
- Cornell389
- Cornland24
- Cortland4,564
- Coulterville796
- Country Club Hills16,324
- Countryside6,267
- Cowden534
- Coyne Center904
- Crab Orchard394
- Crainville1,641
- Creal Springs324
- Crescent City456
- Crest Hill20,628
- Creston550
- Crestwood10,579
- Crete8,386
- Creve Coeur4,621
- Crossville679
- Crystal Lake40,579
- Crystal Lawns1,766
- Cuba1,004
- Cullom471
- Curran115
- Custer Park459
- Cutler302
- Cypress252
- Dahlgren595
- Dakota645
- Dallas City894
- Dalton City694
- Dalzell736
- Damiansville570
- Dana152
- Danforth611
- Danvers1,130
- Danville28,595
- Darien21,879
- Darmstadt18
- Davis535
- Davis Junction2,757
- Dawson536
- Dayton271
- De Land448
- De Pue1,532
- De Soto1,654
- De Witt176
- Decatur69,815
- Deer Creek654
- Deer Grove36
- Deer Park3,711
- Deerfield19,518
- DeKalb40,443
- Delavan1,489
- Des Plaines59,156
- Detroit30
- Dewey89
- Diamond2,984
- Dieterich1,169
- Divernon1,164
- Dix568
- Dixmoor2,948
- Dixon14,910
- Dolton20,825
- Dongola553
- Donnellson129
- Donovan281
- Dorchester182
- Dover133
- Dowell299
- Downers Grove50,054
- Downs1,641
- Du Bois122
- Du Quoin5,726
- Dundas272
- Dunfermline314
- Dunlap1,360
- Dupo3,879
- Durand1,592
- Dwight3,872
- Eagarville155
- Eagle Lake131
- Earlville1,942
- East Alton5,689
- East Brooklyn50
- East Cape Girardeau283
- East Carondelet233
- East Dubuque1,470
- East Dundee3,146
- East Galesburg713
- East Gillespie367
- East Hazel Crest1,068
- East Lynn373
- East Moline20,904
- East Peoria22,324
- East St. Louis17,999
- Easton285
- Eddyville64
- Edgewood351
- Edgington390
- Edinburg1,195
- Edwardsville26,474
- Effingham12,342
- El Dara118
- El Paso2,917
- Elburn6,354
- Eldorado3,771
- Eldred172
- Elgin114,934
- Elizabeth775
- Elizabethtown396
- Elk Grove Village31,987
- Elkhart533
- Elkville751
- Elliott258
- Ellis Grove359
- Ellisville80
- Ellsworth179
- Elmhurst45,671
- Elmwood2,327
- Elmwood Park23,868
- Elsah708
- Elvaston163
- Elwin40
- Elwood2,001
- Emden387
- Emington131
- Energy1,050
- Enfield546
- Equality609
- Erie1,614
- Essex1,026
- Eureka5,007
- Evanston76,340
- Evansville781
- Evergreen Park19,420
- Ewing341
- Exeter106
- Fairbury3,713
- Fairfield4,561
- Fairmont2,617
- Fairmont City2,492
- Fairmount555
- Fairview324
- Fairview Heights16,745
- Farina570
- Farmer City1,885
- Farmersville763
- Farmington2,050
- Fayetteville357
- Ferris105
- Fidelity71
- Fieldon200
- Fillmore241
- Findlay674
- Fisher1,605
- Fithian578
- Flanagan849
- Flat Rock337
- Flora4,475
- Florence14
- Flossmoor9,391
- Foosland37
- Ford Heights1,331
- Forest City223
- Forest Lake1,865
- Forest Park13,943
- Forest View1,174
- Forrest994
- Forreston1,360
- Forsyth3,502
- Fowler32
- Fox Lake11,131
- Fox Lake Hills2,399
- Fox River Grove4,523
- Frankfort20,651
- Frankfort Square9,560
- Franklin650
- Franklin Grove988
- Franklin Park18,197
- Freeburg4,592
- Freeman Spur149
- Freeport23,505
- Fulton3,709
- Fults12
- Gages Lake10,819
- Galatia913
- Galena2,931
- Galesburg29,481
- Galt213
- Galva2,454
- Garden Prairie403
- Gardner1,410
- Garrett88
- Gays165
- Geneseo6,673
- Geneva21,258
- Genoa5,492
- Georgetown3,069
- German Valley467
- Germantown1,350
- Germantown Hills3,436
- Gibson City3,434
- Gifford822
- Gilberts8,606
- Gillespie2,815
- Gilman1,612
- Gilson120
- Girard1,743
- Gladstone237
- Glasford720
- Glasgow179
- Glen Carbon13,977
- Glen Ellyn28,390
- Glencoe8,701
- Glendale Heights32,808
- Glenview47,752
- Glenwood8,603
- Godfrey17,712
- Godley602
- Golconda691
- Golden693
- Golden Gate87
- Golf518
- Good Hope438
- Goodfield985
- Goofy Ridge125
- Goreville1,236
- Gorham248
- Grafton734
- Grand Detour297
- Grand Ridge584
- Grand Tower502
- Grandview1,243
- Grandwood Park5,262
- Granite City26,549
- Grant Park1,449
- Grantfork459
- Granville1,472
- Grayslake20,929
- Grayville1,590
- Green Oaks4,096
- Green Valley683
- Greenfield1,105
- Greenup1,823
- Greenview912
- Greenville7,235
- Greenwood502
- Gridley1,390
- Griggsville1,310
- Gulfport92
- Gurnee30,510
- Hainesville3,524
- Hamburg68
- Hamel1,134
- Hamilton2,714
- Hammond617
- Hampshire8,524
- Hampton1,926
- Hanaford332
- Hanna City1,330
- Hanover829
- Hanover Park36,732
- Hardin663
- Harding18
- Harmon100
- Harrisburg8,372
- Harrison830
- Harristown1,550
- Hartford1,334
- Hartland105
- Hartsburg415
- Harvard9,598
- Harvel201
- Harvey20,230
- Harwood Heights8,821
- Havana2,989
- Hawthorn Woods9,143
- Hazel Crest13,792
- Hebron1,261
- Hecker521
- Henderson284
- Hennepin929
- Henning236
- Henry2,441
- Heritage Lake1,522
- Herrick333
- Herrin12,226
- Herscher1,246
- Hettick153
- Heyworth2,573
- Hickory Hills14,526
- Hidalgo60
- Highland10,262
- Highland Park30,398
- Highwood5,301
- Hillcrest1,824
- Hillsboro5,803
- Hillsdale451
- Hillside8,084
- Hillview99
- Hinckley2,331
- Hindsboro368
- Hinsdale17,175
- Hodgkins1,597
- Hoffman607
- Hoffman Estates51,175
- Holcomb152
- Holiday Hills634
- Holiday Shores2,782
- Hollowayville25
- Homer1,245
- Homer Glen24,529
- Hometown4,215
- Homewood19,294
- Hoopeston5,034
- Hooppole182
- Hopedale753
- Hopewell604
- Hopkins Park627
- Hoyleton523
- Hudson1,918
- Huey109
- Hull413
- Humboldt329
- Hume492
- Huntley28,005
- Hurst700
- Hutsonville590
- Illinois City73
- Illiopolis890
- Ina1,560
- Indian Creek874
- Indian Head Park3,974
- Indianola183
- Industry569
- Ingalls Park3,015
- Inverness7,275
- Iola90
- Ipava487
- Iroquois185
- Irving355
- Irvington774
- Irwin78
- Island Lake8,014
- Itasca9,355
- Iuka534
- Ivesdale209
- Jacksonville18,014
- Janesville39
- Jeffersonville263
- Jeisyville90
- Jerome1,807
- Jerseyville7,445
- Jewett251
- Johnsburg6,386
- Johnsonville72
- Johnston City3,327
- Joliet150,445
- Jonesboro1,870
- Joppa259
- Joslin56
- Joy387
- Junction42
- Junction City638
- Justice12,324
- Kampsville264
- Kane201
- Kaneville523
- Kangley302
- Kankakee23,996
- Kansas884
- Kappa226
- Karnak466
- Kaskaskia38
- Keenes58
- Keensburg149
- Keithsburg490
- Kell145
- Kempton258
- Kenilworth2,503
- Kenney349
- Kewanee11,913
- Keyesport635
- Kilbourne268
- Kildeer4,292
- Kincaid1,278
- Kinderhook249
- Kings332
- Kingston CDP132
- Kingston Mines182
- Kingston village1,352
- Kinmundy803
- Kinsman84
- Kirkland1,525
- Kirkwood754
- Knollwood1,864
- Knoxville3,211
- La Clede135
- La Fayette178
- La Grange15,998
- La Grange Park13,447
- La Harpe1,273
- La Moille750
- La Prairie48
- La Rose97
- Lacon1,916
- Ladd1,356
- Lake Barrington5,442
- Lake Bluff6,041
- Lake Camelot1,629
- Lake Carroll853
- Lake Catherine968
- Lake City92
- Lake Forest19,416
- Lake Holiday5,641
- Lake in the Hills28,800
- Lake Ka-Ho235
- Lake of the Woods2,091
- Lake Petersburg928
- Lake Summerset2,364
- Lake Villa8,683
- Lake Zurich19,832
- Lakemoor6,467
- Lakewood CDP16
- Lakewood Shores459
- Lakewood village4,707
- Lanark1,541
- Lane118
- Langleyville282
- Lansing28,284
- LaPlace170
- LaSalle9,498
- Latham297
- Lawrence358
- Lawrenceville3,941
- Le Roy3,236
- Leaf River477
- Lebanon4,474
- Lee320
- Leland1,065
- Leland Grove1,517
- Lemont17,820
- Lena2,761
- Lenzburg428
- Leonore97
- Lerna226
- Lewistown1,781
- Lexington2,126
- Liberty409
- Libertyville20,525
- Lily Lake1,293
- Lima224
- Limestone1,419
- Lincoln13,281
- Lincolnshire7,980
- Lincolnwood13,112
- Lindenhurst14,417
- Lisbon373
- Lisle23,407
- Litchfield6,834
- Literberry39
- Little York379
- Littleton105
- Liverpool70
- Livingston884
- Loami782
- Lockport26,409
- Lockport Heights890
- Loda279
- Lomax318
- Lombard43,619
- London Mills328
- Long Creek1,392
- Long Grove8,305
- Long Lake3,307
- Long Point245
- Longview78
- Loraine341
- Lorenzo28
- Lost Nation714
- Lostant407
- Louisville1,163
- Loves Park23,502
- Lovington1,045
- Lowpoint116
- Ludlow372
- Lyndon433
- Lynn Center36
- Lynnville85
- Lynwood9,083
- Lyons10,339
- Macedonia31
- Machesney Park22,630
- Mackinaw1,979
- Macomb14,894
- Macon1,047
- Madison2,900
- Maeystown65
- Magnolia232
- Mahomet10,049
- Makanda612
- Malden460
- Malta1,274
- Manchester197
- Manhattan11,026
- Manito1,692
- Manlius306
- Mansfield866
- Manteno9,030
- Maple Park1,573
- Mapleton332
- Maquon161
- Marcelline33
- Marengo7,040
- Marietta132
- Marine1,049
- Marion16,836
- Marissa1,232
- Mark574
- Markham11,355
- Marley96
- Maroa1,714
- Marquette Heights2,492
- Marseilles4,279
- Marshall4,040
- Martinsville1,187
- Martinton363
- Maryville8,316
- Mascoutah8,816
- Mason467
- Mason City2,159
- Matherville657
- Matteson18,645
- Mattoon16,586
- Maunie57
- Maywood23,201
- Mazon1,401
- McClure239
- McCook268
- McCullom Lake1,017
- McHenry28,074
- McLean708
- McLeansboro2,675
- McNabb233
- Mechanicsburg728
- Media153
- Medora316
- Melrose Park24,549
- Melvin430
- Mendon1,167
- Mendota6,994
- Menominee345
- Meredosia871
- Merrionette Park2,354
- Merritt56
- Metamora4,159
- Metcalf139
- Metropolis5,864
- Mettawa663
- Meyer22
- Middletown249
- Midlothian13,948
- Milan5,034
- Milford1,052
- Mill Creek37
- Mill Shoals126
- Millbrook243
- Milledgeville1,218
- Millersburg33
- Millington729
- Millstadt4,008
- Milton217
- Mineral194
- Minier1,102
- Minonk1,941
- Minooka12,891
- Mitchell1,092
- Modesto145
- Mokena20,021
- Moline42,197
- Momence3,291
- Monee5,108
- Monmouth8,581
- Monroe Center369
- Montgomery21,515
- Monticello6,304
- Montrose255
- Moro524
- Morris14,898
- Morrison3,739
- Morrisonville926
- Morton16,595
- Morton Grove24,619
- Mossville51
- Mound City681
- Mound Station150
- Mounds986
- Mount Auburn399
- Mount Carmel6,854
- Mount Carroll1,501
- Mount Clare292
- Mount Erie135
- Mount Morris2,726
- Mount Olive1,872
- Mount Prospect55,472
- Mount Pulaski1,507
- Mount Sterling1,980
- Mount Vernon14,090
- Mount Zion5,660
- Moweaqua1,915
- Muddy67
- Mulberry Grove765
- Mulkeytown117
- Muncie147
- Mundelein31,915
- Murphysboro6,735
- Murrayville617
- Nachusa82
- Naperville150,692
- Naplate589
- Naples108
- Nashville2,940
- Nason203
- Nauvoo931
- Nebo266
- Nekoma49
- Nelson125
- Neoga1,421
- Neponset446
- New Athens1,933
- New Baden3,463
- New Bedford43
- New Berlin1,442
- New Boston648
- New Burnside162
- New Canton230
- New Douglas346
- New Grand Chain151
- New Haven464
- New Holland216
- New Lenox28,006
- New Milford1,194
- New Minden218
- New Salem93
- Newark1,138
- Newman882
- Newton2,932
- Niantic671
- Niles30,064
- Nilwood151
- Niota39
- Noble649
- Nokomis2,147
- Nora180
- Normal53,569
- Norridge15,439
- Norris303
- Norris City1,624
- North Aurora18,696
- North Barrington3,143
- North Chicago30,643
- North City715
- North Henderson191
- North Pekin1,571
- North Riverside7,249
- North Utica1,282
- Northbrook34,585
- Northfield5,487
- Northlake12,513
- Norwood532
- O'Fallon32,262
- Oak Brook8,056
- Oak Forest26,805
- Oak Grove277
- Oak Lawn56,861
- Oak Park53,292
- Oak Run800
- Oakbrook Terrace2,723
- Oakdale264
- Oakford191
- Oakland862
- Oakwood1,380
- Oakwood Hills2,416
- Oblong1,634
- Oconee193
- Odell890
- Odin972
- Ogden754
- Oglesby3,570
- Ohio609
- Ohlman59
- Okawville1,299
- Old Mill Creek143
- Old Ripley125
- Old Shawneetown102
- Olive Branch499
- Olivet149
- Olmsted249
- Olney8,577
- Olympia Fields4,734
- Omaha171
- Onarga1,430
- Oneida719
- Opdyke246
- Ophiem92
- Oquawka1,059
- Orangeville1,045
- Oreana1,037
- Oregon3,851
- Orient417
- Orion1,812
- Orland Hills6,719
- Orland Park57,916
- Osco74
- Oswego36,375
- Ottawa18,447
- Otterville126
- Owaneco613
- Oxville21
- Paderborn20
- Palatine66,293
- Palestine1,430
- Palmer241
- Palmyra486
- Paloma161
- Palos Heights12,152
- Palos Hills18,081
- Palos Park4,816
- Pana5,217
- Panama420
- Panola36
- Papineau132
- Paris8,276
- Park City7,827
- Park Forest21,156
- Park Ridge38,667
- Parkersburg237
- Patoka498
- Paw Paw932
- Pawnee2,738
- Paxton4,131
- Payson1,100
- Pearl64
- Pearl City745
- Pecatonica2,024
- Pekin31,781
- Penfield190
- Peoria112,169
- Peoria Heights5,825
- Peotone4,587
- Percy921
- Perry206
- Peru9,775
- Pesotum557
- Petersburg2,341
- Phillipstown54
- Philo1,487
- Phoenix1,751
- Pierron414
- Pinckneyville5,018
- Pingree Grove10,914
- Piper City703
- Pistakee Highlands3,374
- Pittsburg682
- Pittsfield4,420
- Plainfield46,708
- Plainville183
- Plano12,203
- Plattville225
- Pleasant Hill970
- Pleasant Plains886
- Plum Valley520
- Plymouth456
- Pocahontas843
- Polo2,495
- Pontiac11,294
- Pontoon Beach6,025
- Pontoosuc108
- Poplar Grove3,923
- Port Barrington1,477
- Port Byron1,854
- Posen5,292
- Potomac605
- Prairie City378
- Prairie du Rocher454
- Prairie Grove2,165
- Prairietown183
- Preemption127
- Prestbury2,045
- Preston Heights2,449
- Princeton7,975
- Princeville1,837
- Prophetstown1,903
- Prospect Heights15,618
- Pulaski218
- Quincy39,109
- Radom146
- Raleigh235
- Ramsey1,094
- Rankin601
- Ransom245
- Rantoul12,421
- Rapids City980
- Raritan134
- Raymond1,030
- Red Bud3,782
- Reddick202
- Redmon169
- Rest Haven455
- Reynolds584
- Richmond2,622
- Richton Park12,521
- Richview208
- Ridge Farm827
- Ridgefield221
- Ridgewood2,795
- Ridgway779
- Ridott130
- Riggston30
- Ringwood730
- Rio205
- Ripley87
- Ritchie79
- River Forest11,992
- River Grove10,451
- Riverdale10,340
- Riverside9,039
- Riverton3,513
- Riverwoods4,013
- Roanoke1,967
- Robbins4,556
- Roberts487
- Robinson7,084
- Rochelle9,529
- Rochester3,766
- Rock City441
- Rock Falls8,587
- Rock Island36,151
- Rock Island Arsenal470
- Rockbridge146
- Rockdale2,553
- Rockford147,521
- Rockport67
- Rockton7,974
- Rockwood14
- Rolling Meadows24,027
- Rome1,947
- Romeoville41,152
- Roodhouse1,544
- Roscoe10,706
- Rose Hill54
- Roselle22,752
- Rosemont3,290
- Roseville823
- Rosewood Heights4,229
- Rosiclare961
- Rossville1,332
- Round Lake18,628
- Round Lake Beach27,079
- Round Lake Heights2,592
- Round Lake Park7,919
- Roxana1,556
- Royal292
- Royal Lakes301
- Royalton1,214
- Ruma394
- Rushville2,747
- Russellville87
- Rutland195
- Sadorus296
- Sailor Springs60
- Salem7,236
- Sammons Point223
- San Jose557
- Sandoval1,004
- Sandwich7,219
- Sauget307
- Sauk Village9,678
- Saunemin352
- Savanna2,816
- Savoy8,968
- Sawyerville200
- Saybrook744
- Scales Mound463
- Schaumburg76,868
- Schiller Park11,393
- Schram City578
- Sciota72
- Scott AFB3,957
- Scottville94
- Seaton228
- Seatonville370
- Secor300
- Seneca2,450
- Serena182
- Sesser2,023
- Seymour270
- Shabbona572
- Shannon772
- Shawneetown1,087
- Sheffield874
- Shelbyville4,351
- Sheldon1,195
- Sheridan2,519
- Sherman4,386
- Sherrard691
- Shiloh14,572
- Shipman618
- Shirley103
- Shorewood18,343
- Shumway260
- Sibley286
- Sidell440
- Sidney936
- Sigel439
- Silvis7,955
- Simpson40
- Sims123
- Skokie66,219
- Sleepy Hollow3,161
- Smithboro164
- Smithfield150
- Smithton3,680
- Smithville44
- Solon Mills38
- Somonauk1,569
- Sorento472
- South Barrington5,021
- South Beloit7,946
- South Chicago Heights3,907
- South Elgin24,217
- South Holland20,911
- South Jacksonville3,239
- South Pekin883
- South Roxana2,181
- South Wilmington600
- Southern View1,751
- Sparland295
- Sparta4,068
- Spaulding879
- Spillertown246
- Spring Bay520
- Spring Grove5,917
- Spring Valley5,476
- Springerton89
- Springfield113,330
- St. Anne1,104
- St. Augustine92
- St. Charles32,854
- St. David383
- St. Elmo1,257
- St. Francisville736
- St. Jacob1,759
- St. Johns184
- St. Joseph3,778
- St. Libory559
- St. Peter338
- St. Rose593
- Standard250
- Standard City182
- Stanford514
- Staunton4,298
- Ste. Marie281
- Steeleville1,855
- Steger9,418
- Sterling14,717
- Steward271
- Stewardson756
- Stickney6,952
- Stillman Valley1,260
- Stockton1,873
- Stone Park4,482
- Stonefort422
- Stonington655
- Stoy90
- Strasburg507
- Strawn94
- Streamwood39,001
- Streator12,330
- Stronghurst949
- Sublette454
- Sugar Grove9,240
- Sullivan4,348
- Summerfield248
- Summit10,846
- Sumner2,252
- Sun River Terrace636
- Sunnyland1,231
- Swansea14,710
- Swedona64
- Sycamore18,559
- Symerton132
- Table Grove306
- Tallula494
- Tamaroa597
- Tamms589
- Tampico565
- Taylor Ridge276
- Taylor Springs633
- Taylorville10,646
- Tennessee160
- Teutopolis1,729
- Thawville210
- Thayer531
- The Galena Territory1,735
- Thebes353
- Third Lake1,137
- Thomasboro918
- Thompsonville500
- Thomson1,757
- Thornton1,940
- Tilden762
- Tilton2,453
- Timberlane1,278
- Tinley Park54,842
- Tiskilwa751
- Toledo1,197
- Tolono3,566
- Toluca1,477
- Tonica717
- Topeka47
- Toulon1,485
- Tovey629
- Towanda350
- Tower Hill422
- Tower Lakes1,106
- Tremont2,366
- Trenton2,664
- Trilla122
- Triumph83
- Trivoli365
- Trout Valley574
- Troy11,647
- Troy Grove300
- Tuscola4,808
- Twin Grove1,458
- Ullin419
- Union624
- Union Hill73
- Unity77
- University Park7,306
- Urbana39,341
- Ursa726
- Valier523
- Valley City12
- Valmeyer1,090
- Vandalia5,796
- Varna387
- Venedy161
- Venetian Village2,334
- Venice1,636
- Vergennes303
- Vermilion219
- Vermont698
- Vernon69
- Vernon Hills26,876
- Verona272
- Versailles441
- Victoria254
- Vienna1,873
- Villa Grove2,349
- Villa Park22,345
- Viola899
- Virden3,171
- Virgil312
- Virginia1,543
- Volo6,706
- Wadsworth3,686
- Waggoner169
- Walnut1,282
- Walnut Hill127
- Walshville158
- Waltonville294
- Wamac804
- Wapella480
- Warren1,396
- Warrensburg921
- Warrenville14,718
- Warsaw1,518
- Washburn945
- Washington15,919
- Washington Park1,701
- Wataga710
- Waterloo11,129
- Waterman1,448
- Watseka4,780
- Watson620
- Wauconda14,027
- Waukegan89,076
- Waverly1,375
- Wayne2,562
- Wayne City920
- Waynesville375
- Weldon350
- Wellington165
- Wenona999
- Wenonah29
- West Brooklyn152
- West Chicago25,395
- West City662
- West Dundee7,906
- West Frankfort7,118
- West Liberty43
- West Peoria4,238
- West Point201
- West Salem713
- West Union140
- West York83
- Westchester16,436
- Western Springs13,446
- Westervelt134
- Westfield415
- Westlake Village1,414
- Westmont23,724
- Westville3,419
- Wheaton53,557
- Wheeler130
- Wheeling38,433
- White City244
- White Hall2,257
- White Heath163
- Whiteash301
- Williamsfield531
- Williamson160
- Williamsville1,314
- Willisville467
- Willow Hill304
- Willow Lake764
- Willow Springs5,868
- Willowbrook CDP1,913
- Willowbrook village9,131
- Wilmette27,503
- Wilmington city5,494
- Wilmington village92
- Wilsonville505
- Wilton Center58
- Winchester1,498
- Windsor city877
- Windsor village704
- Winfield10,095
- Winnebago2,981
- Winnetka12,484
- Winslow338
- Winthrop Harbor6,559
- Witt875
- Wonder Lake4,292
- Wood Dale13,933
- Wood River10,279
- Woodhull731
- Woodland297
- Woodlawn632
- Woodridge33,941
- Woodson550
- Woodstock26,147
- Worden1,094
- Worth10,700
- Wyanet966
- Wyoming1,578
- Xenia389
- Yale66
- Yates City500
- Yorkville23,617
- Zeigler1,267
- Zion24,600
Metro and micro areas
Each of the 33 that reach into Illinois, with its whole population, from ACS 2020–2024 5-year estimates. Metro and micro areas are counties tied together by commuting, drawn by the Office of Management and Budget.
- Bloomington, IL Metro Area171,556
- Burlington, IA-IL Micro Area44,680
- Canton, IL Micro Area33,020
- Cape Girardeau, MO-IL Metro Area98,169
- Carbondale, IL Micro Area53,064
- Centralia, IL Micro Area37,000
- Champaign-Urbana, IL Metro Area238,842
- Charleston-Mattoon, IL Micro Area46,777
- Chicago-Naperville-Elgin, IL-IN Metro Area9.37M
- Danville, IL Micro Area72,386
- Davenport-Moline-Rock Island, IA-IL Metro Area381,503
- Decatur, IL Metro Area101,849
- Dixon, IL Micro Area33,869
- Effingham, IL Micro Area44,856
- Freeport, IL Micro Area43,768
- Galesburg, IL Micro Area49,046
- Jacksonville, IL Micro Area37,958
- Kankakee, IL Metro Area106,635
- Lincoln, IL Micro Area27,713
- Macomb, IL Micro Area26,920
- Marion-Herrin, IL Micro Area66,876
- Mount Vernon, IL Micro Area36,550
- Ottawa, IL Micro Area147,181
- Paducah, KY-IL Metro Area102,748
- Peoria, IL Metro Area365,202
- Pontiac, IL Micro Area35,565
- Quincy, IL-MO Micro Area74,678
- Rochelle, IL Micro Area51,495
- Rockford, IL Metro Area336,522
- Springfield, IL Metro Area207,042
- St. Louis, MO-IL Metro Area2.81M
- Sterling, IL Micro Area54,947
- Taylorville, IL Micro Area33,538
ZIP codes
Each of the 1,390 with people in it, by the town it's centered in, from ACS 2020–2024 5-year estimates. These are the Census Bureau's ZIP Code Tabulation Areas, which follow the Postal Service's ZIP codes as closely as census blocks allow.
- 60002Antioch24,232
- 60004Arlington Heights51,835
- 60005Arlington Heights28,843
- 60007Elk Grove Village32,592
- 60008Rolling Meadows22,800
- 60010Barrington Hills45,747
- 60012Crystal Lake12,368
- 60013Cary26,694
- 60014Crystal Lake48,590
- 60015Riverwoods28,096
- 60016Des Plaines60,898
- 60018Chicago27,952
- 60020Fox Lake10,970
- 60021Fox River Grove4,996
- 60022Glencoe8,352
- 60025Glenview41,689
- 60026Glenview14,069
- 60029Golf518
- 60030Grayslake35,792
- 60031Gurnee37,107
- 60033Harvard12,999
- 60034Hebron2,033
- 60035Highland Park30,398
- 60040Highwood5,301
- 60041Long Lake9,024
- 60042Island Lake8,347
- 60043Kenilworth2,503
- 60044Lake Bluff10,312
- 60045Lake Forest21,074
- 60046Lake Villa34,613
- 60047Kildeer44,240
- 60048Libertyville29,124
- 60050McHenry31,781
- 60051Lakemoor24,621
- 60053Morton Grove24,619
- 60056Mount Prospect55,818
- 60060Mundelein37,344
- 60061Vernon Hills27,974
- 60062Northbrook41,406
- 60064North Chicago14,884
- 60067Palatine38,204
- 60068Park Ridge38,650
- 60069Lincolnshire8,502
- 60070Prospect Heights15,496
- 60071Richmond3,851
- 60072Ringwood870
- 60073Round Lake62,868
- 60074Palatine36,460
- 60075Wadsworth129
- 60076Skokie32,953
- 60077Skokie28,501
- 60081Spring Grove9,088
- 60083Wadsworth9,981
- 60084Wauconda17,192
- 60085Waukegan72,341
- 60087Waukegan27,293
- 60088North Chicago14,400
- 60089Buffalo Grove42,872
- 60090Wheeling38,298
- 60091Wilmette27,333
- 60093Winnetka19,867
- 60096Winthrop Harbor6,527
- 60097Wonder Lake11,983
- 60098Woodstock33,130
- 60099Zion30,881
- 60101Addison37,448
- 60102Algonquin32,286
- 60103Bartlett41,382
- 60104Bellwood18,256
- 60106Bensenville20,045
- 60107Streamwood38,886
- 60108Bloomingdale23,604
- 60109Burlington481
- 60110Carpentersville38,558
- 60111Kirkland257
- 60112Cortland4,621
- 60113Creston306
- 60115DeKalb42,536
- 60118West Dundee15,892
- 60119Elburn11,381
- 60120Elgin51,225
- 60123Elgin48,379
- 60124Elgin24,487
- 60126Elmhurst47,516
- 60129Creston229
- 60130Forest Park13,943
- 60131Franklin Park18,054
- 60133Hanover Park36,732
- 60134Geneva29,743
- 60135Genoa7,274
- 60136Gilberts8,777
- 60137Glen Ellyn38,696
- 60139Glendale Heights32,848
- 60140Hampshire22,689
- 60141Broadview195
- 60142Huntley29,692
- 60143Itasca11,324
- 60144Kaneville66
- 60145Kingston village2,464
- 60146Kirkland2,369
- 60148Lombard52,596
- 60150Malta1,738
- 60151Maple Park3,888
- 60152Marengo12,417
- 60153Maywood23,201
- 60154Westchester16,436
- 60155Broadview7,906
- 60156Lake in the Hills28,800
- 60157Roselle2,577
- 60160Melrose Park24,549
- 60162Hillside8,084
- 60163Berkeley5,199
- 60164Northlake20,872
- 60165Stone Park4,482
- 60169Hoffman Estates33,401
- 60171River Grove10,451
- 60172Roselle24,141
- 60173Schaumburg13,650
- 60174St. Charles31,402
- 60175Campton Hills25,553
- 60176Schiller Park11,393
- 60177South Elgin24,416
- 60178Sycamore22,224
- 60180Union1,831
- 60181Villa Park30,346
- 60183Campton Hills23
- 60184Wayne2,557
- 60185West Chicago33,703
- 60187Wheaton28,815
- 60188Carol Stream42,307
- 60189Wheaton31,042
- 60190Winfield11,826
- 60191Wood Dale14,396
- 60192Hoffman Estates16,461
- 60193Schaumburg40,146
- 60194Schaumburg19,756
- 60195Schaumburg4,397
- 60201Evanston43,744
- 60202Evanston32,341
- 60203Skokie4,680
- 60208Evanston255
- 60301Oak Park3,475
- 60302Oak Park32,862
- 60304Oak Park16,955
- 60305River Forest11,992
- 60401Beecher7,647
- 60402Berwyn63,721
- 60403Crest Hill18,371
- 60404Shorewood20,385
- 60406Blue Island23,327
- 60407Braceville1,812
- 60408Braidwood5,327
- 60409Calumet City35,100
- 60410Channahon14,239
- 60411Ford Heights52,175
- 60415Chicago Ridge14,099
- 60416Coal City9,550
- 60417Crete14,901
- 60418Crestwood10,572
- 60419Dolton20,825
- 60420Dwight4,682
- 60421Elwood3,649
- 60422Flossmoor9,542
- 60423Frankfort32,836
- 60424Gardner2,153
- 60425Glenwood8,714
- 60426Harvey23,906
- 60428Markham10,927
- 60429Hazel Crest14,864
- 60430Homewood19,838
- 60431Shorewood27,138
- 60432Ridgewood20,465
- 60433Ingalls Park16,382
- 60435Joliet48,167
- 60436Rockdale19,423
- 60437Kinsman117
- 60438Lansing28,806
- 60439Lemont24,192
- 60440Bolingbrook51,940
- 60441Lockport36,844
- 60442Manhattan13,753
- 60443Matteson20,663
- 60444Mazon1,901
- 60445Midlothian14,268
- 60446Romeoville41,672
- 60447Minooka16,102
- 60448Mokena24,405
- 60449Monee9,477
- 60450Morris20,783
- 60451New Lenox37,361
- 60452Oak Forest26,739
- 60453Oak Lawn56,861
- 60455Bridgeview16,872
- 60456Hometown4,215
- 60457Hickory Hills14,503
- 60458Justice14,200
- 60459Burbank28,739
- 60460Odell1,399
- 60461Olympia Fields4,761
- 60462Orland Park41,456
- 60463Palos Heights13,722
- 60464Palos Park9,773
- 60465Palos Hills18,081
- 60466Park Forest21,461
- 60467Orland Park24,398
- 60468Peotone5,809
- 60469Posen5,205
- 60470Ransom358
- 60471Richton Park12,848
- 60472Robbins4,563
- 60473South Holland21,225
- 60474South Wilmington663
- 60475Steger10,035
- 60476Thornton1,940
- 60477Tinley Park35,976
- 60478Country Club Hills16,390
- 60479Verona671
- 60480Willow Springs5,388
- 60481Lakewood Shores11,195
- 60482Worth10,897
- 60484University Park6,762
- 60487Tinley Park26,043
- 60490Bolingbrook22,156
- 60491Homer Glen22,757
- 60501Bedford Park11,432
- 60502Aurora23,308
- 60503Aurora16,789
- 60504Aurora39,358
- 60505Aurora57,199
- 60506Aurora50,038
- 60510Batavia29,038
- 60511Big Rock2,081
- 60512Yorkville1,090
- 60513Brookfield19,343
- 60514Clarendon Hills9,918
- 60515Downers Grove29,762
- 60516Downers Grove28,062
- 60517Woodridge33,156
- 60518Earlville3,289
- 60519Aurora61
- 60520Hinckley2,979
- 60521Hinsdale18,056
- 60523Oak Brook10,144
- 60525Countryside31,324
- 60526La Grange Park13,459
- 60527Burr Ridge29,028
- 60530Lee992
- 60531Leland1,885
- 60532Lisle28,547
- 60534Lyons10,327
- 60536Millbrook62
- 60537Millington726
- 60538Montgomery30,514
- 60539North Aurora313
- 60540Naperville42,252
- 60541Newark3,342
- 60542North Aurora18,932
- 60543Oswego43,047
- 60544Plainfield27,306
- 60545Plano14,392
- 60546Riverside16,322
- 60548Sandwich11,721
- 60549Serena784
- 60550Shabbona941
- 60551Sheridan5,058
- 60552Somonauk4,285
- 60553Steward722
- 60554Sugar Grove12,081
- 60555Warrenville15,223
- 60556Waterman2,138
- 60558Western Springs13,446
- 60559Westmont24,231
- 60560Yorkville28,795
- 60561Darien23,069
- 60563Naperville39,330
- 60564Naperville47,016
- 60565Naperville40,483
- 60585Plainfield25,960
- 60586Plainfield47,834
- 60601Chicago15,235
- 60602Chicago1,480
- 60603Chicago1,298
- 60604Chicago616
- 60605Chicago36,210
- 60606Chicago3,840
- 60607Chicago32,392
- 60608Chicago80,737
- 60609Chicago62,028
- 60610Chicago44,883
- 60611Chicago37,705
- 60612Chicago35,744
- 60613Chicago52,244
- 60614Chicago70,693
- 60615Chicago42,975
- 60616Chicago54,308
- 60617Chicago74,790
- 60618Chicago91,901
- 60619Chicago59,503
- 60620Chicago64,871
- 60621Chicago28,301
- 60622Chicago54,609
- 60623Chicago81,277
- 60624Chicago35,263
- 60625Chicago76,760
- 60626Chicago49,662
- 60628Chicago60,431
- 60629Chicago108,324
- 60630Chicago55,486
- 60631Chicago30,924
- 60632Chicago89,107
- 60633Chicago12,474
- 60634Chicago73,885
- 60636Chicago32,198
- 60637Chicago52,721
- 60638Chicago57,074
- 60639Chicago84,240
- 60640Chicago65,445
- 60641Chicago68,894
- 60642Chicago21,789
- 60643Chicago45,942
- 60644Chicago47,210
- 60645Chicago48,208
- 60646Chicago28,780
- 60647Chicago84,749
- 60649Chicago48,056
- 60651Chicago63,335
- 60652Chicago41,074
- 60653Chicago33,383
- 60654Chicago25,755
- 60655Chicago28,434
- 60656Chicago29,538
- 60657Chicago71,904
- 60659Chicago41,728
- 60660Chicago42,724
- 60661Chicago11,398
- 60706Norridge24,260
- 60707Elmwood Park41,116
- 60712Lincolnwood13,112
- 60714Niles30,305
- 60803Alsip22,106
- 60804Cicero82,797
- 60805Evergreen Park19,420
- 60827Riverdale24,713
- 60901Kankakee33,128
- 60910Aroma Park582
- 60911Ashkum1,325
- 60912Beaverville475
- 60913Bonfield1,683
- 60914Bourbonnais28,673
- 60915Bradley9,979
- 60917Buckingham449
- 60918Buckley754
- 60919Cabery520
- 60920Campus172
- 60921Chatsworth1,458
- 60922Chebanse2,088
- 60924Cissna Park1,565
- 60926Cissna Park50
- 60927Clifton2,300
- 60928Crescent City493
- 60929Cullom587
- 60930Danforth761
- 60931Donovan510
- 60932East Lynn373
- 60933Elliott258
- 60934Emington243
- 60935Essex1,259
- 60936Gibson City4,246
- 60938Gilman2,035
- 60940Grant Park3,322
- 60941Herscher1,627
- 60942Hoopeston5,657
- 60945Iroquois183
- 60946Kempton413
- 60948Loda1,660
- 60949Ludlow564
- 60950Manteno11,964
- 60951Martinton796
- 60952Melvin683
- 60953Milford2,075
- 60954Momence5,742
- 60955Onarga1,953
- 60956Papineau132
- 60957Paxton5,596
- 60958Hopkins Park1,698
- 60959Piper City904
- 60960Rankin946
- 60961Reddick740
- 60962Roberts589
- 60963Rossville1,460
- 60964St. Anne4,777
- 60966Sheldon1,385
- 60967Milford51
- 60968Thawville374
- 60969Union Hill73
- 60970Watseka5,991
- 60973Wellington347
- 60974Woodland297
- 61001Apple River1,226
- 61006Ashton1,541
- 61007Baileyville196
- 61008Belvidere33,582
- 61010Byron7,497
- 61011Caledonia2,676
- 61012Capron2,264
- 61013Cedarville690
- 61014Chadwick1,067
- 61015Kings901
- 61016Cherry Valley5,465
- 61018Dakota1,034
- 61019Davis3,461
- 61020Davis Junction3,149
- 61021Dixon22,308
- 61024Durand2,318
- 61025Menominee4,294
- 61027Lena33
- 61028Elizabeth1,683
- 61030Forreston2,194
- 61031Franklin Grove1,492
- 61032Willow Lake29,020
- 61036Galena7,121
- 61037Galt145
- 61038Garden Prairie1,274
- 61039German Valley824
- 61041Hanover1,338
- 61042Harmon404
- 61043Holcomb143
- 61044Stockton225
- 61046Lanark2,794
- 61047Leaf River1,622
- 61048Lena3,786
- 61049Monroe Center579
- 61050Orangeville199
- 61051Milledgeville1,469
- 61052Monroe Center1,145
- 61053Mount Carroll2,590
- 61054Mount Morris3,610
- 61057Nachusa30
- 61059Nora178
- 61060Orangeville1,554
- 61061Oregon6,766
- 61062Pearl City1,840
- 61063Pecatonica4,011
- 61064Polo3,757
- 61065Poplar Grove10,570
- 61067Ridott450
- 61068Hillcrest14,788
- 61070Rock City1,322
- 61071Rock Falls13,581
- 61072Rockton11,285
- 61073Roscoe20,194
- 61074Savanna3,962
- 61075Scales Mound986
- 61077Pecatonica97
- 61078Shannon1,459
- 61079Durand210
- 61080South Beloit10,955
- 61081Sterling20,844
- 61084Stillman Valley3,201
- 61085Stockton3,149
- 61087Warren1,588
- 61088Winnebago6,167
- 61089Winslow526
- 61091Polo248
- 61101Machesney Park19,318
- 61102Winnebago15,937
- 61103Machesney Park22,869
- 61104Rockford17,222
- 61107Rockford30,765
- 61108Rockford30,355
- 61109New Milford26,768
- 61111Loves Park23,286
- 61112Cherry Valley152
- 61114Rockford15,325
- 61115Machesney Park22,364
- 61201Rock Island36,766
- 61230Albany1,039
- 61231Aledo4,962
- 61232Andalusia1,469
- 61233Andover281
- 61234Annawan1,116
- 61235Atkinson1,283
- 61236Barstow34
- 61238Cambridge2,549
- 61239Carbon Cliff1,189
- 61240Coal Valley5,795
- 61241Colona6,587
- 61242Cordova1,135
- 61243Deer Grove155
- 61244East Moline23,308
- 61250Erie2,781
- 61251Erie377
- 61252Fulton5,437
- 61254Geneseo12,135
- 61256Hampton1,926
- 61257Hillsdale844
- 61258Hooppole182
- 61259Illinois City1,053
- 61260Joy737
- 61261Lyndon656
- 61262Lynn Center1,197
- 61263Matherville657
- 61264Oak Grove10,073
- 61265Moline43,748
- 61270Morrison6,912
- 61272New Boston1,437
- 61273Orion3,120
- 61274Osco197
- 61275Port Byron4,253
- 61276Preemption88
- 61277Prophetstown3,054
- 61278Rapids City678
- 61279Reynolds1,015
- 61281Cable2,520
- 61282Silvis8,394
- 61283Tampico1,269
- 61284Edgington2,599
- 61285Thomson2,728
- 61301Peru10,398
- 61310Amboy3,347
- 61311Long Point180
- 61312Cherry392
- 61313Ransom241
- 61314Buda686
- 61315Bureau Junction264
- 61316Cedar Point256
- 61317Cherry521
- 61318Compton595
- 61319Cornell1,286
- 61320Dalzell727
- 61321Dana224
- 61322De Pue1,530
- 61323Dover125
- 61324Nachusa97
- 61325Grand Ridge949
- 61326Granville1,953
- 61327Hennepin1,442
- 61328Ohio18
- 61329Ladd1,356
- 61330La Moille1,182
- 61332Leonore104
- 61333Long Point304
- 61334Lostant738
- 61335McNabb312
- 61336Magnolia694
- 61337Arlington558
- 61338Manlius299
- 61340Mark545
- 61341Marseilles7,692
- 61342Mendota8,543
- 61344Mineral264
- 61345Neponset770
- 61346New Bedford43
- 61348Oglesby4,375
- 61349Ohio1,151
- 61350Ottawa23,713
- 61353Paw Paw1,282
- 61354Peru10,290
- 61356Princeton10,799
- 61358Rutland407
- 61359Seatonville369
- 61360Seneca3,610
- 61361Mineral1,417
- 61362Spring Valley5,764
- 61363Standard250
- 61364Streator17,963
- 61367Sublette843
- 61368Tiskilwa1,273
- 61369Toluca1,594
- 61370Tonica1,215
- 61371Triumph83
- 61372Troy Grove300
- 61373North Utica2,123
- 61374La Moille56
- 61375Varna989
- 61376Walnut1,894
- 61377Wenona1,441
- 61378West Brooklyn513
- 61379Wyanet1,260
- 61401Galesburg30,580
- 61402Galesburg1,623
- 61410Abingdon3,838
- 61411Adair376
- 61412Alexis1,392
- 61413Alpha1,035
- 61414Altona696
- 61415Avon1,459
- 61416Bardolph204
- 61417Roseville182
- 61418Biggsville575
- 61419Bishop Hill134
- 61420Blandinsville968
- 61421Bradford1,231
- 61422Bushnell3,002
- 61423Cameron638
- 61424Bradford20
- 61425Carman672
- 61426Bradford41
- 61427Cuba2,014
- 61428Oak Run1,278
- 61430East Galesburg713
- 61431Ellisville279
- 61432Fairview544
- 61433Cuba22
- 61434Galva2,971
- 61435Alexis271
- 61436Gilson745
- 61437Gladstone549
- 61438Good Hope739
- 61439Henderson299
- 61440Industry744
- 61441Ipava945
- 61442Keithsburg504
- 61443Kewanee13,456
- 61447Kirkwood1,020
- 61448Knoxville3,947
- 61449La Fayette339
- 61450La Harpe1,812
- 61451Williamsfield272
- 61452Littleton157
- 61453Little York677
- 61454Lomax579
- 61455Macomb17,317
- 61458Maquon656
- 61459Marietta406
- 61460Raritan180
- 61462Monmouth10,458
- 61465Windsor village1,192
- 61466North Henderson263
- 61467Oneida1,159
- 61468Ophiem92
- 61469Oquawka1,818
- 61470Prairie City488
- 61471Raritan134
- 61472Rio453
- 61473Roseville1,279
- 61474St. Augustine221
- 61475Sciota180
- 61476Seaton551
- 61477Smithfield443
- 61478Media420
- 61479Princeville95
- 61480Stronghurst1,236
- 61482Table Grove492
- 61483Toulon1,801
- 61484Vermont738
- 61485Victoria417
- 61486Viola1,330
- 61488Henderson1,084
- 61489Williamsfield820
- 61490Woodhull1,035
- 61491Wyoming2,230
- 61501Astoria1,493
- 61516Benson627
- 61517Brimfield3,033
- 61519Bryant235
- 61520Canton16,291
- 61523Chillicothe10,203
- 61524Dunfermline299
- 61525Dunlap12,357
- 61526Dunlap1,105
- 61528Norwood3,212
- 61529Elmwood2,763
- 61530Eureka6,470
- 61531Farmington3,007
- 61532Forest City347
- 61533Glasford2,441
- 61534Green Valley1,725
- 61535Morton1,748
- 61536Hanna City3,503
- 61537Henry2,743
- 61539Kingston Mines147
- 61540Lacon2,753
- 61541La Rose97
- 61542Lewistown3,280
- 61543Liverpool70
- 61544London Mills784
- 61545Lowpoint722
- 61546Manito3,849
- 61547Mapleton3,562
- 61548Metamora12,037
- 61550Morton18,792
- 61552Mossville51
- 61553Norris303
- 61554Pekin40,577
- 61559Princeville3,595
- 61560Henry477
- 61561Roanoke2,393
- 61562Rome38
- 61563St. David383
- 61564South Pekin936
- 61565Sparland1,262
- 61567Goofy Ridge411
- 61568Tremont4,483
- 61569Trivoli938
- 61570Washburn1,503
- 61571Washington24,470
- 61572Yates City732
- 61602Peoria1,163
- 61603Peoria15,356
- 61604West Peoria28,313
- 61605Peoria13,424
- 61606Peoria6,684
- 61607Bartonville10,600
- 61610Creve Coeur4,621
- 61611East Peoria24,040
- 61614Peoria27,370
- 61615Peoria23,523
- 61616Peoria Heights5,825
- 61625Peoria456
- 61701Bloomington35,136
- 61704Bloomington37,279
- 61705Twin Grove13,213
- 61720Anchor374
- 61721Armington552
- 61722Arrowsmith658
- 61723Atlanta2,005
- 61724Bellflower369
- 61725Carlock1,459
- 61726Chenoa2,546
- 61727Clinton9,033
- 61728Colfax1,359
- 61729Congerville1,263
- 61730Cooksville361
- 61731Anchor76
- 61732Danvers2,099
- 61733Deer Creek984
- 61734Delavan2,443
- 61735De Witt360
- 61736Downs2,673
- 61737Ellsworth416
- 61738El Paso4,099
- 61739Fairbury4,628
- 61740Flanagan1,377
- 61741Forrest1,549
- 61742Goodfield1,542
- 61743Flanagan113
- 61744Gridley2,157
- 61745Heyworth4,542
- 61747Hopedale1,441
- 61748Hudson2,675
- 61749Kenney653
- 61750Lane118
- 61751Atlanta32
- 61752Le Roy4,332
- 61753Lexington2,833
- 61754McLean1,131
- 61755Mackinaw4,364
- 61756Maroa2,542
- 61759Minier1,359
- 61760Minonk2,226
- 61761Normal54,075
- 61764Pontiac13,668
- 61769Saunemin641
- 61770Saybrook1,067
- 61771Secor1,106
- 61772Shirley273
- 61773Sibley367
- 61774Stanford949
- 61775Strawn187
- 61776Towanda1,285
- 61777Wapella956
- 61778Waynesville547
- 61801Urbana27,891
- 61802Urbana20,293
- 61810Allerton265
- 61811Alvan578
- 61812Royal322
- 61813Bement2,043
- 61814Bismarck1,155
- 61815Bondville335
- 61816Broadlands377
- 61817Catlin2,328
- 61818Cerro Gordo1,560
- 61820Champaign40,599
- 61821Champaign28,611
- 61822Champaign27,642
- 61830Cisco510
- 61831Potomac160
- 61832Danville32,450
- 61833Tilton1,658
- 61834Danville7,821
- 61839De Land558
- 61840Dewey612
- 61841Fairmount1,112
- 61842Farmer City2,620
- 61843Fisher1,934
- 61844Fithian1,031
- 61845Foosland233
- 61846Georgetown4,467
- 61847Gifford1,144
- 61848Henning236
- 61849Homer1,961
- 61850Indianola350
- 61851Ivesdale279
- 61852Longview172
- 61853Lake of the Woods14,831
- 61854Mansfield1,299
- 61855Cerro Gordo24
- 61856Monticello8,226
- 61857Muncie147
- 61858Oakwood2,639
- 61859Ogden1,227
- 61862Penfield581
- 61863Pesotum844
- 61864Philo2,003
- 61865Potomac1,167
- 61866Rantoul13,470
- 61870Ridge Farm1,085
- 61871Royal296
- 61872Sadorus620
- 61873St. Joseph5,779
- 61874Savoy8,811
- 61875Seymour846
- 61876Sidell717
- 61877Sidney1,106
- 61878Thomasboro1,127
- 61880Tolono4,367
- 61882Weldon777
- 61883Westville4,384
- 61884White Heath973
- 61910Arcola4,769
- 61911Arthur4,508
- 61912Ashmore1,255
- 61913Atwood1,300
- 61914Bethany1,771
- 61917Brocton420
- 61919Camargo728
- 61920Charleston20,951
- 61924Chrisman2,274
- 61925Dalton City1,182
- 61928Gays776
- 61929Hammond672
- 61930Hindsboro687
- 61931Humboldt1,350
- 61932Hume525
- 61933Kansas1,286
- 61936LaPlace170
- 61937Lovington1,782
- 61938Mattoon20,350
- 61940Metcalf259
- 61941Newman168
- 61942Newman1,161
- 61943Oakland1,396
- 61944Paris11,261
- 61949Redmon171
- 61951Sullivan7,787
- 61953Tuscola6,518
- 61955Vermilion202
- 61956Villa Grove2,960
- 61957Windsor city1,707
- 62001Alhambra1,869
- 62002Alton29,543
- 62006Batchtown667
- 62009Benld1,723
- 62010Bethalto11,028
- 62011Bingham227
- 62012Brighton6,672
- 62013Brussels578
- 62014Bunker Hill3,669
- 62015Butler423
- 62016Carrollton3,882
- 62017Coffeen1,127
- 62018Rosewood Heights3,184
- 62019Donnellson314
- 62021Prairietown871
- 62022Elsah1,088
- 62023Eagarville139
- 62024East Alton9,493
- 62025Edwardsville35,520
- 62026Edwardsville851
- 62027Eldred516
- 62028Elsah1,385
- 62030Fidelity71
- 62031Fieldon517
- 62032Fillmore765
- 62033Gillespie4,294
- 62034Glen Carbon14,870
- 62035Godfrey15,892
- 62036Brussels574
- 62037Grafton1,814
- 62040Granite City40,404
- 62044Greenfield1,852
- 62045Hamburg247
- 62046Hamel1,102
- 62047Hardin1,548
- 62048Granite City1,347
- 62049Hillsboro7,871
- 62050Hillview268
- 62051Irving791
- 62052Jerseyville12,237
- 62053Kampsville351
- 62054Kane315
- 62056Litchfield8,528
- 62058Livingston884
- 62059Brooklyn729
- 62060Madison3,558
- 62061Marine1,487
- 62062Maryville8,277
- 62063Medora795
- 62067Moro2,203
- 62069Lake Ka-Ho2,897
- 62074New Douglas1,205
- 62075Nokomis3,330
- 62076Ohlman59
- 62077Panama420
- 62078Wilmington village73
- 62079Fidelity292
- 62080Ramsey3,255
- 62081Rockbridge329
- 62082Roodhouse2,265
- 62083Ohlman145
- 62084Roxana1,631
- 62085Sawyerville193
- 62086Sorento1,318
- 62087Hartford2,181
- 62088Staunton6,400
- 62089Taylor Springs487
- 62090Venice1,039
- 62091Walshville339
- 62092White Hall2,431
- 62093Wilsonville487
- 62094Witt1,107
- 62095Wood River10,726
- 62097Worden2,973
- 62098Greenfield104
- 62201East St. Louis4,921
- 62203East St. Louis5,465
- 62204Washington Park4,055
- 62205East St. Louis6,459
- 62206Cahokia Heights12,959
- 62207Cahokia Heights6,984
- 62208Fairview Heights16,821
- 62214Venedy1,048
- 62215Damiansville1,917
- 62216Aviston3,156
- 62217Baldwin767
- 62218Bartelso2,018
- 62219Beckemeyer993
- 62220Belleville19,152
- 62221Shiloh29,875
- 62223Belleville16,269
- 62225Scott AFB5,242
- 62226Swansea28,255
- 62230Breese6,377
- 62231Huey6,377
- 62232Caseyville7,063
- 62233Chester8,326
- 62234Collinsville31,648
- 62236Columbia14,154
- 62237Coulterville2,367
- 62238Cutler558
- 62239Cahokia Heights4,232
- 62240Dupo1,796
- 62241Ellis Grove879
- 62242Evansville1,660
- 62243Freeburg6,418
- 62244Fults928
- 62245Albers1,861
- 62246Greenville10,077
- 62248Hecker521
- 62249Highland16,205
- 62250Hoffman607
- 62253Keyesport932
- 62254Lebanon6,710
- 62255Lenzburg1,092
- 62256Maeystown35
- 62257Darmstadt2,046
- 62258Mascoutah10,437
- 62260Millstadt6,668
- 62261Ellis Grove80
- 62262Mulberry Grove1,967
- 62263Nashville4,819
- 62264New Athens3,097
- 62265New Baden4,555
- 62266Damiansville103
- 62268Oakdale764
- 62269O'Fallon35,923
- 62271Okawville1,873
- 62272Percy1,521
- 62273Pierron305
- 62274Pinckneyville8,041
- 62275Pocahontas3,012
- 62277Prairie du Rocher940
- 62278Red Bud6,281
- 62279Prairie du Rocher112
- 62280Rockwood421
- 62281St. Jacob3,059
- 62282St. Libory563
- 62284Smithboro686
- 62285Smithton4,239
- 62286Sparta5,491
- 62288Steeleville2,820
- 62289Summerfield273
- 62292Tilden762
- 62293Trenton4,433
- 62294Troy15,325
- 62295Valmeyer1,459
- 62297Ellis Grove158
- 62298Waterloo18,208
- 62301Quincy30,746
- 62305Quincy19,036
- 62311Augusta872
- 62312Barry1,931
- 62313Basco382
- 62314Baylis530
- 62316Bowen705
- 62319Camden218
- 62320Camp Point2,667
- 62321Carthage3,576
- 62323Perry198
- 62324Clayton1,196
- 62325Coatsburg465
- 62326Colchester2,236
- 62330Dallas City1,472
- 62334Elvaston163
- 62336Ferris84
- 62338Fowler1,075
- 62339Golden970
- 62340Griggsville1,673
- 62341Elvaston3,433
- 62343Hull611
- 62344Camden60
- 62345Kinderhook359
- 62346La Prairie164
- 62347Liberty1,977
- 62348Lima204
- 62349Loraine517
- 62351Mendon1,928
- 62352Milton217
- 62353Mount Sterling5,066
- 62354Nauvoo1,447
- 62355Nebo1,026
- 62356New Canton518
- 62357New Salem134
- 62358Niota525
- 62359Paloma184
- 62360Payson1,605
- 62361Pearl301
- 62362Perry237
- 62363Pittsfield5,561
- 62365Plainville464
- 62366Pleasant Hill1,450
- 62367Plymouth1,294
- 62370Rockport309
- 62373Lima225
- 62374Tennessee216
- 62375Mound Station383
- 62376Marcelline1,276
- 62378Versailles863
- 62379Warsaw1,854
- 62380West Point360
- 62401Effingham19,273
- 62410Allendale1,183
- 62411Altamont4,249
- 62413Annapolis329
- 62414Beecher City1,783
- 62417Bridgeport2,848
- 62418Brownstown1,809
- 62419Calhoun352
- 62420Casey4,299
- 62421Claremont366
- 62422Cowden926
- 62423Marshall546
- 62424Dieterich2,500
- 62425Dundas838
- 62426Edgewood778
- 62427Flat Rock1,730
- 62428Greenup2,777
- 62431Herrick717
- 62432Hidalgo601
- 62433Hutsonville1,140
- 62434Sailor Springs191
- 62436Jewett590
- 62438Lakewood CDP238
- 62439Lawrenceville7,033
- 62440Janesville1,107
- 62441Marshall7,003
- 62442Martinsville2,671
- 62443Mason1,609
- 62444Stewardson623
- 62445Montrose986
- 62446Mount Erie318
- 62447Neoga3,210
- 62448Newton5,356
- 62449Oblong2,951
- 62450Olney12,327
- 62451Palestine2,055
- 62452Parkersburg387
- 62454Robinson10,477
- 62458St. Elmo2,176
- 62459Ste. Marie281
- 62460St. Francisville1,202
- 62461Shumway625
- 62462Sigel971
- 62463Stewardson1,103
- 62464Stoy81
- 62465Strasburg806
- 62466Sumner4,001
- 62467Teutopolis3,710
- 62468Toledo2,344
- 62469Trilla552
- 62471Vandalia9,937
- 62473Watson1,264
- 62474Westfield626
- 62475West Liberty189
- 62476West Salem1,222
- 62477West Union526
- 62478West York333
- 62479Wheeler711
- 62480Willow Hill713
- 62481Yale398
- 62501Oreana2,324
- 62510Assumption1,677
- 62512Beason446
- 62513Blue Mound1,391
- 62514Boody297
- 62515Buffalo902
- 62517Bulpitt185
- 62518Chestnut509
- 62519Cornland24
- 62520Dawson1,652
- 62521Decatur32,665
- 62522Harristown15,185
- 62523Decatur707
- 62526Forsyth30,483
- 62530Divernon1,558
- 62531Edinburg1,816
- 62532Elwin40
- 62533Farmersville908
- 62534Findlay1,041
- 62535Forsyth3,502
- 62536Chatham1,049
- 62537Harristown272
- 62538Harvel342
- 62539Illiopolis1,412
- 62540Kincaid1,297
- 62541Cornland54
- 62543Latham477
- 62544Macon1,668
- 62545Mechanicsburg1,101
- 62546Morrisonville1,521
- 62547Mount Auburn574
- 62548Mount Pulaski2,090
- 62549Mount Zion6,454
- 62550Moweaqua2,858
- 62551Niantic820
- 62553Oconee318
- 62554Oreana1,832
- 62555Owaneco1,358
- 62556Palmer370
- 62557Pana6,878
- 62558Pawnee3,639
- 62560Raymond1,446
- 62561Spaulding4,842
- 62563Rochester5,766
- 62565Shelbyville7,559
- 62567Stonington831
- 62568Taylorville15,952
- 62570Tovey629
- 62571Tower Hill1,269
- 62572Waggoner420
- 62573Warrensburg1,147
- 62601Alexander344
- 62610Alsey233
- 62611Arenzville1,047
- 62612Ashland1,398
- 62613Athens3,598
- 62615Auburn5,198
- 62617Bath524
- 62618Beardstown7,428
- 62621Exeter1,133
- 62622Beardstown100
- 62624Browning321
- 62625Cantrall1,003
- 62626Carlinville7,876
- 62627Chandlerville1,006
- 62628Chapin917
- 62629Chatham15,413
- 62630Chesterfield924
- 62631Concord228
- 62633Easton638
- 62634Elkhart1,263
- 62635Emden661
- 62638Franklin1,485
- 62639Beardstown215
- 62640Girard3,391
- 62642Greenview1,396
- 62643Hartsburg797
- 62644Havana4,615
- 62649Hettick369
- 62650Jacksonville24,821
- 62655Kilbourne594
- 62656Lincoln18,234
- 62661Loami1,212
- 62663Manchester197
- 62664Mason City2,922
- 62665Meredosia1,222
- 62666Middletown485
- 62667Modesto569
- 62668Murrayville1,249
- 62670Berlin2,682
- 62671New Holland362
- 62672Nilwood151
- 62673Oakford361
- 62674Palmyra1,447
- 62675Petersburg6,170
- 62677Pleasant Plains2,149
- 62681Rushville5,553
- 62682San Jose684
- 62684Sherman5,760
- 62685Royal Lakes1,670
- 62688Tallula678
- 62689Thayer542
- 62690Virden3,838
- 62691Virginia2,349
- 62692Waverly2,005
- 62693Williamsville1,677
- 62694Winchester3,006
- 62695Woodson501
- 62701Springfield1,205
- 62702Springfield31,033
- 62703Southern View28,922
- 62704Leland Grove40,046
- 62707Springfield7,472
- 62711Springfield18,559
- 62712Rochester10,045
- 62801Centralia19,827
- 62803Hoyleton1,132
- 62806Albion3,436
- 62807Alma767
- 62808Ashley1,602
- 62809Mill Shoals267
- 62810Belle Rive1,188
- 62811Bellmont224
- 62812Benton11,611
- 62814Bluford1,668
- 62815Bone Gap350
- 62816Bonnie1,133
- 62817Broughton639
- 62818Browns409
- 62819Buckner247
- 62820Burnt Prairie96
- 62821Carmi6,668
- 62822Christopher2,581
- 62823Cisne1,823
- 62824Clay City1,485
- 62825North City254
- 62827Crossville1,147
- 62828Belle Prairie City1,801
- 62829Broughton22
- 62830Dix1,416
- 62831Du Bois339
- 62832Du Quoin8,865
- 62833Golden Gate280
- 62835Enfield1,398
- 62836Ewing891
- 62837Fairfield7,868
- 62838La Clede1,341
- 62839Flora6,183
- 62841Freeman Spur118
- 62842Jeffersonville724
- 62843Golden Gate87
- 62844Grayville1,937
- 62846Ina1,798
- 62848Irvington738
- 62849Iuka1,887
- 62850Johnsonville693
- 62851Keenes371
- 62852Keensburg119
- 62853Kell969
- 62854Kinmundy1,827
- 62856Hanaford332
- 62858Louisville3,554
- 62859McLeansboro5,004
- 62860Macedonia384
- 62861Maunie57
- 62862Burnt Prairie244
- 62863Bellmont9,379
- 62864Mount Vernon22,779
- 62865Mulkeytown2,037
- 62867New Haven568
- 62868Noble1,463
- 62869Norris City2,795
- 62870Odin2,281
- 62871Omaha866
- 62872Opdyke1,153
- 62874Orient440
- 62875Patoka1,039
- 62876Radom146
- 62877Richview437
- 62878Johnsonville177
- 62879Sailor Springs28
- 62880St. Peter658
- 62881Salem11,078
- 62882Sandoval2,057
- 62883Waltonville693
- 62884Sesser2,758
- 62885Vernon474
- 62886Sims332
- 62887Springerton104
- 62888Tamaroa1,843
- 62889Kell1,066
- 62890Thompsonville2,377
- 62891Valier514
- 62892Vernon150
- 62893Walnut Hill926
- 62894Waltonville782
- 62895Wayne City1,960
- 62896West Frankfort10,627
- 62897Ewing542
- 62898Woodlawn1,968
- 62899Xenia2,022
- 62901Carbondale22,946
- 62902Crainville4,135
- 62903Makanda2,666
- 62905Alto Pass779
- 62906Anna7,329
- 62907Ava2,013
- 62908Belknap440
- 62910Brookport1,993
- 62912Buncombe1,515
- 62914Cairo1,765
- 62915Cambria384
- 62916Campbell Hill925
- 62917Carrier Mills2,303
- 62918Carterville10,658
- 62919Cave-In-Rock819
- 62920Cobden2,959
- 62921Colp233
- 62922Creal Springs2,608
- 62923Cypress441
- 62924De Soto3,168
- 62926Dongola1,998
- 62927Dowell317
- 62928Eddyville103
- 62930Eldorado5,761
- 62931Elizabethtown1,348
- 62932Elkville1,152
- 62933Energy1,101
- 62934Equality833
- 62935Galatia2,178
- 62938Golconda2,622
- 62939Goreville2,958
- 62940Gorham645
- 62941New Grand Chain639
- 62942Grand Tower628
- 62943Simpson428
- 62946Harrisburg11,256
- 62947Eddyville408
- 62948Herrin12,758
- 62949Hurst702
- 62950Gorham76
- 62951Johnston City5,342
- 62952Jonesboro2,852
- 62953Joppa259
- 62954Junction411
- 62956Karnak1,172
- 62957McClure640
- 62958Makanda2,103
- 62959Marion27,793
- 62960Metropolis10,783
- 62961Mill Creek37
- 62963Mound City713
- 62964Mounds1,109
- 62965Muddy79
- 62966Murphysboro13,945
- 62967New Burnside309
- 62969Olive Branch314
- 62970Olmsted465
- 62972New Burnside1,056
- 62974Pittsburg1,536
- 62975Alto Pass207
- 62976Pulaski392
- 62977Raleigh599
- 62979Ridgway930
- 62982Rosiclare1,016
- 62983Royalton1,728
- 62984Shawneetown1,393
- 62985Simpson1,128
- 62987Stonefort1,724
- 62988Tamms1,149
- 62990Thebes973
- 62992Ullin629
- 62994Vergennes737
- 62995Vienna6,339
- 62996Olmsted523
- 62997Willisville561
- 62998Alto Pass218
- 62999Zeigler1,267
Towns and townships
Each of the 1,425 with people in it, from ACS 2020–2024 5-year estimates: the county subdivisions that are governments of their own. A city, borough or village that is one too is listed with the places above.
- Abington township433
- Adams township1,916
- Addison township87,658
- Aetna township641
- Afton township938
- Akron township1,136
- Alba township121
- Albany township823
- Alden township1,502
- Algonquin township88,108
- Alhambra township1,700
- Allen township407
- Allens Grove township395
- Allin township812
- Allison township502
- Alma township793
- Alto township608
- Alton township25,279
- Amboy township2,795
- Amity township908
- Anchor township251
- Andalusia township2,318
- Anderson township414
- Andover township606
- Annawan township1,084
- Antioch township27,680
- Appanoose township370
- Apple River township323
- Arcola township3,263
- Arenzville township645
- Arispie township894
- Aroma township4,895
- Arrington township366
- Arrowsmith township597
- Artesia township746
- Asbury township375
- Ash Grove township (Iroquois County)615
- Ash Grove township (Shelby County)626
- Ashkum township1,438
- Ashland township1,005
- Ashley township751
- Ashmore township1,255
- Ashton township1,133
- Assumption township1,401
- Astoria township1,158
- Athensville township93
- Atkinson township1,070
- Atlanta township1,846
- Atlas township361
- Auburn township (Clark County)469
- Auburn township (Sangamon County)5,866
- Audubon township354
- Augusta township828
- Aurora township126,432
- Austin township153
- Aux Sable township15,630
- Avena township1,888
- Avoca township414
- Avon township63,428
- Ayers township346
- Bainbridge township481
- Bald Bluff township71
- Bald Hill township805
- Ball township7,571
- Banner township (Effingham County)505
- Banner township (Fulton County)512
- Barnett township323
- Barnhill township572
- Barr township405
- Barren township311
- Barrington township16,233
- Barry township1,704
- Batavia township35,551
- Bath township652
- Bear Creek township (Christian County)464
- Bear Creek township (Hancock County)258
- Bear Grove township602
- Beardstown township6,617
- Beaucoup township668
- Beaver Creek township148
- Beaver township448
- Beaverville township408
- Bedford township1,004
- Bell Plain township207
- Belle Prairie township57
- Bellflower township424
- Belmont township2,235
- Belvidere township29,286
- Bement township1,905
- Bennington township1,641
- Benton township (Franklin County)8,623
- Benton township (Lake County)18,857
- Berlin township761
- Bernadotte township197
- Berreman township19
- Berry township193
- Berwick township168
- Berwyn township55,595
- Bethel township229
- Beverly township238
- Bible Grove township131
- Big Grove township1,730
- Big Mound township1,168
- Big Rock township2,110
- Big Spring township611
- Biggsville township494
- Bird township400
- Birmingham township66
- Bishop township1,899
- Blackberry township17,484
- Blackhawk township9,430
- Blair township714
- Blandinsville township871
- Blissville township546
- Bloom township83,966
- Bloomingdale township111,175
- Bloomington City township78,907
- Bloomington township2,623
- Blount township3,177
- Blue Mound township (Macon County)775
- Blue Mound township (McLean County)468
- Blue Ridge township1,307
- Bluff Springs township730
- Bluffdale township541
- Bois D'Arc township904
- Bolo township260
- Bond township512
- Bonpas township354
- Bonus township4,363
- Boone township2,108
- Bourbon township4,100
- Bourbonnais township39,048
- Bowdre township656
- Bowlesville township89
- Bowling Green township168
- Bowling township3,335
- Boynton township406
- Braceville township6,529
- Bradford township253
- Bradley township1,941
- Breese township5,539
- Bremen township104,594
- Brenton township844
- Bridgeport township2,058
- Brighton township3,856
- Brimfield township987
- Bristol township33,956
- Broadwell township3,071
- Brookfield township1,038
- Brooklyn township (Lee County)680
- Brooklyn township (Schuyler County)216
- Brookside township4,413
- Brookville township156
- Broughton township293
- Brouilletts Creek township160
- Brown township1,578
- Browning township (Franklin County)2,145
- Browning township (Schuyler County)261
- Bruce township11,794
- Brushy Mound township391
- Brushy township1,024
- Buck township205
- Buckeye township1,242
- Buckhart township1,886
- Buckheart township1,312
- Buckhorn township188
- Buena Vista township2,188
- Buffalo Hart township156
- Buffalo Prairie township565
- Buffalo township2,648
- Bunker Hill township3,120
- Bureau township344
- Burgess township1,928
- Burlington township1,656
- Burns township230
- Burnt Prairie township275
- Burritt township960
- Burton township (Adams County)627
- Burton township (McHenry County)4,891
- Bushnell township2,892
- Butler Grove township799
- Butler township1,249
- Button township139
- Byron township6,410
- Cahokia township3,128
- Caledonia township7,239
- Calumet township18,086
- Camargo township3,498
- Cambridge township2,255
- Camden township194
- Camp Point township1,801
- Campton township17,093
- Canoe Creek township539
- Canteen township7,877
- Canton township13,993
- Capital township111,650
- Carbondale township24,933
- Carlinville township6,456
- Carlyle township3,798
- Carman township483
- Carmi township6,161
- Carrier Mills township2,507
- Carrigan township558
- Carroll township425
- Carrollton township2,828
- Carson township105
- Carthage township2,922
- Cartwright township1,129
- Casey township3,451
- Caseyville township35,032
- Casner township907
- Cass township400
- Catlin township3,059
- Cave township1,549
- Cazenovia township1,591
- Cedar township2,993
- Central township8,081
- Centralia township14,039
- Centreville township19,674
- Cerro Gordo township1,687
- Chalmers township532
- Chambersburg township148
- Champaign City township89,996
- Champaign township11,364
- Chandlerville township546
- Channahon township10,769
- Charleston township19,509
- Charlotte township91
- Chatham township8,443
- Chatsworth township1,383
- Chebanse township2,811
- Chemung township9,051
- Cheney's Grove township1,012
- Chenoa township1,996
- Cherry Grove-Shannon township1,565
- Cherry Valley township19,221
- Chester township508
- Chesterfield township712
- Chestnut township166
- Chili township628
- Chillicothe township8,157
- Chouteau township7,464
- Christy township3,109
- Cicero township82,797
- Cincinnati township (Pike County)4
- Cincinnati township (Tazewell County)8,797
- Claremont township813
- Clarion township253
- Clarksburg township578
- Clay City township1,050
- Clayton township (Adams County)752
- Clayton township (Woodford County)569
- Clear Lake township8,302
- Clement township458
- Clinton township2,149
- Clintonia township7,260
- Clover township818
- Clyde township258
- Coal Valley township4,433
- Coe township2,023
- Colchester township1,610
- Cold Spring township244
- Coldbrook township299
- Colfax township161
- Collinsville township35,410
- Coloma township10,446
- Colona township6,633
- Columbus township852
- Compromise township1,347
- Concord township (Adams County)432
- Concord township (Bureau County)1,517
- Concord township (Iroquois County)370
- Condit township445
- Cooper township763
- Cooperstown township184
- Copley township441
- Coral township3,648
- Cordova township764
- Cornwall township239
- Cortland township11,312
- Corwin township452
- Cottage township133
- Cotton Hill township1,099
- Cottonwood township697
- Council Hill township162
- Covington township319
- Crane Creek township84
- Creek township270
- Crescent township482
- Crete township23,542
- Crittenden township347
- Crook township358
- Crooked Creek township (Cumberland County)579
- Crooked Creek township (Jasper County)736
- Cropsey township124
- Crouch township427
- Cruger township1,906
- Cuba township17,272
- Cunningham township39,341
- Curran township1,625
- Custer township1,503
- Dahlgren township1,390
- Dakota township928
- Dale township1,345
- Dallas City township855
- Danforth township846
- Danvers township1,846
- Danville township26,786
- Darwin township316
- Dawson township534
- Dayton township1,971
- De Soto township2,615
- De Witt township375
- Decatur township46,586
- Decker township278
- Deer Creek township1,331
- Deer Park township438
- Deerfield township189
- Degognia township175
- DeKalb township42,778
- Delavan township1,881
- Dement township903
- Denison township1,616
- Denning township4,682
- Denver township343
- Derinda township208
- Derry township423
- Detroit township88
- Dillon township1,055
- Dimmick township712
- Divernon township1,561
- Dix township588
- Dixon township17,253
- Dodds township2,700
- Dolson township223
- Dora township883
- Dorchester township1,667
- Dorr township21,621
- Douglas township (Clark County)170
- Douglas township (Effingham County)12,629
- Douglas township (Iroquois County)1,933
- Dover township394
- Downers Grove township149,038
- Downs township1,275
- Drummer township3,972
- Drury township739
- Dry Grove township1,378
- Dry Point township916
- Du Bois township434
- Du Page township87,582
- Duncan township215
- Dundee township64,400
- Dunham township2,777
- Dunleith township3,527
- Durand township2,449
- Durham township228
- Dwight township4,252
- Eagle Creek township132
- Eagle Point township273
- Eagle township1,530
- Earl township2,574
- East Bend township729
- East Eldorado township5,289
- East Fork township (Clinton County)352
- East Fork township (Montgomery County)2,133
- East Galena township1,153
- East Grove township266
- East Lincoln township7,677
- East Nelson township816
- East Oakland township1,175
- East St. Louis township17,999
- Eastern township600
- Eden township1,311
- Edford township563
- Edgar township558
- Edgington township1,505
- Edwardsville township40,522
- El Paso township3,400
- Ela township45,717
- Elba township190
- Elbridge township520
- Eldorado township64
- Elgin township104,350
- Eliza township444
- Elizabeth township900
- Elk Grove township93,245
- Elk Prairie township569
- Elk township1,444
- Elkhart township435
- Elkhorn Grove township71
- Elkhorn township213
- Ellington township2,755
- Ellison township427
- Ellisville township104
- Elm Grove township2,954
- Elm River township113
- Elmira township193
- Elmwood township2,698
- Elsah township2,799
- Elwood township1,272
- Embarrass township458
- Eminence township258
- Emma township86
- Emmet township1,127
- Empire township3,993
- Enfield township1,013
- Engelmann township758
- English township521
- Eppards Point township112
- Equality township845
- Erie township1,930
- Erienna township2,626
- Erin township423
- Esmen township461
- Essex township (Kankakee County)1,590
- Essex township (Stark County)644
- Evans township1,467
- Ewing township2,020
- Fairfield township120
- Fairhaven township860
- Fairmount township221
- Fairview township548
- Fall Creek township153
- Fall River township900
- Fancy Creek township5,826
- Farm Ridge township871
- Farmers township298
- Farmington township3,148
- Farrington township783
- Fayette township152
- Fayetteville township1,600
- Felix township4,469
- Fenton township600
- Fidelity township705
- Field township1,730
- Fillmore Consolidated township857
- Flagg township13,287
- Flannigan township266
- Flat Branch township315
- Flint township12
- Flora township2,988
- Florence township (Stephenson County)1,250
- Florence township (Will County)888
- Floyd township570
- Fondulac township12,186
- Forest City township440
- Forrest township1,251
- Forreston township1,907
- Fort Russell township9,167
- Foster township (Madison County)3,867
- Foster township (Marion County)390
- Fountain Bluff township131
- Fountain Creek township213
- Fountain Green township161
- Four Mile township460
- Fox township (Jasper County)356
- Fox township (Kendall County)1,575
- Frankfort township (Franklin County)6,340
- Frankfort township (Will County)60,045
- Franklin Grove township1,330
- Franklin township2,286
- Frederick township139
- Freeburg township5,006
- Freedom township (Carroll County)672
- Freedom township (LaSalle County)432
- Freeport township23,505
- Fremont township33,607
- Friends Creek township1,312
- Fulton township4,303
- Funks Grove township269
- Galatia township1,163
- Galesburg City township29,481
- Galesburg township226
- Galva township2,669
- Ganeer township3,164
- Garden Hill township243
- Garden Plain township1,161
- Gardner township4,608
- Garfield township1,511
- Garrett township1,012
- Genesee township615
- Geneseo township7,520
- Geneva township26,345
- Genoa township5,606
- Georgetown township7,235
- German township271
- Germantown township2,322
- Germanville township72
- Gillespie township3,611
- Gilmer township988
- Girard township2,140
- Gladstone township732
- Gold Hill township1,230
- Gold township180
- Goode township2,604
- Goodfarm township234
- Goose Creek township745
- Goose Lake township1,170
- Goshen township474
- Grafton township56,996
- Grand Detour township419
- Grand Prairie township988
- Grand Rapids township179
- Grand Tower township628
- Grandview township373
- Grandville township349
- Granite City township24,767
- Grant township (Lake County)28,189
- Grant township (Vermilion County)5,477
- Granville township2,748
- Gray township1,142
- Green Garden township3,862
- Greenbush township473
- Greene township (Mercer County)1,391
- Greene township (Woodford County)263
- Greenfield township789
- Greenup township2,445
- Greenville township524
- Greenwood township (Christian County)175
- Greenwood township (McHenry County)14,581
- Gridley township1,734
- Griggsville township1,557
- Grisham township559
- Grove township531
- Groveland township (LaSalle County)486
- Groveland township (Tazewell County)18,513
- Grover township3,540
- Guilford township1,886
- Hadley township159
- Hagener township477
- Hahnaman township139
- Haines township864
- Hale township249
- Hall township8,267
- Hallock township1,455
- Hamel township2,756
- Hamilton township127
- Hampshire township9,260
- Hampton township21,529
- Hancock township118
- Hanna township2,872
- Hanover township (Cook County)97,865
- Hanover township (Jo Daviess County)1,106
- Hardin township195
- Harlem township (Stephenson County)1,993
- Harlem township (Winnebago County)39,116
- Harmon township279
- Harmony township243
- Harp township290
- Harris township355
- Harrisburg township9,838
- Harrison township405
- Harristown township1,799
- Harter township6,035
- Hartland township1,566
- Harvel township264
- Harwood township655
- Havana township4,270
- Haw Creek township370
- Hawthorne township142
- Hebron township2,425
- Helvetia township8,328
- Henderson township1,627
- Hennepin township1,442
- Henry township2,542
- Hensley township708
- Heralds Prairie township530
- Herrick township446
- Hickory Hill township328
- Hickory Point township17,885
- Hickory township93
- Highland township285
- Hillsboro township6,875
- Hillyard township426
- Hire township110
- Hittle township571
- Holland township419
- Hollis township1,771
- Homer township40,989
- Honey Creek township (Adams County)757
- Honey Creek township (Crawford County)1,459
- Honey Point township273
- Hoosier township488
- Hope township640
- Hopedale township1,806
- Hopewell township418
- Hopkins township2,148
- Houston township173
- Hoyleton township1,305
- Hudson township2,505
- Humboldt township1,035
- Hume township574
- Hunt City township214
- Hunter township350
- Huntsville township65
- Hurlbut township625
- Hurricane township162
- Hutsonville township1,171
- Hutton township925
- Illini township1,256
- Illiopolis township1,488
- Independence township1,050
- Indian Creek township2,510
- Indian Grove township4,119
- Indian Point township1,796
- Indian Prairie township670
- Indiantown township509
- Industry township733
- Irishtown township785
- Iroquois township465
- Irving township747
- Irvington township1,250
- Isabel township150
- Island Grove township467
- Iuka township938
- Jackson township (Effingham County)1,168
- Jackson township (Will County)3,875
- Jamaica township73
- Jarvis township15,951
- Jasper township1,722
- Jefferson township157
- Jersey township9,924
- Johannisburg township391
- Johnson township (Christian County)790
- Johnson township (Clark County)302
- Joliet township85,288
- Jonathan Creek township1,008
- Jordan township838
- Joshua township733
- Jubilee township1,524
- Kane township509
- Kaneville township1,120
- Kankakee township24,144
- Kansas township (Edgar County)1,150
- Kansas township (Woodford County)503
- Kaskaskia township315
- Keene township537
- Keith township302
- Keithsburg township490
- Kelly township435
- Kendall township9,269
- Kent township615
- Kerr township177
- Kerton township41
- Kewanee township9,622
- Kickapoo township8,175
- Kilbourne township549
- Kinderhook township749
- King township240
- Kingston township3,464
- Kinkaid township434
- Kinmundy township1,113
- Knight Prairie township530
- Knox township4,871
- La Clede township788
- La Harpe township1,607
- La Moille township1,027
- La Prairie township285
- Lacon township2,322
- Laenna township505
- Lafayette township (Coles County)4,684
- Lafayette township (Ogle County)264
- Lagrange township853
- Lake Fork township88
- Lake township804
- Lake Villa township39,760
- Lakewood township335
- Lamard township1,385
- Lamoine township596
- Lamotte township2,010
- Lancaster township1,296
- Lanesville township160
- Laona township1,342
- Larkinsburg township501
- LaSalle township13,287
- Lawndale township135
- Lawrence township6,166
- Leaf River township1,125
- Lebanon township4,369
- Lee Center township440
- Lee township (Brown County)312
- Lee township (Fulton County)147
- Leech township475
- Leef township616
- Leepertown township307
- Lemont township22,564
- Lenox township88
- Lenzburg township943
- LeRoy township390
- Levan township553
- Lewistown township2,608
- Lexington township2,589
- Leyden township90,973
- Liberty township (Adams County)1,251
- Liberty township (Effingham County)631
- Libertyville township54,192
- Licking township319
- Lima township593
- Limestone township (Kankakee County)5,010
- Limestone township (Peoria County)18,116
- Lincoln township465
- Linder township505
- Linn township299
- Lisbon township780
- Lisle township118,895
- Little Mackinaw township1,252
- Little Rock township14,609
- Littleton township259
- Lively Grove township561
- Liverpool township434
- Loami township1,169
- Lockport township59,827
- Locust township3,133
- Loda township1,525
- Logan township3,214
- Lomax township740
- Lone Grove township600
- Long Branch township244
- Long Creek township10,360
- Long Point township457
- Looking Glass township6,441
- Loraine township280
- Loran township1,362
- Loudon township947
- Louisville township1,917
- Love township170
- Lovejoy township517
- Lovington township1,545
- Lowe township1,775
- Lucas township370
- Ludlow township4,156
- Lukin township404
- Lyman township600
- Lynchburg township136
- Lyndon township656
- Lynn township (Henry County)917
- Lynn township (Knox County)75
- Lynnville township655
- Lyons township112,613
- Mackinaw township4,240
- Macomb City township14,894
- Macomb township566
- Macon township130
- Madison township883
- Magnolia township934
- Mahomet township14,282
- Maine township (Cook County)137,069
- Maine township (Grundy County)201
- Makanda township4,031
- Malone township241
- Malta township1,741
- Manchester township697
- Manhattan township12,424
- Manito township2,053
- Manlius township (Bureau County)655
- Manlius township (LaSalle County)6,100
- Manteno township11,203
- Maquon township360
- Marengo township7,253
- Marine township2,142
- Marion township (Lee County)293
- Marion township (Ogle County)3,884
- Marissa township1,835
- Maroa township2,162
- Marrowbone township1,552
- Marshall township4,510
- Martin township (Crawford County)410
- Martin township (McLean County)1,222
- Martinsburg township217
- Martinsville township1,556
- Martinton township939
- Maryland township440
- Mascoutah township9,512
- Mason City township2,372
- Mason township1,677
- Massilon township142
- Mattoon township14,496
- Maxwell township238
- May township (Christian County)2,126
- May township (Lee County)218
- Mayberry township557
- Mayfield township851
- Mazon township1,663
- McClellan township1,047
- McHenry township46,965
- McKee township110
- McKendree township751
- McLeansboro township3,644
- Meacham township338
- Mechanicsburg township2,301
- Media township290
- Medina township13,918
- Melrose township (Adams County)5,560
- Melrose township (Clark County)359
- Mendon township1,675
- Mendota township7,071
- Menominee township767
- Mercer township3,917
- Meriden township344
- Meridian township471
- Metamora township4,513
- Middlefork township1,313
- Middleport township3,645
- Milan township286
- Milford township1,494
- Milks Grove township224
- Mill Shoals township572
- Millbrook township404
- Miller township590
- Millersburg township588
- Mills township407
- Millstadt township6,616
- Milo township143
- Milton township119,372
- Mineral township428
- Minonk township2,028
- Mission township4,054
- Mississippi township1,667
- Missouri township324
- Moccasin township305
- Moline township22,570
- Momence township3,519
- Mona township406
- Monee township15,425
- Money Creek township746
- Monmouth township9,727
- Monroe township1,335
- Montebello township3,284
- Montezuma township417
- Montgomery township (Crawford County)654
- Montgomery township (Woodford County)2,615
- Monticello township6,154
- Montmorency township2,539
- Moores Prairie township380
- Moraine township34,354
- Morgan township325
- Moro township3,495
- Morris township7,239
- Morton township17,998
- Mosquito township266
- Mound township (Effingham County)3,532
- Mound township (McDonough County)179
- Mount Auburn township773
- Mount Carroll township1,927
- Mount Erie township260
- Mount Hope township927
- Mount Morris township3,669
- Mount Olive township3,072
- Mount Pleasant township4,720
- Mount Pulaski township1,950
- Mount Sterling township4,157
- Mount Vernon township12,335
- Mount Zion township7,094
- Mountain township262
- Moweaqua township2,082
- Mulberry Grove township1,459
- Munson township339
- Murdock township303
- Murphysboro township9,415
- Na-Au-Say township11,001
- Nachusa township333
- Nameoki township11,968
- Naperville township105,406
- Nashville township3,433
- Nauvoo township962
- Nebraska township1,241
- Nelson township644
- Neoga township2,750
- Neponset township691
- Nettle Creek township805
- Nevada township176
- New Athens township2,633
- New Berlin township1,481
- New Boston township1,113
- New Douglas township663
- New Haven township465
- New Lenox township44,199
- New Salem township (McDonough County)348
- New Salem township (Pike County)288
- New Trier township56,161
- Newburg township1,197
- Newcomb township1,469
- Newell township13,540
- Newman township1,107
- Newmansville township99
- Newport township6,796
- Newton township489
- Newtown township804
- Niantic township812
- Niles township109,647
- Nilwood township445
- Nixon township555
- Noble township1,208
- Nokomis township2,779
- Nora township416
- Normal township52,417
- Norman township243
- North Fork township337
- North Henderson township361
- North Litchfield township4,875
- North Muddy township667
- North Okaw township1,284
- North Otter township624
- North Palmyra township818
- Northeast township1,063
- Northern township317
- Northfield township89,674
- Northville township7,316
- Norton township925
- Norwood Park township26,755
- Nunda township38,565
- O'Fallon township26,785
- Oak Park township53,292
- Oakdale township842
- Oakland township105
- Oakley township950
- Oakwood township3,098
- Oblong township2,739
- Oconee township758
- Odell township1,053
- Odin township1,764
- Ogden township1,642
- Ohio Grove township365
- Ohio township895
- Okaw township858
- Okawville township1,959
- Old Ripley township961
- Old Town township3,421
- Olio township4,691
- Olive township1,586
- Olney township9,847
- Omaha township369
- Omega township369
- Omphghent township2,319
- Onarga township1,591
- Oneco township1,387
- Ontario township1,037
- Ophir township476
- Oquawka township1,659
- Ora township387
- Oran township346
- Orange township (Clark County)278
- Orange township (Knox County)566
- Orchard township1,323
- Oregon-Nashua township4,769
- Orel township1,452
- Orion township1,159
- Orland township96,492
- Orvil township1,181
- Osage township188
- Osceola township866
- Osco township386
- Oskaloosa township573
- Oswego township58,023
- Otego township1,306
- Ottawa township11,204
- Otter Creek township (Jersey County)802
- Otter Creek township (LaSalle County)2,642
- Otto township1,935
- Owego township391
- Owen township3,577
- Oxford township1,213
- Palatine township111,737
- Palestine township1,347
- Palmyra township2,877
- Palos township55,552
- Pana township5,916
- Panola township327
- Panther Creek township217
- Papineau township307
- Paradise township925
- Paris township9,022
- Parker township370
- Partridge township616
- Patoka township737
- Patterson township359
- Patton township5,173
- Paw Paw township198
- Pawnee township2,985
- Payson township1,928
- Pea Ridge township13
- Peach Orchard township585
- Pearl township114
- Pecatonica township4,130
- Pekin township27,280
- Pella township130
- Pembroke township1,698
- Pendleton township1,454
- Penn township (Shelby County)39
- Penn township (Stark County)200
- Pennsylvania township367
- Peoria City township96,648
- Peotone township4,395
- Perry township310
- Perryton township179
- Persifer township1,190
- Peru township10,070
- Pesotum township843
- Petty township410
- Phenix township1,780
- Philadelphia township120
- Phillips township1,188
- Philo township2,476
- Piasa township3,085
- Pickaway township165
- Pierce township554
- Pigeon Grove township1,221
- Pike township596
- Pilot Grove township178
- Pilot Knob township416
- Pilot township (Kankakee County)1,867
- Pilot township (Vermilion County)538
- Pin Oak township4,528
- Pine Creek township830
- Pine Rock township696
- Pitman township374
- Pittsfield township3,955
- Pixley township303
- Plainfield township83,145
- Plato township9,200
- Pleasant Grove township921
- Pleasant Hill township1,340
- Pleasant Mound township813
- Pleasant Ridge township320
- Pleasant township970
- Pleasant Vale township358
- Pleasant Valley township261
- Pleasant View township1,246
- Plum Hill township388
- Point Pleasant township103
- Polk township441
- Pomona township723
- Pontiac township12,266
- Pontoosuc township258
- Pope township149
- Poplar Grove township5,150
- Port Byron township1,303
- Portland township404
- Prairie City township395
- Prairie Creek township365
- Prairie Du Long township2,607
- Prairie Green township119
- Prairie township (Crawford County)424
- Prairie township (Edgar County)158
- Prairie township (Hancock County)382
- Prairie township (Shelby County)1,136
- Prairieton township459
- Preemption township2,052
- Preston township1,601
- Princeton township9,106
- Princeville township1,758
- Prophetstown township2,527
- Proviso township147,690
- Putman township1,774
- Quarry township1,062
- Quincy township39,109
- Quiver township689
- Raccoon township1,509
- Radnor township5,209
- Raleigh township1,077
- Ramsey township2,072
- Randolph township4,303
- Rantoul township10,485
- Raritan township152
- Rawlins township595
- Raymond township (Champaign County)209
- Raymond township (Montgomery County)1,113
- Reading township1,722
- Rector township48
- Reed township6,903
- Reynolds township266
- Rice township518
- Rich township74,330
- Richfield township316
- Richland Grove township2,129
- Richland township (LaSalle County)252
- Richland township (Marshall County)337
- Richland township (Shelby County)730
- Richmond township6,763
- Richview township259
- Richwood township413
- Richwoods township5,825
- Ricks township1,177
- Ridge township482
- Ridgeland township455
- Ridgway township795
- Ridott township1,301
- Riley township2,998
- Rio township343
- Ripley township110
- River Forest township11,992
- Riverside township (Adams County)2,060
- Riverside township (Cook County)16,242
- Rivoli township1,096
- Roanoke township2,251
- Roberts township875
- Robinson township9,218
- Rochester township5,538
- Rock Creek township195
- Rock Creek-Lima township1,891
- Rock Grove township1,537
- Rock Island township15,831
- Rock Run township2,162
- Rockbridge township1,571
- Rockford township169,035
- Rockton township16,076
- Rockvale township1,649
- Rockville township843
- Rocky Run-Wilcox township199
- Rogers township302
- Rome township1,576
- Romine township420
- Roodhouse township1,777
- Rooks Creek township516
- Rosamond township143
- Roscoe township20,134
- Rose township2,020
- Rosedale township142
- Rosefield township1,014
- Roseville township991
- Ross township (Edgar County)1,437
- Ross township (Pike County)81
- Ross township (Vermilion County)1,402
- Round Grove township361
- Rountree township152
- Rozetta township311
- Rubicon township466
- Rural township (Rock Island County)778
- Rural township (Shelby County)321
- Rush township328
- Rushville township2,433
- Russell township254
- Rutland township (Kane County)27,636
- Rutland township (LaSalle County)3,589
- Rutledge township127
- Ruyle township154
- Sadorus township794
- Salem township (Carroll County)333
- Salem township (Knox County)667
- Salem township (Marion County)8,914
- Salina township1,246
- Saline township6,852
- Salt Creek township201
- Sand Prairie township1,192
- Sand Ridge township924
- Sandoval township1,898
- Sandwich township7,529
- Sangamon township2,505
- Sangamon Valley township496
- Santa Anna township2,246
- Santa Fe township1,371
- Saratoga township (Grundy County)6,483
- Saratoga township (Marshall County)256
- Sargent township355
- Saunemin township661
- Savanna township3,388
- Scales Mound township672
- Schaumburg township131,761
- Sciota township548
- Scotland township337
- Scott township (Champaign County)1,238
- Scott township (Ogle County)3,305
- Scottville township336
- Sefton township420
- Selby township2,082
- Seminary township636
- Senachwine township477
- Seneca township2,881
- Serena township1,120
- Seven Hickory township243
- Seward township (Kendall County)6,732
- Seward township (Winnebago County)894
- Shabbona township1,082
- Shafter township753
- Sharon township3,006
- Shawnee township182
- Shaws Point township512
- Shelbyville township4,436
- Sheldon township1,285
- Sheridan township430
- Sherman township537
- Shields township37,623
- Shiloh township (Edgar County)47
- Shiloh township (Jefferson County)6,520
- Shiloh Valley township12,849
- Shipman township1,275
- Shirland township1,007
- Shoal Creek township1,494
- Sidell township880
- Sidney township1,394
- Sigel township726
- Silver Creek township462
- Six Mile township3,496
- Smallwood township415
- Smithton township4,102
- Somer township892
- Somerset township3,960
- Somonauk township1,827
- Songer township131
- Sonora township438
- South Crouch township101
- South Dixon township699
- South Flannigan township112
- South Fork township2,439
- South Grove township352
- South Homer township1,738
- South Hurricane township261
- South Litchfield township3,260
- South Macon township1,280
- South Moline township36,127
- South Muddy township316
- South Ottawa township8,322
- South Otter township436
- South Palmyra township731
- South Rock Island township18,160
- South Ross township1,041
- South Twigg township82
- South Wheatland township3,958
- Southwest township107
- Sparta township908
- Spring Bay township2,531
- Spring Creek township571
- Spring Garden township2,574
- Spring Grove township1,200
- Spring Lake township1,658
- Spring Point township1,255
- Spring township1,009
- Springfield township5,522
- Squaw Grove township2,716
- St. Albans township360
- St. Anne township2,166
- St. Charles township51,964
- St. Clair township35,601
- St. Francis township1,153
- St. Jacob township2,877
- St. Joseph township5,536
- St. Mary township646
- St. Rose township1,524
- Stanford township491
- Stanton township571
- Staunton township5,423
- Ste. Marie township669
- Sterling township17,089
- Steuben township1,084
- Stevenson township1,036
- Stickney township40,507
- Stites township729
- Stockland township117
- Stockton township2,287
- Stonefort township370
- Stonington township752
- Stookey township9,018
- Stratton township493
- Stronghurst township1,087
- Sublette township844
- Suez township722
- Sugar Creek township6,689
- Sugar Grove township20,938
- Sugar Loaf township6,779
- Sullivan township (Livingston County)609
- Sullivan township (Moultrie County)6,230
- Sullivant township405
- Summit township3,743
- Sumner township (Kankakee County)812
- Sumner township (Warren County)504
- Sumpter township1,806
- Sunbury township171
- Swan township157
- Sycamore township14,846
- Symmes township849
- Talkington township161
- Tamalco township720
- Tampico township859
- Tate township208
- Taylor township832
- Taylorville township11,398
- Tennessee township381
- Terre Haute township174
- Teutopolis township2,751
- Texas township1,298
- Thompson township999
- Thornton township153,682
- Timber township2,493
- Todds Point township330
- Tolono township6,295
- Tompkins township1,056
- Tonti township1,320
- Toulon township2,777
- Towanda township2,530
- Tower Hill township961
- Tremont township2,653
- Trivoli township952
- Troy Grove township1,437
- Troy township49,728
- Truro township772
- Tunbridge township815
- Tuscola township5,457
- Twigg township301
- Tyrone township4,636
- Union Grove township1,419
- Union township (Cumberland County)222
- Union township (Effingham County)598
- Union township (Fulton County)837
- Union township (Livingston County)249
- Unity township1,468
- Urbana township7,527
- Ursa township1,024
- Ustick township410
- Utica township1,886
- Valley township73
- Vance township900
- Vandalia township6,275
- Venedy township391
- Venice township4,582
- Vergennes township770
- Vermillion township331
- Vermont township913
- Vernon township71,411
- Versailles township821
- Victor township188
- Victoria township260
- Vienna township600
- Vinegar Hill township239
- Viola township312
- Virden township3,305
- Virgil township1,716
- Virginia township1,832
- Wabash township1,855
- Waddams township519
- Wade township (Clinton County)1,601
- Wade township (Jasper County)4,343
- Waldo township407
- Walker township274
- Walkerville township86
- Wall township262
- Wallace township623
- Walnut Grove township (Knox County)707
- Walnut Grove township (McDonough County)508
- Walnut township1,408
- Walshville township317
- Waltham township613
- Wapella township1,091
- Wards Grove township308
- Warren township (Jo Daviess County)1,551
- Warren township (Lake County)65,562
- Warsaw township1,518
- Washington township (Carroll County)341
- Washington township (Tazewell County)24,276
- Washington township (Will County)6,459
- Waterford township160
- Watson township3,185
- Wauconda township23,911
- Waukegan township89,689
- Wauponsee township2,742
- Wayne township63,881
- Waynesville township596
- Webber township1,636
- Weller township290
- Wesley township1,819
- West Deerfield township31,575
- West Galena township3,194
- West Jersey township81
- West Lincoln township7,335
- West Point township3,130
- West township (Effingham County)376
- West township (McLean County)290
- Western Mound township347
- Western township2,887
- Westfield township (Bureau County)901
- Westfield township (Clark County)563
- Wethersfield township3,746
- Wheatfield township386
- Wheatland township (Bureau County)37
- Wheatland township (Fayette County)405
- Wheatland township (Will County)90,134
- Wheeling township153,991
- White Hall township2,450
- White Oak township780
- White Rock township1,028
- Whitefield township213
- Whitley township615
- Whitmore township4,221
- Wilberton township457
- Will township1,691
- Williams township3,422
- Willow Branch township924
- Willow Creek township901
- Willow Hill township584
- Wilmington township5,915
- Wilson township127
- Wilton township1,055
- Windsor township1,186
- Winfield township46,932
- Winnebago township4,946
- Winslow township499
- Witt township1,164
- Wood River township29,687
- Woodbine township432
- Woodbury township580
- Woodland township (Carroll County)338
- Woodland township (Fulton County)229
- Woodside township11,416
- Woodstock township287
- Woodville township293
- Woosung township546
- Worth township (Cook County)149,419
- Worth township (Woodford County)8,862
- Wrights township205
- Wyanet township1,293
- Wyoming township1,318
- Wysox township1,427
- Wythe township369
- Xenia township718
- Yates township103
- Yellowhead township2,570
- York township (Carroll County)2,763
- York township (Clark County)430
- York township (DuPage County)127,667
- Yorktown township503
- Young America township755
- Young Hickory township651
- Zanesville township416
- Zif township255
- Zion township24,600
- Zuma township808
School districts
Each of the 861 with people in it, from ACS 2020–2024 5-year estimates. Elementary districts teach the lower grades and secondary districts the upper ones, under them; the rest are unified, teaching every grade.
- A-C Central Community Unit School District 2622,352
- Abingdon-Avon Community Unit School District 2765,724
- Addison School District 4elementary35,991
- Adlai E. Stevenson High School District 125secondary66,357
- Akin Community Consolidated School District 91elementary762
- Albers School District 63elementary1,524
- Alden-Hebron School District 193,320
- Allen Township Community Consolidated School District 65elementary792
- Allendale Community Consolidated School District 171,243
- Alsip-Hazelgreen-Oaklawn School District 126elementary16,061
- Altamont Community Unit School District 104,707
- Alton Community Unit School District 1145,851
- Alwood Community Unit School District 2252,260
- Amboy Community Unit School District 2724,906
- Anna Community Consolidated School District 37elementary6,854
- Anna Jonesboro Community High School District 81secondary11,404
- Annawan Community Unit School District 2261,982
- Antioch Community Consolidated School District 34elementary23,148
- Antioch Community High School District 117secondary46,033
- Aptakisic-Tripp Community Consolidated School Districtelementary21,123
- Arbor Park School District 145elementary11,533
- Arcola Consolidated Unit School District 3064,496
- Argenta-Oreana Community Unit School District 15,800
- Argo Community High School District 217secondary40,377
- Arlington Heights School District 25elementary50,466
- Armstrong Township High School District 225secondary1,403
- Armstrong-Ellis Consolidated School District 61elementary845
- Arthur Community Unit School District 3059,809
- Ashley Community Consolidated School District 15elementary1,672
- Ashton-Franklin Center CUSD 2753,141
- Astoria Community Unit School District 11,583
- Athens Community Unit School District 2135,529
- Atwood Heights School District 125elementary7,286
- Auburn Community Unit School District 106,678
- Aurora East Unit School District 13168,295
- Aurora West Unit School District 12973,943
- Aviston School District 21elementary3,171
- Avoca School District 37elementary6,520
- Ball-Chatham Community Unit School District 530,635
- Bannockburn School District 106elementary2,064
- Barrington Community Unit School District 22044,738
- Bartelso School District 57elementary1,463
- Bartonville School District 66elementary1,507
- Batavia Unit School District 10132,437
- Beach Park Community Consolidated School District 3elementary20,901
- Beardstown Community Unit School District 157,549
- Beecher City Community Unit School District 202,233
- Beecher Community Unit School District 200U6,644
- Belle Valley School District 119elementary7,509
- Belleville School District 118elementary35,305
- Belleville Township High School District 201secondary104,251
- Bellwood School District 88elementary22,248
- Belvidere Consolidated Unit School District 10044,668
- Bement Community Unit School District 52,242
- Benjamin School District 25elementary7,797
- Bensenville School District 2elementary20,761
- Benton Community Consolidated School District 47elementary9,683
- Benton Consolidated High School District 103secondary12,750
- Berkeley School District 87elementary20,741
- Berwyn North School District 98elementary24,877
- Berwyn South School District 100elementary30,718
- Bethalto Consolidated Unit School District 814,956
- Bethel School District 82elementary1,117
- Big Hollow School District 38elementary15,908
- Bismarck-Henning Consolidated Unit School District4,664
- Bloom Township High School District 206secondary58,480
- Bloomingdale School District 13elementary13,453
- Bloomington School District 8743,337
- Blue Ridge Community Unit School District 184,463
- Bluford Unit School District 3181,586
- Bluford Unit School District 318 (9-12) in Farringtonsecondary815
- Bluford Unit School District 318 (KG-8) in Mount Vernonelementary346
- Bond County Community Unit School District 212,956
- Bourbonnais School District 53elementary23,192
- Braceville School District 75elementary1,358
- Bradford Community Unit School District 11,508
- Bradley School District 61elementary12,036
- Bradley-Bourbonnais Consolidated High School District 307secondary39,154
- Breese School District 12elementary7,030
- Bremen Community High School District 228secondary89,378
- Brimfield Community Unit School District 3093,302
- Brookfield Lagrange Park SD 95elementary11,364
- Brooklyn Community Unit School District 188729
- Brookwood School District 167elementary10,842
- Brown County Community Unit School District 16,307
- Brownstown Community Unit School District 2011,882
- Brussels Community Unit School District 421,296
- Buncombe Consolidated School District 43elementary947
- Bunker Hill Community Unit School District 83,647
- Burbank School District 111elementary30,152
- Bureau Valley Community Unit School District 3406,062
- Burnham School District 154-5elementary1,508
- Bushnell-Prairie City Community Unit School District 1703,723
- Butler School District 53elementary4,747
- Byron Community Unit School District 2267,281
- Cahokia Community Unit School District 18715,292
- Cairo Community Unit School District 11,765
- Calhoun Community Unit School District 402,653
- Calumet City School District 155elementary10,227
- Calumet Public School District 132elementary9,168
- Cambridge Community Unit School District 2272,520
- Canton Union School District 6616,669
- Carbon Cliff-Barstow School District 36elementary1,581
- Carbondale Community High School District 165secondary32,685
- Carbondale Elementary School District 95elementary22,755
- Carlinville Community Unit School District 19,325
- Carlyle Community Unit School District 19,230
- Carmi-White County Community Unit School District 58,036
- Carrier Mills-Stonefort Community Unit School District3,121
- Carrollton Community Unit School District 14,222
- Carterville Community Unit School District 511,683
- Carthage Elementary School District 317elementary3,687
- Cary Community Consolidated School District 26elementary22,250
- Casey-Westfield Community Unit School District 4C5,399
- Cass School District 63elementary7,738
- Center Cass School District 66elementary11,681
- Central A & M Community Unit School District 214,647
- Central City School District 133elementary2,146
- Central Community High School District 71secondary17,558
- Central Community Unit School District 45,763
- Central Community Unit School District 30121,751
- Central CUSD 35,485
- Central School District 51elementary10,657
- Central School District 104elementary6,441
- Central Stickney School District 110elementary2,229
- Centralia High School District 200secondary19,500
- Centralia School District 135elementary12,655
- Century Community Unit School District 1002,119
- Cerro Gordo Community Unit School District 1002,831
- Chadwick-Milledgeville Community Unit School District 3992,750
- Champaign Community Unit School District 4102,757
- Chaney-Monge School District 88elementary7,072
- Channahon School District 17elementary10,595
- Charleston Community Unit School District 123,217
- Chester Community Unit School District 1399,136
- Chester Non-High School District 122secondary716
- Chester-East Lincoln Community CSD 61elementary2,849
- Chicago Heights School District 170elementary21,637
- Chicago Public School District 2992.71M
- Chicago Ridge School District 127-5elementary13,824
- Christopher Community Unit School District 994,332
- Cicero School District 99elementary82,797
- Cissna Park Community Unit School District 61,796
- Clay City Community Unit District 101,937
- Clinton Community Unit School District 1511,385
- Coal City Community Unit School District 110,930
- Cobden School Unit District 173,268
- Collinsville Community Unit School District 1047,304
- Colona School District 190elementary3,869
- Columbia Community Unit School District 413,590
- Community Consolidated School District 59elementary65,240
- Community Consolidated School District 93elementary34,663
- Community Consolidated School District 146elementary26,340
- Community Consolidated School District 168elementary9,161
- Community Consolidated School District 180elementary7,363
- Community Consolidated School District 204elementary3,943
- Community High School District 94secondary40,911
- Community High School District 99secondary111,937
- Community High School District 155secondary98,431
- Community High School District 218secondary116,437
- Community Unit School District 44,095
- Community Unit School District 20080,727
- Community Unit School District 300120,443
- Consolidated High School District 230secondary155,885
- Cook County School District 130elementary27,447
- Cornell Community Consolidated School District 426elementary1,179
- Coulterville Unit School District 11,287
- Country Club Hills School District 160elementary12,344
- County of Winnebago SD 3206,262
- County of Woodford Schoolsecondary16,408
- Cowden-Herrick Community Unit School District 3A1,838
- Crab Orchard Community Unit School District 32,633
- Crescent Iroquois Community Unit School District 249852
- Creston Community Consolidated School District 161elementary814
- Crete-Monee Community Unit School District 201-U32,929
- Creve Coeur School District 76elementary5,306
- Crystal Lake Community Consolidated School District 47elementary64,838
- Cumberland Community Unit School District 776,078
- Cypress School District 64elementary1,256
- Dakota Community Unit School District 2015,065
- Dallas Elementary School District 327elementary1,842
- Dalzell School District 98elementary786
- Damiansville School District 62elementary920
- Danville Community Consolidated School District 11834,651
- Darien School District 61elementary16,734
- De Soto Consolidated School District 86elementary1,945
- Decatur School District 6161,931
- Deer Creek-Mackinaw Community Unit School District 7015,527
- Deer Park Community Consolidated School District 82elementary624
- Deerfield School District 109elementary21,162
- DeKalb Community Unit School District 42849,018
- DeLand-Weldon Community Unit School District 571,382
- Delavan Community Unit School District 7032,392
- Depue Community Unit School District 1031,678
- Des Plaines Community Consolidated School District 62elementary53,143
- Diamond Lake School District 76elementary8,607
- Dieterich Community Unit School District 302,715
- Dimmick Community Consolidated School District 175elementary1,585
- District 50 Schoolselementary5,722
- Dixon Unit School District 17021,741
- Dolton School District 148elementary18,276
- Dolton School District 149elementary28,002
- Dongola School Unit District 661,822
- Donovan Community Unit School District 31,974
- Downers Grove Grade School District 58elementary54,087
- Du Quoin Community Unit School District 3008,648
- Dunlap Community Unit School District 32327,845
- DuPage High School District 88secondary82,681
- Dupo Community Unit School District 1966,246
- Durand Community Unit School District 3223,725
- Dwight Common School District 232elementary4,777
- Dwight Township High School District 230secondary5,046
- Earlville Community Unit School District 92,791
- East Alton School District 13elementary7,269
- East Alton-Wood River Community High School District 14secondary13,264
- East Coloma-Nelson Consolidated Elementary School District 20elementary2,948
- East Dubuque Community Unit School District 1194,120
- East Maine School District 63elementary44,647
- East Moline School District 37elementary26,678
- East Peoria Community High School District 309secondary24,406
- East Peoria School District 86elementary17,222
- East Prairie School District 73elementary4,604
- East St. Louis School District 18925,236
- Eastland Community Unit School District 3084,377
- Edgar County Community Unit District 62,056
- Edinburg Community Unit School District 41,965
- Edwards County Community Unit School District 15,474
- Edwardsville Community Unit School District 755,435
- Effingham Community Unit School District 4020,184
- Egyptian Community Unit School District 52,440
- El Paso-Gridley Community Unit School District 116,894
- Eldorado Community Unit School District 46,609
- Elementary School District 159elementary20,359
- Elmhurst School District 20547,623
- Elmwood Community Unit School District 3224,042
- Elmwood Park Community Unit School District 40123,868
- Elverado Community Unit School District 1962,538
- Elwood Community Consolidated School District 203elementary3,526
- Emmons School District 33elementary3,339
- Erie Community Unit School District 13,549
- Eswood Community Consolidated District 269elementary849
- Eureka Community Unit District 14010,303
- Evanston Community Consolidated School District 65elementary84,769
- Evanston Township High School District 202secondary84,769
- Evergreen Park Community High School District 231secondary19,420
- Evergreen Park Elementary School District 124elementary19,420
- Ewing Northern Community Consolidated District 115elementary2,370
- Fairfield Community High School District 225secondary8,905
- Fairfield Public School District 112elementary4,886
- Fairmont School District 89elementary3,903
- Farmington Central Community Unit School District 2657,710
- Farrington Community Consolidated School District 99elementary833
- Fenton Community High School District 100secondary31,018
- Field Community Consolidated School District 3elementary2,993
- Fieldcrest Community Unit School District 66,096
- Fisher Community Unit School District 12,953
- Flanagan-Cornell District 741,424
- Flanagan-Cornell District 74 in Cornellsecondary1,179
- Flanagan-Cornell District 74 in Pontiacsecondary29
- Flanagan-Cornell District 74 in Rooks Creeksecondary3
- Flora Community Unit School District 357,569
- Flossmoor School District 161elementary21,949
- Ford Heights School District 169elementary1,327
- Forest Park School District 91elementary13,649
- Forest Ridge School District 142elementary16,223
- Forrestville Valley Community Unit School District 2214,851
- Fox Lake Grade School District 114elementary8,352
- Fox River Grove Consolidated School District 3elementary4,086
- Frankfort Community Consolidated School District 157Celementary19,938
- Frankfort Community Unit School District 16810,560
- Franklin Community Unit School District 12,239
- Franklin Park School District 84elementary12,099
- Freeburg Community Consolidated School District 70elementary8,502
- Freeburg Community High School District 77secondary13,462
- Freeport School District 14527,859
- Fremont School District 79elementary21,312
- Fulton County Community Unit School District 32,899
- Galatia Community Unit School District 12,322
- Galena Unit School District 1205,681
- Galesburg Community Unit School District 20532,619
- Gallatin Community Unit School District 74,576
- Galva Community Unit School District 2243,194
- Gardner Community Consolidated School District 72Celementary1,694
- Gardner-South Wilmington Township High School Districtsecondary3,733
- Gavin School District 37elementary8,655
- Geff Community Consolidated School District 14elementary834
- General George Patton School District 133elementary1,344
- Geneseo Community Unit School District 22816,210
- Geneva Community Unit School District 30429,575
- Genoa-Kingston Community Unit School District 4249,221
- Georgetown-Ridge Farm Consolidated Unit School District 45,541
- Germantown Hills School District 69elementary7,353
- Germantown School District 60elementary2,138
- Giant City Community Consolidated School District 130elementary2,384
- Gibson City-Melvin-Sibley Community Unit School District 55,825
- Gifford Community Consolidated School District 188elementary1,741
- Gillespie Community Unit School District 77,348
- Glen Ellyn Community Consolidated School District 89elementary23,156
- Glen Ellyn School District 41elementary30,537
- Glenbard Township High School District 87secondary164,417
- Glencoe School District 35elementary8,580
- Glenview Community Consolidated School District 34elementary42,770
- Golf Elementary School District 67elementary8,109
- Goreville Community Unit School District 13,717
- Gower School District 62elementary9,879
- Grand Prairie Community Consolidated School District 6elementary947
- Grand Ridge Community Consolidated School District 95elementary2,744
- Granite City Community Unit School District 940,644
- Grant Community Consolidated School District 110elementary7,132
- Grant Community High School District 124secondary37,904
- Grant Park Community Unit School District 63,205
- Grass Lake School District 36elementary2,485
- Grayslake Community High School District 127secondary43,585
- Grayslake Consolidated Community School District 46elementary29,973
- Grayville Community Unit School District 11,941
- Greenfield Community Unit School District 102,577
- Greenview Community Unit School District 2001,582
- Griggsville-Perry Community Unit School District 42,163
- Gurnee School District 56elementary18,463
- Hall High School District 502secondary9,315
- Hamilton Community Consolidated School District 3283,791
- Hamilton County Community Unit School District 107,368
- Hampton School District 29elementary2,233
- Hardin County Community Unit School District 13,605
- Harlem Unit School District 12241,971
- Harmony Emge School District 175elementary10,594
- Harrisburg Community Unit School District 311,644
- Harrison School District 36elementary4,593
- Hartsburg-Emden Community Unit School District 211,397
- Harvard Community Unit School District 5012,865
- Harvey School District 152elementary13,001
- Havana Community Unit School District 1265,800
- Hawthorn Community Consolidated School District 73elementary31,127
- Hazel Crest School District 152-5elementary7,611
- Henry-Senachwine Consolidated Unit School District 53,410
- Heritage Community Unit School District 82,907
- Herrin Community Unit School District 416,304
- Herscher Community Unit School District 210,230
- Heyworth Community Unit School District 44,797
- Hiawatha Community Unit School District 4262,603
- High Mount School District 116elementary3,253
- Highland Community Unit School District 518,542
- Hillsboro Community Unit School District 312,441
- Hillside School District 93elementary5,310
- Hinckley-Big Rock Community Unit School District 4295,294
- Hinsdale Community Consolidated School District 181elementary25,428
- Hinsdale Township High School District 86secondary75,819
- Hollis Consolidated School District 328elementary733
- Homer Community Consolidated School District 33Celementary32,020
- Homewood School District 153elementary16,053
- Homewood-Flossmoor Community High School District 233secondary38,834
- Hononegah Community High School District 207secondary33,111
- Hoopeston Area Community Unit School District 116,974
- Hoover-Schrum Memorial School District 157elementary7,845
- Huntley Consolidated School District 15846,282
- Hutsonville Community Unit School District 11,946
- Illini Bluffs Community Unit School District 3275,559
- Illini Central Community Unit School District 1894,543
- Illini West High School District 307secondary7,567
- Illinois Valley Central Unit School District 32112,082
- Indian Creek Community Unit District 4254,283
- Indian Prairie Community Unit School District 204136,452
- Indian Springs School District 109elementary24,082
- Iroquois County Community Unit School District 96,016
- Iroquois West Community Unit School District 104,864
- Irvington County Community Unit School District 11elementary966
- Itasca School District 10elementary9,696
- Iuka Community Consolidated School District 7elementary1,687
- J. Sterling Morton High School District 201secondary157,109
- Jacksonville School District 11726,221
- Jasper Community Consolidated School District 17elementary1,633
- Jasper County Community Unit School District 18,928
- Jersey Community Unit School District 10018,492
- Johnsburg Community Unit School District 1211,934
- Johnston City Community Unit School District 17,168
- Joliet Public School District 86elementary80,617
- Joliet Township High School District 204secondary128,263
- Jonesboro Community Consolidated School District 43elementary3,048
- Joppa-Maple Grove Unit District 381,389
- Kaneland Community Unit School District 30226,458
- Kankakee School District 11129,095
- Kansas Community Unit School District 31,498
- Keeneyville School District 20elementary14,084
- Kell Consolidated School District 2elementary895
- Kenilworth School District 38elementary2,756
- Kewanee Community Unit School District 22910,484
- Kildeer Countryside Community Consolidated School District 96elementary24,372
- Kings Consolidated School District 144elementary1,102
- Kinnikinnick Community Consolidated School District 131elementary13,768
- Kirby School District 140elementary34,554
- Knoxville Community Unit School District 2025,806
- Komarek School District 94elementary5,117
- La Harpe Community School District 347elementary2,038
- La Moille Community Unit School District 3031,553
- Ladd Community Consolidated School District 94elementary1,832
- LaGrange Highlands School District 106elementary9,338
- LaGrange School District 102elementary24,314
- LaGrange School District 105elementary13,311
- Lake Bluff Elementary School District 65elementary9,329
- Lake Forest Community High School District 115secondary28,717
- Lake Forest School District 67elementary19,013
- Lake Park Community High School District 108secondary51,905
- Lake Villa Community Consolidated School District 41elementary24,118
- Lake Zurich Community Unit School District 9531,909
- Lansing School District 158elementary23,026
- Laraway Community Consolidated School District 70Celementary2,615
- LaSalle Elementary School District 122elementary9,121
- LaSalle-Peru Township High School District 120secondary28,052
- Lawrence County Community Unit District 208,063
- Le Roy Community Unit School District 24,393
- Lebanon Community Unit School District 95,569
- Leland Community Unit School District 12,042
- Lemont Township High School District 210secondary26,506
- Lemont-Bromberek Combined School District 113Aelementary25,972
- Lena-Winslow Community Unit School District 2024,698
- Lewistown Community Unit School District 974,033
- Lexington Community Unit School District 72,772
- Leyden Community High School District 212secondary62,578
- Liberty Community Unit School District 22,991
- Libertyville Community High School District 128secondary50,619
- Libertyville School District 70elementary18,310
- Lick Creek Community Consolidated School District 16elementary1,502
- Limestone Community High School District 310secondary20,677
- Limestone Walters Community Consolidated School District 316elementary2,045
- Lincoln Community High School District 404secondary19,952
- Lincoln Elementary School District 27elementary11,790
- Lincoln Elementary School District 156elementary5,702
- Lincoln Way Community High School District 210secondary114,706
- Lincolnshire-Prairieview School District 103elementary14,110
- Lincolnwood School District 74elementary13,112
- Lindop School District 92elementary3,159
- Lisbon Community Consolidated School District 90elementary1,181
- Lisle Community Unit School District 20214,116
- Litchfield Community Unit School District 128,625
- Lockport School District 91elementary6,535
- Lockport Township High School District 205secondary78,651
- Lombard School District 44elementary34,848
- Lostant Community Unit School District 425793
- Lowpoint-Washburn Community Unit School District 212,125
- Ludlow Community Consolidated School District 142elementary838
- Lyons School District 103elementary23,470
- Lyons Township High School District 204secondary69,254
- Macomb Community Unit School District 18517,738
- Madison Community Unit School District 123,451
- Maercker School District 60elementary17,911
- Mahomet-Seymour Community Unit School District 316,116
- Maine Township High School District 207secondary146,895
- Malden Community Consolidated School District 84elementary835
- Manhattan School District 114elementary12,523
- Mannheim School District 83elementary19,283
- Manteno Community Unit School District 512,223
- Marengo Community High School District 154secondary13,600
- Marengo-Union Elementary Consolidated District 165elementary10,224
- Marion Community Unit School District 228,215
- Marissa Community Unit School District 402,354
- Maroa-Forsyth Community Unit School District 26,866
- Marquardt School District 15elementary24,845
- Marseilles Elementary School District 150elementary3,544
- Marshall Community Unit School District 2C7,478
- Martinsville Community Unit School District 3C2,704
- Mascoutah Community Unit School District 1920,347
- Massac Unit School District 112,260
- Matteson Elementary School District 162elementary22,655
- Mattoon Community Unit School District 221,367
- Maywood-Melrose Park-Broadview School District 89elementary43,610
- Mazon-Verona-Kinsman Elementary School District 2Celementary2,611
- McClellan Community Consolidated School District 12elementary692
- McHenry Community Consolidated School District 15elementary42,417
- McHenry Community High School District 156secondary46,263
- McLean County Unit School District 598,407
- Medinah School District 11elementary7,024
- Mendota Community Consolidated School District 289elementary10,085
- Mendota Township High School District 280secondary10,380
- Mercer County School District 4047,985
- Meredosia-Chambersburg Community Unit School District 111,351
- Meridian Community Unit School District 155,545
- Meridian Community Unit School District 1013,092
- Meridian Community Unit School District 2239,110
- Metamora Community Consolidated School District 1elementary6,781
- Midland Community Unit School District 74,861
- Midlothian School District 143elementary13,398
- Midwest Central Community Unit School District 1915,009
- Milford Area Public School District 1243,608
- Millburn Community Consolidated School District 24elementary9,091
- Miller Township Community Consolidated School Districtelementary2,684
- Millstadt Consolidated Community School District 160elementary8,179
- Minooka Community Consolidated School District 201elementary31,134
- Minooka Community High School District 111secondary44,775
- Mokena School District 159elementary16,253
- Moline-Coal Valley School District 4047,779
- Momence Community Unit School District 16,682
- Monmouth-Roseville Community Unit School District 23810,403
- Monroe School District 70elementary3,375
- Monticello Community Unit School District 259,621
- Montmorency Community Consolidated School District 145elementary2,852
- Morris Community High School District 101secondary19,472
- Morris School District 54elementary11,787
- Morrison Community Unit School District 66,603
- Morrisonville Community Unit School District 11,886
- Morton Community Unit School District 70919,876
- Morton Grove School District 70elementary10,128
- Mount Olive Community Unit School District 53,076
- Mount Prospect School District 57elementary20,363
- Mount Pulaski Community Unit District 233,581
- Mount Vernon School District 80elementary12,389
- Mount Vernon Township High School District 201secondary28,299
- Mount Zion Community Unit School District 312,696
- Mulberry Grove Community Unit School District 12,318
- Mundelein Consolidated High School District 120secondary44,837
- Mundelein Elementary School District 75elementary15,359
- Murphysboro Community Unit School District 18614,228
- Naperville Community Unit District 20396,944
- Nashville Community High School District 99secondary8,431
- Nashville Consolidated Community School District 49elementary6,301
- Nauvoo-Colusa Community Unit School District 3251,821
- Neoga Community Unit School District 34,471
- Nettle Creek Community Consolidated School District 24Celementary1,310
- New Athens Community Unit School District 603,764
- New Berlin CUSD 165,915
- New Holland-Middletown Elementary School District 88elementary830
- New Hope Community Consolidated School District 6elementary1,552
- New Lenox School District 122elementary43,328
- New Simpson Hill Consolidated District 32elementary2,037
- New Trier Township High School District 203secondary60,444
- Newark Community Consolidated School District 66elementary2,374
- Newark Community High School District 18secondary3,625
- Niles Elementary School District 71elementary7,298
- Niles Township Community High School District 219secondary99,245
- Nippersink School District 2elementary11,654
- Nokomis Community Unit School District 224,131
- Norridge School District 80elementary12,419
- Norris City-Omaha-Enfield Community Unit School District 34,765
- North Boone Community Unit School District 2008,381
- North Chicago School District 18727,939
- North Clay Community Unit School District 254,385
- North Greene Unit School District 34,662
- North Mac Community Unit School District 347,864
- North Palos School District 117elementary29,491
- North Pekin-Marquette Heights School District 102elementary5,080
- North Shore School District 112elementary36,390
- North Wamac School District 186elementary573
- North Wayne Community Unit School District 2002,683
- Northbrook Elementary School District 27elementary11,222
- Northbrook School District 28elementary15,539
- Northbrook/Glenview School District 30elementary10,290
- Northfield Township High School District 225secondary90,257
- Northwestern Community Unit School District 22,341
- Norwood Elementary School District 63elementary3,577
- O'Fallon Community Consolidated School District 90elementary32,272
- O'Fallon Township High School District 203secondary44,393
- Oak Grove School District 68 (Lake County)elementary7,723
- Oak Grove School District 68 (Peoria County)elementary3,750
- Oak Lawn Community High School District 229secondary38,915
- Oak Lawn-Hometown School District 123elementary35,365
- Oak Park and River Forest District 200secondary65,284
- Oak Park Elementary School District 97elementary53,292
- Oakdale Community Consolidated School District 1elementary829
- Oakland Community Unit School District 52,121
- Oakwood Community Unit School District 765,734
- Oblong Community Unit School District 43,772
- Odell Community Consolidated School District 435elementary1,233
- Odin Public School District 7221,750
- Oglesby Elementary School District 125elementary4,448
- Ohio Community Consolidated School District 17elementary1,084
- Ohio Community High School District 505secondary1,104
- Okaw Valley Community Unit School District 3023,042
- Olympia Community Unit School District 1610,797
- Opdyke-Belle Rive Community Consolidated School District 5elementary2,106
- Orangeville Community Unit School District 2032,319
- Oregon Community Unit School District 22010,420
- Orion Community Unit School District 2235,794
- Orland School District 135elementary55,026
- Oswego Community Unit School District 30884,549
- Ottawa Elementary School District 141elementary18,936
- Ottawa Township High School District 140secondary30,670
- Palatine Community Consolidated School District 15elementary118,374
- Palestine Community Unit School District 32,269
- Palos Community Consolidated School District 118elementary23,005
- Palos Heights School District 128elementary10,274
- Pana Community Unit School District 88,413
- Panhandle Community Unit School District 22,941
- Paris Community Unit School District 43,917
- Paris-Union School District 957,658
- Park Forest School District 163elementary15,385
- Park Ridge Consolidated Community School District 64elementary42,417
- Patoka Community Unit School District 1001,220
- Paw Paw CUSD 2711,588
- Pawnee Community Unit School District 113,280
- Paxton-Buckley-Loda Community Unit School District 108,340
- Payson Community Unit School District 12,664
- Pearl City Community Unit School District 2002,290
- Pecatonica Community Unit School District 3214,997
- Pekin Community High School District 303secondary42,571
- Pekin Public School District108elementary31,275
- Pembroke Consolidated Community School District 259elementary1,480
- Pennoyer School District 79elementary6,332
- Peoria Heights Community Unit School District 3256,618
- Peoria School District 15091,711
- Peotone Community Unit School District 207U10,998
- Peru Elementary School District 124elementary9,888
- Pikeland Community Unit School District 107,183
- Pinckneyville Community High School District 101secondary10,597
- Pinckneyville School District 50elementary5,762
- Plainfield School District 202128,402
- Plano Community Unit School District 8812,778
- Pleasant Hill Community Unit School District 31,957
- Pleasant Hill School District 69elementary1,689
- Pleasant Plains Community Unit School District 87,211
- Pleasant Valley School District 62elementary4,001
- Pleasantdale School District 107elementary8,349
- Polo Community Unit School District 2224,118
- Pontiac Community Consolidated School District 429elementary12,804
- Pontiac Township High School District 90secondary15,375
- Pontiac-William Holliday School District 105elementary7,483
- Pope County Community Unit School District 13,739
- Porta Community Unit School District 2026,880
- Posen-Robbins Elementary School District 143-5elementary11,671
- Potomac Community Unit School District 10elementary1,010
- Prairie Central Community Unit School District 810,414
- Prairie du Rocher Community Consolidated School District 134elementary716
- Prairie Grove Community School District 46elementary7,257
- Prairie Hill Community Consolidated School District 133elementary5,361
- Prairie-Hills Elementary School District 144elementary19,583
- Prairieview-Ogden Community Consolidated School District 197elementary2,278
- Princeton Elementary School District 115elementary11,401
- Princeton High School District 500secondary12,182
- Princeville Community Unit School District 3264,136
- Prophetstown-Lyndon-Tampico Community Unit School District 34,500
- Prospect Heights School District 23elementary16,863
- Proviso Township High School District 209secondary122,651
- Putnam County Community Unit School District 5355,133
- Queen Bee School District 16elementary16,368
- Quincy School District 17249,345
- Raccoon Consolidated School District 1elementary2,398
- Ramsey Community Unit School District 2043,073
- Rankin Community School District 98elementary3,715
- Rantoul City School District 137elementary11,853
- Rantoul Township High School District 193secondary16,300
- Reavis Township High School District 220secondary32,381
- Red Bud Community Unit School District 1327,095
- Red Hill Community Unit School District 107,083
- Reed Custer Community Unit School District 255U9,609
- Rhodes School District 84-5elementary4,424
- Rich Township High School District 227secondary66,144
- Richland County Community Unit School District 115,590
- Richland School District 88Aelementary11,996
- Richmond-Burton Community High School District 157secondary11,654
- Ridgeland School District 122elementary21,125
- Ridgeview Community Unit School District 193,729
- Ridgewood Community High School District 234secondary19,650
- Riley Community Consolidated School District 18elementary3,376
- River Bend Community Unit District 26,485
- River Forest School District 90elementary11,992
- River Grove School District 85-5elementary8,631
- River Ridge Community Unit School District 2103,782
- River Trails School District 26elementary14,644
- Riverdale Community Unit School District 1006,779
- Riverside Brookfield Township School District 208secondary30,389
- Riverside School District 96elementary14,734
- Riverton Community Unit School District 147,339
- Riverview Consolidated Community School District 2elementary2,274
- Roanoke-Benson Community Unit School District 603,124
- Robein School District 85elementary2,115
- Robinson Community Unit School District 211,093
- Rochelle Community Consolidated District 231elementary13,636
- Rochelle Township High School District 212secondary17,138
- Rochester Community Unit School District 3A10,634
- Rock Falls Elementary School District 13elementary7,973
- Rock Falls Township High School District 301secondary13,773
- Rock Island-Milan School District 4142,349
- Rockdale School District 84elementary2,954
- Rockford School District 205185,237
- Rockridge Community Unit School District 3007,712
- Rockton School District 140elementary12,677
- Rome Community Consolidated School District 2elementary2,542
- Rondout School District 72elementary1,933
- Rooks Creek Community Consolidated School District 425elementary563
- Roselle School District 12elementary7,648
- Rosemont Elementary School District 78elementary1,977
- Rossville-Alvin Community Unit School District 72,005
- Round Lake Community Unit School District 11635,039
- ROWVA Community Unit School District 2083,480
- Roxana Community Unit School District 111,541
- Rutland Community Consolidated School District 230elementary995
- Salem Community High School District 600secondary14,607
- Salem School District 111elementary8,653
- Salt Creek School District 48elementary9,225
- Salt Fork Community Unit School District 5124,519
- Sandoval Community Unit School District 5012,392
- Sandridge School District 172elementary3,517
- Sandwich Community Unit School District 43013,374
- Sangamon Valley Community Unit School District 94,093
- Saratoga Community Consolidated School District 60Celementary6,533
- Saunemin Community Consolidated School District 438elementary1,002
- Scales Mound Community Unit School District 2112,036
- Schaumburg Community Consolidated School District 54elementary133,890
- Schiller Park School District 81elementary12,861
- School District U-46231,754
- Schuyler-Industry Community Unit School District 57,347
- Scott-Morgan Consolidated Unit School District 21,288
- SD 45 DuPage Countyelementary37,465
- Selmaville Community Consolidated School District 10elementary1,958
- Seneca Community Consolidated School District 170elementary3,597
- Seneca Township High School District 160secondary7,207
- Serena CUSD 25,882
- Sesser-Valier Community Unit School District 1964,166
- Shawnee Community Unit School District 841,745
- Shelbyville Community Unit School District 47,758
- Sherrard Community Unit School District 2008,704
- Shiloh Community Unit School District 12,682
- Shiloh Village School District 85elementary4,969
- Shirland Community Consolidated School District 134elementary1,305
- Signal Hill School District 181elementary2,814
- Silvis School District 34elementary5,191
- Skokie School District 68elementary20,990
- Skokie School District 69elementary18,579
- Skokie School District 73-5elementary10,187
- Skokie-Fairview School District 72elementary6,238
- Smithton Community Consolidated School District 130elementary4,079
- Somonauk Community Unit School District 4324,784
- South Central Community Unit School District 4014,031
- South Fork School District 142,254
- South Holland School District 150elementary8,989
- South Holland School District 151elementary12,920
- South Pekin School District 137elementary1,454
- South Wilmington Consolidated School District 74elementary681
- Southeastern Community Unit School District 3373,120
- Southwestern Community Unit School District 98,468
- Sparta Community Unit School District 1408,194
- Spoon River Valley Community Unit School District 41,971
- Spring Garden Community Consolidated School District 178elementary3,748
- Spring Lake Community Consolidated School District 606elementary810
- Spring Valley Community Consolidated School District 99elementary6,071
- Springfield School District 186107,776
- St. Anne Community High School District 302secondary4,104
- St. Anne Consolidated Community School District 256elementary2,624
- St. Charles Community Unit School District 30368,211
- St. Elmo Community Unit School District 2022,523
- St. George Community Consolidated School District 258elementary3,926
- St. Joseph Community Consolidated School District 169elementary5,912
- St. Joseph-Ogden Community High School District 305secondary7,988
- St. Libory Consolidated School District 30elementary802
- St. Rose School District 14-15elementary1,312
- Stark County Community Unit School District 1004,249
- Staunton Community Unit School District 68,229
- Steeleville Community Unit School District 1382,850
- Steger School District 194elementary13,899
- Sterling Community Unit District 520,900
- Steward Elementary School District 220elementary737
- Stewardson-Strasburg Community Unit District 5A2,630
- Stockton Community Unit School District 2063,556
- Streator Elementary School District 44elementary14,924
- Streator Township High School District 40secondary16,518
- Sullivan Community Unit School District 3007,440
- Summersville School District 79elementary2,303
- Summit Hill School District 161elementary24,411
- Summit School District 104elementary11,769
- Sunnybrook School District 171elementary10,613
- Sunset Ridge School District 29elementary4,129
- Sycamore Community Unit School District 42722,192
- Taft School District 90elementary3,282
- Tamaroa School District 5elementary885
- Taylorville Community Unit School District 318,633
- Teutopolis Community Unit School District 505,732
- Thomasboro Community Consolidated School District 130elementary2,224
- Thompsonville Community Unit School District 1741,792
- Thornton Fractional Township High School District 215secondary57,727
- Thornton School District 154elementary2,307
- Thornton Township High School District 205secondary100,939
- Tolono Community Unit School District 79,107
- Tonica Community Consolidated School District 79elementary1,362
- Township High School District 113secondary59,604
- Township High School District 211secondary234,580
- Township High School District 214secondary252,824
- Tremont Community Unit School District 7025,154
- Tri-City Community Unit School District 13,586
- Tri-Point Community Unit School District 6-J2,479
- Tri-Valley Community Unit School District 35,002
- Triad Community Unit School District 222,793
- Trico Community Unit School District 1765,969
- Triopia Community Unit School District 272,183
- Troy Community Consolidated School District 30Celementary37,953
- Tuscola Community Unit School District 3015,906
- Union Ridge School District 86elementary6,500
- Union School District 81elementary2,020
- United Community School District 3045,900
- United Township High School District 30secondary39,552
- Unity Point Community Consolidated School District 140elementary5,601
- Urbana School District 11649,730
- V.I.T. Community Unit School District 22,206
- Valley View Community Unit School District 365U91,709
- Valmeyer Community Unit School District 32,259
- Vandalia Community Unit School District 20311,578
- Venice Community Unit School District 3702
- Vienna High School District 133secondary9,821
- Vienna School District 55elementary5,581
- Villa Grove Community Unit School District 3023,929
- Virginia Community Unit School District 642,218
- Wabash Community Unit School District 3489,876
- Wallace Community Consolidated School District 195elementary2,937
- Waltham Community Consolidated School District 185elementary2,528
- Waltonville Community Unit School District 12,054
- Warren Community Unit School District 2052,583
- Warren Township High School District 121secondary69,669
- Warrensburg-Latham Community Unit District 116,427
- Warsaw Community Unit School District 3162,425
- Washington Community High School District 308secondary24,243
- Washington School District 52elementary7,864
- Waterloo Community Unit School District 519,409
- Wauconda Community Unit School District 11828,883
- Waukegan Community Unit School District 6082,393
- Waverly Community Unit School District 62,070
- Wayne City Community Unit School District 1003,704
- Wesclin Community Unit School District 37,837
- West Carroll Community Unit School District 3149,166
- West Central Community Unit School District 2355,481
- West Chicago School District 33elementary28,555
- West Harvey-Dixmoor Public School District 147elementary9,183
- West Lincoln-Broadwell Elementary School District 92elementary4,483
- West Northfield School District 31elementary10,436
- West Prairie Community Unit School District 1034,435
- West Washington County Community Unit District 103,748
- Westchester School District 92-5elementary15,676
- Western Community Unit School District 123,399
- Western Springs School District 101elementary9,924
- Westmont Community Unit School District 20111,997
- Westville Community Unit School District 26,398
- Wethersfield Community Unit School District 2303,593
- Wheeling Community Consolidated School District 21elementary68,651
- Whiteside School District 115elementary13,613
- Will County School District 92elementary13,720
- Williamsfield Community Unit School District 2101,932
- Williamsville Community Unit School District 157,650
- Willow Grove School District 46elementary1,463
- Willow Springs School District 108elementary4,831
- Wilmette School District 39elementary26,269
- Wilmington Community Unit School District 209U8,687
- Winchester Community Unit School District 13,633
- Windsor Community Unit School District 12,095
- Winfield School District 34elementary4,559
- Winnebago Community Unit School District 3237,729
- Winnetka School District 36elementary12,190
- Winthrop Harbor School District 1elementary6,170
- Wolf Branch School District 113elementary9,159
- Wood Dale School District 7elementary10,257
- Wood River-Hartford Elementary School District 15elementary5,995
- Woodland Community Consolidated School District 50elementary51,112
- Woodland Community Unit School District 52,814
- Woodlawn Unit District 2091,896
- Woodlawn Unit District 209 (9-12) in Ashleysecondary125
- Woodlawn Unit District 209 (9-12) in Grand Prairiesecondary558
- Woodlawn Unit District 209 (9-12) in Romesecondary489
- Woodlawn Unit District 209 (KG-8) in Mount Vernonelementary529
- Woodlawn Unit District 209 (KG-8) in Nashvilleelementary25
- Woodridge School District 68elementary32,722
- Woodstock Community Unit School District 20038,769
- Worth School District 127elementary11,378
- Yorkville Community Unit School District 11536,238
- Zeigler-Royalton Community Unit School District 1883,917
- Zion Elementary School District 6elementary17,704
- Zion-Benton Township High School District 126secondary44,775
Congressional districts
As drawn for the 119th Congress (2025–2027).
- Congressional District 1739,958
- Congressional District 2742,590
- Congressional District 3739,663
- Congressional District 4729,797
- Congressional District 5751,305
- Congressional District 6747,517
- Congressional District 7744,315
- Congressional District 8746,772
- Congressional District 9745,003
- Congressional District 10753,708
- Congressional District 11754,751
- Congressional District 12746,831
- Congressional District 13747,221
- Congressional District 14763,833
- Congressional District 15746,652
- Congressional District 16748,860
- Congressional District 17746,022
State senate districts
The upper chamber’s districts, as drawn in 2024.
- State Senate District 1209,171
- State Senate District 2213,289
- State Senate District 3214,258
- State Senate District 4211,363
- State Senate District 5216,544
- State Senate District 6214,839
- State Senate District 7217,199
- State Senate District 8219,767
- State Senate District 9209,561
- State Senate District 10220,494
- State Senate District 11214,409
- State Senate District 12211,485
- State Senate District 13215,061
- State Senate District 14211,703
- State Senate District 15210,106
- State Senate District 16209,032
- State Senate District 17210,823
- State Senate District 18215,786
- State Senate District 19216,125
- State Senate District 20212,013
- State Senate District 21217,202
- State Senate District 22212,712
- State Senate District 23215,620
- State Senate District 24216,385
- State Senate District 25217,985
- State Senate District 26218,669
- State Senate District 27209,038
- State Senate District 28213,849
- State Senate District 29216,981
- State Senate District 30215,188
- State Senate District 31216,803
- State Senate District 32219,929
- State Senate District 33217,820
- State Senate District 34215,214
- State Senate District 35217,029
- State Senate District 36214,332
- State Senate District 37215,356
- State Senate District 38221,017
- State Senate District 39211,939
- State Senate District 40216,164
- State Senate District 41216,848
- State Senate District 42219,172
- State Senate District 43218,418
- State Senate District 44215,044
- State Senate District 45215,911
- State Senate District 46216,809
- State Senate District 47214,296
- State Senate District 48213,426
- State Senate District 49219,575
- State Senate District 50214,425
- State Senate District 51216,541
- State Senate District 52218,493
- State Senate District 53214,250
- State Senate District 54214,132
- State Senate District 55216,939
- State Senate District 56214,990
- State Senate District 57213,995
- State Senate District 58214,561
- State Senate District 59214,713
State house districts
The lower chamber’s districts, as drawn in 2024.
- State House District 1103,934
- State House District 2105,237
- State House District 3106,336
- State House District 4106,953
- State House District 5111,190
- State House District 6103,068
- State House District 7103,862
- State House District 8107,501
- State House District 9112,096
- State House District 10104,448
- State House District 11106,948
- State House District 12107,891
- State House District 13109,907
- State House District 14107,292
- State House District 15109,780
- State House District 16109,987
- State House District 17104,690
- State House District 18104,871
- State House District 19110,910
- State House District 20109,584
- State House District 21108,058
- State House District 22106,351
- State House District 23105,283
- State House District 24106,202
- State House District 25107,749
- State House District 26107,312
- State House District 27107,088
- State House District 28104,615
- State House District 29102,738
- State House District 30107,368
- State House District 31103,648
- State House District 32105,384
- State House District 33103,864
- State House District 34106,959
- State House District 35107,054
- State House District 36108,732
- State House District 37108,055
- State House District 38108,070
- State House District 39103,873
- State House District 40108,140
- State House District 41111,164
- State House District 42106,038
- State House District 43106,553
- State House District 44106,159
- State House District 45106,574
- State House District 46109,046
- State House District 47108,588
- State House District 48107,797
- State House District 49108,142
- State House District 50109,843
- State House District 51109,836
- State House District 52108,833
- State House District 53104,795
- State House District 54104,243
- State House District 55107,589
- State House District 56106,260
- State House District 57107,382
- State House District 58109,599
- State House District 59108,315
- State House District 60106,873
- State House District 61108,391
- State House District 62108,412
- State House District 63109,781
- State House District 64110,148
- State House District 65108,755
- State House District 66109,065
- State House District 67106,455
- State House District 68108,759
- State House District 69107,668
- State House District 70109,361
- State House District 71107,833
- State House District 72106,499
- State House District 73108,178
- State House District 74107,178
- State House District 75112,746
- State House District 76108,271
- State House District 77106,252
- State House District 78105,687
- State House District 79106,542
- State House District 80109,622
- State House District 81108,712
- State House District 82108,136
- State House District 83108,970
- State House District 84110,202
- State House District 85111,089
- State House District 86107,329
- State House District 87107,486
- State House District 88107,558
- State House District 89107,832
- State House District 90108,079
- State House District 91109,577
- State House District 92107,232
- State House District 93107,410
- State House District 94106,886
- State House District 95108,847
- State House District 96104,579
- State House District 97112,908
- State House District 98106,667
- State House District 99108,025
- State House District 100106,400
- State House District 101109,246
- State House District 102107,295
- State House District 103109,095
- State House District 104109,398
- State House District 105108,391
- State House District 106105,859
- State House District 107107,054
- State House District 108107,078
- State House District 109109,431
- State House District 110107,508
- State House District 111108,282
- State House District 112106,708
- State House District 113106,263
- State House District 114107,732
- State House District 115107,635
- State House District 116106,926
- State House District 117107,786
- State House District 118106,927
PUMAs
Public Use Microdata Areas: areas of 100,000 people or more that the state draws from census tracts, for the Census Bureau’s microdata.
- Adams, Fulton, Pike, Mason, Schuyler & Brown Counties PUMA138,097
- Champaign (North & East), Vermilion, Iroquois & Ford Counties PUMA145,065
- Champaign County (Southwest)–Champaign & Urbana Cities PUMA175,917
- Chicago City (Central)–Near North Side, Loop & Near South Side PUMA180,363
- Chicago City (North)–Lake View & Lincoln Park PUMA170,814
- Chicago City (North)–Uptown, Edgewater & Rogers Park PUMA167,080
- Chicago City (North)–West Ridge, Lincoln Square & North Center PUMA156,038
- Chicago City (Northwest)–Albany Park, Norwood Park, Forest Glen, North Park & O'Hare PUMA149,028
- Chicago City (Northwest)–Logan Square, Irving Park & Avondale PUMA161,240
- Chicago City (Northwest)–Portage Park, Dunning & Jefferson Park PUMA130,913
- Chicago City (South)–Chicago Lawn, Greater Grand Crossing & West Englewood/Englewood PUMA134,891
- Chicago City (South)–Hyde Park, Grand Boulevard, Woodlawn, Douglas & Kenwood PUMA143,016
- Chicago City (South)–Roseland, Chatham, West Pullman, Calumet Heights & Avalon Park PUMA127,945
- Chicago City (South)–South Shore, South Chicago, East Side & South Deering PUMA123,123
- Chicago City (Southwest)–Ashburn, Garfield Ridge, West Lawn, Clearing & West Elsdon PUMA165,625
- Chicago City (Southwest)–Auburn Gresham, Washington Heights, Morgan Park & Beverly PUMA128,075
- Chicago City (Southwest)–New City, Lower West Side, Bridgeport & McKinley Park PUMA135,963
- Chicago City (Southwest)–South Lawndale, Brighton Park & Gage Park PUMA148,959
- Chicago City (West)–Austin, North Lawndale & East/West Garfield Park PUMA167,237
- Chicago City (West)–Belmont Cragin, Humboldt Park, Hermosa & Montclare PUMA165,097
- Chicago City (West)–West Town & Near West Side PUMA155,146
- Coles, Douglas, Crawford, Edgar, Clark & Cumberland Counties PUMA127,174
- Cook County (Central)–Cicero & Berwyn Townships PUMA138,392
- Cook County (North)–Maine & Niles (West) Townships PUMA167,620
- Cook County (North)–Wheeling Township (North & East) PUMA127,758
- Cook County (Northeast)–Evanston & Niles (East) Townships PUMA155,054
- Cook County (Northeast)–Northfield & New Trier Townships PUMA145,835
- Cook County (Northwest)–Elk Grove & Wheeling (Southwest) Townships PUMA121,497
- Cook County (Northwest)–Hanover & Schaumburg (Northwest) Townships PUMA118,682
- Cook County (Northwest)–Palatine & Barrington Townships PUMA125,951
- Cook County (Northwest)–Schaumburg Township (South & East) PUMA110,944
- Cook County (South Central)–Bremen & Orland (East) Townships PUMA145,738
- Cook County (South Central)–Worth & Calumet Townships PUMA167,505
- Cook County (South)–Bloom & Rich Townships PUMA158,314
- Cook County (Southeast)–Thornton Township PUMA153,682
- Cook County (Southwest)–Palos, Lemont & Orland (North & West) Townships PUMA133,446
- Cook County (West)–Leyden & Norwood Park Townships PUMA118,783
- Cook County (West)–Lyons & Stickney Townships PUMA153,120
- Cook County (West)–Oak Park, Riverside, River Forest & Proviso (Southeast) Townships PUMA118,623
- Cook County (West)–Proviso Township (North & West) PUMA110,593
- DeKalb & Ogle Counties PUMA152,198
- DuPage County (Central)–Milton Township PUMA119,372
- DuPage County (East Central)–York Township PUMA127,667
- DuPage County (Northeast)–Addison & Bloomingdale (North) Townships PUMA115,929
- DuPage County (Northwest)–Wayne, Bloomingdale (South) & Winfield (North) Townships PUMA174,208
- DuPage County (South Central)–Lisle Township PUMA118,895
- DuPage County (Southeast)–Downers Grove Township PUMA149,038
- DuPage County (Southwest)–Naperville & Winfield (South) Townships PUMA124,915
- Effingham, Fayette, Wayne, Richland, Lawrence, Clay & Jasper Counties PUMA124,671
- Henry, McDonough, Hancock, Warren, Mercer & Henderson Counties PUMA130,979
- Kane County (East)–St. Charles, Batavia (East) & Geneva (East) Townships PUMA119,295
- Kane County (Northeast)–Dundee & Elgin (North & Central) Townships PUMA136,960
- Kane County (Southeast)–Aurora Township PUMA126,432
- Kane County (West) PUMA134,568
- Kankakee & Grundy Counties PUMA159,854
- Kendall County PUMA137,675
- Knox, Woodford, Bureau, Marshall, Putnam & Stark Counties PUMA142,780
- Lake County (East Central)–Warren, Shields & Libertyville (North & West) Townships PUMA155,614
- Lake County (Northeast)–Waukegan, Zion, Benton & Newport Townships PUMA139,942
- Lake County (Northwest)–Avon, Lake Villa, Grant & Antioch Townships PUMA159,057
- Lake County (Southeast)–Vernon, Moraine & West Deerfield Townships PUMA139,103
- Lake County (Southwest)–Ela, Fremont, Wauconda & Cuba Townships PUMA120,507
- LaSalle & Livingston Counties PUMA144,279
- Macon & Christian Counties–Decatur City PUMA135,387
- Macoupin, Morgan, Jersey, Cass, Greene, Scott & Calhoun Counties PUMA132,379
- Madison County (East) PUMA126,250
- Madison County (West) PUMA137,988
- Marion, Jefferson, Clinton, Randolph, Bond & Washington Counties PUMA170,905
- McHenry County (North, West & Central) PUMA138,953
- McHenry County (Southeast)–Algonquin, McHenry & Nunda Townships PUMA173,638
- McLean County–Bloomington City & Normal Town PUMA171,556
- Montgomery, Logan, Shelby, Piatt, De Witt, Moultrie & Menard Counties PUMA134,962
- Peoria County–Peoria City PUMA179,645
- Rock Island County PUMA142,757
- Sangamon County–Springfield City PUMA194,947
- South & Southeast Illinois–Saline, Union & Massac Counties PUMA128,233
- St. Clair (South & East) & Monroe Counties PUMA124,694
- St. Clair County (Northwest) PUMA164,036
- Tazewell County PUMA130,290
- Whiteside, Stephenson, Lee, Jo Daviess & Carroll Counties PUMA170,011
- Will County (Northeast)–Frankfort, Homer & New Lenox (North) Townships PUMA129,707
- Will County (Northwest)–Plainfield & Lockport Townships PUMA142,972
- Will County (Northwest)–Wheatland & DuPage Townships PUMA177,716
- Will County (South) PUMA116,051
- Will County (West Central)–Joliet & Troy Townships PUMA135,016
- Williamson, Jackson, Franklin & Perry Counties PUMA177,902
- Winnebago (Northeast) & Boone Counties PUMA142,718
- Winnebago County (Southeast & West)–Rockford City PUMA193,804
Urban areas
Each that reaches into Illinois, with its whole population. Urban areas are the densely settled land the Census Bureau draws after each census, whatever the city lines.
- Alton, IL79,347
- Anna, IL6,081
- Beardstown, IL6,316
- Beloit, WI–IL63,575
- Benton, IL7,537
- Bloomington–Normal, IL134,960
- Breese, IL4,264
- Burlington, IA–IL27,995
- Byron, IL5,299
- Canton, IL12,718
- Cape Girardeau, MO–IL56,234
- Carbondale, IL31,028
- Carlinville, IL5,622
- Carmi, IL5,054
- Centralia, IL14,748
- Champaign, IL150,087
- Charleston, IL17,178
- Chester, IL6,023
- Chicago, IL–IN8.59M
- Clinton–Fulton, IA–IL30,944
- Clinton, IL7,394
- Coal City–Braidwood, IL16,087
- Danville, IL39,584
- Davenport, IA–IL283,341
- Decatur, IL84,943
- DeKalb, IL65,358
- Dixon, IL15,724
- Du Quoin, IL6,095
- Dubuque, IA–IL69,287
- Effingham, IL13,681
- Elburn, IL6,648
- Eureka, IL5,320
- Fairfield, IL4,428
- Flora, IL4,376
- Fort Madison, IA–IL9,696
- Freeport, IL23,418
- Galesburg, IL33,389
- Geneseo, IL6,607
- Genoa, IL5,277
- Gillespie, IL4,783
- Greenville, IL6,753
- Hampshire, IL5,969
- Harrisburg, IL8,448
- Harvard, IL9,448
- Highland, IL10,623
- Hillsboro, IL6,661
- Hoopeston, IL4,951
- Jacksonville, IL21,268
- Jerseyville, IL7,793
- Kankakee, IL66,343
- Keokuk, IA–IL12,176
- Kewanee, IL12,322
- Lake Holiday, IL7,026
- Lawrenceville, IL4,834
- Lincoln, IL14,070
- Litchfield, IL6,480
- Macomb, IL15,134
- Mahomet, IL12,349
- Manhattan, IL8,704
- Manteno, IL10,645
- Marengo, IL7,090
- Marion–Herrin, IL39,173
- Marseilles, IL4,085
- Mascoutah, IL8,816
- Mattoon, IL17,156
- McHenry Northwest–Wonder Lake, IL5,872
- Mendota, IL6,767
- Metropolis, IL5,706
- Monmouth, IL9,004
- Monticello, IL6,378
- Morris, IL16,455
- Mount Carmel, IL6,838
- Mount Vernon, IL14,730
- Olney, IL8,597
- Ottawa, IL19,891
- Paducah, KY–IL50,801
- Pana, IL5,362
- Paris, IL8,165
- Paxton, IL4,125
- Peoria, IL257,957
- Peru–LaSalle, IL29,833
- Pontiac, IL11,382
- Princeton, IL8,150
- Quincy, IL42,948
- Rantoul, IL13,559
- Robinson, IL6,080
- Rochelle, IL11,555
- Rockford, IL275,774
- Round Lake Beach–McHenry–Grayslake, IL–WI264,914
- Salem, IL6,766
- Shelbyville, IL4,501
- Springfield, IL157,839
- St. Louis, MO–IL2.14M
- Staunton, IL4,095
- Sterling, IL26,986
- Streator, IL15,499
- Sullivan, IL4,348
- Taylorville, IL11,683
- Tuscola, IL5,110
- Twin Lakes, WI–IL12,326
- Vandalia, IL7,222
- Waterloo, IL9,968
- Watseka, IL4,780
- West Frankfort, IL7,686
- Wilmington, IL6,190
- Woodstock, IL25,849
Turn Illinois into your planning report.
Social Explorer Studio builds an editable profile of any place, with tables and charts beside the county and state, and exports to Word, PDF and Excel.
Questions about Illinois
What is the population of Illinois?
12,719,141 people, according to the ACS 2025 1-year estimates, which the Census Bureau adjusts to match its own population estimate. That’s the 6th largest of the 50 states and DC.
What is the FIPS code for Illinois?
17. Every county’s and place’s FIPS code in Illinois starts with it. The Census Bureau’s full geographic identifier (GEOID) is 0400000US17.
What is the largest city in Illinois?
Chicago, with 2,731,618 people. Other large cities here include Aurora, Naperville and Joliet.
What is the median household income in Illinois?
$86,676 (±$814), according to the ACS 2025 1-year estimates, higher than the US ($84,780).
What is the median age in Illinois?
39.7 years (±0.1), according to the ACS 2025 1-year estimates, higher than the US (39.5).
How much does housing cost in Illinois?
Illinois’s median home value is $294,400 (±$1,931) and its median gross rent is $1,419 (±$17) a month, according to the ACS 2025 1-year estimates. 46.0% (±1.0%) of its renters pay 30% or more of their income on rent.
Is Illinois growing?
Illinois’s population fell 1.1%, from 12,859,995 in 2015 to 12,719,141 in 2025, according to the ACS 1-year estimates.
Where do people who work in Illinois live?
5,653,290 of its 5,943,827 jobs are held by people who live here. Of those who commute in, the most come from Indiana, Wisconsin, Missouri.
Where does this census data come from?
The U.S. Census Bureau’s American Community Survey, through Social Explorer’s tables: the latest 1-year estimates where they exist, for the most recent numbers, and 5-year estimates otherwise. Each table lists its code, so you can find it again.
Is this data free to use?
Yes. You can read it, cite it, download the CSV and embed the charts, with no account. To map other variables, compare your own areas or build a report, see Social Explorer’s plans in a live demo.
Sources and how to cite
American Community Survey 2025 1-year estimates, or 2020–2024 5-year estimates where noted, U.S. Census Bureau, from Social Explorer’s tables A00001, A00002, A01004, A04001, A06001, A08001, A09005, A10001, A10003, A10008, A10030, A10036, A10040, A10047, A10055, A10060, A12001, A13004, A14006, A14024, A14028, A16002, A17005, A18002, A18009, A20001, B02002, B09001, B13002, B18101, C16001. Maps by census tract use 2020–2024 5-year estimates, since the 1-year survey doesn’t cover tracts. Commuting: LEHD LODES 2023. These are estimates from a sample, each with its margin of error. Data retrieved November 14, 2026. How these profiles are made.
U.S. Census Bureau, American Community Survey 2025 1-year estimates, or 2020–2024 5-year estimates where noted, via Social Explorer. “Illinois.” https://www.socialexplorer.com/places/illinois. Accessed November 14, 2026.