

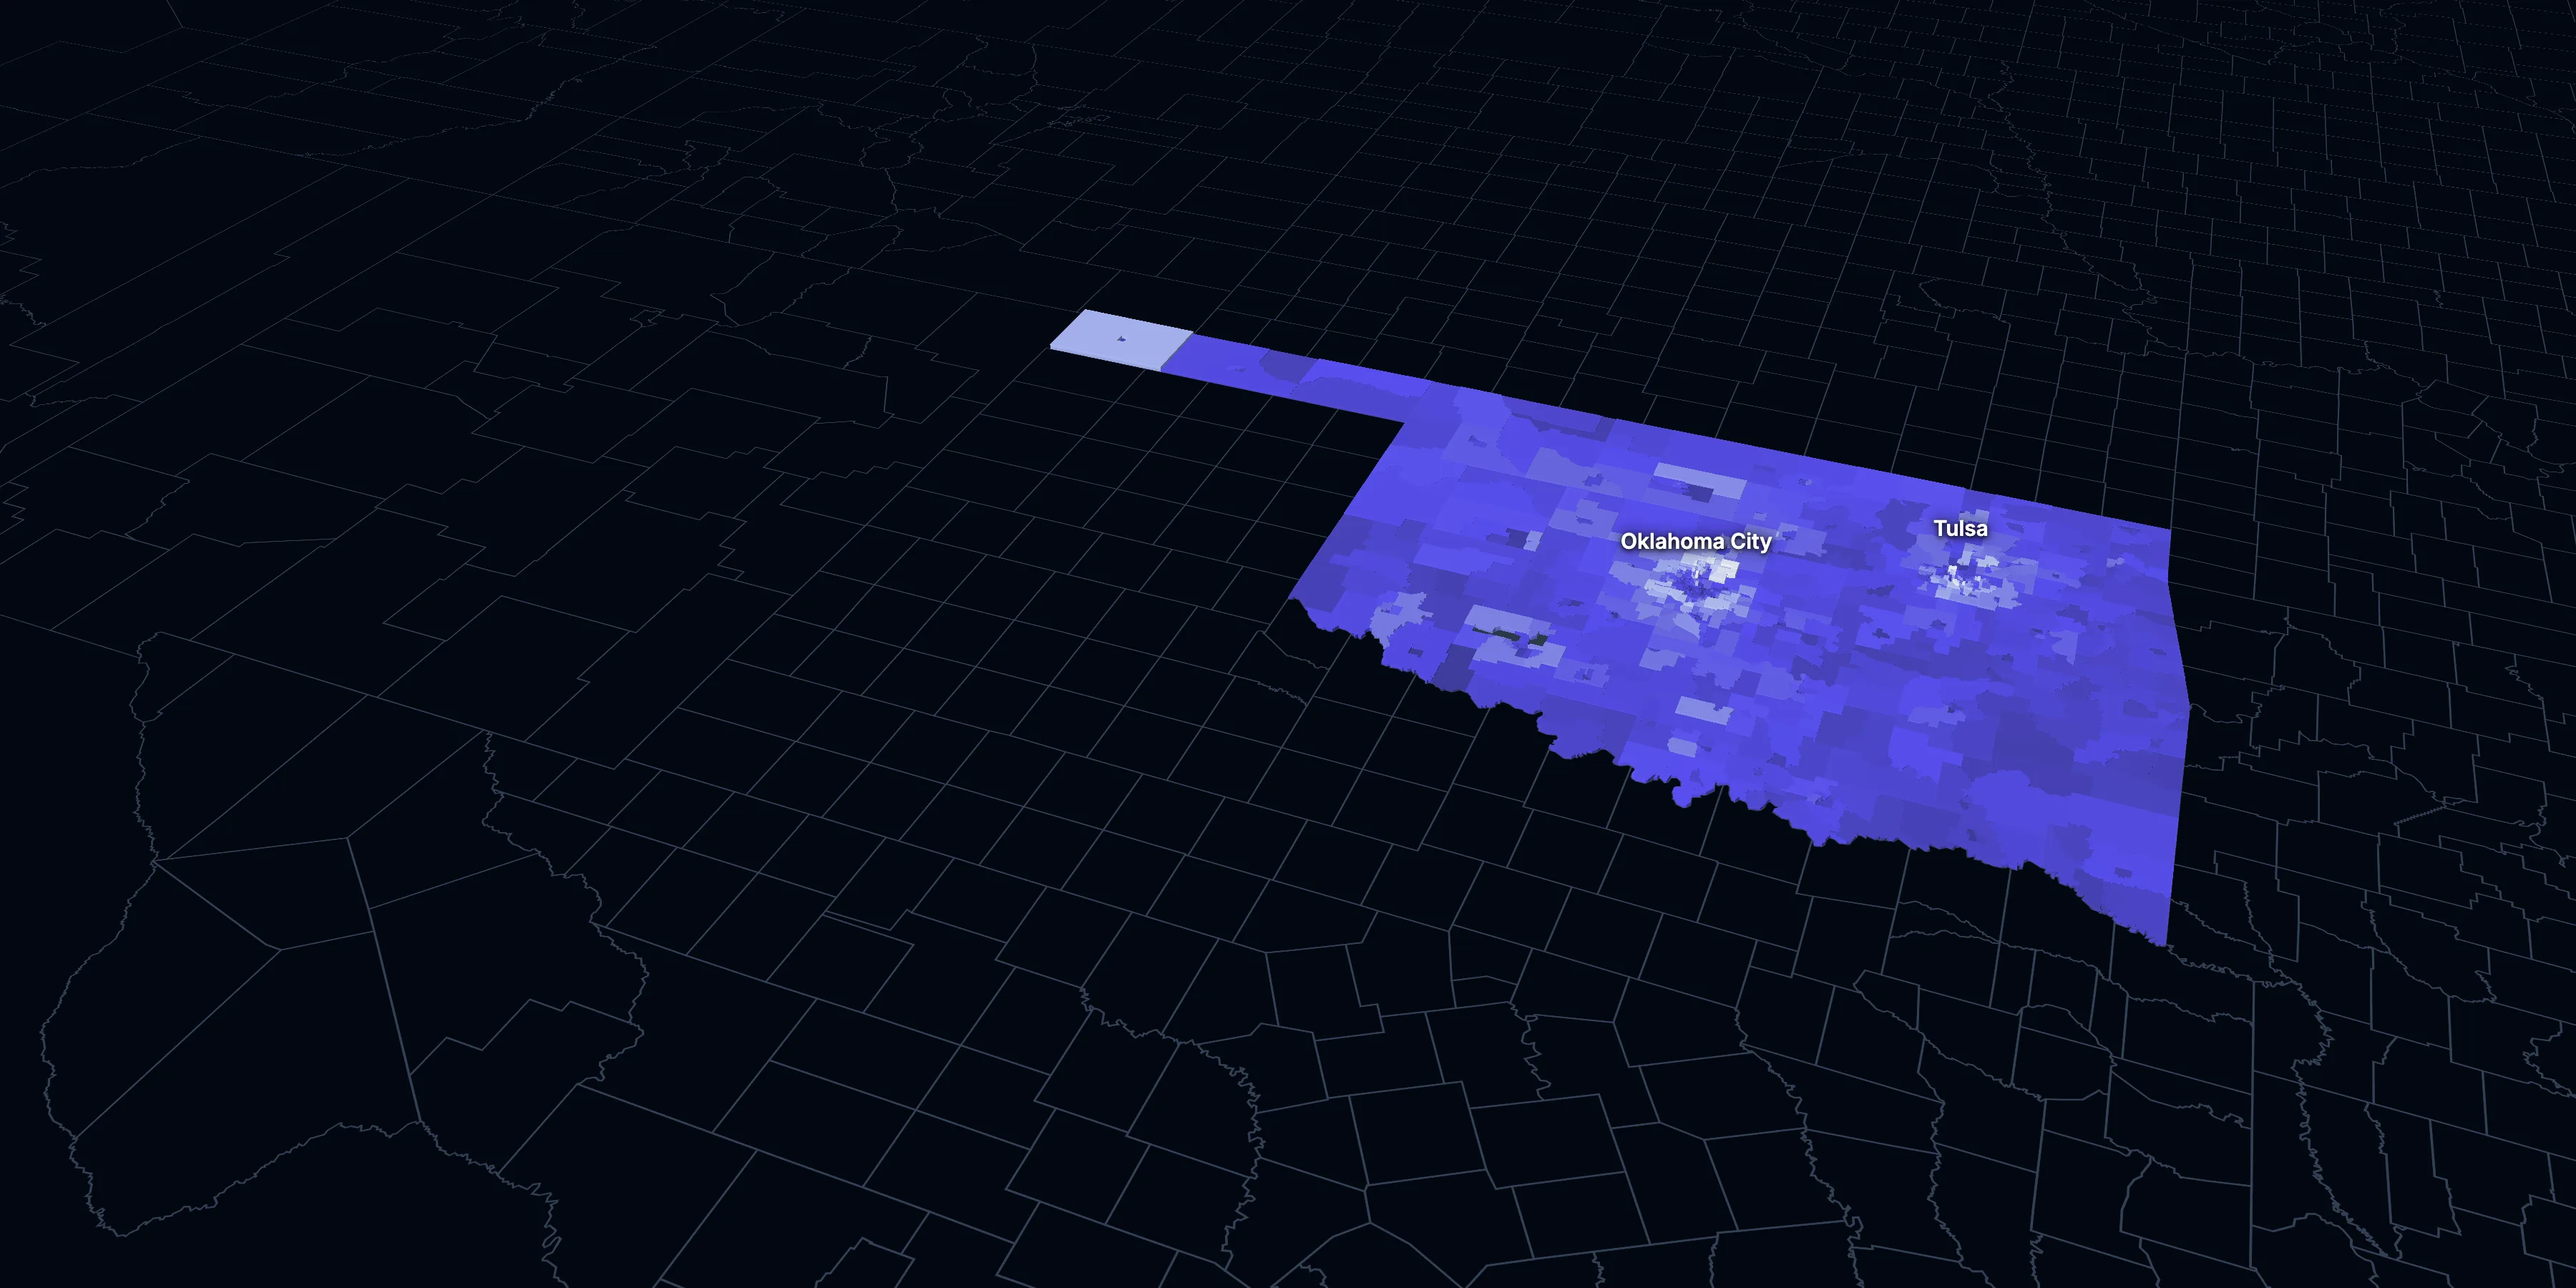
Oklahoma: Population, demographics and census data
Home to 4,123,288 people, the 28th largest of the 50 states and DC, anchored by Oklahoma City and Tulsa. It grew 5.4% between 2015 and 2025.
- Population
- 4.12M. Census Bureau estimate · Rank 28 of the 50 states and DC
- Median household income
- $68,441 ±$911. US $84,780
- Median age
- 37.8 ±0.2. US 39.5
ACS 2025 1-year estimates, U.S. Census Bureau
Taller, lighter tracts have higher household incomes
About Oklahoma
Oklahoma’s median household income is $68,441 (±$911), lower than the US ($84,780), and its median age is 37.8 (±0.2), according to the ACS 2025 1-year estimates. Its largest city is Oklahoma City.
± is each figure’s margin of error, at 90% confidence, and † marks one too uncertain to lean on. Under each percentage in the tables is the number it counts. How the margins are worked out.
FIPS code 40
Highlights
What stands out in Oklahoma
The numbers where Oklahoma sits furthest from the nation, or past a recognized policy benchmark.
Past a policy benchmark
+4 points
ElevatedRent growth ahead of income
After inflation, rent grew 6% from 2015 to 2025, and household income 3%. The dots show rent growth.
Furthest from the national picture
17.7%
Higher than the USLiving with a disability
That’s higher than the US (13.7%). It’s the 5th highest of the 50 states and DC.
12.6%
2nd among statesNo health insurance
That’s higher than the US (8.4%). It’s the 2nd highest of the 50 states and DC.
$1,107
Lower than the USMedian gross rent
That’s lower than the US ($1,557).
6.4%
Very lowBorn outside the US
That’s lower than the US (14.7%).
28.7%
Lower than the USBachelor’s degree or more
That’s lower than the US (37.4%). It’s the 7th lowest of the 50 states and DC.
2015 to 2025
How Oklahoma changed in ten years
The state added 211,950 people. It got older and better educated, and poverty fell 1.7 points.
Population, change since 2015
+5.4% in the state and +6.3% in the US.
Source: ACS 1-year, 2015 to 2025, table A00001.
Show data
| Oklahoma | United States | |
|---|---|---|
| 2015 | 0.0% | 0.0% |
| 2016 | +0.3% | +0.5% |
| 2017 | +0.5% | +1.3% |
| 2018 | +0.8% | +1.8% |
| 2019 | +1.2% | +2.1% |
| 2021 | +1.9% | +3.3% |
| 2022 | +2.8% | +3.7% |
| 2023 | +3.6% | +4.2% |
| 2024 | +4.7% | +5.8% |
| 2025 | +5.4% | +6.3% |
Embed
Median household income, in 2025 dollars
+2.9% in the state and +10.9% in the US.
Source: ACS 1-year, 2015 to 2025, table A14006.
Show data
| Oklahoma | United States | |
|---|---|---|
| 2015 | $66,539 | $76,413 |
| 2016 | $66,514 | $77,931 |
| 2017 | $66,273 | $79,891 |
| 2018 | $67,116 | $80,059 |
| 2019 | $69,128 | $83,427 |
| 2021 | $66,879 | $83,521 |
| 2022 | $66,104 | $82,811 |
| 2023 | $66,107 | $82,683 |
| 2024 | $68,365 | $84,339 |
| 2025 | $68,441 | $84,780 |
Embed
Living in poverty
−1.7 points in the state and −3.0 points in the US.
Source: ACS 1-year, 2015 to 2025, table A13004.
Show data
| Oklahoma | United States | |
|---|---|---|
| 2015 | 16.1% | 14.7% |
| 2016 | 16.3% | 14.0% |
| 2017 | 15.8% | 13.4% |
| 2018 | 15.6% | 13.1% |
| 2019 | 15.2% | 12.3% |
| 2021 | 15.6% | 12.8% |
| 2022 | 15.7% | 12.6% |
| 2023 | 15.9% | 12.5% |
| 2024 | 14.9% | 12.1% |
| 2025 | 14.4% | 11.8% |
Embed
Bachelor’s degree or more
+4.0 points in the state and +6.7 points in the US.
Source: ACS 1-year, 2015 to 2025, table A12001.
Show data
| Oklahoma | United States | |
|---|---|---|
| 2015 | 24.6% | 30.6% |
| 2016 | 25.2% | 31.3% |
| 2017 | 25.5% | 32.0% |
| 2018 | 25.6% | 32.6% |
| 2019 | 26.2% | 33.1% |
| 2021 | 27.9% | 35.0% |
| 2022 | 28.5% | 35.7% |
| 2023 | 28.7% | 36.2% |
| 2024 | 29.3% | 36.8% |
| 2025 | 28.7% | 37.4% |
Embed
Median gross rent, in 2025 dollars
+6.4% in the state and +18.5% in the US.
Source: ACS 1-year, 2015 to 2025, table A18009.
Show data
| Oklahoma | United States | |
|---|---|---|
| 2015 | $1,040 | $1,314 |
| 2016 | $1,006 | $1,327 |
| 2017 | $1,033 | $1,340 |
| 2018 | $1,044 | $1,368 |
| 2019 | $1,033 | $1,393 |
| 2021 | $1,024 | $1,427 |
| 2022 | $1,038 | $1,440 |
| 2023 | $1,085 | $1,496 |
| 2024 | $1,079 | $1,537 |
| 2025 | $1,107 | $1,557 |
Embed
Median home value, in 2025 dollars
+34.7% in the state and +39.3% in the US.
Source: ACS 1-year, 2015 to 2025, table A10036.
Show data
| Oklahoma | United States | |
|---|---|---|
| 2015 | $173,719 | $266,469 |
| 2016 | $178,810 | $277,278 |
| 2017 | $181,931 | $288,124 |
| 2018 | $180,963 | $296,908 |
| 2019 | $186,629 | $305,336 |
| 2021 | $201,862 | $337,116 |
| 2022 | $212,358 | $355,481 |
| 2023 | $221,925 | $361,931 |
| 2024 | $229,543 | $372,685 |
| 2025 | $234,000 | $371,100 |
Embed
ACS 1-year estimates. The dotted stretch of each line spans 2020, when the Census Bureau released no standard 1-year estimates. Dollar values are in 2025 dollars.
| Indicator | 2015 | 2025 | Change |
|---|---|---|---|
| Population | 3,911,338 | 4,123,288 | +5.4% |
| Median age | 36.3 | 37.8 | +1.5 years |
| 65 and over | 14.7% | 18.0% | +3.2 points |
| Born outside the US | 6.0% | 6.4% | +0.4 points |
| Hispanic or Latino | 10.1% | 14.0% | +3.9 points |
| Median household income | $66,539 | $68,441 | +2.9% |
| Living in poverty | 16.1% | 14.4% | −1.7 points |
| Bachelor’s degree or more | 24.6% | 28.7% | +4.0 points |
| Households that rent | 34.7% | 34.5% | −0.1 points |
| Median gross rent | $1,040 | $1,107 | +6.4% |
| Median home value | $173,719 | $234,000 | +34.7% |
1205 census tracts
Oklahoma, tract by tract
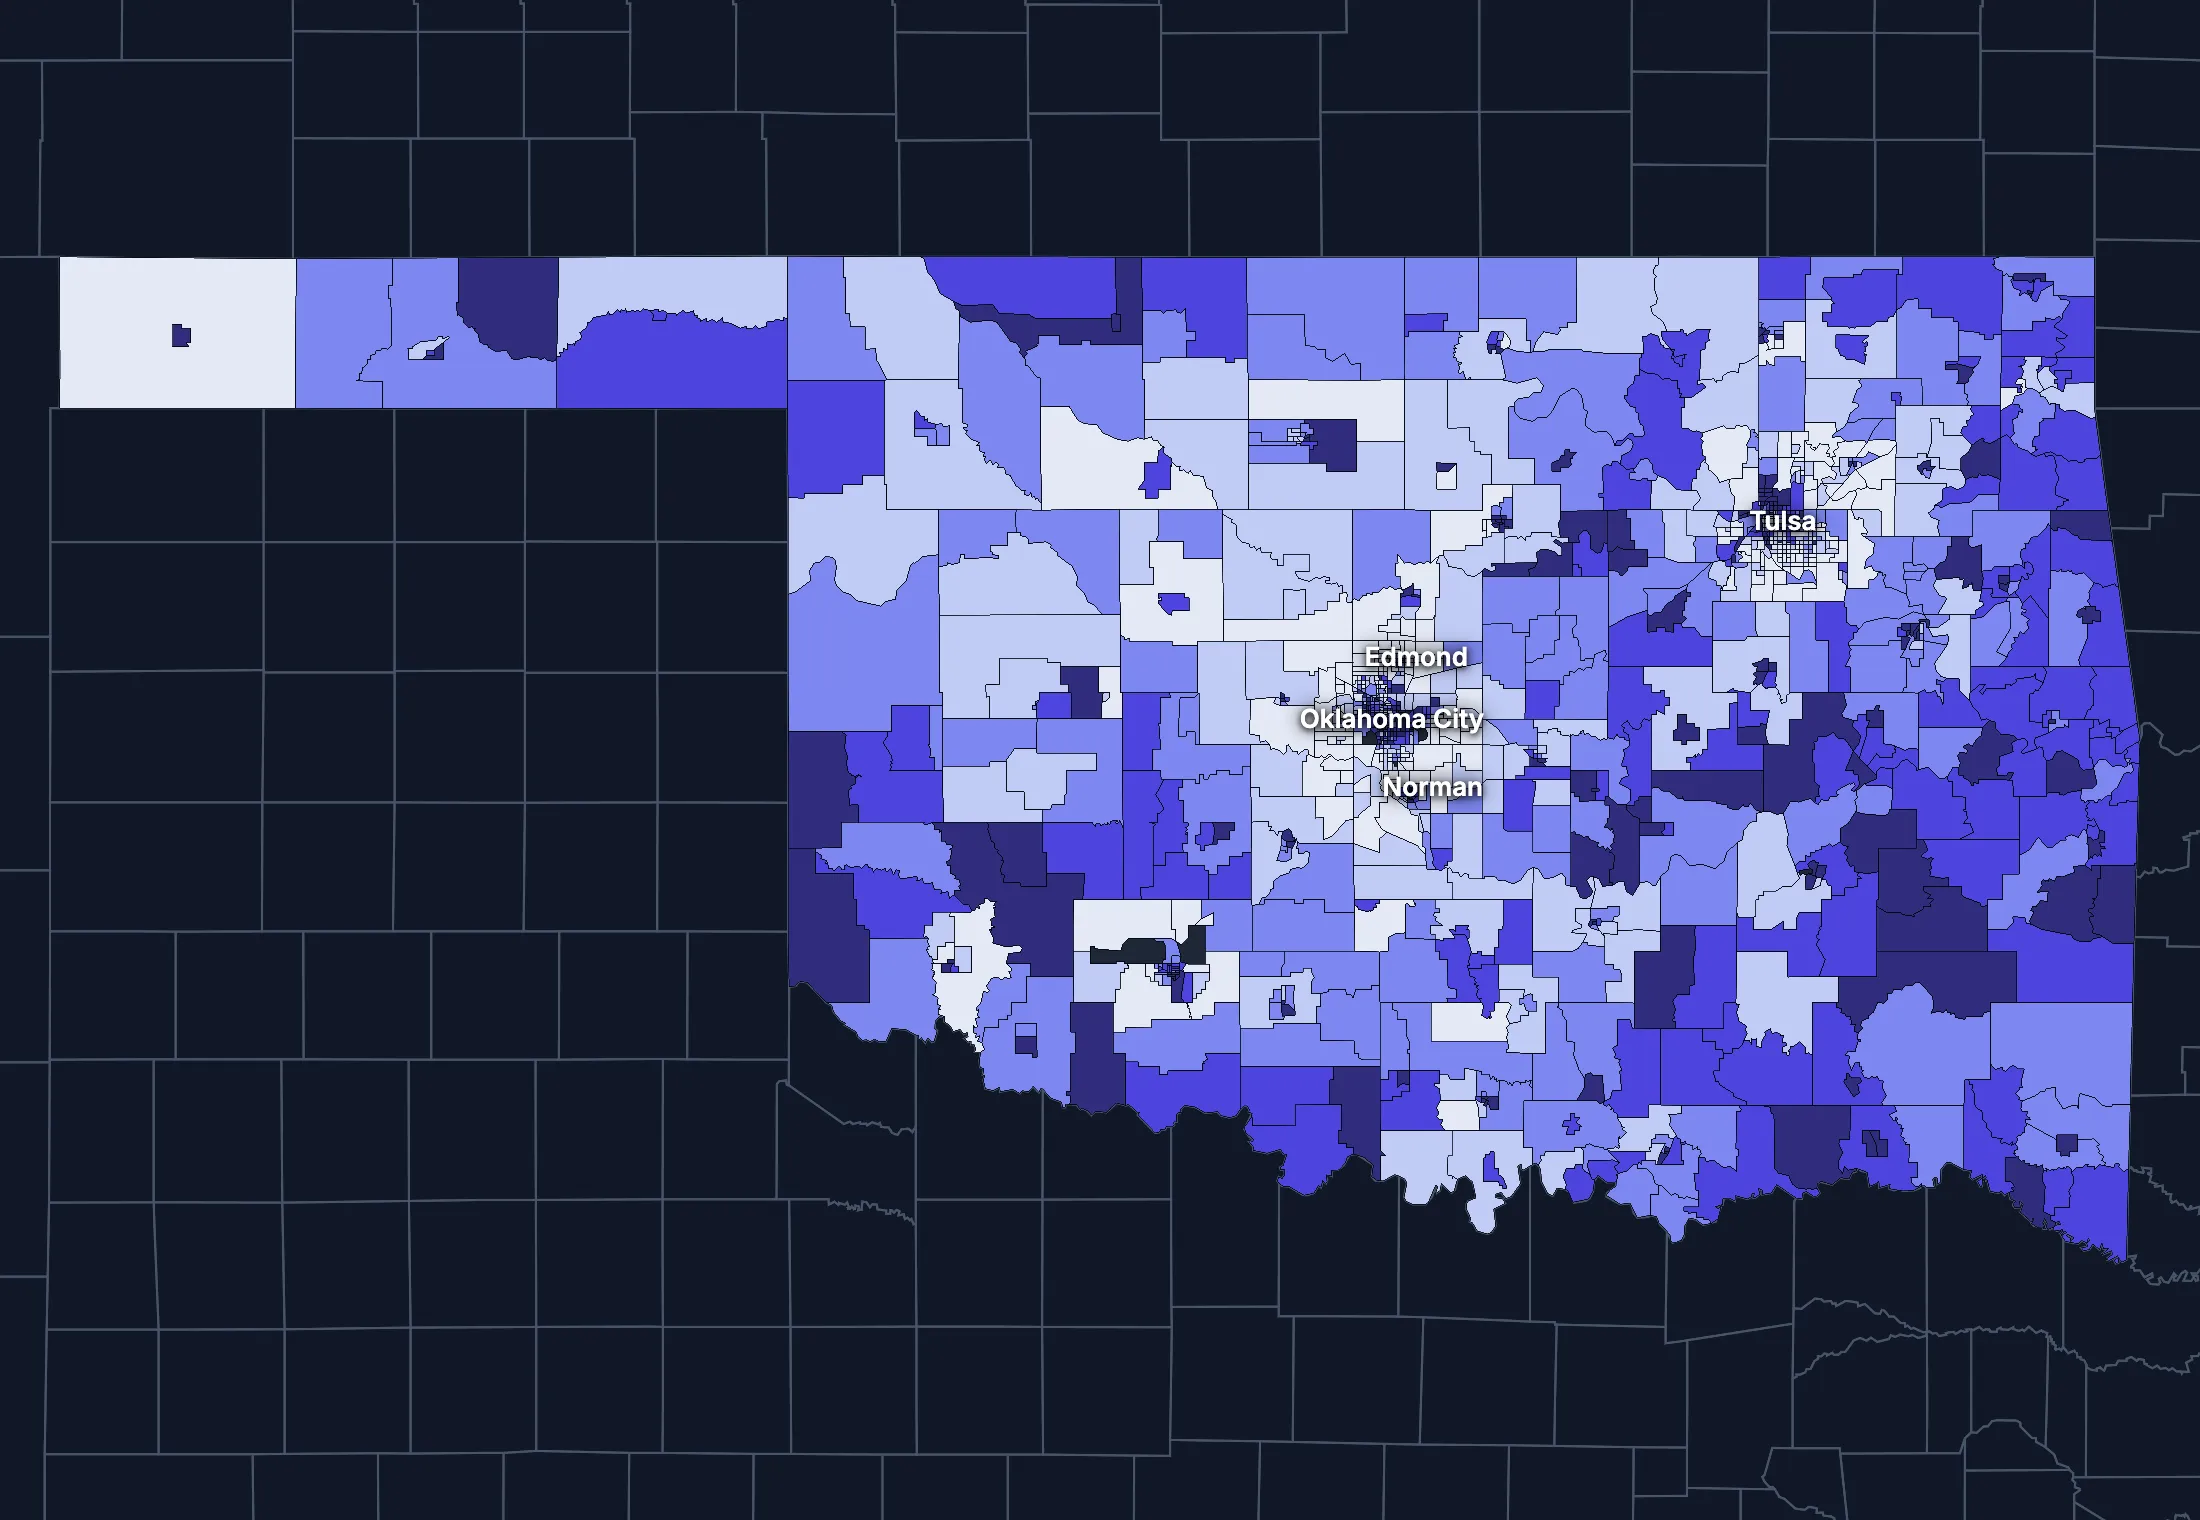
State averages hide a lot. These census tracts are the closest the census comes to neighborhoods.
Where the state’s average misleads
Each tick is one census tract, and the dark line marks the state. Hover over a tick or tap it to see the tract.
Poverty
257 of 1193 tracts are at least 1.5 times the state’s overall 15.3%, and 355 are at two-thirds of it or less.
Highest: Tract 2007, 70.9%. Lowest: Tract 3008.04, 0.0%.
Renters paying 30% or more of income
58 of 1158 tracts are at least 1.5 times the state’s overall 41.7%, and 284 are at two-thirds of it or less.
Highest: Tract 110.02, 92.0%. Lowest: Tract 9517, 0.0%.
Adults with a bachelor’s degree
204 of 1196 tracts are at least 1.5 times the state’s overall 28.3%, and 430 are at two-thirds of it or less.
Highest: Tract 1096, 82.9%. Lowest: Tract 9509.01, 0.1%.
Median household income
189 of 1188 tracts are at least 1.5 times the typical tract’s $61,642, and 126 are at two-thirds of it or less.
Highest: Tract 1064.01, $250,000 or more. Lowest: Tract 2007, $11,406.
American Community Survey 2020–2024 5-year estimates, by census tract. Income is capped at $250,000+ by the Census Bureau.
People
Who lives in Oklahoma
Its median age of 37.8 is lower than the US (39.5). 6.4% of residents were born outside the US, and 11.6% speak a language other than English at home.
Age
Source: ACS 2025 1-year, table A01001.
Show data
| Oklahoma | United States | |
|---|---|---|
| Under 18 | 23.1% ±0.2% , number 954,217 ±9,887 | 21.0% ±<0.1% , number 71,689,151 ±111,800 |
| 18 to 24 | 10.2% ±0.2% , number 418,950 ±8,694 | 9.3% ±<0.1% , number 31,716,680 ±98,660 |
| 25 to 34 | 12.9% ±0.1% , number 531,460 ±4,408 | 13.6% ±<0.1% , number 46,357,354 ±55,690 |
| 35 to 44 | 13.3% ±0.2% , number 547,357 ±8,822 | 13.4% ±<0.1% , number 45,746,189 ±105,700 |
| 45 to 54 | 11.4% ±0.1% , number 468,459 ±4,748 | 11.8% ±<0.1% , number 40,257,563 ±53,540 |
| 55 to 64 | 11.2% ±0.2% , number 461,957 ±7,611 | 12.1% ±<0.1% , number 41,242,904 ±104,700 |
| 65 to 74 | 10.4% ±0.2% , number 430,528 ±7,482 | 10.8% ±<0.1% , number 36,895,650 ±91,520 |
| 75 and over | 7.5% ±0.2% , number 310,360 ±6,274 | 8.2% ±<0.1% , number 27,879,368 ±78,140 |
Embed
Race and ethnicity
Source: ACS 2025 1-year, table A04001.
Show data
| Oklahoma | United States | |
|---|---|---|
| White, not Hispanic | 57.9% ±0.1% , number 2,387,662 ±4,298 | 55.0% ±<0.1% , number 187,959,031 ±58,340 |
| Hispanic or Latino | 14.0% , number 576,885 | 20.5% ±<0.1% , number 69,975,516 ±13,270 |
| Black, not Hispanic | 6.4% ±0.2% , number 263,846 ±8,583 | 11.7% ±<0.1% , number 40,096,453 ±106,200 |
| Asian, not Hispanic | 2.5% ±0.1% , number 102,932 ±3,705 | 6.5% ±<0.1% , number 22,096,709 ±58,340 |
| Other or multiracial | 19.2% ±0.4% , number 791,963 ±14,910 | 6.3% ±<0.1% , number 21,657,150 ±150,100 |
Embed
Language spoken at home
Source: ACS 2025 1-year, table C16001.
Show data
| Oklahoma | United States | |
|---|---|---|
| English only | 88.4% ±0.4% , number 3,430,603 ±14,410 | 77.1% ±0.1% , number 249,390,588 ±275,300 |
| Spanish | 8.1% ±0.3% , number 314,048 ±12,980 | 13.9% ±0.1% , number 44,921,985 ±177,800 |
| Other Indo-European | 1.2% ±0.1% , number 45,268 ±4,283 | 4.0% ±<0.1% , number 12,862,980 ±113,500 |
| Asian and Pacific Island | 1.8% ±0.2% , number 69,233 ±6,566 | 3.8% ±<0.1% , number 12,288,841 ±99,740 |
| Arabic and other | 0.6% ±0.1% , number 21,775 ±3,049 | 1.3% ±<0.1% , number 4,116,949 ±71,480 |
Embed
Marital status
Source: ACS 2025 1-year, table A11001.
Show data
| Oklahoma | United States | |
|---|---|---|
| Now married | 48.0% ±0.4% , number 1,603,571 ±14,240 | 47.9% ±0.1% , number 135,567,564 ±223,300 |
| Never married | 31.8% ±0.4% , number 1,061,565 ±11,900 | 34.8% ±0.1% , number 98,647,238 ±152,600 |
| Divorced | 12.1% ±0.3% , number 404,455 ±8,874 | 10.2% ±<0.1% , number 28,879,967 ±112,900 |
| Widowed | 6.4% ±0.2% , number 213,331 ±5,818 | 5.5% ±<0.1% , number 15,599,094 ±69,430 |
| Separated | 1.8% ±0.1% , number 58,543 ±3,753 | 1.6% ±<0.1% , number 4,441,399 ±49,160 |
Embed
Where people lived a year ago
Source: ACS 2025 1-year, table A08001.
Show data
| Oklahoma | United States | |
|---|---|---|
| Same home | 87.0% ±0.4% , number 3,548,100 ±15,680 | 88.4% ±0.1% , number 298,889,697 ±214,800 |
| Same county | 6.5% ±0.3% , number 266,457 ±13,310 | 6.0% ±<0.1% , number 20,202,671 ±166,300 |
| Another county in the state | 3.9% ±0.2% , number 157,897 ±8,926 | 3.0% ±<0.1% , number 10,168,097 ±89,190 |
| Another state | 2.3% ±0.2% , number 93,326 ±6,877 | 2.1% ±<0.1% , number 7,025,589 ±81,660 |
| Another country | 0.3% ±0.1% , number 11,490 ±2,458 | 0.6% ±<0.1% , number 1,984,943 ±47,210 |
Embed
Top countries of birth, among those born abroad
Source: ACS 2020–2024 5-year, table A07001.
Show data
| Oklahoma | |
|---|---|
| Mexico | 41.3% , number 105,859 |
| Vietnam | 5.2% , number 13,317 |
| Guatemala | 4.6% , number 11,826 |
| India | 3.6% , number 9,217 |
| China, Excluding Hong Kong and Taiwan | 3.1% , number 7,884 |
| Philippines | 2.6% , number 6,650 |
Embed
All the numbers
| Indicator | Oklahoma | US | Rank among states* | Table |
|---|---|---|---|---|
| Population | 4,123,288 | 341,784,859 | 28th | A00001 |
| People per square mile | 60 | 97 | 35th | A00002 |
| Land area (square miles) | 68,597 | – | – | A00002 |
| Median age | 37.8 ±0.2 | 39.5 ±0.1 | 46th | A01004 |
| Under 18 | 23.1% ±0.2% , number 954,217 ±9,887 | 21.0% ±<0.1% , number 71,689,151 ±111,800 | 7th | B02002 |
| 65 and over | 18.0% ±0.2% , number 740,888 ±9,764 | 19.0% ±<0.1% , number 64,775,018 ±120,300 | 44th | B02002 |
| Born outside the US | 6.4% ±0.2% , number 265,070 ±8,266 | 14.7% ±0.1% , number 50,409,320 ±204,800 | 30th | A06001 |
| Speak a language other than English at home | 11.6% ±0.4% , number 450,324 ±15,460 | 22.9% ±0.1% , number 74,190,755 ±244,000 | 29th | C16001 |
| Veterans (adults) | 7.6% ±0.2% , number 237,887 ±6,476 | 5.9% ±<0.1% , number 15,746,228 ±85,320 | 10th | A16002 |
| Living with a disability | 17.7% ±0.3% , number 713,055 ±12,030 | 13.7% ±<0.1% , number 46,271,455 ±126,000 | 5th | B18101 |
| Women 15–50 who had a baby in the past year | 5.3% ±0.4% , number 51,259 ±3,970 | 5.0% ±0.1% , number 4,016,759 ±44,040 | 12th | B13002 |
| Lived in the same home a year ago | 87.0% ±0.4% , number 3,548,100 ±15,680 | 88.4% ±0.1% , number 298,889,697 ±214,800 | 44th | A08001 |
| White, not Hispanic | 57.9% ±0.1% , number 2,387,662 ±4,298 | 55.0% ±<0.1% , number 187,959,031 ±58,340 | 30th | A04001 |
| Hispanic or Latino | 14.0% , number 576,885 | 20.5% ±<0.1% , number 69,975,516 ±13,270 | 20th | A04001 |
| Black, not Hispanic | 6.4% ±0.2% , number 263,846 ±8,583 | 11.7% ±<0.1% , number 40,096,453 ±106,200 | 27th | A04001 |
| Asian, not Hispanic | 2.5% ±0.1% , number 102,932 ±3,705 | 6.5% ±<0.1% , number 22,096,709 ±58,340 | 34th | A04001 |
*1 is the highest. Population is ranked among all states, and the rest among those of 1,000 people or more, whose figures can be ranked. Ranks use 5-year estimates, the only ones covering every state, so they can differ slightly from the figures here.
Income and work
Lower incomes than the US
The median household income is $68,441, lower than the US ($84,780). 14.4% of people live in poverty, and 12.6% have no health insurance, higher than the US (8.4%).
Household income
Source: ACS 2025 1-year, table A14001.
Show data
| Oklahoma | United States | |
|---|---|---|
| Under $25,000 | 17.0% ±0.5% , number 274,489 ±8,508 | 14.0% ±0.1% , number 18,727,548 ±88,990 |
| $25,000 to $49,999 | 19.6% ±0.6% , number 316,891 ±9,013 | 15.4% ±0.1% , number 20,665,585 ±101,400 |
| $50,000 to $74,999 | 17.4% ±0.5% , number 281,884 ±8,651 | 15.3% ±0.1% , number 20,513,565 ±88,500 |
| $75,000 to $99,999 | 12.8% ±0.4% , number 207,655 ±7,229 | 12.5% ±0.1% , number 16,814,245 ±87,520 |
| $100,000 to $149,999 | 16.9% ±0.5% , number 272,428 ±8,146 | 17.9% ±0.1% , number 24,018,984 ±99,670 |
| $150,000 to $199,999 | 7.9% ±0.3% , number 128,056 ±5,511 | 10.1% ±0.1% , number 13,521,827 ±70,660 |
| $200,000 or more | 8.3% ±0.3% , number 134,774 ±5,094 | 14.8% ±0.1% , number 19,801,668 ±84,120 |
Embed
What residents do for work
Source: ACS 2025 1-year, table A17004.
Show data
| Oklahoma | United States | |
|---|---|---|
| Education and health care | 23.9% ±0.5% , number 452,809 ±10,100 | 24.4% ±0.1% , number 40,862,193 ±140,800 |
| Retail trade | 11.8% ±0.4% , number 224,115 ±7,554 | 10.6% ±0.1% , number 17,781,181 ±96,660 |
| Manufacturing | 9.8% ±0.4% , number 185,759 ±6,992 | 9.6% ±0.1% , number 16,064,394 ±91,270 |
| Professional and business services | 9.5% ±0.4% , number 180,288 ±7,286 | 12.8% ±0.1% , number 21,375,231 ±87,110 |
| Arts, food and lodging | 9.0% ±0.4% , number 171,484 ±7,595 | 8.9% ±0.1% , number 14,811,502 ±87,840 |
| Construction | 6.8% ±0.3% , number 128,526 ±6,083 | 6.7% ±<0.1% , number 11,254,981 ±79,620 |
| Transportation and warehousing | 6.1% ±0.3% , number 115,060 ±5,287 | 5.9% ±<0.1% , number 9,832,211 ±73,020 |
| Public administration | 6.0% ±0.2% , number 114,618 ±4,086 | 4.7% ±<0.1% , number 7,944,601 ±69,540 |
Embed
Where workers come from and go
Oklahoma has 1,640,586 jobs and 1,664,485 employed residents. 52,317 people commute in to work and 76,216 commute out, while 1,588,269 both live and work here. The most commuters come from Texas.
Most commuters come from
- Texas: 23,818
- Arkansas: 7,971
- Kansas: 7,222
Most residents commute to
- Texas: 28,288
- Arkansas: 22,076
- Kansas: 11,023
Show data
| Oklahoma | |
|---|---|
| Live and work here | 1,588,269 |
| Work here, live elsewhere | 52,317 |
| Live here, work elsewhere | 76,216 |
Embed
All the numbers
| Indicator | Oklahoma | US | Rank among states* | Table |
|---|---|---|---|---|
| Median household income | $68,441 ±$911 | $84,780 ±$215 | 44th | A14006 |
| Income per person | $37,314 ±$462 | $47,171 ±$115 | 47th | A14024 |
| Income inequality (Gini index) | 0.469 ±0.005 | 0.482 ±0.001 | 26th | A14028 |
| Living in poverty | 14.4% ±0.5% , number 577,984 ±19,190 | 11.8% ±0.1% , number 39,264,183 ±277,400 | 9th | A13004 |
| Unemployment rate | 4.3% ±0.2% , number 86,218 ±4,119 | 4.9% ±<0.1% , number 8,574,594 ±64,350 | 23rd | A17005 |
| No health insurance | 12.6% ±0.3% , number 507,646 ±13,330 | 8.4% ±<0.1% , number 28,323,306 ±152,000 | 2nd | A20001 |
*1 is the highest. Population is ranked among all states, and the rest among those of 1,000 people or more, whose figures can be ranked. Ranks use 5-year estimates, the only ones covering every state, so they can differ slightly from the figures here.
Education
Fewer college degrees than the US
28.7% of adults 25 and over have a bachelor’s degree or more, lower than the US (37.4%).
Highest level of education
Source: ACS 2025 1-year, table A12001.
Show data
| Oklahoma | United States | |
|---|---|---|
| Less than high school | 9.5% ±0.3% , number 261,147 ±8,474 | 9.4% ±0.1% , number 22,321,002 ±120,500 |
| High school only | 31.0% ±0.5% , number 852,667 ±12,730 | 25.6% ±0.1% , number 61,096,726 ±203,400 |
| Some college | 30.8% ±0.5% , number 848,083 ±14,130 | 27.7% ±0.1% , number 65,920,977 ±173,500 |
| Bachelor’s degree | 18.2% ±0.4% , number 499,580 ±9,976 | 22.3% ±0.1% , number 53,224,312 ±196,700 |
| Graduate degree | 10.5% ±0.3% , number 288,644 ±8,255 | 15.0% ±0.1% , number 35,816,011 ±159,400 |
Embed
All the numbers
| Indicator | Oklahoma | US | Rank among states* | Table |
|---|---|---|---|---|
| Bachelor’s degree or more | 28.7% ±0.5% , number 788,224 ±12,950 | 37.4% ±0.1% , number 89,040,323 ±253,200 | 45th | A12001 |
| High school graduate or more | 90.5% ±0.8% , number 2,488,974 ±23,010 | 90.6% ±0.2% , number 216,058,026 ±368,200 | 38th | A12001 |
*1 is the highest. Population is ranked among all states, and the rest among those of 1,000 people or more, whose figures can be ranked. Ranks use 5-year estimates, the only ones covering every state, so they can differ slightly from the figures here.
Housing
Home values outran incomes
34.5% of households rent, about the same as the US (34.7%). The median home is worth $234,000 and the median rent is $1,107. After inflation, home values rose 35% from 2015 to 2025, while household income rose 3%.
Housing costs and income, 2015 to 2025, after inflation
Source: ACS 1-year, table A10036, A18009, A14006.
Show data
| Oklahoma | United States | |
|---|---|---|
| Median home value | +34.7% | +39.3% |
| Median rent | +6.4% | +18.5% |
| Median household income | +2.9% | +10.9% |
Embed
Types of homes
Source: ACS 2025 1-year, table A10032.
Show data
| Oklahoma | United States | |
|---|---|---|
| Single-family, detached | 72.5% ±0.4% , number 1,317,242 ±7,953 | 60.9% ±0.1% , number 90,335,844 ±173,300 |
| Single-family, attached | 2.6% ±0.2% , number 47,642 ±3,729 | 6.4% ±<0.1% , number 9,527,703 ±51,230 |
| 2 to 4 units | 4.8% ±0.3% , number 87,560 ±4,970 | 7.5% ±0.1% , number 11,109,005 ±75,790 |
| 5 to 19 units | 7.3% ±0.4% , number 133,221 ±6,813 | 8.7% ±0.1% , number 12,829,882 ±97,590 |
| 20 or more units | 4.6% ±0.3% , number 84,157 ±5,983 | 11.1% ±0.1% , number 16,381,450 ±92,310 |
| Mobile homes and other | 8.1% ±0.2% , number 146,416 ±4,155 | 5.4% ±<0.1% , number 8,045,083 ±53,680 |
Embed
When homes were built
Source: ACS 2025 1-year, table A10055.
Show data
| Oklahoma | United States | |
|---|---|---|
| 2010 or later | 17.0% ±0.5% , number 275,209 ±8,412 | 15.1% ±0.1% , number 20,257,912 ±101,300 |
| 2000 to 2009 | 13.2% ±0.4% , number 214,104 ±6,240 | 13.8% ±0.1% , number 18,535,840 ±92,260 |
| 1980 to 1999 | 23.6% ±0.5% , number 380,889 ±8,938 | 24.1% ±0.1% , number 32,332,570 ±118,900 |
| 1960 to 1979 | 27.2% ±0.6% , number 439,211 ±10,330 | 22.9% ±0.1% , number 30,726,302 ±110,000 |
| Before 1960 | 19.0% ±0.5% , number 306,764 ±8,383 | 24.0% ±0.1% , number 32,210,798 ±121,500 |
Embed
All the numbers
| Indicator | Oklahoma | US | Rank among states* | Table |
|---|---|---|---|---|
| Housing units | 1,816,238 | – | – | A10001 |
| Households | 1,616,177 ±6,690 | – | – | A10008 |
| People per household | 2.48 ±0.01 | 2.49 ±0.01 | 14th | A10003 |
| Households that rent | 34.5% ±0.6% , number 558,244 ±10,110 | 34.7% ±0.1% , number 46,551,688 ±193,200 | 14th | A10060 |
| Vacant homes | 11.0% ±0.4% , number 200,061 ±6,779 | 9.6% ±0.1% , number 14,165,545 ±137,100 | 19th | A10047, A10060 |
| Median gross rent | $1,107 ±$11 | $1,557 ±$4 | 42nd | A18009 |
| Median home value | $234,000 ±$2,384 | $371,100 ±$646 | 48th | A10036 |
| Renters paying 30% or more of income | 41.3% ±1.3% , number 230,328 ±8,298 | 48.3% ±0.2% , number 22,486,693 ±122,100 | 40th | A18002 |
| Owners paying 30% or more of income | 20.1% ±0.6% , number 213,067 ±7,057 | 24.2% ±0.1% , number 21,201,943 ±93,050 | 40th | A10040 |
| Homes built before 1960 | 19.0% ±0.5% , number 306,764 ±8,383 | 24.0% ±0.1% , number 32,210,798 ±121,500 | 32nd | A10055 |
*1 is the highest. Population is ranked among all states, and the rest among those of 1,000 people or more, whose figures can be ranked. Ranks use 5-year estimates, the only ones covering every state, so they can differ slightly from the figures here.
Getting around
A driving state with short commutes
77.7% of workers drive alone and 8.7% work from home. 29.3% of those who travel to work spend 30 minutes or more getting there, and 5.9% of households have no vehicle.
How people get to work
Source: ACS 2025 1-year, table A09005.
Show data
| Oklahoma | United States | |
|---|---|---|
| Drive alone | 77.7% ±0.6% , number 1,470,944 ±14,920 | 69.8% ±0.1% , number 115,297,377 ±192,900 |
| Carpool | 10.3% ±0.4% , number 195,317 ±8,097 | 8.9% ±0.1% , number 14,712,170 ±97,240 |
| Public transit | 0.5% ±0.1% , number 8,864 ±1,617 | 4.3% ±<0.1% , number 7,100,386 ±63,330 |
| Walk | 1.7% ±0.1% , number 32,195 ±2,793 | 2.4% ±<0.1% , number 4,016,469 ±41,070 |
| Work from home | 8.7% ±0.3% , number 164,214 ±6,358 | 12.9% ±0.1% , number 21,288,393 ±105,700 |
| Other | 1.1% ±0.1% , number 20,721 ±2,455 | 1.7% ±<0.1% , number 2,799,658 ±41,510 |
Embed
Time spent getting to work
Source: ACS 2025 1-year, table B09001.
Show data
| Oklahoma | United States | |
|---|---|---|
| Under 10 minutes | 16.7% ±0.5% , number 288,552 ±8,745 | 12.0% ±0.1% , number 17,199,225 ±93,440 |
| 10 to 19 minutes | 32.4% ±0.7% , number 559,345 ±13,080 | 27.8% ±0.1% , number 40,059,540 ±137,700 |
| 20 to 29 minutes | 21.6% ±0.6% , number 373,284 ±10,120 | 21.0% ±0.1% , number 30,221,743 ±111,100 |
| 30 to 39 minutes | 15.7% ±0.5% , number 270,484 ±8,394 | 17.1% ±0.1% , number 24,659,138 ±103,800 |
| 40 to 59 minutes | 8.2% ±0.4% , number 142,181 ±6,339 | 12.6% ±0.1% , number 18,104,709 ±97,070 |
| 60 minutes or more | 5.5% ±0.3% , number 94,195 ±5,073 | 9.5% ±0.1% , number 13,681,705 ±84,440 |
Embed
Vehicles per household
Source: ACS 2025 1-year, table A10030.
Show data
| Oklahoma | United States | |
|---|---|---|
| None | 5.9% ±0.3% , number 94,997 ±4,897 | 8.8% ±0.1% , number 11,781,997 ±77,240 |
| One | 32.1% ±0.6% , number 518,217 ±10,230 | 33.1% ±0.1% , number 44,424,682 ±160,700 |
| Two | 36.8% ±0.6% , number 595,453 ±10,320 | 36.0% ±0.1% , number 48,200,889 ±176,800 |
| Three or more | 25.2% ±0.5% , number 407,510 ±8,503 | 22.1% ±0.1% , number 29,655,854 ±113,300 |
Embed
All the numbers
| Indicator | Oklahoma | US | Rank among states* | Table |
|---|---|---|---|---|
| Drive to work alone | 77.7% ±0.6% , number 1,470,944 ±14,920 | 69.8% ±0.1% , number 115,297,377 ±192,900 | 7th | A09005 |
| Take public transit | 0.5% ±0.1% , number 8,864 ±1,617 | 4.3% ±<0.1% , number 7,100,386 ±63,330 | 48th | A09005 |
| Work from home | 8.7% ±0.3% , number 164,214 ±6,358 | 12.9% ±0.1% , number 21,288,393 ±105,700 | 45th | A09005 |
| Commute 30 minutes or more | 29.3% ±0.6% , number 506,860 ±11,680 | 39.2% ±0.1% , number 56,445,552 ±165,300 | 40th | B09001 |
| Households with no vehicle | 5.9% ±0.3% , number 94,997 ±4,641 | 8.8% ±<0.1% , number 11,781,997 ±64,240 | 36th | A10030 |
*1 is the highest. Population is ranked among all states, and the rest among those of 1,000 people or more, whose figures can be ranked. Ranks use 5-year estimates, the only ones covering every state, so they can differ slightly from the figures here.
Places
The largest cities in Oklahoma
Population, from the latest estimates available. Figures cover the whole of each place.
Largest cities
- Oklahoma City: 719,911
- Tulsa: 415,843
- Norman: 130,923
- Broken Arrow: 124,995
- Edmond: 100,463
- Lawton: 90,503
- Moore: 63,420
- Midwest City: 58,297
Every county and place in Oklahoma
Find any county, city, town, metro area, ZIP code, school district or district in Oklahoma.
Counties
Each of the 77 counties with its population, from ACS 2020–2024 5-year estimates.
- Adair County19,575
- Alfalfa County5,696
- Atoka County14,379
- Beaver County5,028
- Beckham County22,148
- Blaine County8,570
- Bryan County48,253
- Caddo County26,447
- Canadian County168,985
- Carter County48,555
- Cherokee County47,942
- Choctaw County14,297
- Cimarron County2,218
- Cleveland County300,047
- Coal County5,320
- Comanche County121,825
- Cotton County5,485
- Craig County14,302
- Creek County72,830
- Custer County28,259
- Delaware County41,279
- Dewey County4,360
- Ellis County3,683
- Garfield County62,146
- Garvin County25,860
- Grady County56,606
- Grant County4,131
- Greer County5,489
- Harmon County2,406
- Harper County3,203
- Haskell County11,683
- Hughes County13,389
- Jackson County24,678
- Jefferson County5,380
- Johnston County10,278
- Kay County43,625
- Kingfisher County15,430
- Kiowa County8,383
- Latimer County9,518
- Le Flore County49,053
- Lincoln County34,219
- Logan County51,938
- Love County10,261
- Major County7,628
- Marshall County15,792
- Mayes County39,604
- McClain County45,273
- McCurtain County30,863
- McIntosh County19,400
- Murray County13,753
- Muskogee County66,444
- Noble County10,897
- Nowata County9,435
- Okfuskee County11,278
- Oklahoma County806,199
- Okmulgee County36,899
- Osage County45,997
- Ottawa County30,341
- Pawnee County15,795
- Payne County82,972
- Pittsburg County43,561
- Pontotoc County38,235
- Pottawatomie County73,463
- Pushmataha County10,790
- Roger Mills County3,359
- Rogers County98,610
- Seminole County23,494
- Sequoyah County39,860
- Stephens County43,551
- Texas County20,774
- Tillman County6,910
- Tulsa County680,794
- Wagoner County86,609
- Washington County53,326
- Washita County10,815
- Woods County8,596
- Woodward County20,158
Cities, towns and other places
Each of the 834 with its population, from ACS 2020–2024 5-year estimates. Census-designated places are communities without a local government of their own, drawn by the Census Bureau so they can be counted.
- Achille394
- Ada16,575
- Adair650
- Adams103
- Adamson44
- Addington91
- Afton762
- Agra335
- Akins450
- Albany169
- Albion54
- Alderson259
- Alex529
- Aline204
- Allen883
- Altus18,646
- Alva4,982
- Amber445
- Ames220
- Amorita7
- Anadarko5,572
- Antlers2,346
- Apache1,034
- Arapaho715
- Arcadia176
- Ardmore24,877
- Arkoma1,976
- Armstrong101
- Arnett525
- Arpelar312
- Asher438
- Ashland41
- Atoka2,894
- Atwood84
- Avant209
- Avard18
- Bache72
- Badger Lee28
- Baker3
- Ballou161
- Barber280
- Barnsdall919
- Baron413
- Bartlesville37,878
- Bearden136
- Beaver1,586
- Bee160
- Beggs1,024
- Belfonte208
- Bell384
- Bennington329
- Bentley18
- Bernice396
- Bessie262
- Bethany20,560
- Bethel Acres3,165
- Big Cabin195
- Billings666
- Binger496
- Bison48
- Bixby30,155
- Blackburn76
- Blackwell6,042
- Blair585
- Blanchard9,215
- Blanco76
- Blue58
- Bluejacket237
- Boise City1,125
- Bokchito536
- Bokoshe388
- Boley1,209
- Boswell690
- Bowlegs331
- Bowring103
- Box52
- Boynton114
- Bradley126
- Braggs222
- Braman179
- Bray979
- Breckenridge239
- Brent583
- Briartown132
- Bridge Creek356
- Bridgeport105
- Briggs1,131
- Bristow4,272
- Broken Arrow118,180
- Broken Bow4,226
- Bromide133
- Brooksville58
- Brush Creek101
- Brushy777
- Bryant6
- Buffalo1,092
- Bug Tussle265
- Bull Hollow118
- Bunch38
- Burbank104
- Burlington138
- Burneyville935
- Burns Flat1,857
- Bushyhead1,289
- Butler CDP159
- Butler town250
- Byars209
- Byng1,316
- Byron19
- Cache3,074
- Caddo1,109
- Calera3,007
- Calumet493
- Calvin353
- Camargo134
- Cameron292
- Canadian225
- Canadian Shores194
- Caney CDP467
- Caney Ridge88
- Caney town139
- Canton522
- Canute544
- Carlisle435
- Carlton Landing78
- Carmen336
- Carnegie1,521
- Carney562
- Carrier65
- Carter210
- Cartwright744
- Cashion1,148
- Castle165
- Catoosa7,496
- Cave Spring60
- Cayuga197
- Cedar Crest204
- Cedar Lake421
- Cedar Valley450
- Cement407
- Centrahoma69
- Central High1,489
- Chance315
- Chandler2,899
- Chattanooga406
- Checotah3,064
- Chelsea1,880
- Cherokee1,509
- Cherry Tree585
- Chester89
- Chewey642
- Cheyenne834
- Chickasha16,539
- Choctaw12,303
- Chouteau2,129
- Christie252
- Cimarron City150
- Claremore20,166
- Clarita184
- Clayton568
- Clearview40
- Cleo Springs336
- Cleora1,477
- Cleveland3,225
- Clinton8,388
- Cloud Creek266
- Coalgate1,894
- Colbert1,277
- Colcord910
- Cole848
- Coleman287
- Collinsville8,878
- Colony104
- Comanche1,545
- Commerce2,212
- Connerville10
- Cookson921
- Cooperton7
- Copan772
- Copeland1,401
- Corn601
- Cornish98
- Cottonwood126
- Council Hill91
- Covington297
- Coweta10,433
- Cowlington132
- Coyle522
- Crescent1,527
- Crescent Springs204
- Cromwell238
- Crowder307
- Cumberland533
- Cushing8,367
- Custer City566
- Cyril841
- Dacoma90
- Dale293
- Davenport674
- Davidson169
- Davis2,814
- Deer Creek22
- Deer Lick85
- Del City21,494
- Delaware301
- Dennis396
- Depew391
- Devol146
- Dewar764
- Dewey3,412
- Dibble1,045
- Dickson1,231
- Dill City333
- Disney182
- Dixon150
- Dodge9
- Dotyville248
- Dougherty249
- Douglas48
- Dover316
- Dripping Springs54
- Drowning Creek70
- Drummond397
- Drumright2,361
- Dry Creek249
- Duchess Landing214
- Duncan22,958
- Durant19,746
- Durham18
- Dustin360
- Dwight Mission111
- Eagle City12
- Eagletown440
- Eakly476
- Earl60
- Earlsboro571
- East Duke313
- Edgewater Park135
- Edmond96,825
- El Reno18,557
- Eldon326
- Eldorado449
- Elgin3,608
- Elk City11,361
- Elm Grove100
- Elmer59
- Elmore City882
- Elohim City18
- Emet64
- Empire City794
- Enid50,653
- Enterprise124
- Erick799
- Erin Springs31
- Etowah138
- Etta87
- Eufaula2,825
- Evening Shade489
- Fair Oaks88
- Fairfax1,076
- Fairfield690
- Fairland1,207
- Fairmont158
- Fairview2,687
- Fallis4
- Fanshawe357
- Fargo307
- Faxon86
- Fay51
- Felt117
- Finley74
- Fittstown28
- Fitzhugh197
- Fletcher1,309
- Flint Creek627
- Flute Springs76
- Foraker20
- Forest Park949
- Forgan359
- Fort Cobb469
- Fort Coffee292
- Fort Gibson3,808
- Fort Supply274
- Fort Towson546
- Foss170
- Foster254
- Fox63
- Foyil488
- Francis310
- Frederick3,445
- Freedom132
- Friendship17
- Gage397
- Gans304
- Garber708
- Garvin147
- Gate63
- Geary841
- Gene Autry224
- Geronimo1,155
- Gerty83
- Gideon219
- Glencoe516
- Glenpool14,151
- Golden32
- Goldsby3,085
- Goltry271
- Goodwell1,122
- Gore1,114
- Gotebo262
- Gould62
- Gowen171
- Gracemont321
- Grainola36
- Grand Lake Towne271
- Grandfield940
- Grandview1,251
- Granite1,650
- Grant176
- Grayson121
- Greasy164
- Greenfield113
- Greenville155
- Gregory383
- Grove7,176
- Guthrie11,243
- Guymon12,539
- Haileyville614
- Hallett132
- Hammon457
- Hanna128
- Hanson152
- Hardesty404
- Harrah6,684
- Hartshorne1,642
- Haskell1,549
- Hastings124
- Haworth265
- Haywood147
- Headrick69
- Healdton2,495
- Heavener3,012
- Helena1,557
- Hendrix63
- Hennepin126
- Hennessey2,567
- Henryetta5,608
- Hickory120
- Hillsdale89
- Hinton4,909
- Hitchcock40
- Hitchita40
- Hobart3,358
- Hochatown298
- Hodgen52
- Hoffman82
- Holdenville5,902
- Hollis1,664
- Hollister6
- Homestead39
- Hominy3,303
- Honey Hill68
- Hooker1,786
- Hopeton9
- Horntown89
- Hough21
- Howe791
- Hoyt40
- Hugo5,182
- Hulbert444
- Hunter139
- Hydro1,157
- Idabel6,987
- Indiahoma297
- Indianola CDP17
- Indianola town156
- Ingalls229
- Inola2,011
- Iron Post58
- Isabella145
- IXL36
- Jay2,731
- Jefferson7
- Jenks27,102
- Jennings346
- Jet208
- Johnson684
- Johnson Prairie142
- Jones3,053
- Justice1,530
- Kansas748
- Katie429
- Kaw City283
- Keefton759
- Kellyville1,047
- Kemp179
- Kendrick108
- Kenefic170
- Kenwood1,284
- Keota390
- Ketchum499
- Keyes175
- Keys982
- Kiefer2,639
- Kildare64
- Kingfisher5,026
- Kingston1,742
- Kinta295
- Kiowa658
- Knowles4
- Konawa1,076
- Krebs2,119
- Kremlin267
- Lahoma485
- Lake Aluma105
- Lake Ellsworth Addition203
- Lakeside Village57
- Lamar160
- Lambert4
- Lamont308
- Lane348
- Langley616
- Langston1,692
- Latta1,405
- Laverne904
- Lawrence Creek134
- Lawton90,595
- Lawtonka Acres17
- Le Flore145
- Leach349
- Lebanon200
- Leedey406
- Lehigh223
- Lenapah276
- Leon66
- Leonard165
- Lequire129
- Lexington1,972
- Liberty CDP231
- Liberty town179
- Lima31
- Limestone810
- Lindsay2,884
- Little City122
- Little Ponderosa374
- Little Rock399
- Loco94
- Locust Grove1,453
- Lone Chimney51
- Lone Grove5,125
- Lone Wolf410
- Long450
- Longdale146
- Longtown2,716
- Lookeba111
- Lost City852
- Lotsee4
- Loveland11
- Lovell51
- Lowrey264
- Loyal95
- Lucien41
- Luther1,627
- Lyons Switch569
- Macomb22
- Madill4,004
- Mallard Bay290
- Manchester143
- Mangum2,755
- Manitou224
- Mannford3,269
- Mannsville913
- Maramec34
- Marble City165
- Marietta CDP53
- Marietta city2,865
- Marland358
- Marlow4,451
- Marshall256
- Martha134
- Maud973
- May29
- Maysville1,399
- Mazie81
- McAlester18,111
- McBride40
- McCord1,553
- McCurtain410
- McLoud4,425
- Mead326
- Medford1,016
- Medicine Park418
- Meeker1,172
- Mehan22
- Meno144
- Meridian18
- Miami12,926
- Middleberg218
- Midwest City58,297
- Milburn262
- Milfay58
- Mill Creek278
- Millerton206
- Minco1,607
- Moffett33
- Monroe123
- Moodys1,108
- Moore63,420
- Mooreland1,330
- Morris1,555
- Morrison789
- Mounds1,059
- Mountain Park265
- Mountain View543
- Moyers60
- Mulberry69
- Muldrow3,309
- Mulhall257
- Murphy176
- Muskogee36,758
- Mustang22,192
- Mutual24
- Narcissa167
- Nardin130
- Nash218
- Nashoba44
- Nelagoney43
- Nescatunga97
- New Alluwe42
- New Cordell2,740
- New Eucha185
- New Woodville83
- Newcastle13,001
- Newkirk2,043
- Nichols Hills3,843
- Nicoma Park2,566
- Nicut609
- Ninnekah966
- Noble7,493
- Norge143
- Norman129,672
- North Enid1,136
- North Miami268
- Norwood1,752
- Notchietown343
- Nowata3,542
- Oak Grove46
- Oak Hill-Piney109
- Oakhurst2,175
- Oakland1,142
- Oaks295
- Oakwood52
- Ochelata599
- Oilton921
- Okarche1,293
- Okay408
- Okeene1,212
- Okemah3,063
- Oklahoma City697,125
- Okmulgee11,348
- Oktaha306
- Old Eucha30
- Old Green301
- Olive78
- Olustee555
- Oologah1,774
- Optima72
- Orlando106
- Osage103
- Owasso40,151
- Paden391
- Panama1,415
- Panola101
- Paoli660
- Paradise Hill103
- Park Hill3,237
- Pauls Valley6,062
- Pawhuska2,930
- Pawnee1,886
- Peavine316
- Peckham42
- Peggs858
- Pensacola107
- Peoria107
- Perkins3,262
- Perry4,452
- Pettit816
- Phillips131
- Pickett897
- Piedmont8,342
- Pin Oak Acres330
- Piney84
- Pinhook Corner79
- Pink2,206
- Pittsburg137
- Pocasset181
- Pocola4,423
- Ponca City24,326
- Pond Creek855
- Pontotoc76
- Porter623
- Porum584
- Poteau8,959
- Prague2,155
- Preston165
- Proctor100
- Prue329
- Pryor Creek9,569
- Pump Back158
- Pumpkin Hollow148
- Purcell6,803
- Putnam51
- Quapaw728
- Quinlan262
- Quinton953
- Ralston328
- Ramona629
- Randlett252
- Ratliff City95
- Rattan274
- Ravia491
- Reagan46
- Red Oak539
- Red Rock218
- Redbird103
- Redbird Smith659
- Remy580
- Renfrow40
- Rentiesville105
- Reydon148
- Ringling807
- Ringwood525
- Ripley259
- River Bottom244
- Rock Island684
- Rocky239
- Rocky Ford290
- Rocky Mountain532
- Rocky Point821
- Roff719
- Roland3,687
- Roosevelt213
- Rose225
- Rosedale48
- Rosston58
- Rush Springs1,299
- Ryan795
- Salina1,148
- Sallisaw8,605
- Sams Corner94
- Sand Hill326
- Sand Point275
- Sand Springs20,117
- Sapulpa22,570
- Sasakwa58
- Savanna485
- Sawyer432
- Sayre4,796
- Schulter522
- Scipio54
- Seiling824
- Seminole7,194
- Sentinel939
- Sequoyah721
- Shady Grove (Cherokee County)453
- Shady Grove (McIntosh County)501
- Shady Point900
- Shamrock94
- Sharon112
- Shattuck1,212
- Shawnee31,671
- Shidler336
- Short299
- Silo580
- Simms463
- Skedee62
- Skiatook8,632
- Slaughterville4,251
- Slick142
- Smith Village40
- Smithville93
- Snake Creek273
- Snyder1,297
- Soper205
- Sour John80
- South Coffeyville684
- Sparks113
- Sparrowhawk183
- Spaulding125
- Spavinaw359
- Spencer3,928
- Sperry1,066
- Spiro2,269
- Sportmans Shores168
- Sportsmen Acres499
- Springer854
- St. Louis93
- Steely Hollow342
- Sterling751
- Stidham21
- Stigler2,729
- Stillwater49,269
- Stilwell3,755
- Stonewall445
- Stoney Point188
- Strang56
- Stratford1,331
- Stringtown409
- Strong City53
- Stroud2,793
- Stuart198
- Sugden37
- Sulphur4,874
- Summit124
- Sumner9
- Sunray854
- Sweetwater108
- Swink70
- Sycamore71
- Taft92
- Tahlequah16,935
- Talala300
- Talihina864
- Taloga327
- Tamaha199
- Tatums164
- Taylor Ferry906
- Tecumseh6,332
- Temple1,050
- Tenkiller285
- Teresita157
- Terlton78
- Terral231
- Texanna2,401
- Texhoma992
- Texola22
- Thackerville461
- The Village9,447
- Thomas1,170
- Tiawah225
- Tipton784
- Tishomingo3,083
- Titanic419
- Tonkawa3,014
- Tonkawa Tribal Housing276
- Toppers1,029
- Tribbey423
- Tryon372
- Tullahassee152
- Tulsa413,794
- Tupelo401
- Turley2,968
- Turpin441
- Tushka559
- Tuskahoma49
- Tuttle8,040
- Twin Lakes127
- Twin Oaks278
- Tyrone1,082
- Union City1,722
- Utica21
- Valley Brook647
- Valley Park14
- Valliant883
- Vanoss120
- Velma590
- Vera323
- Verden441
- Verdigris5,637
- Vernon33
- Vian1,435
- Vici725
- Vinita5,300
- Wagoner8,082
- Wainwright103
- Wakita339
- Walters2,091
- Wanette274
- Wann87
- Wapanucka432
- Wardville51
- Warner1,613
- Warr Acres10,466
- Warwick202
- Washington928
- Washita59
- Watonga2,623
- Watova35
- Watts234
- Wauhillau309
- Waukomis1,076
- Waurika2,004
- Wayne701
- Waynoka926
- Weatherford12,004
- Webb City57
- Webbers Falls316
- Welch661
- Weleetka949
- Welling720
- Wellston902
- Welty162
- West Peavine84
- West Siloam Springs1,286
- Westport606
- Westville1,743
- Wetumka1,234
- Wewoka3,091
- Whippoorwill27
- White Eagle331
- White Oak242
- White Water69
- Whitefield479
- Whitehorn Cove1,223
- Whitesboro191
- Wickliffe745
- Wilburton2,602
- Willow140
- Wilson1,725
- Winchester633
- Wister1,105
- Woodall1,050
- Woodlawn Park180
- Woodward11,882
- Wright City538
- Wyandotte465
- Wynnewood1,756
- Wynona300
- Yale998
- Yeager73
- Yukon25,529
- Zeb522
- Zena280
- Zion29
Metro and micro areas
Each of the 22 that reach into Oklahoma, with its whole population, from ACS 2020–2024 5-year estimates. Metro and micro areas are counties tied together by commuting, drawn by the Office of Management and Budget.
- Ada, OK Micro Area38,235
- Altus, OK Micro Area24,678
- Ardmore, OK Micro Area48,555
- Bartlesville, OK Micro Area53,326
- Duncan, OK Micro Area43,551
- Durant, OK Micro Area48,253
- Elk City, OK Micro Area22,148
- Enid, OK Metro Area62,146
- Fort Smith, AR-OK Metro Area229,899
- Guymon, OK Micro Area20,774
- Lawton, OK Metro Area127,310
- McAlester, OK Micro Area43,561
- Miami, OK Micro Area30,341
- Muskogee, OK Micro Area66,444
- Oklahoma City, OK Metro Area1.46M
- Ponca City, OK Micro Area43,625
- Shawnee, OK Micro Area73,463
- Stillwater, OK Micro Area82,972
- Tahlequah, OK Micro Area47,942
- Tulsa, OK Metro Area1.04M
- Weatherford, OK Micro Area39,074
- Woodward, OK Micro Area20,158
ZIP codes
Each of the 660 with people in it, by the town it's centered in, from ACS 2020–2024 5-year estimates. These are the Census Bureau's ZIP Code Tabulation Areas, which follow the Postal Service's ZIP codes as closely as census blocks allow.
- 73001Binger64
- 73002Alex1,177
- 73003Edmond23,236
- 73004Amber853
- 73005Anadarko7,558
- 73006Apache2,424
- 73007Edmond3,170
- 73008Bethany21,472
- 73009Binger875
- 73010Middleberg21,521
- 73011Bradley607
- 73012The Village46,993
- 73013Oklahoma City58,023
- 73014Calumet1,348
- 73015Carnegie2,240
- 73016Cashion2,492
- 73017Cement1,351
- 73018Chickasha20,505
- 73020Choctaw25,645
- 73021Colony241
- 73024Corn681
- 73025Cashion16,914
- 73026Norman11,216
- 73027Coyle1,190
- 73028Crescent3,389
- 73029Cyril1,525
- 73030Davis4,499
- 73031Dibble44
- 73032Dougherty227
- 73033Eakly553
- 73034Edmond48,831
- 73036El Reno21,387
- 73038Fort Cobb1,483
- 73040Geary1,349
- 73041Gotebo354
- 73042Gracemont1,009
- 73043Greenfield142
- 73044Guthrie25,398
- 73045Harrah11,517
- 73047Hinton6,493
- 73048Hydro2,149
- 73049Jones7,407
- 73050Langston1,228
- 73051Slaughterville10,274
- 73052Lindsay6,380
- 73053Lookeba703
- 73054Luther4,702
- 73055Marlow10,064
- 73056Marshall455
- 73057Maysville2,222
- 73058Meridian296
- 73059Minco2,784
- 73061Morrison1,794
- 73062Mountain View1,105
- 73063Mulhall730
- 73064Oklahoma City28,919
- 73065Newcastle11,685
- 73066Nicoma Park249
- 73067Ninnekah1,606
- 73068Slaughterville12,258
- 73069Norman28,462
- 73070Norman97
- 73071Norman43,798
- 73072Norman50,881
- 73073Orlando706
- 73074Paoli1,208
- 73075Pauls Valley9,383
- 73077Perry6,087
- 73078Piedmont13,021
- 73079Pocasset682
- 73080Washington10,773
- 73082Rush Springs2,714
- 73084Oklahoma City6,641
- 73086Sulphur8,404
- 73089Tuttle14,290
- 73090Union City927
- 73092Verden732
- 73093Goldsby3,767
- 73095Wayne1,748
- 73096Weatherford14,364
- 73097Oklahoma City178
- 73098Wynnewood3,382
- 73099Yukon91,014
- 73102Oklahoma City3,812
- 73103Oklahoma City5,486
- 73104Oklahoma City3,692
- 73105Oklahoma City5,900
- 73106Oklahoma City12,140
- 73107Oklahoma City25,791
- 73108Oklahoma City14,919
- 73109Oklahoma City21,378
- 73110Midwest City32,348
- 73111Oklahoma City10,727
- 73112Oklahoma City30,372
- 73114Oklahoma City17,656
- 73115Del City20,225
- 73116Oklahoma City10,211
- 73117Oklahoma City6,225
- 73118Oklahoma City14,262
- 73119Oklahoma City30,398
- 73120Oklahoma City35,559
- 73121Forest Park3,075
- 73122Warr Acres12,635
- 73127Oklahoma City25,865
- 73128Oklahoma City6,281
- 73129Oklahoma City20,014
- 73130Midwest City21,476
- 73131Oklahoma City3,845
- 73132Oklahoma City27,834
- 73134Oklahoma City7,522
- 73135Oklahoma City22,022
- 73139Oklahoma City17,920
- 73141Oklahoma City3,562
- 73142Oklahoma City17,548
- 73145Oklahoma City3,612
- 73149Oklahoma City6,031
- 73150Oklahoma City5,688
- 73151Oklahoma City2,254
- 73159Oklahoma City31,447
- 73160Moore62,690
- 73162Oklahoma City28,728
- 73165Oklahoma City8,357
- 73169Oklahoma City3,095
- 73170Oklahoma City41,458
- 73173Oklahoma City4,780
- 73179Oklahoma City8,532
- 73401Ardmore36,833
- 73425Ratliff City201
- 73430Burneyville1,337
- 73432Coleman862
- 73433Elmore City2,583
- 73434Foster574
- 73435Fox63
- 73436Gene Autry152
- 73437Fox108
- 73438Healdton2,938
- 73439Kingston7,141
- 73440Lebanon218
- 73441Leon102
- 73442Loco275
- 73443Lone Grove3,380
- 73444Hennepin103
- 73446Madill8,479
- 73447Earl1,090
- 73448Marietta city5,913
- 73449Mead3,088
- 73450Milburn1,562
- 73453Greenville662
- 73455Ravia590
- 73456Cornish1,621
- 73458741
- 73459Thackerville1,569
- 73460Tishomingo4,240
- 73461Wapanucka710
- 73463Wilson3,909
- 73481Ratliff City842
- 73487Tatums178
- 73488Ratliff City11
- 73491Velma791
- 73501Geronimo20,397
- 73503Medicine Park11,468
- 73505Lawton47,790
- 73507Medicine Park21,046
- 73520Addington91
- 73521Altus20,155
- 73523Altus243
- 73526Blair2,049
- 73527Cache5,109
- 73528Chattanooga617
- 73529Comanche4,898
- 73530Davidson340
- 73531Devol368
- 73532East Duke451
- 73533Duncan27,618
- 73537Eldorado543
- 73538Lakeside Village7,128
- 73539Elmer189
- 73540Faxon324
- 73541Sterling3,257
- 73542Frederick4,092
- 73543Geronimo1,993
- 73544Gould178
- 73546Grandfield1,127
- 73547Granite1,853
- 73548Hastings428
- 73549Headrick320
- 73550Hollis2,179
- 73551Hollister11
- 73552Indiahoma1,404
- 73553Loveland19
- 73554Mangum3,309
- 73555Manitou239
- 73556Martha134
- 73557Medicine Park261
- 73559Mountain Park345
- 73560Olustee654
- 73562Randlett535
- 73564Roosevelt386
- 73565Ryan941
- 73566Snyder1,459
- 73567Sterling781
- 73568Temple1,144
- 73569342
- 73570Tipton970
- 7357133
- 73572Walters3,045
- 73573Sugden2,416
- 73601Clinton9,597
- 73620Arapaho1,378
- 73622Bessie308
- 73624Burns Flat1,874
- 73625Butler town384
- 73626Canute1,110
- 73627Carter530
- 73628Cheyenne1,677
- 73632New Cordell3,093
- 73638Durham180
- 73639Custer City817
- 73641Dill City484
- 73642Durham110
- 73644Elk City14,043
- 73645Erick1,086
- 73646Fay400
- 73647Foss699
- 73650Hammon893
- 73651Hobart4,018
- 73654Leedey661
- 73655Lone Wolf830
- 73658Oakwood232
- 73659Putnam231
- 73660Reydon336
- 73661Rocky687
- 73662Sayre6,588
- 73663Seiling1,164
- 73664Sentinel1,137
- 73666Sweetwater329
- 73667Taloga489
- 73668Texola26
- 73669Thomas1,539
- 73673Willow302
- 73701Enid24,476
- 73703Carrier30,556
- 73705Enid359
- 73716Aline454
- 73717Alva6,852
- 73718Ames518
- 73719Amorita44
- 73720Bison221
- 73722Amorita382
- 73724Canton804
- 73726Carmen420
- 73727Carrier152
- 73728Cherokee1,904
- 73729Cleo Springs645
- 73730Covington598
- 73731Dacoma102
- 73733Douglas221
- 73734Dover747
- 73735Drummond623
- 73736Fairmont424
- 73737Fairview3,612
- 73738Garber1,012
- 73739Goltry416
- 73741Helena1,769
- 73742Hennessey3,906
- 73743Hillsdale89
- 73744Hitchcock227
- 73746Hopeton9
- 73747Isabella228
- 73749Jet400
- 73750Kingfisher7,123
- 73753Kremlin378
- 73754Lahoma1,043
- 73755Longdale707
- 73756Loyal292
- 73757Lucien92
- 73758Manchester257
- 73759Medford1,335
- 73760Meno264
- 73761Nash370
- 73762Okarche2,286
- 73763Okeene1,812
- 73764160
- 73766Pond Creek997
- 73768Ringwood1,520
- 73770Canton20
- 73771Wakita420
- 73772Watonga3,260
- 73773Waukomis1,623
- 73801Woodward14,892
- 73832Arnett1,022
- 73834Buffalo1,544
- 73835Camargo232
- 73838Chester528
- 73840Fargo509
- 73841Fort Supply827
- 73842Freedom354
- 73843Gage754
- 73844Knowles297
- 738481,555
- 73851May111
- 73852Quinlan2,688
- 73853Mutual505
- 73855Rosston253
- 73857Sharon918
- 73858Shattuck1,461
- 73859Vici1,582
- 73860Waynoka1,207
- 73901Adams103
- 73931434
- 73932Beaver1,940
- 73933Boise City1,335
- 73937Felt278
- 73938Forgan728
- 739391,421
- 73942Guymon13,476
- 73944Hardesty474
- 73945Hooker2,391
- 7394612
- 73947Keyes499
- 739491,620
- 73950Turpin1,377
- 73951Tyrone1,376
- 73960Texhoma5
- 74001Avant258
- 74002Barnsdall1,925
- 74003Bartlesville14,024
- 74006Bartlesville27,911
- 74008Bixby34,006
- 74010Bristow10,311
- 74011Broken Arrow33,900
- 74012Broken Arrow65,060
- 74014Coweta45,212
- 74015Fair Oaks8,676
- 74016Chelsea5,891
- 74017Sequoyah29,206
- 74019Claremore21,023
- 74020Osage7,587
- 74021Collinsville23,628
- 74022Copan1,793
- 74023Cushing11,730
- 74026Davenport814
- 74027Lenapah759
- 74028Depew1,526
- 74029Dewey5,331
- 74030Drumright3,014
- 74032Glencoe1,775
- 74033Glenpool13,745
- 74034Hallett149
- 74035Hominy4,021
- 74036Inola7,799
- 74037Jenks24,547
- 74038Jennings2,175
- 74039Kellyville3,826
- 74041Kiefer3,073
- 74042Lenapah481
- 74044Lawrence Creek8,162
- 74045Maramec248
- 74046Milfay58
- 74047Liberty town7,227
- 74048Nowata5,559
- 74050Oakhurst475
- 74051Ochelata1,888
- 74052Oilton1,065
- 74053Oologah5,375
- 74054Prue859
- 74055Owasso51,381
- 74056Pawhuska4,864
- 74058Pawnee3,558
- 74059Perkins5,643
- 74060Prue334
- 74061Ramona2,245
- 74062Ripley997
- 74063Lotsee31,370
- 74066Kellyville32,292
- 74068Shamrock94
- 74070Avant15,447
- 74071Slick130
- 74072South Coffeyville1,630
- 74073Sperry5,881
- 74074Stillwater32,422
- 74075Stillwater26,451
- 74077Stillwater1,755
- 74078Stillwater451
- 74079Stroud4,449
- 74080Talala3,003
- 74081Terlton1,829
- 74082Vera137
- 74083Wann791
- 74084Wynona380
- 74085Yale2,426
- 74103Tulsa2,450
- 74104Tulsa12,806
- 74105Tulsa26,951
- 74106Tulsa15,655
- 74107Oakhurst19,013
- 74108Tulsa7,315
- 74110Tulsa15,244
- 74112Tulsa21,386
- 74114Tulsa15,944
- 74115Tulsa24,297
- 74116Tulsa3,617
- 74117Turley52
- 74119Tulsa3,670
- 74120Tulsa5,195
- 74126Turley9,920
- 74127Tulsa16,324
- 74128Tulsa13,751
- 74129Tulsa18,382
- 74130Turley2,212
- 74131Oakhurst2,435
- 74132Tulsa10,858
- 74133Tulsa48,699
- 74134Tulsa23,323
- 74135Tulsa20,138
- 74136Tulsa31,416
- 74137Tulsa28,533
- 74145Tulsa18,196
- 74146Tulsa16,507
- 74171Tulsa2,207
- 74301White Oak11,244
- 74330Adair2,353
- 74331Bernice7,058
- 74332White Oak1,690
- 74333Bluejacket1,070
- 74337Mazie5,109
- 74338Colcord5,069
- 74339North Miami2,245
- 74340Disney182
- 74342Drowning Creek2,039
- 74343Fairland3,183
- 74344Grove14,876
- 74346Deer Lick8,266
- 74347Kansas2,757
- 74349Grand Lake Towne941
- 74350Langley692
- 74352Ballou5,862
- 74354Miami17,208
- 74358North Miami222
- 74359Oaks309
- 74360Commerce6
- 74361Pryor Creek17,612
- 74363Peoria2,492
- 74364Leach1,931
- 74365Kenwood4,277
- 74366Spavinaw1,289
- 74367Strang624
- 74368Twin Oaks60
- 74369Welch1,741
- 74370Wyandotte3,656
- 74401Summit15,951
- 74403Muskogee29,217
- 74421Beggs4,360
- 74422Boynton841
- 74423River Bottom884
- 74425Canadian1,036
- 74426Checotah9,712
- 74427Cookson1,342
- 74428Council Hill808
- 74429Coweta16,622
- 74430Crowder530
- 74431Dewar895
- 74432Eufaula9,645
- 74434Fort Gibson9,611
- 74435Notchietown3,042
- 74436Haskell5,057
- 74437Dewar8,937
- 74438Hitchita447
- 74441Lost City5,564
- 74442Indianola town790
- 74445Morris3,051
- 74446Okay436
- 74447Okmulgee15,786
- 74450Oktaha1,698
- 74451Pettit4,023
- 74452Peggs279
- 74454Porter2,831
- 74455Porum2,346
- 74456Preston78
- 74457Pumpkin Hollow447
- 74458Redbird194
- 74459Rentiesville54
- 74460Schulter377
- 74462Stigler7,114
- 74463Taft2,115
- 74464Tahlequah31,116
- 74467Wagoner14,400
- 74468Wainwright260
- 74469Warner2,221
- 74470Webbers Falls1,374
- 74471Caney CDP1,475
- 74472Whitefield596
- 74501McAlester28,616
- 74521Albion54
- 74522Alderson128
- 74523Antlers5,817
- 74525Lane10,431
- 74528Blanco144
- 74530Bromide177
- 74531Gerty834
- 74533Caney town891
- 74534Centrahoma144
- 74535Clarita92
- 74536Clayton1,364
- 74538Cottonwood3,957
- 74540173
- 74543Finley367
- 74546Haileyville597
- 74547Hartshorne2,815
- 74549118
- 74552Kinta980
- 74553Kiowa1,382
- 74554Krebs1,917
- 74555Lane671
- 74556Lehigh257
- 74557Moyers539
- 74558Nashoba383
- 74560Pittsburg435
- 74561Quinton1,950
- 74562Rattan724
- 74563Red Oak1,910
- 74565Savanna446
- 74567Nashoba79
- 74569Stringtown584
- 74570Stuart1,358
- 74571Talihina3,285
- 74572Tupelo803
- 74574Tuskahoma1,109
- 74576Wardville209
- 74577Whitesboro259
- 74578Wilburton5,668
- 74601Ponca City18,916
- 74604McCord12,189
- 74630Billings890
- 74631Blackwell6,689
- 74632Braman553
- 74633Burbank557
- 74636Deer Creek189
- 74637Fairfax1,510
- 74640Hunter327
- 74641Kaw City552
- 74643Lamont512
- 74644Marland597
- 74646Nardin289
- 74647Newkirk3,534
- 74650Ralston608
- 74651Red Rock849
- 74652Foraker793
- 74653Tonkawa3,710
- 74701Durant27,497
- 74720Achille401
- 74722141
- 74723Bennington1,302
- 74724132
- 74726Utica2,065
- 74727Boswell2,168
- 74728Hochatown10,977
- 74729Caddo2,668
- 74730Calera5,807
- 74731Cartwright1,646
- 74733Colbert3,069
- 74734Eagletown858
- 74735Fort Towson2,027
- 74736Garvin947
- 74737Golden27
- 74738Grant375
- 74740Haworth1,959
- 74741Kemp810
- 74743Hugo8,075
- 74745Idabel9,720
- 74747Kemp313
- 74748Bee572
- 74750Millerton170
- 74754541
- 74755Swink186
- 74756Sawyer754
- 74759Soper1,024
- 74760Rattan108
- 74761Swink72
- 74764Wright City3,582
- 74766Wright City1,100
- 74801Bethel Acres21,967
- 74804Shawnee23,227
- 74820Latta31,943
- 74824Agra1,482
- 74825Allen1,788
- 74826Asher1,177
- 74827Atwood330
- 74829Boley1,678
- 74830Bowlegs148
- 74831Byars743
- 74832Carney930
- 74833Welty574
- 74834Chandler7,952
- 74836Connerville164
- 74837Cromwell153
- 74839Dustin662
- 74840Earlsboro1,827
- 74842Fittstown187
- 74843Fitzhugh324
- 74844Francis332
- 74845Hanna383
- 74848Holdenville8,020
- 74849Konawa2,727
- 74850Lamar247
- 74851McLoud11,489
- 74852Macomb1,598
- 74854Maud2,038
- 74855Meeker4,249
- 74856Mill Creek842
- 74857Oklahoma City9,931
- 74859Okemah5,671
- 74860Paden1,664
- 74864Prague4,833
- 74865Roff1,894
- 74866St. Louis74
- 74867Sasakwa595
- 74868Seminole12,543
- 74869Sparks536
- 74871Stonewall2,349
- 74872Stratford2,901
- 74873Brooksville10,924
- 74875Tryon945
- 74878Wanette1,778
- 74880Weleetka1,840
- 74881Wellston5,297
- 74883Wetumka2,226
- 74884Dixon5,474
- 74901Arkoma1,976
- 74902Pocola4,423
- 74930Bokoshe1,774
- 74931Bunch1,012
- 74932Cameron2,527
- 74935Fanshawe166
- 74936Gans1,330
- 74937Hodgen5,220
- 74939Hodgen1,289
- 74940Howe2,504
- 74941Keota2,482
- 74942Le Flore145
- 74943Lequire94
- 74944McCurtain1,116
- 74945Marble City165
- 74946Moffett33
- 74947Monroe115
- 74948Liberty CDP12,382
- 74949Whitesboro214
- 74951Panama1,508
- 74953Poteau12,406
- 74954Roland5,105
- 74955Badger Lee13,864
- 74956Shady Point1,882
- 74957Smithville834
- 74959Spiro6,375
- 74960Stilwell11,971
- 74962Pinhook Corner4,398
- 74963Smithville689
- 74964Chance2,241
- 74965Christie4,793
- 74966Fanshawe3,456
School districts
Each of the 509 with people in it, from ACS 2020–2024 5-year estimates. Elementary districts teach the lower grades and secondary districts the upper ones, under them; the rest are unified, teaching every grade.
- Achille Public Schools2,627
- Ada Public Schools14,594
- Adair Public Schools4,375
- Afton Public Schools2,474
- Agra Public Schools1,680
- Albion Public Schoolelementary565
- Alex Public Schools1,699
- Aline-Cleo Public Schools1,157
- Allen Public Schools1,905
- Allen-Bowden Public Schoolelementary3,073
- Altus Public Schools19,639
- Alva Public Schools7,240
- Amber-Pocasset Public Schools1,848
- Anadarko Public Schools7,311
- Anderson Public Schoolelementary2,740
- Antlers Public Schools4,918
- Arapaho Public Schools2,160
- Ardmore Public Schools19,345
- Arkoma Public Schools2,101
- Arnett Public Schools1,090
- Asher Public Schools1,080
- Atoka Public Schools4,323
- Avant Public Schoolelementary1,485
- Balko Public Schools596
- Banner Public Schoolelementary3,437
- Barnsdall Public Schools2,045
- Bartlesville Public Schools40,352
- Battiest Public Schools1,201
- Bearden Public Schoolelementary376
- Beaver Public Schools1,809
- Beggs Public Schools4,996
- Belfonte Public Schoolelementary1,453
- Bennington Public Schools1,207
- Berryhill Public Schools3,867
- Bethany Public Schools3,826
- Bethel Public Schools5,450
- Big Pasture Public Schools942
- Billings Public Schools959
- Binger-Oney Public Schools1,608
- Bishop Public Schoolelementary2,481
- Bixby Public Schools43,271
- Blackwell Public Schools6,881
- Blair Public Schools1,828
- Blanchard Public Schools10,523
- Bluejacket Public Schools1,274
- Boise City Public Schools1,861
- Bokoshe Public Schools1,144
- Boone-Apache Public Schools1,945
- Boswell Public Schools1,894
- Bowlegs Public Schools1,382
- Bowring Public Schoolelementary617
- Braggs Public Schools1,046
- Bray-Doyle Public Schools1,902
- Bridge Creek Public Schools9,583
- Briggs Public Schoolelementary2,423
- Bristow Public Schools8,954
- Broken Arrow Public Schools128,352
- Broken Bow Public Schools6,784
- Brushy Public Schoolelementary1,475
- Buffalo Public Schools1,564
- Buffalo Valley Public Schools1,191
- Burlington Public Schools576
- Burns Flat-Dill City Schools2,581
- Butner Public Schools1,839
- Byng Public Schools8,840
- Cache Public Schools9,438
- Caddo Public Schools2,220
- Calera Public Schools5,064
- Calumet Public Schools881
- Calvin Public Schools1,214
- Cameron Public Schools2,308
- Canadian Public Schools4,219
- Caney Public Schools1,577
- Caney Valley Public Schools5,719
- Canton Public Schools1,584
- Canute Public Schools1,387
- Carnegie Public Schools2,213
- Carney Public Schools1,210
- Cashion Public Schools3,007
- Catoosa Public Schools11,380
- Cave Springs Public Schools443
- Cement Public Schools1,130
- Central High Public Schools2,378
- Central Public Schools1,907
- Chandler Public Schools6,535
- Chattanooga Public Schools1,011
- Checotah Public Schools9,467
- Chelsea Public Schools6,462
- Cherokee Public Schools1,818
- Cheyenne Public Schools1,785
- Chickasha Public Schools16,980
- Chisholm Public Schools5,486
- Choctaw/Nicoma Park Schools34,197
- Chouteau-Mazie Public Schools5,557
- Cimarron Public Schools1,737
- Claremore Public Schools25,328
- Clayton Public Schools1,247
- Cleora Public Schoolelementary2,025
- Cleveland Public Schools9,452
- Clinton Public Schools9,482
- Coalgate Public Schools3,941
- Colbert Public Schools4,879
- Colcord Public Schools2,950
- Coleman Public Schools921
- Collinsville Public Schools16,928
- Comanche Public Schools5,163
- Commerce Public Schools3,663
- Copan Public Schools2,131
- Cordell Public Schools4,339
- Cottonwood Public Schoolelementary460
- Covington-Douglas Schools1,398
- Coweta Public Schools18,962
- Coyle Public Schools3,609
- Crescent Public Schools3,569
- Crooked Oak Public Schools3,122
- Crowder Public Schools2,419
- Crutcho Public Schoolelementary2,254
- Cushing Public Schools10,390
- Cyril Public Schools1,571
- Dahlonegah Public Schoolelementary1,063
- Dale Public Schools3,513
- Darlington Public Schoolelementary782
- Davenport Public Schools1,637
- Davidson Public Schoolselementary319
- Davis Public Schools4,998
- Deer Creek Public Schools43,218
- Deer Creek-Lamont Schools829
- Denison Public Schoolelementary2,112
- Depew Public Schools1,742
- Dewar Public Schools1,228
- Dewey Public Schools5,368
- Dibble Public Schools3,832
- Dickson Public Schools5,066
- Dover Public Schools784
- Drummond Public Schools1,523
- Drumright Public Schools2,695
- Duke Public Schools512
- Duncan Public Schools23,277
- Durant Public Schools21,118
- Eagletown Public Schools881
- Earlsboro Public Schools1,155
- Edmond Public Schools169,758
- El Reno Public Schools17,178
- Elgin Public Schools9,999
- Elk City Public Schools11,555
- Elmore City-Pernell Schools2,981
- Empire Public Schools2,451
- Enid Public Schools45,371
- Erick Public Schools1,272
- Eufaula Public Schools7,590
- Fairland Public Schools3,276
- Fairview Public Schools4,080
- Fanshawe Public Schoolelementary693
- Fargo Public Schools1,473
- Felt Public Schools313
- Fletcher Public Schools2,687
- Flower Mound Public Schoolelementary751
- Forest Grove Public Schoolelementary837
- Forgan Public Schools755
- Fort Cobb-Broxton Schools1,261
- Fort Gibson Public Schools7,431
- Fort Supply Public Schools1,010
- Fort Towson Public Schools2,522
- Fox Public Schools1,394
- Foyil Public Schools3,055
- Frederick Public Schools4,022
- Freedom Public Schools428
- Friend Public Schoolelementary1,189
- Frink-Chambers Public Schoolelementary1,919
- Frontier Public Schools1,691
- Gans Public Schools1,883
- Garber Public Schools1,760
- Geary Public Schools1,403
- Geronimo Public Schools5,621
- Glencoe Public Schools1,404
- Glenpool Public Schools14,693
- Glover Public Schoolelementary600
- Goodwell Public Schools1,208
- Gore Public Schools3,166
- Gracemont Public Schools840
- Graham-Dustin Public Schools945
- Grand View Public Schoolelementary4,529
- Grandfield Public Schools1,085
- Grandview Public Schoolelementary687
- Granite Public Schools2,128
- Greenville Public Schoolelementary993
- Grove Public Schoolelementary5,516
- Grove Public Schools18,675
- Guthrie Public Schools27,027
- Guymon Public Schools13,255
- Gypsy Public Schoolelementary644
- Haileyville Public Schools2,441
- Hammon Public Schools932
- Hanna Public Schools439
- Hardesty Public Schools486
- Harmony Public School1,690
- Harrah Public Schools13,010
- Hartshorne Public Schools3,102
- Haskell Public Schools6,839
- Haworth Public Schools2,428
- Haywood Public Schoolelementary1,149
- Healdton Public Schools2,991
- Heavener Public Schools4,363
- Hennessey Public Schools3,942
- Henryetta Public Schools6,647
- Hilldale Public Schools7,205
- Hinton Public Schools6,564
- Hobart Public Schools3,833
- Hodgen Public Schoolelementary1,707
- Holdenville Public Schools6,963
- Hollis Public Schools2,392
- Holly Creek Public Schoolelementary1,346
- Hominy Public Schools4,018
- Hooker Public Schools2,280
- Howe Public Schools1,801
- Hugo Public Schools8,386
- Hulbert Public Schools2,616
- Hydro-Eakly Public Schools2,651
- Idabel Public Schools6,654
- Indiahoma Public Schools1,405
- Indianola Public Schools1,774
- Inola Public Schools7,158
- Jay Public Schools8,957
- Jenks Public Schools79,147
- Jennings Public Schoolelementary966
- Jones Public Schools6,918
- Justice Public Schoolelementary235
- Justus-Tiawah Public Schoolelementary3,747
- Kansas Public Schools3,567
- Kellyville Public Schools7,370
- Kenwood Public Schoolelementary806
- Keota Public Schools2,255
- Ketchum Public Schools3,619
- Keys Public Schoolselementary4,809
- Keystone Public Schoolelementary3,853
- Kiefer Public Schools3,746
- Kildare Public Schoolelementary1,299
- Kingfisher Public Schools6,716
- Kingston Public Schools7,042
- Kinta Public Schools1,332
- Kiowa Public Schools2,238
- Konawa Public Schools2,990
- Krebs Public Schoolelementary2,751
- Kremlin-Hillsdale Schools1,174
- Lane Public Schoolelementary2,447
- Latta Public Schools4,413
- Laverne Public Schools1,896
- Lawton Public Schools86,106
- Leach Public Schoolelementary1,063
- Leedey Public Schools770
- LeFlore Public Schools1,516
- Lexington Public Schools8,204
- Liberty Public Schoolelementary2,615
- Liberty Public Schools3,089
- Lindsay Public Schools5,843
- Little Axe Public Schools6,148
- Locust Grove Public Schools6,607
- Lomega Public Schools655
- Lone Grove Public Schools6,939
- Lone Star Public Schoolelementary3,567
- Lone Wolf Public Schools829
- Lookeba-Sickles Public Schools770
- Lowrey Public Schoolelementary1,427
- Lukfata Public Schoolelementary1,346
- Luther Public Schools5,823
- Macomb Public Schools1,868
- Madill Public Schools8,750
- Mangum Public Schools3,268
- Mannford Public Schools7,631
- Mannsville Public Schoolelementary1,236
- Maple Public Schoolelementary657
- Marble City Public Schoolelementary663
- Marietta Public School4,604
- Marlow Public Schools6,644
- Maryetta Public Schoolselementary1,301
- Mason Public Schools1,042
- Maud Public Schools1,854
- Maysville Public Schools2,237
- McAlester Public Schools17,792
- McCord Public Schoolelementary2,023
- McCurtain Public Schools1,053
- McLoud Public Schools12,035
- Medford Public Schools1,896
- Meeker Public Schools4,426
- Merritt Public Schools3,295
- Miami Public Schools14,412
- Middleberg Public Schoolelementary2,568
- Midway Public Schools1,508
- Midwest City-Del City Schools83,342
- Milburn Public Schools1,307
- Mill Creek Public Schools845
- Millwood Public Schools2,996
- Minco Public Schools2,606
- Moffett Public Schoolelementary33
- Monroe Public Schoolelementary973
- Moore Public Schools149,922
- Mooreland Public Schools2,804
- Morris Public Schools4,364
- Morrison Public Schools2,862
- Moseley Public Schoolelementary2,189
- Moss Public Schools1,155
- Mounds Public Schools3,608
- Mountain View-Gotebo Schools1,440
- Moyers Public Schoolselementary924
- Muldrow Public Schools7,704
- Mulhall-Orlando Public Schools1,619
- Muskogee Public Schools35,837
- Mustang Public Schools73,605
- Nashoba Public Schoolelementary443
- Navajo Public Schools1,689
- New Lima Public Schools1,304
- Newcastle Public Schools12,716
- Newkirk Public Schools3,718
- Ninnekah Public Schools2,353
- Noble Public Schools16,614
- Norman Public Schools126,056
- North Rock Creek Public School4,166
- Norwood Public Schoolelementary1,695
- Nowata Public Schools5,430
- Oak Grove Public Schoolelementary820
- Oakdale Public Schoolelementary4,320
- Oaks-Mission Public Schools1,483
- Oilton Public Schools1,501
- Okarche Public Schools2,016
- Okay Public Schools2,405
- Okeene Public Schools1,756
- Okemah Public Schools5,785
- Oklahoma City Public Schools290,945
- Oklahoma Union Public Schools2,488
- Okmulgee Public Schools12,877
- Oktaha Public Schools2,002
- Olive Public Schools2,257
- Olustee-Eldorado Public Schools1,112
- Oologah-Talala Public Schools10,733
- Optima Public Schoolelementary202
- Osage Hills Public Schoolelementary697
- Osage Public Schoolelementary1,746
- Owasso Public Schools60,111
- Paden Public Schools1,778
- Panama Public Schools3,434
- Panola Public Schoolselementary1,180
- Paoli Public Schools1,219
- Pauls Valley Public Schools6,679
- Pawhuska Public Schools4,285
- Pawnee Public Schools3,625
- Peavine Public Schoolelementary967
- Peckham Public Schoolelementary341
- Peggs Public Schoolelementary1,969
- Perkins-Tryon Public Schools8,448
- Perry Public Schools6,081
- Piedmont Public Schools25,282
- Pioneer Public Schoolelementary1,177
- Pioneer-Pleasant Vale Schools2,885
- Pittsburg Public Schools616
- Plainview Public Schools7,609
- Pleasant Grove Public Schoolelementary519
- Pocola Public Schools4,266
- Ponca City Public Schools27,860
- Pond Creek-Hunter Schools1,228
- Porter Consolidated Schools3,260
- Porum Public Schools1,876
- Poteau Public Schools11,812
- Prague Public Schools5,155
- Preston Public Schools996
- Pretty Water Public Schoolelementary1,826
- Prue Public Schools2,617
- Pryor Public Schools14,218
- Purcell Public Schools8,272
- Putnam City Public Schools123,076
- Quapaw Public Schools2,545
- Quinton Public Schools2,083
- Rattan Public Schools2,405
- Ravia Public Schoolelementary1,001
- Red Oak Public Schools1,203
- Reydon Public Schools512
- Ringling Public Schools1,637
- Ringwood Public Schools1,500
- Ripley Public Schools2,354
- Riverside Public Schoolelementary1,669
- Robin Hill Public Schoolelementary1,235
- Rock Creek Public Schools2,649
- Rocky Mountain Public Schoolelementary512
- Roff Public Schools1,809
- Roland Public Schools5,166
- Rush Springs Public Schools2,831
- Ryal Public Schoolelementary318
- Ryan Public Schools967
- Salina Public Schools4,293
- Sallisaw Public Schools10,679
- Sand Springs Public Schools25,587
- Sapulpa Public Schools23,490
- Sasakwa Public Schools652
- Savanna Public Schools1,430
- Sayre Public Schools5,722
- Schulter Public Schools765
- Seiling Public Schools1,612
- Seminole Public Schools8,143
- Sentinel Public Schools2,014
- Sequoyah Public Schools6,787
- Shady Grove Public Schoolelementary1,146
- Shady Point Public School1,181
- Sharon-Mutual Public Schools1,895
- Shattuck Public Schools1,493
- Shawnee Public Schools26,327
- Shidler Public Schools1,519
- Silo Public Schools8,549
- Skiatook Public Schools12,797
- Smithville Public Schools1,635
- Snyder Public Schools2,420
- Soper Public Schools1,210
- South Coffeyville Schoolselementary1,321
- South Rock Creek Public Schoolelementary2,404
- Sperry Public Schools5,955
- Spiro Public Schools6,410
- Springer Public Schools1,692
- Sterling Public Schools2,179
- Stidham Public Schoolelementary558
- Stigler Public Schools6,042
- Stillwater Public Schools57,109
- Stilwell Public Schools6,533
- Stonewall Public Schools2,999
- Straight Public Schoolelementary209
- Stratford Public Schools3,355
- Stringtown Public Schools897
- Strother Public Schools2,030
- Stroud Public Schools4,227
- Stuart Public Schools1,165
- Sulphur Public Schools8,112
- Sweetwater Public Schools435
- Tahlequah Public Schools21,084
- Talihina Public Schools2,070
- Taloga Public Schools808
- Tannehill Public Schoolelementary1,052
- Tecumseh Public Schools9,357
- Temple Public Schools1,305
- Tenkiller Public Schoolelementary1,716
- Terral Public Schoolelementary335
- Texhoma Public Schools1,452
- Thackerville Public Schools1,872
- Thomas-Fay-Custer Unified Schools2,878
- Timberlake Public Schools2,978
- Tipton Public Schools1,226
- Tishomingo Public Schools4,381
- Tonkawa Public Schools3,753
- Tulsa Public Schools286,050
- Tupelo Public Schools1,162
- Turkey Ford Public Schoolelementary1,038
- Turner Public Schools2,491
- Turpin Public Schools1,638
- Tushka Public Schools1,751
- Tuskahoma Public Schoolelementary555
- Tuttle Public Schools9,824
- Twin Hills Public Schoolelementary2,012
- Tyrone Public Schools1,280
- Union City Public Schools1,488
- Union Public Schools87,007
- Valliant Public Schools4,234
- Vanoss Public Schools4,406
- Varnum Public Schools1,413
- Velma-Alma Public Schools2,192
- Verden Public Schools1,082
- Verdigris Public Schoolselementary6,421
- Vian Public Schools3,900
- Vici Public Schools1,727
- Vinita Public Schools8,977
- Wagoner Public Schools13,638
- Wainwright Public Schoolelementary781
- Walters Public Schools2,918
- Wanette Public Schools1,893
- Wapanucka Public Schools1,071
- Warner Public Schools3,238
- Washington Public Schools5,272
- Watonga Public Schools3,302
- Watts Public Schools1,588
- Waukomis Public Schools1,785
- Waurika Public Schools2,557
- Wayne Public Schools3,299
- Waynoka Public Schools1,302
- Weatherford Public Schools14,297
- Webbers Falls Public Schools1,393
- Welch Public Schools1,781
- Weleetka Public Schools1,843
- Wellston Public Schools3,727
- Western Heights Public Schools16,158
- Westville Public Schools5,505
- Wetumka Public Schools2,223
- Wewoka Public Schools3,887
- White Oak Public Schoolselementary1,057
- White Rock Public Schoolelementary1,803
- Whitebead Public Schoolelementary1,446
- Whitefield Public Schoolelementary802
- Whitesboro Public Schools964
- Wickliffe Public Schoolelementary485
- Wilburton Public Schools4,521
- Wilson Public Schools (Carter and Love Counties)3,027
- Wilson Public Schools (Okmulgee County)993
- Wister Public Schools2,381
- Woodall Public Schoolelementary1,724
- Woodland Public Schools2,172
- Woodward Public Schools13,891
- Wright City Public Schools1,414
- Wyandotte Public Schools4,386
- Wynnewood Public Schools4,013
- Wynona Public Schools522
- Yale Public Schools2,645
- Yarbrough Public Schools343
- Yukon Public Schools54,286
- Zaneis Public Schoolelementary569
- Zion Public Schoolelementary790
Congressional districts
As drawn for the 119th Congress (2025–2027).
- Congressional District 1809,593
- Congressional District 2804,459
- Congressional District 3797,981
- Congressional District 4804,349
- Congressional District 5812,252
State senate districts
The upper chamber’s districts, as drawn in 2024.
- State Senate District 181,211
- State Senate District 286,832
- State Senate District 384,745
- State Senate District 482,296
- State Senate District 582,943
- State Senate District 686,520
- State Senate District 783,375
- State Senate District 881,892
- State Senate District 981,533
- State Senate District 1083,229
- State Senate District 1178,910
- State Senate District 1284,311
- State Senate District 1383,900
- State Senate District 1482,893
- State Senate District 1584,276
- State Senate District 1685,058
- State Senate District 1784,491
- State Senate District 1887,548
- State Senate District 1980,179
- State Senate District 2082,771
- State Senate District 2184,996
- State Senate District 2293,068
- State Senate District 2390,665
- State Senate District 2485,166
- State Senate District 2587,252
- State Senate District 2679,500
- State Senate District 2779,007
- State Senate District 2882,598
- State Senate District 2982,370
- State Senate District 3081,480
- State Senate District 3180,799
- State Senate District 3283,426
- State Senate District 3383,267
- State Senate District 3486,289
- State Senate District 3585,952
- State Senate District 3684,380
- State Senate District 3784,120
- State Senate District 3880,829
- State Senate District 3982,870
- State Senate District 4081,838
- State Senate District 4184,998
- State Senate District 4284,827
- State Senate District 4387,873
- State Senate District 4483,834
- State Senate District 4583,938
- State Senate District 4684,277
- State Senate District 4786,647
- State Senate District 4883,455
State house districts
The lower chamber’s districts, as drawn in 2024.
- State House District 138,489
- State House District 239,860
- State House District 340,344
- State House District 439,863
- State House District 538,712
- State House District 640,340
- State House District 738,863
- State House District 840,120
- State House District 940,367
- State House District 1039,423
- State House District 1141,939
- State House District 1241,908
- State House District 1339,506
- State House District 1439,148
- State House District 1539,321
- State House District 1639,235
- State House District 1738,639
- State House District 1837,628
- State House District 1938,577
- State House District 2043,745
- State House District 2140,713
- State House District 2239,221
- State House District 2339,282
- State House District 2439,691
- State House District 2539,598
- State House District 2639,629
- State House District 2737,214
- State House District 2840,097
- State House District 2940,453
- State House District 3038,428
- State House District 3142,416
- State House District 3238,994
- State House District 3339,846
- State House District 3440,783
- State House District 3538,118
- State House District 3640,749
- State House District 3739,433
- State House District 3840,832
- State House District 3939,909
- State House District 4037,648
- State House District 4146,138
- State House District 4238,631
- State House District 4342,026
- State House District 4440,900
- State House District 4540,600
- State House District 4639,712
- State House District 4744,474
- State House District 4840,718
- State House District 4938,508
- State House District 5039,357
- State House District 5139,604
- State House District 5238,902
- State House District 5340,370
- State House District 5440,283
- State House District 5539,110
- State House District 5639,913
- State House District 5739,574
- State House District 5839,119
- State House District 5938,874
- State House District 6041,959
- State House District 6137,210
- State House District 6240,081
- State House District 6338,968
- State House District 6439,101
- State House District 6537,387
- State House District 6639,422
- State House District 6740,534
- State House District 6840,388
- State House District 6939,475
- State House District 7039,368
- State House District 7140,303
- State House District 7240,527
- State House District 7337,782
- State House District 7441,528
- State House District 7539,277
- State House District 7639,787
- State House District 7738,076
- State House District 7841,208
- State House District 7939,835
- State House District 8042,038
- State House District 8139,703
- State House District 8244,963
- State House District 8337,390
- State House District 8438,102
- State House District 8538,827
- State House District 8638,677
- State House District 8739,719
- State House District 8839,777
- State House District 8939,409
- State House District 9038,659
- State House District 9140,351
- State House District 9241,437
- State House District 9338,939
- State House District 9440,085
- State House District 9540,254
- State House District 9640,512
- State House District 9739,950
- State House District 9840,989
- State House District 9939,379
- State House District 10040,534
- State House District 10140,830
PUMAs
Public Use Microdata Areas: areas of 100,000 people or more that the state draws from census tracts, for the Census Bureau’s microdata.
- Canadian County–Yukon, Mustang, El Reno, West Oklahoma City & Piedmont Cities PUMA168,985
- East Central Oklahoma Counties–McAlester, Seminole, Holdenville & Eufaula Cities PUMA111,122
- East Central Oklahoma Counties–Shawnee, Stroud, Chandler & Tecumseh Cities PUMA107,682
- East Oklahoma Counties–Muskogee, Wagoner & Coweta Cities PUMA153,053
- East Oklahoma Counties–Tahleqhah, Ft. Gibson, Sallisaw & Stilwell Cities PUMA107,377
- North Central Oklahoma Counties–Enid, Ponca City, Blackwell & Perry Cities PUMA120,799
- North Central Oklahoma Counties–Stillwater, Guthrie & Cushing Cities PUMA134,910
- North Cleveland County–South Oklahoma City & Moore Cities PUMA145,918
- Northeast Oklahoma Counties–Bartlesville, Skiatook, Pawhuska & Pawnee Cities PUMA115,118
- Northeast Oklahoma Counties–Claremore, Nowata & Catoosa Cities PUMA108,045
- Northeast Oklahoma Counties–Miami, Pryor Creek, Grove & Vinita Cities PUMA125,526
- Northeast Oklahoma Counties–Sapulpa, Bristow & Okmulgee Cities PUMA109,729
- Oklahoma County (Central)–Oklahoma City, The Village & Nichols Hills Cities PUMA108,941
- Oklahoma County (East)–Midwest City, Del City, East Oklahoma City & Choctaw Cities PUMA122,430
- Oklahoma County (Northeast)–Edmond & North Oklahoma City PUMA167,076
- Oklahoma County (Northwest)–NW Oklahoma City, Bethany & Warr Acres Cities PUMA173,488
- Oklahoma County (Southeast)–East Central Oklahoma City PUMA124,634
- Oklahoma County (Southwest)–West Central Oklahoma City PUMA109,630
- Panhandle & NW Oklahoma Counties–Guymon, Woodward, Alva & Kingfisher Cities PUMA108,703
- South Central Oklahoma Counties–Ardmore, Duncan, Sulphur & Madill Cities PUMA121,500
- South Central Oklahoma Counties–Chickasha, Newcastle, Blanchard & Purcell Cities PUMA127,739
- South Cleveland County–Norman & Noble Cities PUMA154,129
- Southeast Oklahoma Counties–Durant, Ada, Atoka & Tishomingo Cities PUMA132,257
- Southeast Oklahoma Counties–Poteau, Idabel, Broken Bow, Wilburton & Hugo Cities PUMA126,204
- Southwest Oklahoma Counties–Altus, Weatherford, Elk City, Clinton & Anadarko Cities PUMA135,535
- Southwest Oklahoma Counties–Lawton, Elgin, Cache & Walters Cities PUMA127,310
- Tulsa County (East)–Northeast Tulsa City PUMA147,923
- Tulsa County (North)–North Tulsa, Owasso & Collinsville Cities PUMA129,492
- Tulsa County (Southeast)–SE Tulsa, Broken Arrow & Bixby Cities PUMA124,148
- Tulsa County (Southwest)–South Tulsa, Jenks & Glenpool Cities PUMA164,267
- Tulsa County (West)–Tulsa & Sand Springs Cities PUMA114,964
Urban areas
Each that reaches into Oklahoma, with its whole population. Urban areas are the densely settled land the Census Bureau draws after each census, whatever the city lines.
- Ada, OK17,068
- Altus, OK18,773
- Alva, OK5,135
- Anadarko, OK4,713
- Ardmore, OK21,438
- Bartlesville, OK39,963
- Blackwell, OK5,868
- Chickasha, OK15,934
- Claremore, OK26,065
- Clinton, OK7,569
- Coffeyville, KS–OK9,301
- Collinsville, OK4,654
- Cushing, OK7,568
- Duncan, OK20,295
- Durant, OK20,684
- El Reno, OK15,730
- Elk City, OK11,215
- Enid, OK49,966
- Fort Smith, AR–OK127,240
- Grove, OK7,871
- Guthrie, OK9,813
- Guymon, OK12,007
- Henryetta, OK6,112
- Holdenville, OK4,226
- Hugo, OK5,040
- Idabel, OK4,968
- Lawton, OK89,240
- McAlester, OK20,187
- Miami, OK15,206
- Muskogee, OK35,855
- Norman, OK122,072
- Oklahoma City, OK999,441
- Okmulgee, OK10,956
- Pauls Valley, OK5,706
- Perry, OK4,477
- Ponca City, OK24,826
- Poteau, OK7,852
- Pryor Creek, OK9,693
- Purcell, OK7,450
- Sallisaw, OK7,486
- Seminole, OK6,586
- Shawnee, OK34,748
- Siloam Springs, AR–OK19,776
- Skiatook, OK7,242
- Stillwater, OK49,300
- Sulphur, OK4,755
- Tahlequah, OK18,511
- Tulsa, OK734,911
- Vinita, OK5,165
- Wagoner, OK8,076
- Weatherford, OK11,963
- Woodward, OK11,229
Tribal areas
Each that reaches into Oklahoma, with its whole population.
- Caddo-Wichita-Delaware OTSA, OK15,683
- Cherokee OTSA, OK521,336
- Cheyenne and Arapaho OTSA, OK195,234
- Chickasaw OTSA, OK315,106
- Choctaw OTSA, OK229,120
- Citizen Potawatomi Nation-Absentee Shawnee OTSA, OK128,061
- Creek OTSA, OK831,269
- Creek/Seminole joint-use OTSA, OK2,285
- Eastern Shawnee OTSA, OK789
- Iowa OTSA, OK7,010
- Kaw OTSA, OK5,708
- Kaw/Ponca joint-use OTSA, OK26,028
- Kickapoo OTSA, OK27,757
- Kiowa-Comanche-Apache-Fort Sill Apache OTSA, OK187,709
- Kiowa-Comanche-Apache-Ft Sill Apache/Caddo-Wichita-Delaware joint-use OTSA, OK9,171
- Miami OTSA, OK232
- Miami/Peoria joint-use OTSA, OK4,098
- Modoc OTSA, OK300
- Osage Reservation, OK45,997
- Otoe-Missouria OTSA, OK1,042
- Ottawa OTSA, OK5,545
- Pawnee OTSA, OK15,579
- Peoria OTSA, OK4,990
- Ponca OTSA, OK1,950
- Quapaw OTSA, OK4,571
- Sac and Fox OTSA, OK59,096
- Seminole OTSA, OK21,209
- Seneca-Cayuga OTSA, OK4,537
- Tonkawa OTSA, OK3,836
- Wyandotte OTSA, OK1,866
Turn Oklahoma into your planning report.
Social Explorer Studio builds an editable profile of any place, with tables and charts beside the county and state, and exports to Word, PDF and Excel.
Questions about Oklahoma
What is the population of Oklahoma?
4,123,288 people, according to the ACS 2025 1-year estimates, which the Census Bureau adjusts to match its own population estimate. That’s the 28th largest of the 50 states and DC.
What is the FIPS code for Oklahoma?
40. Every county’s and place’s FIPS code in Oklahoma starts with it. The Census Bureau’s full geographic identifier (GEOID) is 0400000US40.
What is the largest city in Oklahoma?
Oklahoma City, with 719,911 people. Other large cities here include Tulsa, Norman and Broken Arrow.
What is the median household income in Oklahoma?
$68,441 (±$911), according to the ACS 2025 1-year estimates, lower than the US ($84,780).
What is the median age in Oklahoma?
37.8 years (±0.2), according to the ACS 2025 1-year estimates, lower than the US (39.5).
How much does housing cost in Oklahoma?
Oklahoma’s median home value is $234,000 (±$2,384) and its median gross rent is $1,107 (±$11) a month, according to the ACS 2025 1-year estimates. 41.3% (±1.3%) of its renters pay 30% or more of their income on rent.
Is Oklahoma growing?
Oklahoma’s population grew 5.4%, from 3,911,338 in 2015 to 4,123,288 in 2025, according to the ACS 1-year estimates.
Where do people who work in Oklahoma live?
1,588,269 of its 1,640,586 jobs are held by people who live here. Of those who commute in, the most come from Texas, Arkansas, Kansas.
Where does this census data come from?
The U.S. Census Bureau’s American Community Survey, through Social Explorer’s tables: the latest 1-year estimates where they exist, for the most recent numbers, and 5-year estimates otherwise. Each table lists its code, so you can find it again.
Is this data free to use?
Yes. You can read it, cite it, download the CSV and embed the charts, with no account. To map other variables, compare your own areas or build a report, see Social Explorer’s plans in a live demo.
Sources and how to cite
American Community Survey 2025 1-year estimates, or 2020–2024 5-year estimates where noted, U.S. Census Bureau, from Social Explorer’s tables A00001, A00002, A01004, A04001, A06001, A08001, A09005, A10001, A10003, A10008, A10030, A10036, A10040, A10047, A10055, A10060, A12001, A13004, A14006, A14024, A14028, A16002, A17005, A18002, A18009, A20001, B02002, B09001, B13002, B18101, C16001. Maps by census tract use 2020–2024 5-year estimates, since the 1-year survey doesn’t cover tracts. Commuting: LEHD LODES 2023. These are estimates from a sample, each with its margin of error. Data retrieved November 14, 2026. How these profiles are made.
U.S. Census Bureau, American Community Survey 2025 1-year estimates, or 2020–2024 5-year estimates where noted, via Social Explorer. “Oklahoma.” https://www.socialexplorer.com/places/oklahoma. Accessed November 14, 2026.