

Kansas: Population, demographics and census data
Home to 2,977,222 people, the 34th largest of the 50 states and DC, anchored by Wichita and Overland Park. It grew 2.3% between 2015 and 2025.
- Population
- 2.98M. Census Bureau estimate · Rank 34 of the 50 states and DC
- Median household income
- $77,824 ±$1,333. US $84,780
- Median age
- 38.4 ±0.3. US 39.5
ACS 2025 1-year estimates, U.S. Census Bureau
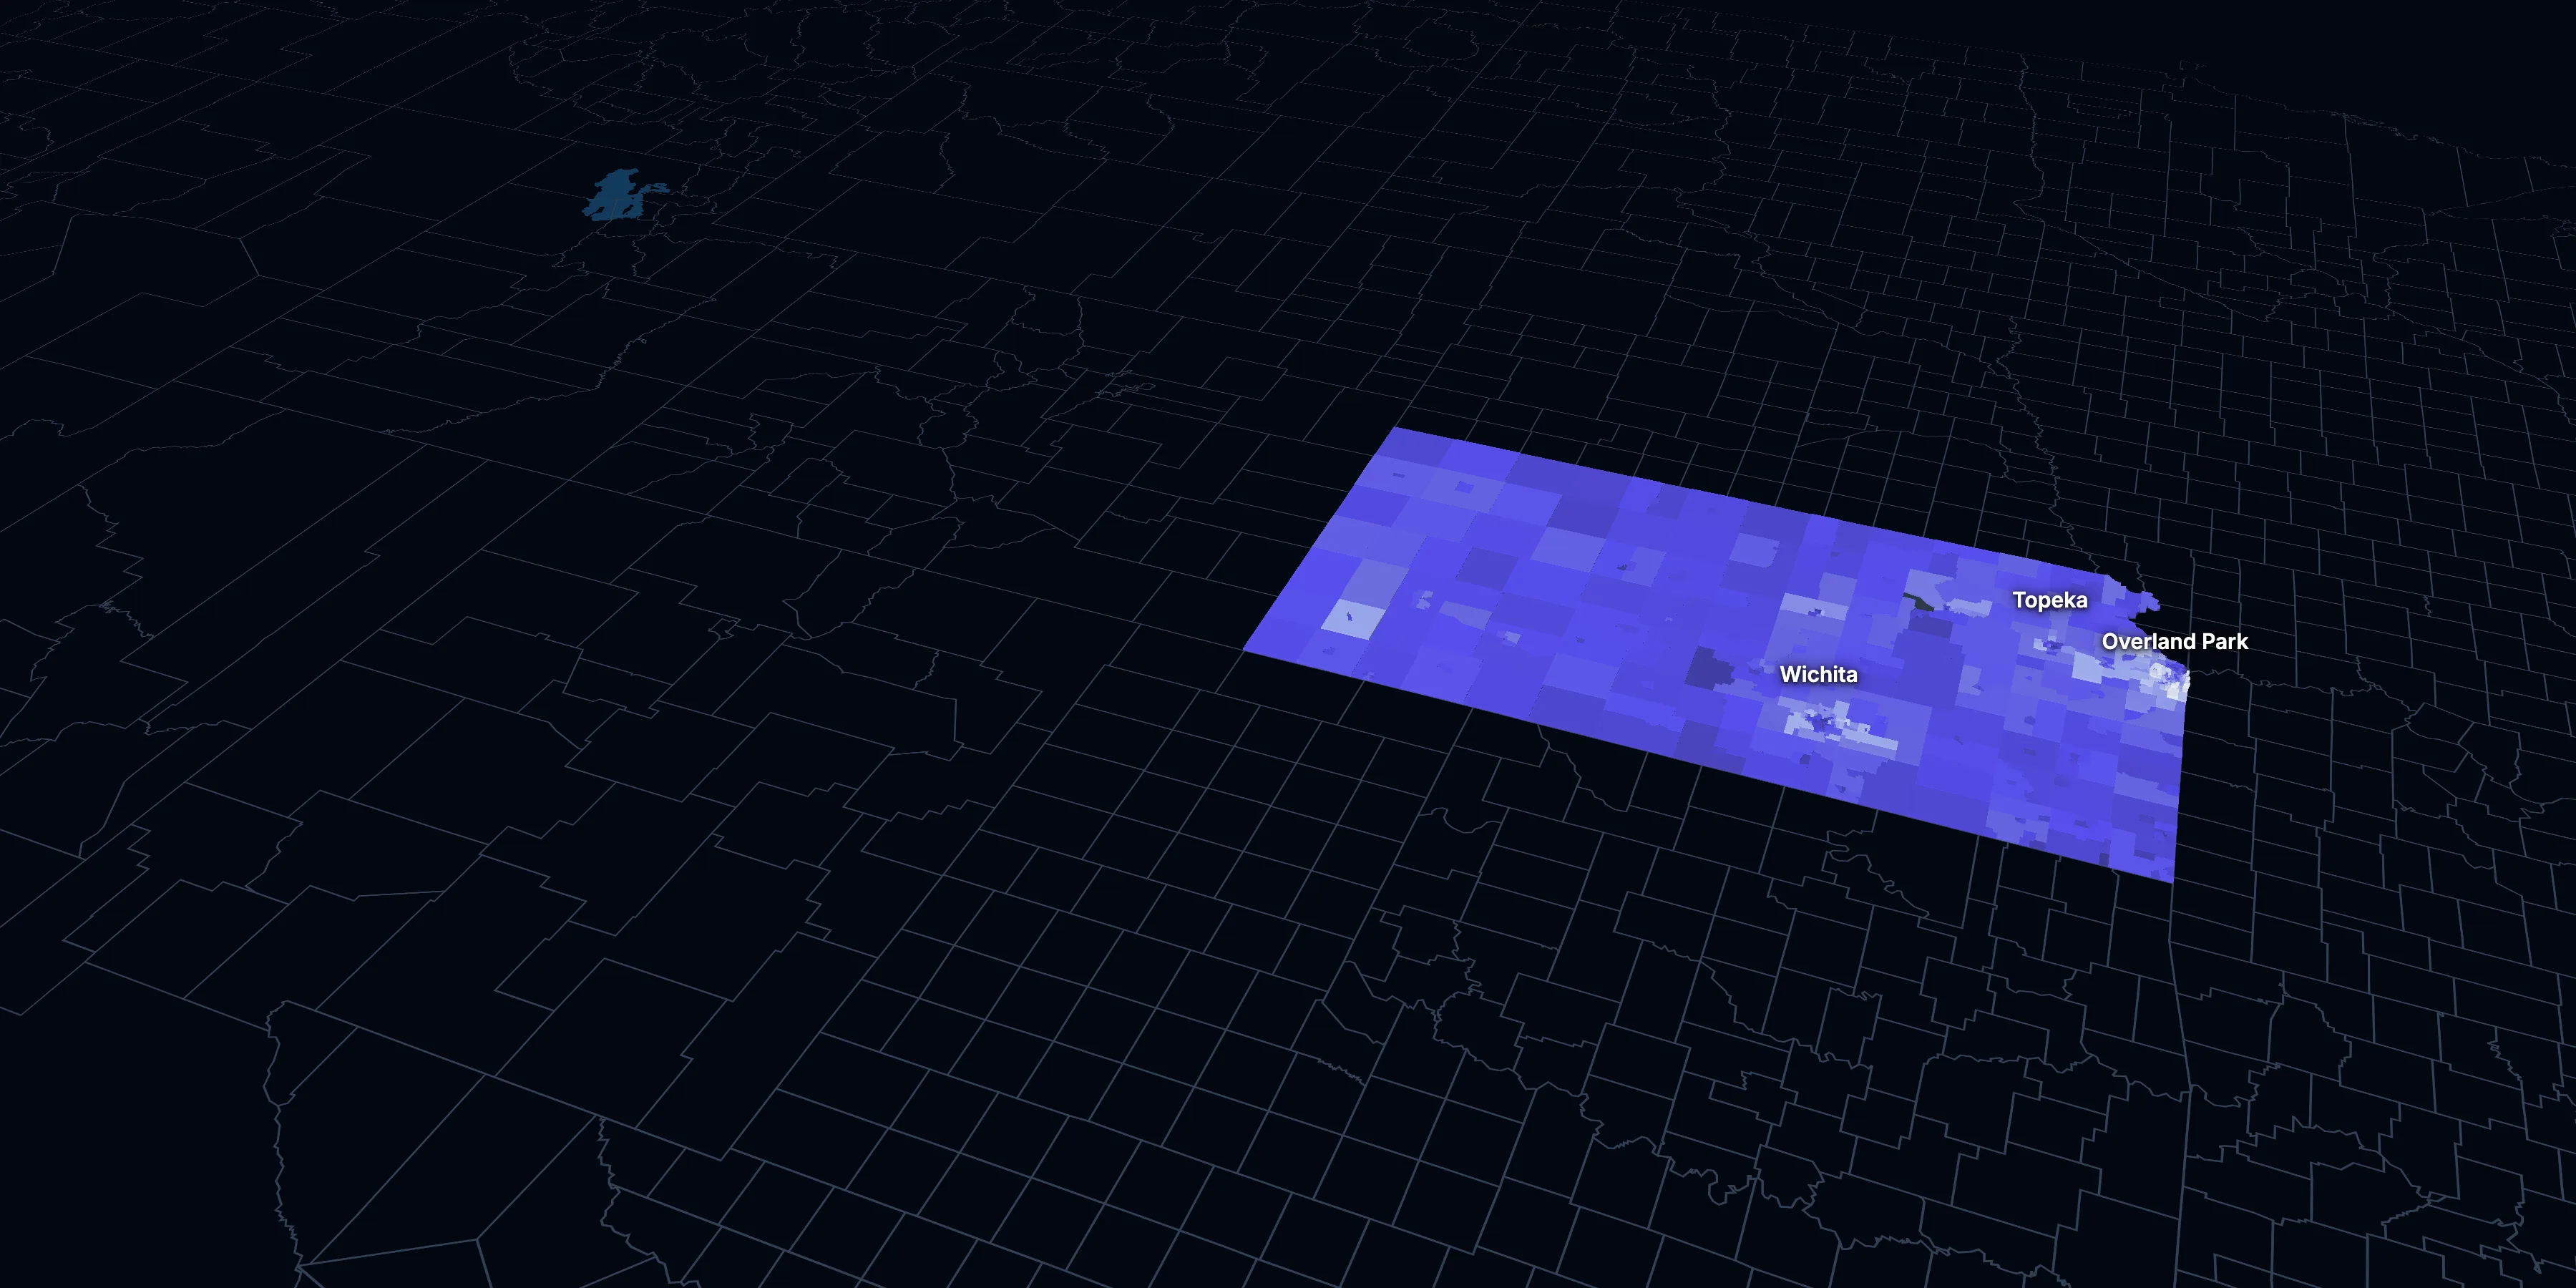
Taller, lighter tracts have higher household incomes
About Kansas
Kansas’s median household income is $77,824 (±$1,333), lower than the US ($84,780), and its median age is 38.4 (±0.3), according to the ACS 2025 1-year estimates. Its largest city is Wichita.
± is each figure’s margin of error, at 90% confidence, and † marks one too uncertain to lean on. Under each percentage in the tables is the number it counts. How the margins are worked out.
FIPS code 20
Highlights
What stands out in Kansas
The numbers where Kansas sits furthest from the nation, or past a recognized policy benchmark.
Past a policy benchmark
29.4%
ElevatedHomes built before 1960
That’s higher than the US (24.0%). Older homes carry more lead-paint risk: the EPA found lead paint in 69% of homes built from 1940 to 1959.
Furthest from the national picture
23.2%
Lower than the USCommute 30 minutes or more
That’s lower than the US (39.2%).
$1,134
Lower than the USMedian gross rent
That’s lower than the US ($1,557).
12.9%
Lower than the USSpeak a language other than English at home
That’s lower than the US (22.9%).
8.3%
Lower than the USBorn outside the US
That’s lower than the US (14.7%).
22.7%
Higher than the USUnder 18
That’s higher than the US (21.0%).
2015 to 2025
How Kansas changed in ten years
The state added 65,581 people. It got older, more foreign-born and better educated, and poverty fell 2.8 points.
Population, change since 2015
+2.3% in the state and +6.3% in the US.
Source: ACS 1-year, 2015 to 2025, table A00001.
Show data
| Kansas | United States | |
|---|---|---|
| 2015 | 0.0% | 0.0% |
| 2016 | −0.1% | +0.5% |
| 2017 | +0.1% | +1.3% |
| 2018 | −0.0% | +1.8% |
| 2019 | +0.1% | +2.1% |
| 2021 | +0.8% | +3.3% |
| 2022 | +0.9% | +3.7% |
| 2023 | +1.0% | +4.2% |
| 2024 | +2.0% | +5.8% |
| 2025 | +2.3% | +6.3% |
Embed
Median household income, in 2025 dollars
+5.4% in the state and +10.9% in the US.
Source: ACS 1-year, 2015 to 2025, table A14006.
Show data
| Kansas | United States | |
|---|---|---|
| 2015 | $73,852 | $76,413 |
| 2016 | $74,304 | $77,931 |
| 2017 | $74,708 | $79,891 |
| 2018 | $75,252 | $80,059 |
| 2019 | $78,825 | $83,427 |
| 2021 | $76,820 | $83,521 |
| 2022 | $76,353 | $82,811 |
| 2023 | $74,826 | $82,683 |
| 2024 | $78,045 | $84,339 |
| 2025 | $77,824 | $84,780 |
Embed
Living in poverty
−2.8 points in the state and −3.0 points in the US.
Source: ACS 1-year, 2015 to 2025, table A13004.
Show data
| Kansas | United States | |
|---|---|---|
| 2015 | 13.0% | 14.7% |
| 2016 | 12.1% | 14.0% |
| 2017 | 11.9% | 13.4% |
| 2018 | 12.0% | 13.1% |
| 2019 | 11.4% | 12.3% |
| 2021 | 11.7% | 12.8% |
| 2022 | 12.0% | 12.6% |
| 2023 | 11.2% | 12.5% |
| 2024 | 10.9% | 12.1% |
| 2025 | 10.2% | 11.8% |
Embed
Bachelor’s degree or more
+4.9 points in the state and +6.7 points in the US.
Source: ACS 1-year, 2015 to 2025, table A12001.
Show data
| Kansas | United States | |
|---|---|---|
| 2015 | 31.7% | 30.6% |
| 2016 | 32.8% | 31.3% |
| 2017 | 33.7% | 32.0% |
| 2018 | 33.8% | 32.6% |
| 2019 | 34.0% | 33.1% |
| 2021 | 35.4% | 35.0% |
| 2022 | 35.6% | 35.7% |
| 2023 | 35.8% | 36.2% |
| 2024 | 36.0% | 36.8% |
| 2025 | 36.7% | 37.4% |
Embed
Median gross rent, in 2025 dollars
+5.9% in the state and +18.5% in the US.
Source: ACS 1-year, 2015 to 2025, table A18009.
Show data
| Kansas | United States | |
|---|---|---|
| 2015 | $1,071 | $1,314 |
| 2016 | $1,067 | $1,327 |
| 2017 | $1,079 | $1,340 |
| 2018 | $1,086 | $1,368 |
| 2019 | $1,094 | $1,393 |
| 2021 | $1,083 | $1,427 |
| 2022 | $1,080 | $1,440 |
| 2023 | $1,102 | $1,496 |
| 2024 | $1,115 | $1,537 |
| 2025 | $1,134 | $1,557 |
Embed
Median home value, in 2025 dollars
+30.6% in the state and +39.3% in the US.
Source: ACS 1-year, 2015 to 2025, table A10036.
Show data
| Kansas | United States | |
|---|---|---|
| 2015 | $193,447 | $266,469 |
| 2016 | $195,988 | $277,278 |
| 2017 | $199,409 | $288,124 |
| 2018 | $206,039 | $296,908 |
| 2019 | $207,197 | $305,336 |
| 2021 | $220,191 | $337,116 |
| 2022 | $228,864 | $355,481 |
| 2023 | $233,840 | $361,931 |
| 2024 | $246,700 | $372,685 |
| 2025 | $252,600 | $371,100 |
Embed
ACS 1-year estimates. The dotted stretch of each line spans 2020, when the Census Bureau released no standard 1-year estimates. Dollar values are in 2025 dollars.
| Indicator | 2015 | 2025 | Change |
|---|---|---|---|
| Population | 2,911,641 | 2,977,222 | +2.3% |
| Median age | 36.2 | 38.4 | +2.2 years |
| 65 and over | 14.6% | 18.9% | +4.3 points |
| Born outside the US | 7.1% | 8.3% | +1.2 points |
| Hispanic or Latino | 11.6% | 14.4% | +2.9 points |
| Median household income | $73,852 | $77,824 | +5.4% |
| Living in poverty | 13.0% | 10.2% | −2.8 points |
| Bachelor’s degree or more | 31.7% | 36.7% | +4.9 points |
| Households that rent | 33.6% | 32.5% | −1.1 points |
| Median gross rent | $1,071 | $1,134 | +5.9% |
| Median home value | $193,447 | $252,600 | +30.6% |
829 census tracts
Kansas, tract by tract
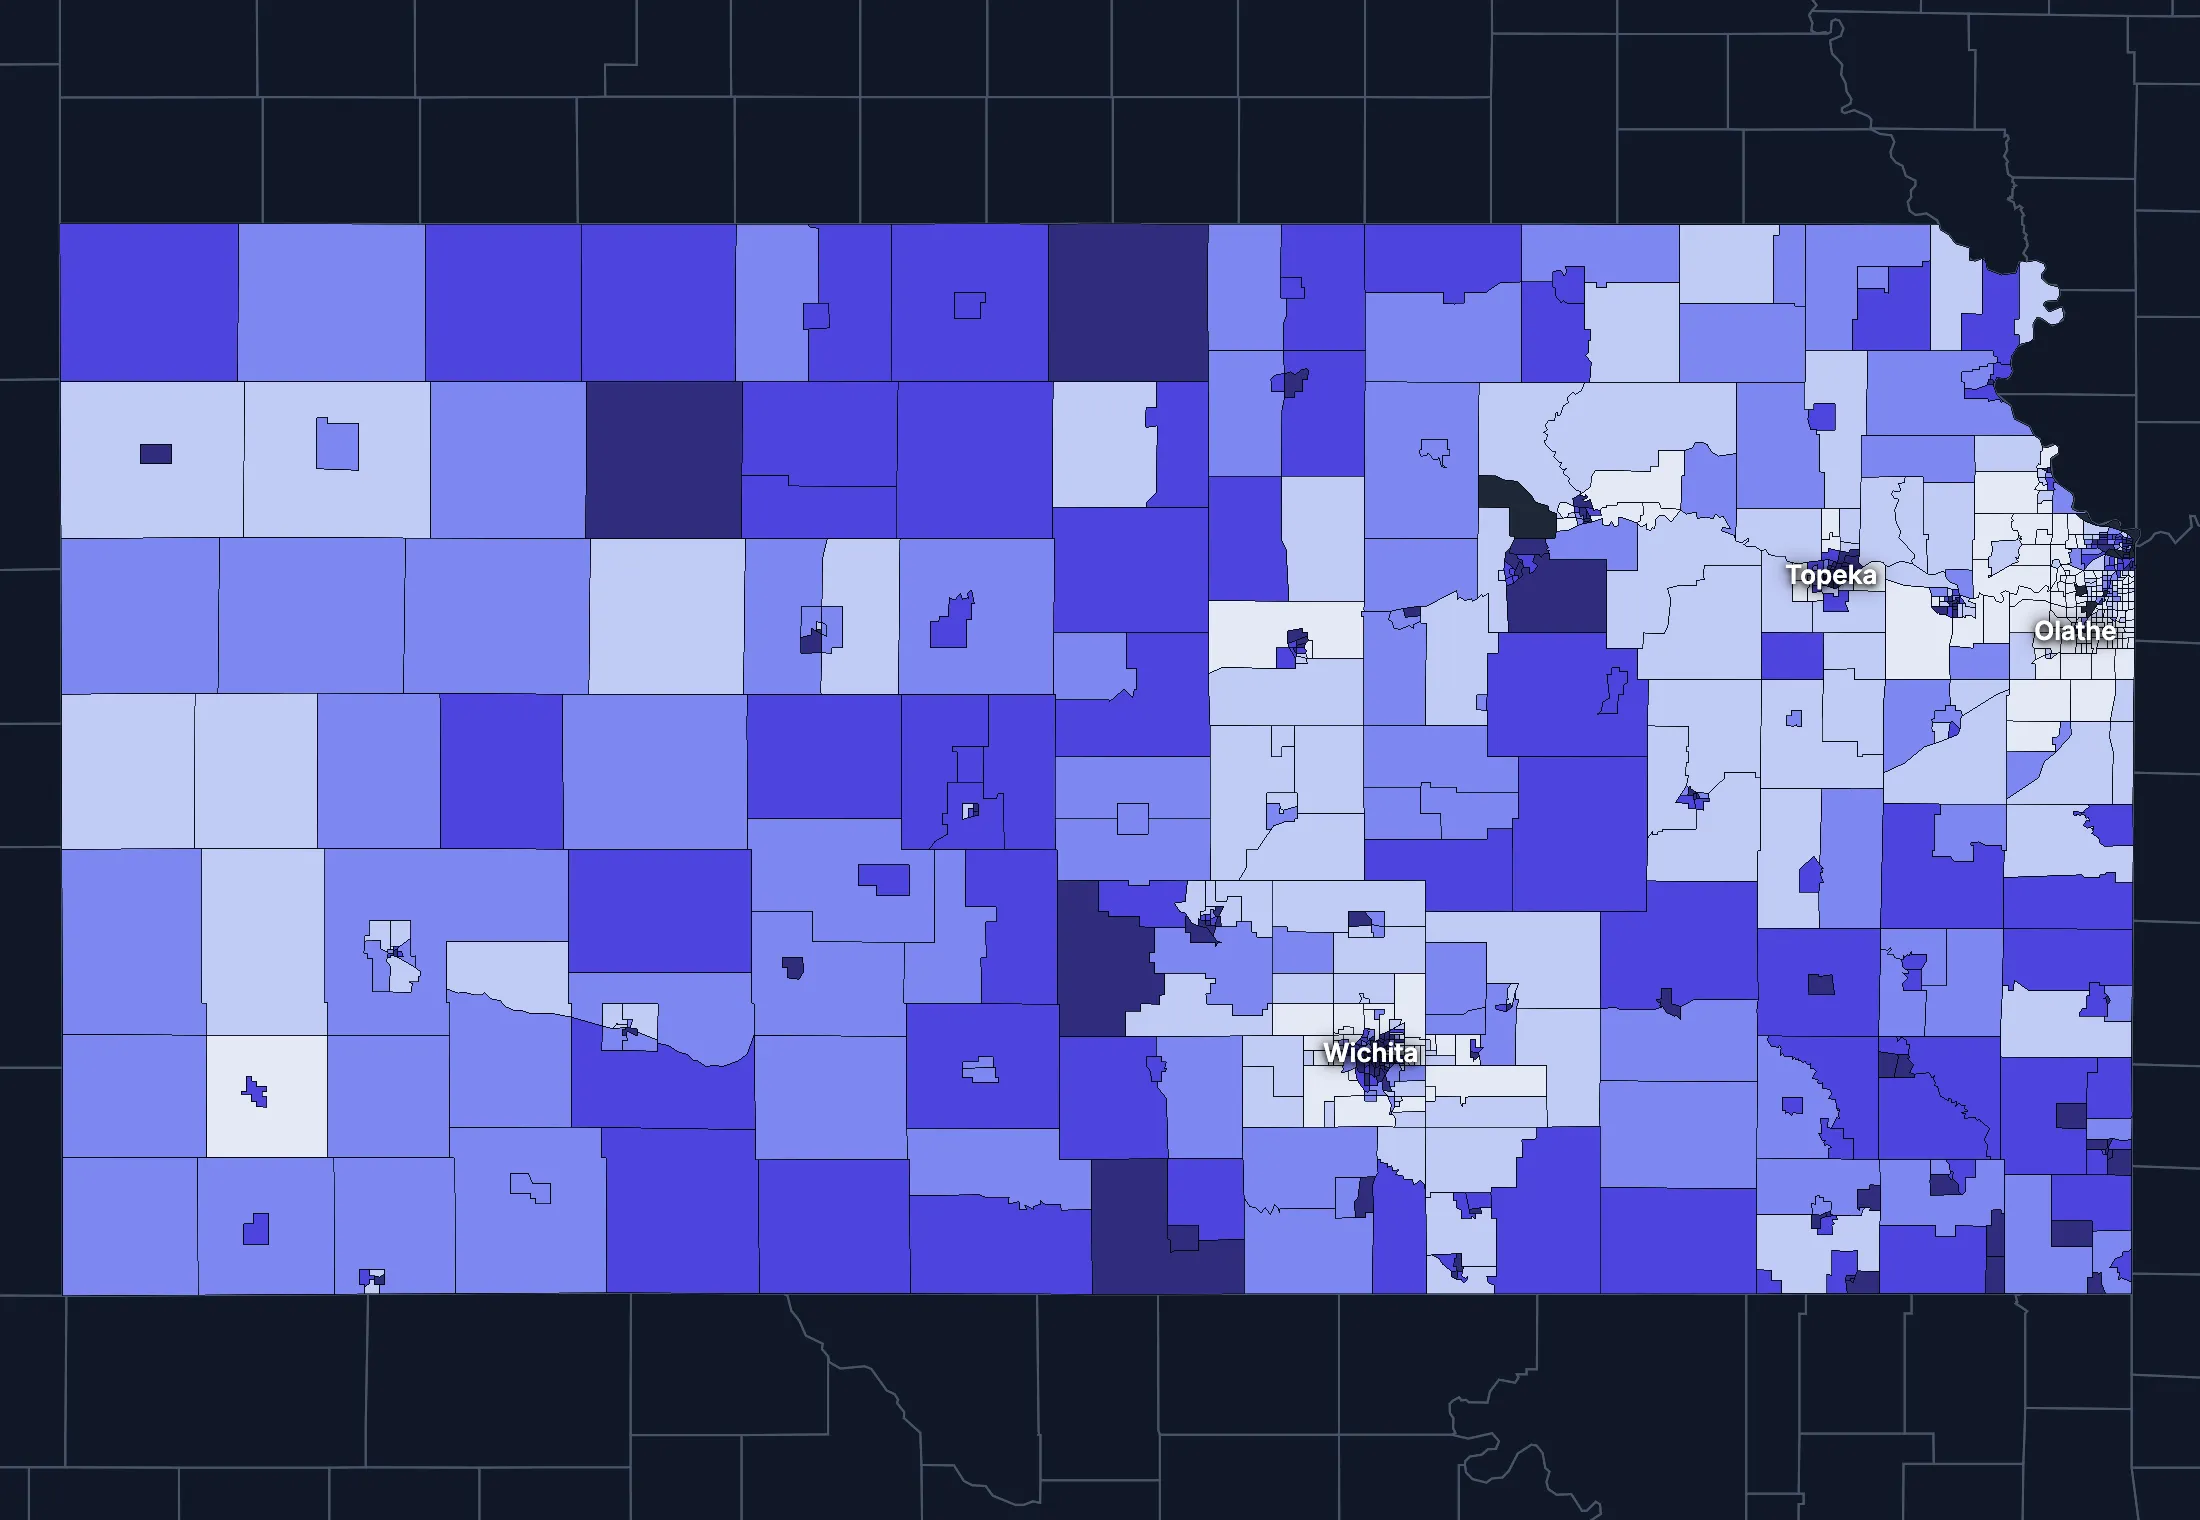
State averages hide a lot. These census tracts are the closest the census comes to neighborhoods.
Where the state’s average misleads
Each tick is one census tract, and the dark line marks the state. Hover over a tick or tap it to see the tract.
Poverty
183 of 816 tracts are at least 1.5 times the state’s overall 11.3%, and 231 are at two-thirds of it or less.
Highest: Tract 4, 71.4%. Lowest: Tract 209.01, 0.0%.
Renters paying 30% or more of income
61 of 789 tracts are at least 1.5 times the state’s overall 40.4%, and 191 are at two-thirds of it or less.
Highest: Tract 516, 100.0%. Lowest: Tract 201.01, 0.0%.
Adults with a bachelor’s degree
130 of 815 tracts are at least 1.5 times the state’s overall 35.6%, and 290 are at two-thirds of it or less.
Highest: Tract 508, 87.5%. Lowest: Tract 65, 0.9%.
Median household income
130 of 814 tracts are at least 1.5 times the typical tract’s $69,764, and 89 are at two-thirds of it or less.
Highest: Tract 508, $250,000 or more. Lowest: Tract 4, $13,625.
American Community Survey 2020–2024 5-year estimates, by census tract. Income is capped at $250,000+ by the Census Bureau.
People
Who lives in Kansas
Its median age of 38.4 is lower than the US (39.5). 8.3% of residents were born outside the US, and 12.9% speak a language other than English at home.
Age
Source: ACS 2025 1-year, table A01001.
Show data
| Kansas | United States | |
|---|---|---|
| Under 18 | 22.7% ±0.4% , number 674,402 ±10,660 | 21.0% ±<0.1% , number 71,689,151 ±111,800 |
| 18 to 24 | 10.0% ±0.3% , number 298,277 ±9,096 | 9.3% ±<0.1% , number 31,716,680 ±98,660 |
| 25 to 34 | 12.7% ±0.2% , number 379,226 ±6,145 | 13.6% ±<0.1% , number 46,357,354 ±55,690 |
| 35 to 44 | 13.2% ±0.3% , number 393,611 ±9,100 | 13.4% ±<0.1% , number 45,746,189 ±105,700 |
| 45 to 54 | 11.0% ±0.2% , number 327,536 ±5,227 | 11.8% ±<0.1% , number 40,257,563 ±53,540 |
| 55 to 64 | 11.5% ±0.3% , number 341,094 ±7,882 | 12.1% ±<0.1% , number 41,242,904 ±104,700 |
| 65 to 74 | 10.8% ±0.3% , number 320,970 ±7,619 | 10.8% ±<0.1% , number 36,895,650 ±91,520 |
| 75 and over | 8.1% ±0.2% , number 242,106 ±5,975 | 8.2% ±<0.1% , number 27,879,368 ±78,140 |
Embed
Race and ethnicity
Source: ACS 2025 1-year, table A04001.
Show data
| Kansas | United States | |
|---|---|---|
| White, not Hispanic | 70.2% ±0.2% , number 2,089,111 ±5,094 | 55.0% ±<0.1% , number 187,959,031 ±58,340 |
| Hispanic or Latino | 14.4% ±<0.1% , number 430,107 ±702 | 20.5% ±<0.1% , number 69,975,516 ±13,270 |
| Black, not Hispanic | 5.3% ±0.2% , number 156,553 ±7,195 | 11.7% ±<0.1% , number 40,096,453 ±106,200 |
| Asian, not Hispanic | 3.1% ±0.1% , number 92,035 ±4,089 | 6.5% ±<0.1% , number 22,096,709 ±58,340 |
| Other or multiracial | 7.0% ±0.3% , number 209,416 ±9,515 | 6.3% ±<0.1% , number 21,657,150 ±150,100 |
Embed
Language spoken at home
Source: ACS 2025 1-year, table C16001.
Show data
| Kansas | United States | |
|---|---|---|
| English only | 87.1% ±0.5% , number 2,443,875 ±14,510 | 77.1% ±0.1% , number 249,390,588 ±275,300 |
| Spanish | 8.6% ±0.4% , number 241,363 ±10,010 | 13.9% ±0.1% , number 44,921,985 ±177,800 |
| Other Indo-European | 1.5% ±0.2% , number 41,296 ±5,594 | 4.0% ±<0.1% , number 12,862,980 ±113,500 |
| Asian and Pacific Island | 2.0% ±0.2% , number 56,663 ±6,150 | 3.8% ±<0.1% , number 12,288,841 ±99,740 |
| Arabic and other | 0.8% ±0.2% , number 23,062 ±6,019 | 1.3% ±<0.1% , number 4,116,949 ±71,480 |
Embed
Marital status
Source: ACS 2025 1-year, table A11001.
Show data
| Kansas | United States | |
|---|---|---|
| Now married | 51.6% ±0.6% , number 1,251,981 ±14,670 | 47.9% ±0.1% , number 135,567,564 ±223,300 |
| Never married | 30.8% ±0.5% , number 747,928 ±12,400 | 34.8% ±0.1% , number 98,647,238 ±152,600 |
| Divorced | 10.9% ±0.4% , number 265,488 ±8,808 | 10.2% ±<0.1% , number 28,879,967 ±112,900 |
| Widowed | 5.6% ±0.2% , number 135,447 ±5,434 | 5.5% ±<0.1% , number 15,599,094 ±69,430 |
| Separated | 1.0% ±0.1% , number 24,129 ±2,895 | 1.6% ±<0.1% , number 4,441,399 ±49,160 |
Embed
Where people lived a year ago
Source: ACS 2025 1-year, table A08001.
Show data
| Kansas | United States | |
|---|---|---|
| Same home | 86.5% ±0.5% , number 2,548,651 ±16,320 | 88.4% ±0.1% , number 298,889,697 ±214,800 |
| Same county | 6.2% ±0.4% , number 183,974 ±12,490 | 6.0% ±<0.1% , number 20,202,671 ±166,300 |
| Another county in the state | 3.5% ±0.3% , number 102,317 ±8,998 | 3.0% ±<0.1% , number 10,168,097 ±89,190 |
| Another state | 3.2% ±0.3% , number 95,337 ±8,019 | 2.1% ±<0.1% , number 7,025,589 ±81,660 |
| Another country | 0.5% ±0.1% , number 14,531 ±3,753 | 0.6% ±<0.1% , number 1,984,943 ±47,210 |
Embed
Top countries of birth, among those born abroad
Source: ACS 2020–2024 5-year, table A07001.
Show data
| Kansas | |
|---|---|
| Mexico | 39.1% , number 84,719 |
| India | 6.4% , number 13,810 |
| Vietnam | 5.1% , number 10,999 |
| Guatemala | 3.6% , number 7,807 |
| China, Excluding Hong Kong and Taiwan | 3.3% , number 7,123 |
| Philippines | 2.8% , number 6,138 |
Embed
All the numbers
| Indicator | Kansas | US | Rank among states* | Table |
|---|---|---|---|---|
| Population | 2,977,222 | 341,784,859 | 34th | A00001 |
| People per square mile | 36 | 97 | 42nd | A00002 |
| Land area (square miles) | 81,759 | – | – | A00002 |
| Median age | 38.4 ±0.3 | 39.5 ±0.1 | 43rd | A01004 |
| Under 18 | 22.7% ±0.4% , number 674,402 ±10,660 | 21.0% ±<0.1% , number 71,689,151 ±111,800 | 8th | B02002 |
| 65 and over | 18.9% ±0.3% , number 563,076 ±9,682 | 19.0% ±<0.1% , number 64,775,018 ±120,300 | 36th | B02002 |
| Born outside the US | 8.3% ±0.4% , number 246,911 ±10,610 | 14.7% ±0.1% , number 50,409,320 ±204,800 | 28th | A06001 |
| Speak a language other than English at home | 12.9% ±0.5% , number 362,384 ±14,340 | 22.9% ±0.1% , number 74,190,755 ±244,000 | 28th | C16001 |
| Veterans (adults) | 6.3% ±0.2% , number 143,511 ±5,692 | 5.9% ±<0.1% , number 15,746,228 ±85,320 | 30th | A16002 |
| Living with a disability | 14.0% ±0.3% , number 408,765 ±10,150 | 13.7% ±<0.1% , number 46,271,455 ±126,000 | 30th | B18101 |
| Women 15–50 who had a baby in the past year | 5.8% ±0.6% , number 39,769 ±3,883 | 5.0% ±0.1% , number 4,016,759 ±44,040 | 4th | B13002 |
| Lived in the same home a year ago | 86.5% ±0.5% , number 2,548,651 ±16,320 | 88.4% ±0.1% , number 298,889,697 ±214,800 | 42nd | A08001 |
| White, not Hispanic | 70.2% ±0.2% , number 2,089,111 ±5,094 | 55.0% ±<0.1% , number 187,959,031 ±58,340 | 20th | A04001 |
| Hispanic or Latino | 14.4% ±<0.1% , number 430,107 ±702 | 20.5% ±<0.1% , number 69,975,516 ±13,270 | 17th | A04001 |
| Black, not Hispanic | 5.3% ±0.2% , number 156,553 ±7,195 | 11.7% ±<0.1% , number 40,096,453 ±106,200 | 31st | A04001 |
| Asian, not Hispanic | 3.1% ±0.1% , number 92,035 ±4,089 | 6.5% ±<0.1% , number 22,096,709 ±58,340 | 26th | A04001 |
*1 is the highest. Population is ranked among all states, and the rest among those of 1,000 people or more, whose figures can be ranked. Ranks use 5-year estimates, the only ones covering every state, so they can differ slightly from the figures here.
Income and work
Lower incomes than the US
The median household income is $77,824, lower than the US ($84,780). 10.2% of people live in poverty, and 9.7% have no health insurance, higher than the US (8.4%).
Household income
Source: ACS 2025 1-year, table A14001.
Show data
| Kansas | United States | |
|---|---|---|
| Under $25,000 | 12.8% ±0.6% , number 154,758 ±7,040 | 14.0% ±0.1% , number 18,727,548 ±88,990 |
| $25,000 to $49,999 | 18.0% ±0.6% , number 216,616 ±7,785 | 15.4% ±0.1% , number 20,665,585 ±101,400 |
| $50,000 to $74,999 | 17.2% ±0.7% , number 207,515 ±8,827 | 15.3% ±0.1% , number 20,513,565 ±88,500 |
| $75,000 to $99,999 | 14.0% ±0.6% , number 168,974 ±7,035 | 12.5% ±0.1% , number 16,814,245 ±87,520 |
| $100,000 to $149,999 | 18.6% ±0.7% , number 224,799 ±8,476 | 17.9% ±0.1% , number 24,018,984 ±99,670 |
| $150,000 to $199,999 | 8.2% ±0.5% , number 99,331 ±5,560 | 10.1% ±0.1% , number 13,521,827 ±70,660 |
| $200,000 or more | 11.1% ±0.4% , number 133,645 ±5,344 | 14.8% ±0.1% , number 19,801,668 ±84,120 |
Embed
What residents do for work
Source: ACS 2025 1-year, table A17004.
Show data
| Kansas | United States | |
|---|---|---|
| Education and health care | 24.1% ±0.6% , number 360,123 ±10,110 | 24.4% ±0.1% , number 40,862,193 ±140,800 |
| Manufacturing | 12.5% ±0.5% , number 187,079 ±7,409 | 9.6% ±0.1% , number 16,064,394 ±91,270 |
| Retail trade | 11.1% ±0.5% , number 165,351 ±7,928 | 10.6% ±0.1% , number 17,781,181 ±96,660 |
| Professional and business services | 9.9% ±0.4% , number 147,882 ±6,775 | 12.8% ±0.1% , number 21,375,231 ±87,110 |
| Arts, food and lodging | 8.0% ±0.5% , number 120,141 ±7,509 | 8.9% ±0.1% , number 14,811,502 ±87,840 |
| Construction | 6.9% ±0.4% , number 103,719 ±6,549 | 6.7% ±<0.1% , number 11,254,981 ±79,620 |
| Finance, insurance and real estate | 6.4% ±0.4% , number 96,026 ±5,309 | 6.6% ±<0.1% , number 11,025,569 ±68,570 |
| Transportation and warehousing | 5.2% ±0.3% , number 77,923 ±4,807 | 5.9% ±<0.1% , number 9,832,211 ±73,020 |
Embed
Where workers come from and go
Kansas has 1,408,766 jobs and 1,376,301 employed residents. 160,556 people commute in to work and 128,091 commute out, while 1,248,210 both live and work here. The most commuters come from Missouri.
Most commuters come from
- Missouri: 128,316
- Oklahoma: 11,023
- Nebraska: 4,299
Most residents commute to
- Missouri: 101,361
- Oklahoma: 7,222
- Nebraska: 4,475
Show data
| Kansas | |
|---|---|
| Live and work here | 1,248,210 |
| Work here, live elsewhere | 160,556 |
| Live here, work elsewhere | 128,091 |
Embed
All the numbers
| Indicator | Kansas | US | Rank among states* | Table |
|---|---|---|---|---|
| Median household income | $77,824 ±$1,333 | $84,780 ±$215 | 35th | A14006 |
| Income per person | $42,887 ±$695 | $47,171 ±$115 | 31st | A14024 |
| Income inequality (Gini index) | 0.454 ±0.006 | 0.482 ±0.001 | 34th | A14028 |
| Living in poverty | 10.2% ±0.5% , number 294,734 ±15,220 | 11.8% ±0.1% , number 39,264,183 ±277,400 | 29th | A13004 |
| Unemployment rate | 3.5% ±0.3% , number 54,837 ±4,744 | 4.9% ±<0.1% , number 8,574,594 ±64,350 | 39th | A17005 |
| No health insurance | 9.7% ±0.4% , number 281,575 ±12,870 | 8.4% ±<0.1% , number 28,323,306 ±152,000 | 18th | A20001 |
*1 is the highest. Population is ranked among all states, and the rest among those of 1,000 people or more, whose figures can be ranked. Ranks use 5-year estimates, the only ones covering every state, so they can differ slightly from the figures here.
Education
College degrees close to the US
36.7% of adults 25 and over have a bachelor’s degree or more, about the same as the US (37.4%).
Highest level of education
Source: ACS 2025 1-year, table A12001.
Show data
| Kansas | United States | |
|---|---|---|
| Less than high school | 7.3% ±0.4% , number 146,907 ±8,584 | 9.4% ±0.1% , number 22,321,002 ±120,500 |
| High school only | 25.2% ±0.6% , number 504,211 ±12,710 | 25.6% ±0.1% , number 61,096,726 ±203,400 |
| Some college | 30.8% ±0.7% , number 618,349 ±13,620 | 27.7% ±0.1% , number 65,920,977 ±173,500 |
| Bachelor’s degree | 22.9% ±0.6% , number 458,288 ±11,130 | 22.3% ±0.1% , number 53,224,312 ±196,700 |
| Graduate degree | 13.8% ±0.5% , number 276,788 ±9,967 | 15.0% ±0.1% , number 35,816,011 ±159,400 |
Embed
All the numbers
| Indicator | Kansas | US | Rank among states* | Table |
|---|---|---|---|---|
| Bachelor’s degree or more | 36.7% ±0.7% , number 735,076 ±14,940 | 37.4% ±0.1% , number 89,040,323 ±253,200 | 22nd | A12001 |
| High school graduate or more | 92.7% ±1.2% , number 1,857,636 ±23,880 | 90.6% ±0.2% , number 216,058,026 ±368,200 | 20th | A12001 |
*1 is the highest. Population is ranked among all states, and the rest among those of 1,000 people or more, whose figures can be ranked. Ranks use 5-year estimates, the only ones covering every state, so they can differ slightly from the figures here.
Housing
Home values outran incomes
32.5% of households rent, lower than the US (34.7%). The median home is worth $252,600 and the median rent is $1,134. After inflation, home values rose 31% from 2015 to 2025, while household income rose 5%.
Housing costs and income, 2015 to 2025, after inflation
Source: ACS 1-year, table A10036, A18009, A14006.
Show data
| Kansas | United States | |
|---|---|---|
| Median home value | +30.6% | +39.3% |
| Median rent | +5.9% | +18.5% |
| Median household income | +5.4% | +10.9% |
Embed
Types of homes
Source: ACS 2025 1-year, table A10032.
Show data
| Kansas | United States | |
|---|---|---|
| Single-family, detached | 71.6% ±0.7% , number 943,115 ±8,989 | 60.9% ±0.1% , number 90,335,844 ±173,300 |
| Single-family, attached | 5.5% ±0.4% , number 72,541 ±4,938 | 6.4% ±<0.1% , number 9,527,703 ±51,230 |
| 2 to 4 units | 5.8% ±0.4% , number 76,497 ±5,671 | 7.5% ±0.1% , number 11,109,005 ±75,790 |
| 5 to 19 units | 7.5% ±0.5% , number 99,173 ±6,630 | 8.7% ±0.1% , number 12,829,882 ±97,590 |
| 20 or more units | 5.7% ±0.5% , number 74,959 ±6,259 | 11.1% ±0.1% , number 16,381,450 ±92,310 |
| Mobile homes and other | 3.9% ±0.3% , number 51,815 ±3,955 | 5.4% ±<0.1% , number 8,045,083 ±53,680 |
Embed
When homes were built
Source: ACS 2025 1-year, table A10055.
Show data
| Kansas | United States | |
|---|---|---|
| 2010 or later | 12.0% ±0.6% , number 145,264 ±7,098 | 15.1% ±0.1% , number 20,257,912 ±101,300 |
| 2000 to 2009 | 12.2% ±0.5% , number 147,330 ±6,579 | 13.8% ±0.1% , number 18,535,840 ±92,260 |
| 1980 to 1999 | 23.5% ±0.8% , number 283,691 ±9,512 | 24.1% ±0.1% , number 32,332,570 ±118,900 |
| 1960 to 1979 | 22.8% ±0.7% , number 275,021 ±8,917 | 22.9% ±0.1% , number 30,726,302 ±110,000 |
| Before 1960 | 29.4% ±0.8% , number 354,332 ±9,631 | 24.0% ±0.1% , number 32,210,798 ±121,500 |
Embed
All the numbers
| Indicator | Kansas | US | Rank among states* | Table |
|---|---|---|---|---|
| Housing units | 1,318,100 | – | – | A10001 |
| Households | 1,205,638 ±6,563 | – | – | A10008 |
| People per household | 2.40 ±0.01 | 2.49 ±0.01 | 27th | A10003 |
| Households that rent | 32.5% ±0.8% , number 391,639 ±9,435 | 34.7% ±0.1% , number 46,551,688 ±193,200 | 23rd | A10060 |
| Vacant homes | 8.5% ±0.5% , number 112,462 ±6,759 | 9.6% ±0.1% , number 14,165,545 ±137,100 | 34th | A10047, A10060 |
| Median gross rent | $1,134 ±$15 | $1,557 ±$4 | 39th | A18009 |
| Median home value | $252,600 ±$4,302 | $371,100 ±$646 | 42nd | A10036 |
| Renters paying 30% or more of income | 40.1% ±1.9% , number 157,016 ±8,314 | 48.3% ±0.2% , number 22,486,693 ±122,100 | 45th | A18002 |
| Owners paying 30% or more of income | 19.6% ±0.8% , number 159,839 ±6,813 | 24.2% ±0.1% , number 21,201,943 ±93,050 | 46th | A10040 |
| Homes built before 1960 | 29.4% ±0.8% , number 354,332 ±9,631 | 24.0% ±0.1% , number 32,210,798 ±121,500 | 16th | A10055 |
*1 is the highest. Population is ranked among all states, and the rest among those of 1,000 people or more, whose figures can be ranked. Ranks use 5-year estimates, the only ones covering every state, so they can differ slightly from the figures here.
Getting around
A driving state with short commutes
76.5% of workers drive alone and 10.2% work from home. 23.2% of those who travel to work spend 30 minutes or more getting there, and 5.1% of households have no vehicle.
How people get to work
Source: ACS 2025 1-year, table A09005.
Show data
| Kansas | United States | |
|---|---|---|
| Drive alone | 76.5% ±0.8% , number 1,139,786 ±15,330 | 69.8% ±0.1% , number 115,297,377 ±192,900 |
| Carpool | 9.2% ±0.6% , number 137,362 ±8,450 | 8.9% ±0.1% , number 14,712,170 ±97,240 |
| Public transit | 0.7% ±0.1% , number 11,082 ±2,132 | 4.3% ±<0.1% , number 7,100,386 ±63,330 |
| Walk | 2.2% ±0.2% , number 33,211 ±2,935 | 2.4% ±<0.1% , number 4,016,469 ±41,070 |
| Work from home | 10.2% ±0.5% , number 152,427 ±7,403 | 12.9% ±0.1% , number 21,288,393 ±105,700 |
| Other | 1.1% ±0.2% , number 16,521 ±2,654 | 1.7% ±<0.1% , number 2,799,658 ±41,510 |
Embed
Time spent getting to work
Source: ACS 2025 1-year, table B09001.
Show data
| Kansas | United States | |
|---|---|---|
| Under 10 minutes | 21.3% ±0.8% , number 285,144 ±10,530 | 12.0% ±0.1% , number 17,199,225 ±93,440 |
| 10 to 19 minutes | 34.7% ±0.9% , number 463,811 ±13,290 | 27.8% ±0.1% , number 40,059,540 ±137,700 |
| 20 to 29 minutes | 20.8% ±0.8% , number 278,658 ±11,020 | 21.0% ±0.1% , number 30,221,743 ±111,100 |
| 30 to 39 minutes | 13.2% ±0.5% , number 176,721 ±7,551 | 17.1% ±0.1% , number 24,659,138 ±103,800 |
| 40 to 59 minutes | 5.9% ±0.4% , number 79,200 ±5,195 | 12.6% ±0.1% , number 18,104,709 ±97,070 |
| 60 minutes or more | 4.1% ±0.3% , number 54,428 ±4,664 | 9.5% ±0.1% , number 13,681,705 ±84,440 |
Embed
Vehicles per household
Source: ACS 2025 1-year, table A10030.
Show data
| Kansas | United States | |
|---|---|---|
| None | 5.1% ±0.4% , number 61,012 ±4,850 | 8.8% ±0.1% , number 11,781,997 ±77,240 |
| One | 29.8% ±0.8% , number 358,884 ±9,561 | 33.1% ±0.1% , number 44,424,682 ±160,700 |
| Two | 38.3% ±0.8% , number 461,704 ±10,070 | 36.0% ±0.1% , number 48,200,889 ±176,800 |
| Three or more | 26.9% ±0.8% , number 324,038 ±9,542 | 22.1% ±0.1% , number 29,655,854 ±113,300 |
Embed
All the numbers
| Indicator | Kansas | US | Rank among states* | Table |
|---|---|---|---|---|
| Drive to work alone | 76.5% ±0.8% , number 1,139,786 ±15,330 | 69.8% ±0.1% , number 115,297,377 ±192,900 | 15th | A09005 |
| Take public transit | 0.7% ±0.1% , number 11,082 ±2,132 | 4.3% ±<0.1% , number 7,100,386 ±63,330 | 45th | A09005 |
| Work from home | 10.2% ±0.5% , number 152,427 ±7,403 | 12.9% ±0.1% , number 21,288,393 ±105,700 | 35th | A09005 |
| Commute 30 minutes or more | 23.2% ±0.7% , number 310,349 ±10,280 | 39.2% ±0.1% , number 56,445,552 ±165,300 | 44th | B09001 |
| Households with no vehicle | 5.1% ±0.4% , number 61,012 ±4,836 | 8.8% ±<0.1% , number 11,781,997 ±64,240 | 46th | A10030 |
*1 is the highest. Population is ranked among all states, and the rest among those of 1,000 people or more, whose figures can be ranked. Ranks use 5-year estimates, the only ones covering every state, so they can differ slightly from the figures here.
Places
The largest cities in Kansas
Population, from the latest estimates available. Figures cover the whole of each place.
Largest cities
- Wichita: 400,989
- Overland Park: 203,676
- Kansas City: 158,833
- Olathe: 150,046
- Topeka: 125,796
- Lawrence: 96,375
- Shawnee: 69,841
- Lenexa: 58,384
States like this one
- Georgia: 10,940,407
- North Carolina: 10,730,404
- Nebraska: 1,978,707
- Idaho: 1,934,262
States at least a third this size, with the closest income, education, age, housing and origins.
Every county and place in Kansas
Find any county, city, town, metro area, ZIP code, school district or district in Kansas.
Counties
Each of the 105 counties with its population, from ACS 2020–2024 5-year estimates.
- Allen County12,483
- Anderson County7,834
- Atchison County16,208
- Barber County4,069
- Barton County25,097
- Bourbon County14,394
- Brown County9,343
- Butler County68,287
- Chase County2,561
- Chautauqua County3,370
- Cherokee County19,151
- Cheyenne County2,628
- Clark County1,974
- Clay County8,048
- Cloud County8,898
- Coffey County8,308
- Comanche County1,729
- Cowley County34,411
- Crawford County39,008
- Decatur County2,726
- Dickinson County18,445
- Doniphan County7,503
- Douglas County120,302
- Edwards County2,779
- Elk County2,453
- Ellis County28,920
- Ellsworth County6,360
- Finney County38,084
- Ford County34,074
- Franklin County26,106
- Geary County35,815
- Gove County2,799
- Graham County2,389
- Grant County7,229
- Gray County5,701
- Greeley County1,304
- Greenwood County5,919
- Hamilton County2,471
- Harper County5,400
- Harvey County33,756
- Haskell County3,641
- Hodgeman County1,652
- Jackson County13,341
- Jefferson County18,349
- Jewell County2,916
- Johnson County620,631
- Kearny County3,864
- Kingman County7,186
- Kiowa County2,422
- Labette County19,869
- Lane County1,461
- Leavenworth County83,123
- Lincoln County2,923
- Linn County9,767
- Logan County2,707
- Lyon County32,186
- Marion County11,754
- Marshall County9,993
- McPherson County30,205
- Meade County3,903
- Miami County34,938
- Mitchell County5,779
- Montgomery County30,940
- Morris County5,340
- Morton County2,611
- Nemaha County10,160
- Neosho County15,656
- Ness County2,653
- Norton County5,359
- Osage County15,744
- Osborne County3,452
- Ottawa County5,819
- Pawnee County6,144
- Phillips County4,813
- Pottawatomie County26,204
- Pratt County9,127
- Rawlins County2,516
- Reno County61,553
- Republic County4,646
- Rice County9,350
- Riley County71,946
- Rooks County4,813
- Rush County2,947
- Russell County6,679
- Saline County53,668
- Scott County5,027
- Sedgwick County528,226
- Seward County21,486
- Shawnee County178,025
- Sheridan County2,426
- Sherman County5,858
- Smith County3,552
- Stafford County3,978
- Stanton County2,038
- Stevens County5,162
- Sumner County22,353
- Thomas County7,885
- Trego County2,777
- Wabaunsee County7,009
- Wallace County1,417
- Washington County5,533
- Wichita County2,091
- Wilson County8,505
- Woodson County3,109
- Wyandotte County167,654
Cities, towns and other places
Each of the 721 with its population, from ACS 2020–2024 5-year estimates. Census-designated places are communities without a local government of their own, drawn by the Census Bureau so they can be counted.
- Abbyville87
- Abilene6,449
- Ada67
- Admire144
- Agenda90
- Agra244
- Albert100
- Alden87
- Alexander24
- Allen287
- Alma1,063
- Almena523
- Alta Vista443
- Altamont993
- Alton121
- Altoona467
- Americus955
- Ames21
- Andale1,062
- Andover15,965
- Anthony2,246
- Arcadia248
- Argonia542
- Arkansas City11,884
- Arlington407
- Arma1,239
- Ashland738
- Assaria521
- Atchison10,785
- Athol65
- Atlanta169
- Attica543
- Atwood1,320
- Auburn1,144
- Augusta9,216
- Aurora25
- Axtell468
- Baileyville126
- Baldwin City4,911
- Barnard97
- Barnes177
- Bartlett58
- Basehor7,491
- Bassett22
- Bavaria50
- Baxter Springs3,855
- Bazine406
- Beattie185
- Beaumont38
- Bel Aire9,043
- Belle Plaine1,449
- Belleville2,086
- Beloit3,029
- Belpre36
- Belvue175
- Bendena140
- Benedict61
- Bennington651
- Bentley480
- Benton927
- Bern136
- Beverly132
- Big Bow86
- Bird City633
- Bison141
- Blue Mound234
- Blue Rapids870
- Bluff City36
- Bogue175
- Bonner Springs7,839
- Bremen192
- Brewster459
- Bridgeport29
- Bronson537
- Brookville191
- Brownell14
- Bucklin652
- Bucyrus168
- Buffalo282
- Buhler1,525
- Bunker Hill108
- Burden554
- Burdett329
- Burdick34
- Burlingame1,046
- Burlington2,605
- Burns297
- Burr Oak114
- Burrton808
- Bushong46
- Bushton201
- Byers11
- Caldwell976
- Cambridge69
- Caney1,431
- Canton706
- Carbondale1,341
- Carlton27
- Cassoday154
- Catharine186
- Cawker City352
- Cedar Point8
- Cedar Vale529
- Centralia501
- Chanute8,598
- Chapman1,454
- Chase490
- Chautauqua91
- Cheney2,580
- Cherokee699
- Cherryvale2,096
- Chetopa977
- Chicopee412
- Cimarron1,949
- Circleville179
- Claflin455
- Clay Center4,132
- Clayton33
- Clearwater2,716
- Clifton442
- Climax46
- Clyde791
- Coats109
- Codell47
- Coffeyville8,662
- Colby5,387
- Coldwater784
- Collyer69
- Colony335
- Columbus2,881
- Colwich1,492
- Concordia5,015
- Conway Springs1,573
- Coolidge28
- Copeland365
- Corning187
- Cottonwood Falls1,041
- Council Grove2,265
- Courtland163
- Coyville62
- Crestline139
- Croweburg80
- Cuba192
- Cullison97
- Culver83
- Cunningham414
- Damar126
- Danville28
- De Soto6,414
- Dearing279
- Deerfield647
- Delia177
- Delphos320
- Denison232
- Dennis198
- Denton109
- Derby26,062
- Detroit75
- Devon73
- Dexter540
- Dighton733
- Dodge City27,613
- Dorrance156
- Douglass1,603
- Downs749
- Dresden60
- Dunlap16
- Durham83
- Dwight242
- Earlton111
- Eastborough919
- Easton299
- Eastshore20
- Edgerton1,924
- Edmond49
- Edna297
- Edson5
- Edwardsville4,724
- Effingham786
- El Dorado12,769
- Elbing300
- Elgin72
- Elk City245
- Elk Falls126
- Elkhart1,661
- Ellinwood2,192
- Ellis2,189
- Ellsworth3,108
- Elmdale61
- Elsmore56
- Elwood1,049
- Elyria307
- Emmett178
- Emporia24,131
- Englewood51
- Ensign125
- Enterprise710
- Erie1,216
- Esbon82
- Eskridge419
- Eudora6,119
- Eureka2,223
- Everest356
- Fairview342
- Fairway4,159
- Fall River148
- Falun125
- Farlington61
- Florence522
- Fontana409
- Ford228
- Formoso89
- Fort Dodge93
- Fort Riley8,606
- Fort Scott7,555
- Fowler599
- Frankfort726
- Franklin650
- Frederick40
- Fredonia1,945
- Frontenac3,392
- Fulton93
- Furley49
- Galatia20
- Galena2,754
- Galesburg139
- Galva1,002
- Garden City27,819
- Garden Plain1,126
- Gardner24,526
- Garfield126
- Garland22
- Garnett3,202
- Gas512
- Gaylord70
- Gem98
- Geneseo213
- Geuda Springs223
- Girard2,777
- Glade50
- Glasco388
- Glen Elder476
- Goddard6,030
- Goessel600
- Goff133
- Goodland4,121
- Gorham416
- Gove City79
- Grainfield232
- Grandview Plaza2,015
- Grantville122
- Great Bend14,479
- Greeley243
- Greeley County465
- Green95
- Greenleaf320
- Greensburg722
- Greenwich62
- Grenola142
- Gridley393
- Grinnell342
- Gypsum443
- Haddam118
- Hallowell39
- Halstead2,516
- Hamilton158
- Hamlin14
- Hanover828
- Hanston213
- Hardtner216
- Harper1,136
- Harris9
- Hartford428
- Harveyville136
- Havana55
- Haven1,313
- Havensville172
- Haviland603
- Hays21,143
- Haysville11,117
- Hazelton103
- Healy347
- Hepler120
- Herington2,164
- Herndon159
- Hesston3,582
- Hiawatha3,197
- Highland1,069
- Hill City1,511
- Hillsboro2,700
- Hillsdale117
- Hoisington2,643
- Holcomb2,577
- Hollenberg9
- Holton3,387
- Holyrood377
- Home92
- Hope485
- Horace81
- Horton1,610
- Howard516
- Hoxie1,042
- Hoyt935
- Hudson106
- Hugoton3,974
- Humboldt1,793
- Hunnewell104
- Hunter58
- Huron70
- Hutchinson39,709
- Idana33
- Independence8,422
- Ingalls315
- Inman1,325
- Iola5,348
- Isabel93
- Iuka231
- Jamestown174
- Jennings118
- Jetmore580
- Jewell469
- Johnson City1,549
- Junction City22,331
- Kanopolis552
- Kanorado153
- Kansas City155,135
- Keats182
- Kechi2,901
- Kelly1
- Kensington652
- Kickapoo Site 148
- Kickapoo Site 215
- Kickapoo Site 5161
- Kickapoo Site 764
- Kickapoo Tribal Center128
- Kincaid188
- Kingman2,957
- Kinsley1,328
- Kiowa811
- Kipp129
- Kirwin63
- Kismet414
- La Crosse1,154
- La Cygne1,327
- La Harpe492
- Labette17
- Lafontaine78
- Lake Quivira940
- Lakin2,243
- Lancaster325
- Lane223
- Langdon49
- Lansing11,246
- Larned3,423
- Latham199
- Latimer84
- Lawrence96,051
- Leavenworth37,195
- Leawood33,809
- Lebanon191
- Lebo760
- Lecompton736
- Lehigh182
- Lenexa58,384
- Lenora183
- Leon607
- Leona49
- Leonardville514
- Leoti1,360
- LeRoy510
- Levant63
- Lewis489
- Liberal19,316
- Liberty110
- Liebenthal87
- Lincoln Center1,017
- Lincolnville181
- Lindsborg3,792
- Linn470
- Linn Valley962
- Linwood312
- Little River402
- Logan598
- Lone Elm40
- Long Island136
- Longford51
- Longton302
- Lorraine137
- Lost Springs27
- Louisburg5,094
- Louisville175
- Lowell278
- Lucas405
- Ludell14
- Luray121
- Lyndon1,023
- Lyons3,553
- Macksville651
- Madison925
- Mahaska47
- Maize6,824
- Manchester69
- Manhattan54,239
- Mankato925
- Manter142
- Maple Hill772
- Mapleton213
- Marienthal13
- Marion1,746
- Marquette585
- Marysville3,422
- Matfield Green48
- Mayetta347
- Mayfield102
- McConnell AFB1,907
- McCracken200
- McCune308
- McDonald249
- McFarland363
- McLouth864
- McPherson13,995
- Meade1,341
- Medicine Lodge1,578
- Melvern352
- Menlo24
- Mentor83
- Meriden716
- Merriam11,085
- Milan80
- Mildred33
- Milford337
- Milton185
- Miltonvale474
- Minneapolis2,043
- Minneola835
- Mission9,915
- Mission Hills3,548
- Mission Woods184
- Moline354
- Montezuma864
- Monument99
- Moran472
- Morganville176
- Morland112
- Morrill210
- Morrowville96
- Moscow180
- Mound City768
- Mound Valley341
- Moundridge1,628
- Mount Hope763
- Mulberry442
- Mullinville214
- Mulvane6,171
- Munden158
- Munjor247
- Murdock32
- Muscotah141
- Narka82
- Nashville57
- Natoma427
- Neal27
- Neodesha2,503
- Neosho Falls132
- Neosho Rapids276
- Ness City1,162
- Netawaka151
- New Albany88
- New Cambria144
- New Salem12
- New Strawn396
- Newbury50
- Newton18,397
- Nickerson1,001
- Niles84
- Niotaze99
- Norcatur197
- North Newton2,155
- Norton2,689
- Nortonville715
- Norway6
- Norwich437
- Oak Hill19
- Oaklawn-Sunview2,789
- Oakley2,009
- Oberlin1,734
- Odin58
- Offerle151
- Ogallah8
- Ogden1,696
- Oketo109
- Olathe145,057
- Olivet180
- Olmitz113
- Olpe565
- Olsburg269
- Onaga727
- Oneida137
- Opolis35
- Osage City2,828
- Osawatomie4,182
- Osborne1,358
- Oskaloosa1,113
- Oswego1,937
- Otis413
- Ottawa12,678
- Overbrook1,113
- Overland Park200,306
- Oxford964
- Ozawkie604
- Palco197
- Palmer149
- Paola5,770
- Paradise25
- Park86
- Park City7,673
- Parker274
- Parkerfield527
- Parkerville55
- Parsons9,425
- Partridge236
- Pawnee Rock258
- Paxico166
- Peabody1,196
- Peck22
- Penalosa5
- Perry1,069
- Peru139
- Phillipsburg2,130
- Piedmont27
- Pilsen51
- Piqua40
- Pittsburg20,637
- Plains1,171
- Plainville1,656
- Pleasanton1,516
- Plevna90
- Pomona1,088
- Portis70
- Potwin513
- Powhattan74
- Prairie View156
- Prairie Village22,874
- Pratt6,577
- Prescott276
- Preston111
- Pretty Prairie641
- Princeton236
- Protection492
- Quenemo353
- Quinter953
- Radium16
- Radley135
- Ramona76
- Randall184
- Randolph178
- Ransom279
- Rantoul130
- Raymond109
- Reading198
- Redfield71
- Republic148
- Reserve48
- Rexford146
- Richfield17
- Richmond503
- Riley943
- Ringo82
- Riverton769
- Robinson154
- Rock90
- Roeland Park6,763
- Rolla542
- Rosalia219
- Rose Hill4,246
- Roseland63
- Rossville1,106
- Rozel66
- Rush Center179
- Russell4,217
- Russell Springs26
- Sabetha2,471
- Salina46,307
- Satanta837
- Savonburg93
- Sawyer76
- Scammon371
- Scandia288
- Schoenchen181
- Scott City3,800
- Scottsville15
- Scranton911
- Sedan1,050
- Sedgwick1,614
- Selden288
- Seneca2,090
- Severance37
- Severy175
- Seward80
- Sharon133
- Sharon Springs817
- Shawnee68,542
- Silver Lake1,553
- Silverdale116
- Simpson154
- Smith Center1,680
- Smolan148
- Soldier68
- Solomon892
- Somerset40
- South Haven276
- South Hutchinson2,751
- South Mound31
- Spearville998
- Speed6
- Spivey116
- Spring Hill9,120
- St. Benedict36
- St. Francis1,229
- St. George1,039
- St. John1,172
- St. Marks156
- St. Marys2,788
- St. Paul631
- Stafford809
- Stark63
- Sterling2,411
- Stockton1,656
- Strong City488
- Stuttgart65
- Sublette1,500
- Summerfield128
- Sun City35
- Susank31
- Sycamore24
- Sylvan Grove314
- Sylvia195
- Syracuse1,699
- Talmage44
- Tampa201
- Tecumseh457
- Tescott235
- Thayer502
- The Highlands479
- Timken36
- Tipton241
- Tonganoxie5,891
- Topeka125,786
- Toronto260
- Towanda1,668
- Tribune758
- Troy824
- Turon334
- Tyro192
- Udall807
- Ulysses5,476
- Uniontown467
- Utica135
- Valley Center8,590
- Valley Falls1,382
- Vassar832
- Vermillion52
- Victoria1,095
- Vining58
- Viola190
- Virgil23
- Wabaunsee76
- Wakarusa209
- WaKeeney1,852
- Wakefield1,031
- Waldo17
- Waldron5
- Wallace48
- Walnut237
- Walton223
- Wamego4,386
- Washington1,155
- Waterville748
- Wathena1,554
- Waverly625
- Webber19
- Weir855
- Welda233
- Wellington7,615
- Wells10
- Wellsville2,216
- Weskan171
- West Mineral154
- Westmoreland703
- Westphalia161
- Westwood2,093
- Westwood Hills469
- Wetmore342
- Wheaton72
- White City458
- White Cloud117
- Whitewater886
- Whiting337
- Wichita397,945
- Willard67
- Williamsburg372
- Williamstown31
- Willis35
- Willowbrook81
- Wilmore24
- Wilroads Gardens955
- Wilsey164
- Wilson833
- Winchester417
- Windom52
- Winfield11,711
- Winona221
- Woodbine137
- Woodruff8
- Woodston86
- Wright106
- Yale60
- Yates Center1,270
- Yoder24
- Zenda86
- Zurich50
Metro and micro areas
Each of the 20 that reach into Kansas, with its whole population, from ACS 2020–2024 5-year estimates. Metro and micro areas are counties tied together by commuting, drawn by the Office of Management and Budget.
- Arkansas City-Winfield, KS Micro Area34,411
- Atchison, KS Micro Area16,208
- Dodge City, KS Micro Area34,074
- Emporia, KS Micro Area34,747
- Garden City, KS Micro Area38,084
- Great Bend, KS Micro Area25,097
- Hays, KS Micro Area28,920
- Hutchinson, KS Micro Area61,553
- Joplin, MO-KS Metro Area203,626
- Kansas City, MO-KS Metro Area2.22M
- Lawrence, KS Metro Area120,302
- Liberal, KS Micro Area21,486
- Manhattan, KS Metro Area133,965
- McPherson, KS Micro Area30,205
- Ottawa, KS Micro Area26,106
- Pittsburg, KS Micro Area39,008
- Salina, KS Micro Area59,487
- St. Joseph, MO-KS Metro Area120,012
- Topeka, KS Metro Area232,468
- Wichita, KS Metro Area652,622
ZIP codes
Each of the 699 with people in it, by the town it's centered in, from ACS 2020–2024 5-year estimates. These are the Census Bureau's ZIP Code Tabulation Areas, which follow the Postal Service's ZIP codes as closely as census blocks allow.
- 66002Atchison13,276
- 66006Baldwin City8,013
- 66007Basehor10,150
- 66008Bendena200
- 66010Blue Mound626
- 66012Bonner Springs10,425
- 66013Bucyrus2,735
- 66014Parker599
- 66015Colony712
- 66016Nortonville559
- 66017Denton219
- 66018De Soto6,584
- 66020Easton1,809
- 66021Edgerton2,819
- 66023Effingham1,189
- 66024Elwood815
- 66025Eudora8,083
- 66026Fontana840
- 66027Leavenworth7,365
- 66030Gardner26,328
- 66031Gardner655
- 66032Garnett4,971
- 66033Greeley672
- 66035Highland1,342
- 66039Kincaid784
- 66040La Cygne3,651
- 66041Lancaster614
- 66042Lane929
- 66043Lansing11,056
- 66044Lawrence28,820
- 66045Lawrence1,925
- 66046Lawrence19,658
- 66047Lawrence20,473
- 66048Leavenworth35,717
- 66049Lawrence32,015
- 66050Lecompton1,761
- 66052Linwood2,090
- 66053Louisburg7,834
- 66054McLouth2,777
- 66056Mound City1,383
- 66058Muscotah378
- 66060Nortonville1,325
- 66061Olathe67,967
- 66062Olathe78,841
- 66064Osawatomie5,992
- 66066Oskaloosa2,432
- 66067Ottawa16,330
- 66070Ozawkie1,944
- 66071Paola12,400
- 66072Parker1,211
- 66073Perry2,263
- 66075Pleasanton2,497
- 66076Pomona2,416
- 66078Princeton805
- 66079Rantoul752
- 66080Richmond980
- 66083Spring Hill13,011
- 66085Overland Park11,486
- 66086Tonganoxie10,940
- 66087Troy2,027
- 66088Valley Falls2,697
- 66090Wathena2,380
- 66091Welda294
- 66092Wellsville4,351
- 66093Westphalia576
- 66094White Cloud437
- 66095Williamsburg583
- 66097Winchester995
- 66101Kansas City12,556
- 66102Kansas City29,443
- 66103Kansas City12,730
- 66104Kansas City27,033
- 66105Kansas City2,605
- 66106Kansas City24,245
- 66109Kansas City28,355
- 66111Kansas City9,996
- 66112Kansas City12,881
- 66160Kansas City37
- 66202Overland Park17,408
- 66203Shawnee19,441
- 66204Overland Park17,948
- 66205Fairway14,032
- 66206Leawood12,153
- 66207Overland Park15,739
- 66208Prairie Village21,576
- 66209Leawood20,413
- 66210Overland Park20,347
- 66211Leawood5,791
- 66212Overland Park32,917
- 66213Overland Park30,539
- 66214Overland Park12,351
- 66215Lenexa25,960
- 66216Shawnee24,881
- 66217Shawnee5,468
- 66218Shawnee8,820
- 66219Lenexa13,519
- 66220Lenexa8,535
- 66221Overland Park25,550
- 66223Overland Park24,747
- 66224Leawood12,683
- 66226Shawnee16,219
- 66227Lenexa9,595
- 66251Overland Park8
- 66401Alma1,948
- 66402Auburn3,100
- 66403Axtell801
- 66404Baileyville481
- 66406Beattie365
- 66407Belvue298
- 66408Bern427
- 66409Tecumseh3,133
- 66411Blue Rapids1,127
- 66412Bremen644
- 66413Burlingame1,721
- 66414Carbondale2,360
- 66415Centralia762
- 66416Circleville522
- 66417Corning507
- 66418Delia556
- 66419Denison600
- 66422Emmett1,228
- 66423Eskridge884
- 66424Everest486
- 66425Fairview391
- 66427Frankfort1,334
- 66428Goff246
- 66429Grantville379
- 66431Harveyville718
- 66432Havensville540
- 66434Hiawatha4,740
- 66436Holton5,537
- 66438Home200
- 66439Horton2,578
- 66440Hoyt1,943
- 66441Grandview Plaza25,828
- 66442Fort Riley16,890
- 66449Leonardville937
- 66451Lyndon1,671
- 66501McFarland363
- 66502Manhattan43,693
- 66503Keats17,273
- 66506Manhattan3,155
- 66507Maple Hill1,438
- 66508Marysville3,987
- 66509Mayetta1,974
- 66510Melvern684
- 66512Meriden3,678
- 66514Fort Riley1,350
- 66515Morrill362
- 66516Netawaka408
- 66517Ogden1,696
- 66518Oketo211
- 66520Olsburg635
- 66521Onaga1,417
- 66522Oneida130
- 66523Osage City3,941
- 66524Overbrook2,473
- 66526Paxico693
- 66527Powhattan244
- 66528Quenemo761
- 66531Riley1,256
- 66532Robinson527
- 66533Rossville1,595
- 66534Sabetha3,381
- 66535St. George3,556
- 66536St. Marys4,204
- 66537Scranton1,475
- 66538Seneca3,602
- 66539Silver Lake3,092
- 66540Soldier582
- 66541Summerfield234
- 66542Tecumseh3,019
- 66543Vassar980
- 66544Vermillion287
- 66546Wakarusa1,143
- 66547Louisville8,579
- 66548Waterville975
- 66549Westmoreland1,526
- 66550Wetmore552
- 66552Whiting581
- 66554Randolph770
- 66603Topeka1,830
- 66604Topeka23,006
- 66605Topeka20,891
- 66606Topeka9,842
- 66607Topeka9,965
- 66608Topeka4,216
- 66609Topeka7,572
- 66610Auburn9,849
- 66611Topeka9,828
- 66612Topeka1,754
- 66614Silver Lake32,538
- 66615Willard2,943
- 66616Topeka6,212
- 66617Meriden8,903
- 66618Silver Lake10,179
- 66619Wakarusa3,217
- 66621Topeka442
- 66622Topeka56
- 66701Fort Scott11,503
- 66710Altoona804
- 66711Arcadia478
- 66712Arma1,675
- 66713Baxter Springs5,635
- 66714Benedict162
- 66716Bronson813
- 66717Buffalo467
- 66720Chanute10,631
- 66724Cherokee935
- 66725Columbus4,991
- 66732Elsmore294
- 66733Erie2,012
- 66734Farlington343
- 66735Franklin692
- 66736Fredonia3,374
- 66738Fulton173
- 66739Galena5,025
- 66740Galesburg236
- 66741Garland144
- 66742Gas30
- 66743Girard4,313
- 66746Hepler247
- 66748Humboldt2,830
- 66749Iola7,448
- 66751La Harpe590
- 66753McCune949
- 66754Mapleton344
- 66755Moran890
- 66756Mulberry1,052
- 66757Neodesha3,326
- 66758Neosho Falls251
- 66760Opolis35
- 66761Piqua255
- 66762Pittsburg24,907
- 66763Frontenac3,392
- 66767Prescott374
- 66769Redfield520
- 66770Riverton1,047
- 66771St. Paul1,074
- 66772Savonburg288
- 66773Scammon587
- 66775Stark224
- 66776Thayer1,524
- 66777Toronto473
- 66779Uniontown892
- 66780Walnut674
- 66781Weir1,183
- 66782West Mineral164
- 66783Yates Center2,190
- 66801Emporia27,585
- 66830Admire203
- 66833Allen641
- 66834Alta Vista856
- 66835Americus1,202
- 66838Burdick99
- 66839Burlington3,654
- 66840Burns474
- 66842Cassoday508
- 66843Cedar Point105
- 66845Cottonwood Falls1,237
- 66846Council Grove3,333
- 66849Dwight531
- 66850Elmdale202
- 66851Florence659
- 66852Gridley587
- 66853Hamilton281
- 66854Hartford1,007
- 66856Lebo1,583
- 66857LeRoy872
- 66858Lincolnville428
- 66859Lost Springs158
- 66860Madison1,342
- 66861Marion2,769
- 66862Matfield Green68
- 66863Neal27
- 66864Neosho Rapids375
- 66865Olpe1,105
- 66866Peabody1,737
- 66868Reading620
- 66869Strong City669
- 66870Virgil121
- 66871Waverly1,347
- 66872White City807
- 66873Wilsey201
- 66901Concordia6,055
- 66930Agenda131
- 66932Athol162
- 66933Barnes345
- 66935Belleville2,413
- 66936Burr Oak194
- 66937Clifton691
- 66938Ames1,191
- 66939Courtland335
- 66940Cuba283
- 66941Esbon130
- 66942Formoso305
- 66943Greenleaf568
- 66944Haddam304
- 66945Hanover1,063
- 66946Hollenberg161
- 66948Jamestown566
- 66949Jewell524
- 66951Kensington920
- 66952Lebanon401
- 66953Linn628
- 66955Mahaska47
- 66956Mankato1,351
- 66958Morrowville198
- 66959Munden339
- 66960Narka125
- 66961Norway6
- 66962Palmer302
- 66963Randall208
- 66964Republic175
- 66966Scandia577
- 66967Smith Center1,913
- 66968Washington1,454
- 66970Webber39
- 67001Andale2,535
- 67002Andover17,221
- 67003Anthony2,477
- 67004Argonia801
- 67005Parkerfield15,073
- 67008Atlanta494
- 67009Attica796
- 67010Augusta13,947
- 67012Beaumont38
- 67013Belle Plaine2,678
- 67016Bentley480
- 67017Benton2,264
- 67018Bluff City65
- 67019Burden992
- 67020Burrton1,596
- 67021Byers26
- 67022Caldwell1,436
- 67023Cambridge112
- 67024Cedar Vale937
- 67025Cheney3,940
- 67026Clearwater5,692
- 67028Sun City173
- 67029Coldwater962
- 67030Colwich3,037
- 67031Conway Springs2,497
- 67035Cunningham891
- 67036Danville236
- 67037Derby30,278
- 67038Dexter692
- 67039Douglass2,996
- 67041Elbing296
- 67042El Dorado16,978
- 67045Eureka3,406
- 67047Fall River496
- 67049Bluff City12
- 67050Garden Plain1,907
- 67051Geuda Springs404
- 67052Goddard9,262
- 67053Goessel600
- 67054Greensburg1,251
- 67055Greenwich62
- 67056Halstead3,040
- 67057Hardtner252
- 67058Harper1,777
- 67059Haviland932
- 67060Haysville14,125
- 67061Hazelton237
- 67062Hesston3,970
- 67063Hillsboro3,470
- 67065Isabel151
- 67066Iuka236
- 67067Kechi2,293
- 67068Kingman3,949
- 67070Kiowa921
- 670715
- 67072Latham290
- 67073Lehigh344
- 67074Leon1,583
- 67101Maize6,941
- 67102Silverdale38
- 67103Mayfield180
- 67104Medicine Lodge2,142
- 67105Milan158
- 67106Milton560
- 67107Moundridge2,459
- 67108Andale1,384
- 67109Mullinville335
- 67110Mulvane8,722
- 67111Murdock318
- 67112Nashville235
- 67114North Newton20,919
- 67117North Newton2,157
- 67118Norwich769
- 67119Oxford1,287
- 67120Peck575
- 67122Piedmont296
- 67123Potwin867
- 67124Pratt7,868
- 67127Protection681
- 67131Rock274
- 67132Rosalia385
- 67133Rose Hill6,931
- 67134Sawyer297
- 67135Sedgwick3,681
- 67137Severy357
- 67138Sharon438
- 67140South Haven971
- 67142Spivey358
- 67143Sun City35
- 67144Towanda2,712
- 67146Udall1,867
- 67147Kechi10,792
- 67149Viola844
- 67150Waldron5
- 67151Walton402
- 67152Wellington9,212
- 67154Whitewater1,290
- 67155Wilmore97
- 67156Winfield14,513
- 67159Zenda183
- 67202Wichita2,046
- 67203Wichita30,710
- 67204Wichita22,538
- 67205Wichita20,098
- 67206Eastborough17,380
- 67207Wichita27,414
- 67208Wichita18,950
- 67209Wichita13,289
- 67210McConnell AFB9,024
- 67211Wichita19,105
- 67212Wichita42,902
- 67213Wichita19,699
- 67214Wichita15,243
- 67215Haysville7,129
- 67216Wichita23,254
- 67217Wichita32,603
- 67218Wichita23,383
- 67219Park City12,586
- 67220Wichita16,270
- 67221McConnell AFB325
- 67223Maize849
- 67226Wichita21,596
- 67227Goddard152
- 67228Greenwich2,424
- 67230Wichita11,981
- 67232Andover607
- 67235Wichita14,958
- 67260Wichita520
- 67301Independence12,953
- 67330Altamont1,644
- 67332Bartlett204
- 67333Tyro2,478
- 67334Chautauqua91
- 67335Cherryvale3,246
- 67336Chetopa1,150
- 67337Coffeyville10,890
- 67340Dearing209
- 67341Dennis781
- 67342Edna618
- 67344Elk City754
- 67345Elk Falls176
- 67346Grenola280
- 67347Havana521
- 67349Howard646
- 67351Liberty325
- 67352Longton488
- 67353Moline519
- 67354Mound Valley733
- 67355Niotaze187
- 67356Oswego2,728
- 67357Parsons11,853
- 67360Peru259
- 67361Sedan1,780
- 67364Tyro192
- 67401Salina50,217
- 67410Abilene10,000
- 67416Assaria950
- 67417Aurora121
- 67418Barnard184
- 67420Beloit3,863
- 67422Bennington1,407
- 67423Beverly304
- 67425Brookville593
- 67427Bushton323
- 67428Canton1,191
- 67430Cawker City468
- 67431Chapman2,242
- 67432Clay Center5,607
- 67436Delphos548
- 67437Downs971
- 67438Durham226
- 67439Ellsworth3,471
- 67441Enterprise964
- 67442Falun152
- 67443Galva2,080
- 67444Geneseo623
- 67445Glasco565
- 67446Glen Elder673
- 67447Green207
- 67448Gypsum1,251
- 67449Latimer2,860
- 67450Holyrood432
- 67451Hope840
- 67452Hunter343
- 67454Kanopolis610
- 67455Lincoln Center1,596
- 67456Lindsborg4,977
- 67457Little River618
- 67458Longford394
- 67459Lorraine264
- 67460McPherson16,348
- 67464Marquette1,051
- 67466Miltonvale728
- 67467Minneapolis2,871
- 67468Morganville265
- 67470New Cambria266
- 67473Osborne1,724
- 67474Portis110
- 67475Ramona126
- 67478Simpson154
- 67480Niles1,406
- 67481Sylvan Grove729
- 67482Talmage44
- 67483Tampa559
- 67484Tescott840
- 67485Tipton380
- 67487Wakefield1,515
- 67490Wilson1,031
- 67491Windom379
- 67492Woodbine200
- 67501Hutchinson24,605
- 67502The Highlands23,099
- 67505South Hutchinson2,761
- 67510Abbyville303
- 67511Albert145
- 67512Alden148
- 67513Alexander97
- 67514Arlington705
- 67515Utica59
- 67516Bazine510
- 6751838
- 67519Belpre175
- 67520Bison267
- 67521Brownell136
- 67522Buhler2,160
- 67523Burdett498
- 67524Chase618
- 67525Odin680
- 67526Ellinwood2,621
- 67529Garfield366
- 67530Great Bend17,798
- 67543Haven2,026
- 67544Hoisington3,064
- 67545Hudson206
- 67546Inman2,601
- 67547Kinsley1,628
- 67548La Crosse1,289
- 67550Larned5,104
- 67552Lewis686
- 67553Liebenthal87
- 67554Lyons4,048
- 67556McCracken287
- 67557Macksville765
- 67559Alexander66
- 67560Ness City1,336
- 67561Nickerson1,591
- 67563Offerle339
- 67564Olmitz290
- 67565Otis447
- 67566Partridge785
- 67567Pawnee Rock643
- 67568Plevna247
- 67570Pretty Prairie1,571
- 67572Ransom430
- 67573Raymond158
- 67574Rozel111
- 67575Rush Center454
- 67576St. John1,806
- 67578Stafford1,104
- 67579Sterling3,102
- 67581Sylvia300
- 67583Turon848
- 67584Utica187
- 67601Hays24,330
- 67621Agra335
- 67622Almena680
- 67623Alton228
- 67625Bogue237
- 67626Bunker Hill241
- 67627Catharine186
- 67628Kirwin126
- 67629Clayton33
- 67631Collyer93
- 67632Damar201
- 67634Dorrance237
- 67635Dresden136
- 67637Ellis2,711
- 67638Gaylord70
- 67639Glade168
- 67640Gorham601
- 67642Hill City1,752
- 67643Jennings194
- 67644Kirwin199
- 67645Edmond531
- 67646Logan685
- 67647Long Island243
- 67648Lucas528
- 67649Luray178
- 67650Morland204
- 67651Natoma535
- 67653Norcatur232
- 67654Norton4,021
- 67656Ogallah220
- 67657Palco326
- 67658Paradise110
- 67659Morland56
- 67660Munjor32
- 67661Phillipsburg2,849
- 67663Plainville2,346
- 67664Prairie View296
- 67665Russell4,861
- 67667Schoenchen181
- 67669Stockton1,888
- 67671Victoria1,533
- 67672WaKeeney2,159
- 67673Waldo51
- 67674Victoria106
- 67675Woodston116
- 67701Colby6,134
- 67730Atwood1,654
- 67731Bird City942
- 67732Brewster691
- 67733Edson81
- 67734Gem175
- 67735Goodland5,424
- 67736Gove City183
- 67737Grainfield451
- 67738Grinnell574
- 67739Herndon280
- 67740Hoxie1,592
- 67741Kanorado258
- 67743Levant200
- 67744Ludell155
- 67745McDonald353
- 67747Monument151
- 67748Oakley2,637
- 67749Oberlin2,209
- 67751Park207
- 67752Quinter1,544
- 67753Rexford407
- 67756St. Francis1,677
- 67757Selden466
- 67758Sharon Springs1,009
- 67761Wallace176
- 67762Weskan295
- 67764Russell Springs401
- 67801Dodge City30,967
- 67831Ashland968
- 67834Bucklin891
- 678352,716
- 67836Coolidge44
- 67837Copeland927
- 67838Deerfield960
- 67839Dighton1,050
- 67840Englewood56
- 67841Ensign377
- 67842Ford376
- 67843Fort Dodge74
- 67844Fowler796
- 67846Garden City34,475
- 67849Hanston300
- 67850Healy486
- 67851Holcomb3,145
- 67853Ingalls875
- 678541,004
- 67855Johnson City1,831
- 67857172
- 67859Kismet535
- 67860Lakin2,763
- 67861Leoti1,854
- 67862Manter244
- 67863Marienthal308
- 67864Meade1,701
- 67865Minneola1,007
- 67867Montezuma1,596
- 67868188
- 67869Plains1,327
- 67870Satanta1,277
- 67871Scott City4,985
- 67876Spearville1,499
- 67877Sublette2,289
- 67878Syracuse2,316
- 67879Greeley County1,302
- 67880Ulysses7,293
- 67882Wright179
- 67901Liberal20,902
- 67950Elkhart1,744
- 67951Hugoton4,563
- 67952Moscow452
- 67953Richfield54
- 67954Rolla777
Towns and townships
Each of the 1,348 with people in it, from ACS 2020–2024 5-year estimates: the county subdivisions that are governments of their own. A city, borough or village that is one too is listed with the places above.
- Achilles township47
- Adams township163
- Adrian township429
- Aetna township5
- Afton township1,289
- Agency township465
- Agnes City township548
- Alamota township62
- Albano township22
- Albion township (Barton County)8
- Albion township (Reno County)888
- Albion township (Republic County)104
- Alexander-Belle Prairie township128
- Alexandria township767
- Allen township (Jewell County)7
- Allen township (Kingman County)89
- Allison township15
- Allodium township40
- Alma township1,390
- Almena-District 4 township703
- Alta township352
- Americus township1,440
- Appanoose township101
- Appleton township939
- Arcade township97
- Arion township26
- Arlington township500
- Arvonia township165
- Ash Creek township71
- Ash Valley township51
- Asherville township42
- Ashland township87
- Athelstane township226
- Athens township3
- Atlanta township57
- Attica township7,910
- Atwood township1,362
- Aubry township4,663
- Auburn township3,299
- Augusta township1,299
- Augustine township26
- Aurora township81
- Avilla township22
- Avon township (Coffey County)211
- Avon township (Sumner County)472
- Bachelor township303
- Baker township (Crawford County)3,470
- Baker township (Gove County)1,404
- Bala township767
- Balderson township99
- Banner township (Dickinson County)9
- Banner township (Jackson County)198
- Banner township (Rush County)177
- Banner township (Smith County)25
- Banner township (Stevens County)261
- Barclay township239
- Barnes township281
- Barrett township16
- Battle Creek township14
- Battle Hill township113
- Bazaar township66
- Bazine township567
- Bear Creek township17
- Beaver township (Barton County)8
- Beaver township (Cowley County)205
- Beaver township (Decatur County)56
- Beaver township (Lincoln County)314
- Beaver township (Phillips County)56
- Beaver township (Republic County)178
- Beaver township (Scott County)271
- Beaver township (Smith County)23
- Bell township57
- Belle Plaine township3,054
- Belleville township (Chautauqua County)462
- Belleville township (Republic County)123
- Belmont township (Kingman County)44
- Belmont township (Phillips County)10
- Beloit township128
- Belpre township175
- Belvue township245
- Bennett township510
- Bennington township1,384
- Benton township (Atchison County)1,195
- Benton township (Butler County)1,982
- Benton township (Hodgeman County)18
- Berwick township511
- Bethany township92
- Big Bend township99
- Big Bow township167
- Big Creek township (Ellis County)2,593
- Big Creek township (Neosho County)338
- Big Creek township (Russell County)664
- Big Timber township134
- Bigelow township31
- Bird City township911
- Black Wolf township67
- Blaine township (Clay County)148
- Blaine township (Marion County)250
- Blaine township (Ottawa County)118
- Blakely township88
- Bloom township (Clay County)81
- Bloom township (Ford County)48
- Bloom township (Osborne County)17
- Bloomfield township (Mitchell County)89
- Bloomfield township (Sheridan County)63
- Bloomington township497
- Blue Hill township15
- Blue Mound township489
- Blue Rapids City township1,048
- Blue Rapids township32
- Blue township5,173
- Blue Valley township360
- Bluff township57
- Bolton township1,207
- Bonaville township122
- Bow Creek township15
- Bowcreek township12
- Brantford township76
- Browns Creek township37
- Browns Grove township433
- Bruno township17,665
- Bryant township74
- Buckeye township (Dickinson County)411
- Buckeye township (Ellis County)853
- Buckeye township (Ottawa County)83
- Bucklin township845
- Buffalo township (Barton County)235
- Buffalo township (Cloud County)122
- Buffalo township (Jewell County)487
- Burlingame township1,609
- Burlington township249
- Burr Oak township (Doniphan County)203
- Burr Oak township (Jewell County)189
- Burrton township955
- Byron township8
- Caldwell township156
- Calhoun township25
- Cambria township315
- Canada township76
- Caney township1,350
- Caneyville township18
- Canton township (Kingman County)188
- Canton township (McPherson County)826
- Canville township622
- Capioma township48
- Carlyle township289
- Carneiro township17
- Carr Creek township62
- Castle township192
- Castleton township681
- Catlin township284
- Cawker township393
- Cedar township (Chase County)31
- Cedar township (Cowley County)44
- Cedar township (Jackson County)858
- Cedar township (Smith County)713
- Cedar township (Wilson County)734
- Cedron township99
- Center township (Atchison County)442
- Center township (Chautauqua County)47
- Center township (Clark County)818
- Center township (Cloud County)308
- Center township (Decatur County)12
- Center township (Dickinson County)1,005
- Center township (Doniphan County)1,804
- Center township (Hodgeman County)732
- Center township (Jewell County)1,034
- Center township (Lyon County)1,115
- Center township (Marshall County)162
- Center township (Nemaha County)75
- Center township (Ness County)1,178
- Center township (Ottawa County)47
- Center township (Pottawatomie County)22
- Center township (Rawlins County)212
- Center township (Reno County)870
- Center township (Rice County)106
- Center township (Riley County)126
- Center township (Rush County)204
- Center township (Russell County)308
- Center township (Smith County)1,791
- Center township (Stevens County)3,977
- Center township (Wilson County)340
- Center township (Woodson County)728
- Center-District 1 township1,303
- Centerville township (Linn County)418
- Centerville township (Neosho County)291
- Centre township358
- Centropolis township930
- Chapman township (Clay County)144
- Chapman township (Ottawa County)68
- Charleston township82
- Cheever township109
- Chelsea township304
- Cherokee township (Cherokee County)226
- Cherokee township (Montgomery County)355
- Cherry township442
- Chetopa township (Neosho County)937
- Chetopa township (Wilson County)134
- Cheyenne township (Barton County)77
- Cheyenne township (Lane County)418
- Chikaskia township (Kingman County)123
- Chikaskia township (Sumner County)52
- Cimarron township (Gray County)2,297
- Cimarron township (Meade County)15
- Cimarron township (Morton County)76
- Clarence township201
- Clark township298
- Clay Center township323
- Clay township (Butler County)78
- Clay township (Reno County)1,666
- Clear Creek township (Ellsworth County)58
- Clear Creek township (Marion County)405
- Clear Creek township (Nemaha County)194
- Clear Creek township (Pottawatomie County)91
- Clear Creek township (Stafford County)24
- Clear Fork township49
- Cleveland Run township14
- Cleveland township (Barton County)8
- Cleveland township (Marshall County)68
- Cleveland township (Stafford County)38
- Clifford township157
- Clifton township (Washington County)318
- Clifton township (Wilson County)419
- Clinton township507
- Coldwater township977
- Coleman township26
- Colfax township (Cloud County)11
- Colfax township (Marion County)165
- Colfax township (Wilson County)343
- Collyer township93
- Colorado township284
- Columbia township76
- Comanche township367
- Concord township (Ford County)100
- Concord township (Ottawa County)373
- Conkling township30
- Conway township1,439
- Coolidge township44
- Copeland township691
- Cora township13
- Corinth township89
- Cottage Grove township558
- Cottage Hill township27
- Cottonwood township174
- Courtland township241
- Covert township19
- Crawford township (Cherokee County)784
- Crawford township (Crawford County)1,020
- Creek township84
- Creswell township1,640
- Crooked Creek township90
- Crystal Plains township18
- Crystal township42
- Culver township102
- Custer township (Decatur County)161
- Custer township (Mitchell County)101
- Cutler township763
- Dale township58
- Darlington township484
- Dayton township (Phillips County)9
- Dayton township (Saline County)68
- Deer Creek township (Allen County)35
- Deer Creek township (Phillips County)61
- Deerfield township829
- Delano township14
- Delaware township (Jefferson County)2,211
- Delaware township (Leavenworth County)795
- Delhi township4
- Delmore township115
- Dexter township646
- Diamond Creek township167
- Dighton township952
- Dixon township714
- Dodge township1,086
- Dor township70
- Douglas township (Jackson County)2,290
- Douglas township (Stafford County)63
- Douglass township1,912
- Dover township1,442
- Downs township117
- Doyle township84
- Dragoon township134
- Dresden township (Decatur County)110
- Dresden township (Kingman County)401
- Driftwood township46
- Drum Creek township489
- Drywood township289
- Dudley township1,027
- Durham Park township131
- Durham township53
- Eagle township (Barber County)8
- Eagle township (Kingman County)288
- Eagle township (Sedgwick County)1,291
- East Branch township175
- East Cooper township18
- East Hale township103
- East Hess township393
- East Hibbard township90
- East Saline township62
- East Washington township176
- Easton township1,451
- Eden township (Ness County)47
- Eden township (Sumner County)437
- El Dorado township272
- Elk Creek township118
- Elk Falls township200
- Elk township (Cloud County)916
- Elk township (Osage County)1,734
- Elkhorn township716
- Ellsworth township684
- Elm Creek township (Marshall County)53
- Elm Creek township (Saline County)1,206
- Elm Grove township526
- Elm Mills township256
- Elm township935
- Elmendaro township727
- Elsmore township387
- Elwood township292
- Emma township4,043
- Emmett township906
- Empire township (Ellsworth County)272
- Empire township (McPherson County)1,409
- Emporia township961
- Englewood township109
- Enterprise township (Ford County)1,314
- Enterprise township (Reno County)132
- Erie township (Neosho County)1,383
- Erie township (Sedgwick County)123
- Erving township45
- Esbon township88
- Eudora township7,823
- Eureka township (Barton County)183
- Eureka township (Greenwood County)295
- Eureka township (Kingman County)69
- Eureka township (Mitchell County)68
- Eureka township (Rice County)40
- Eureka township (Saline County)612
- Evan township471
- Exeter township85
- Fairfax township476
- Fairfield township14
- Fairmount township (Butler County)429
- Fairmount township (Leavenworth County)11,960
- Fairplay township188
- Fairview township (Barton County)88
- Fairview township (Butler County)407
- Fairview township (Cowley County)39
- Fairview township (Ford County)232
- Fairview township (Jefferson County)1,400
- Fairview township (Labette County)355
- Fairview township (Republic County)125
- Fairview township (Russell County)515
- Fairview township (Stafford County)95
- Fall River township (Greenwood County)310
- Fall River township (Wilson County)515
- Falls township (Chase County)1,159
- Falls township (Sumner County)200
- Falun township184
- Fancy Creek township76
- Fargo township1,253
- Farmer township (Rice County)293
- Farmer township (Wabaunsee County)87
- Farmington township (Republic County)74
- Farmington township (Stafford County)711
- Farmington township (Washington County)137
- Fawn Creek township1,469
- Finley township9
- Five Creeks township88
- Flora township232
- Foote township143
- Ford township335
- Forrester township31
- Fountain township67
- Fowler township646
- Fragrant Hill township445
- Franklin township (Bourbon County)253
- Franklin township (Edwards County)67
- Franklin township (Franklin County)3,094
- Franklin township (Jackson County)766
- Franklin township (Lincoln County)82
- Franklin township (Marshall County)141
- Franklin township (Ness County)89
- Franklin township (Trego County)5
- Franklin township (Washington County)161
- Freedom township (Bourbon County)476
- Freedom township (Ellis County)510
- Freedom township (Phillips County)78
- Freedom township (Republic County)78
- Fremont township885
- Gaeland township30
- Gale township61
- Galesburg township188
- Galt township96
- Garden City township5,738
- Garden Plain township2,302
- Garden township (Cherokee County)2,721
- Garden township (Harvey County)53
- Gardner township2,540
- Garfield township (Clay County)101
- Garfield township (Dickinson County)104
- Garfield township (Ellsworth County)30
- Garfield township (Finney County)233
- Garfield township (Jackson County)914
- Garfield township (Ottawa County)62
- Garfield township (Pawnee County)140
- Garfield township (Rush County)13
- Garfield township (Smith County)10
- Garfield township (Wabaunsee County)551
- Geneva township143
- German township7
- Gettysburg township13
- Gill township74
- Gilman township172
- Glen Elder township584
- Glencoe township (Butler County)132
- Glencoe township (Trego County)54
- Glendale township76
- Glenwood township37
- Golden Belt township16
- Gore township1,714
- Goshen township1
- Gove township134
- Graham township93
- Grainfield township325
- Granada township103
- Grand River township551
- Grandview township269
- Granite township28
- Grant township (Barton County)17
- Grant township (Clay County)227
- Grant township (Cloud County)312
- Grant township (Cowley County)52
- Grant township (Crawford County)269
- Grant township (Dickinson County)1,204
- Grant township (Douglas County)321
- Grant township (Jackson County)145
- Grant township (Jewell County)150
- Grant township (Lincoln County)49
- Grant township (Marion County)162
- Grant township (Neosho County)302
- Grant township (Osage County)279
- Grant township (Ottawa County)62
- Grant township (Pawnee County)72
- Grant township (Pottawatomie County)413
- Grant township (Reno County)1,605
- Grant township (Republic County)28
- Grant township (Riley County)779
- Grant township (Russell County)190
- Grant township (Sedgwick County)5,489
- Grant township (Washington County)25
- Grasshopper township526
- Great Bend township1,549
- Greeley township (Saline County)690
- Greeley township (Sedgwick County)905
- Green Garden township264
- Green township211
- Greene township107
- Greenfield township240
- Greenleaf township370
- Greenwood township (Franklin County)275
- Greenwood township (Phillips County)9
- Grinnell township546
- Grove township (Reno County)44
- Grove township (Shawnee County)1,161
- Groveland township135
- Guelph township350
- Guilford township99
- Guittard township341
- Gypsum Creek township14
- Gypsum township (Saline County)214
- Gypsum township (Sedgwick County)10,158
- Hackberry township253
- Haddam township226
- Hallet township84
- Halstead township347
- Hamlin township156
- Hampden township4
- Hampton-Fairview township257
- Hancock township153
- Hanover township (Lincoln County)39
- Hanover township (Washington County)960
- Happy township9
- Harlan township (Decatur County)39
- Harlan township (Smith County)43
- Harmon township96
- Harmony township41
- Harper township90
- Harrison township (Chautauqua County)88
- Harrison township (Franklin County)438
- Harrison township (Jewell County)7
- Harrison township (Nemaha County)336
- Harrison township (Rice County)57
- Harrison township (Wallace County)99
- Hartland township104
- Harvey township (Cowley County)34
- Harvey township (Smith County)131
- Haskell township2,119
- Haven township1,740
- Hayes township (Clay County)172
- Hayes township (Dickinson County)251
- Hayes township (Franklin County)716
- Hayes township (McPherson County)238
- Hayes township (Mitchell County)11
- Hayes township (Stafford County)328
- Hazelton township115
- Hendricks township107
- Herkimer township328
- Herl township293
- Herzog township1,632
- Hiawatha township584
- Hickory township95
- High Prairie township2,150
- Highland township (Clay County)113
- Highland township (Harvey County)385
- Highland township (Jewell County)42
- Highland township (Lincoln County)95
- Highland township (Morris County)69
- Highland township (Washington County)12
- Highland-District 2 township550
- Highpoint township34
- Hill City township1,597
- Holland township83
- Holmwood township19
- Home township540
- Homestead township15
- Homewood township688
- Hoosier township48
- Hope township500
- Houston township78
- Howard township (Elk County)582
- Howard township (Labette County)225
- Humboldt township153
- Huntsville township127
- Illinois township (Nemaha County)452
- Illinois township (Rush County)18
- Illinois township (Sedgwick County)2,058
- Illinois township (Sumner County)98
- Independence township (Doniphan County)214
- Independence township (Montgomery County)3,027
- Independence township (Osborne County)36
- Independence township (Washington County)31
- Independent township455
- Indian Creek township150
- Indiana township (Graham County)16
- Indiana township (Lincoln County)236
- Ingalls township632
- Iola township932
- Iowa township (Doniphan County)1,585
- Iowa township (Sherman County)107
- Irving township388
- Isbel township101
- Itasca township549
- Ivanhoe township212
- Ivy township267
- Jackson township (Anderson County)405
- Jackson township (Edwards County)35
- Jackson township (Geary County)37
- Jackson township (Jewell County)45
- Jackson township (Lyon County)836
- Jackson township (McPherson County)115
- Jackson township (Osborne County)25
- Jackson township (Riley County)441
- Jackson township (Sumner County)31
- Janesville township336
- Jaqua township4
- Jefferson township (Chautauqua County)657
- Jefferson township (Dickinson County)320
- Jefferson township (Geary County)2,453
- Jefferson township (Jackson County)588
- Jefferson township (Jefferson County)996
- Jefferson township (Rawlins County)21
- Jefferson township (Republic County)138
- Jennings township130
- Jerome township94
- Johnson township38
- Junction township1,175
- Kanwaka township1,386
- Kapioma township131
- Kaw township (Jefferson County)1,212
- Kaw township (Wabaunsee County)85
- Kechi township10,177
- Kendall township (Hamilton County)80
- Kendall township (Kearny County)177
- Kenneth township1,262
- Kentucky township1,775
- Key West township332
- Keystone township104
- Keysville township15
- Kickapoo township1,637
- Kimeo township86
- King City township604
- Kingery township163
- Kingman township162
- Kinsley township63
- Kiowa township915
- Kirwin township145
- La Crosse-Brookdale township1,282
- Labette township557
- Lacey township116
- Ladore township117
- Lafayette township89
- Lake township (Harvey County)174
- Lake township (Scott County)42
- Lakin township (Barton County)348
- Lakin township (Harvey County)484
- Lakin township (Kearny County)2,398
- Lamont township224
- Lancaster township705
- Lane township (Greenwood County)82
- Lane township (Smith County)88
- Langdon township159
- Langley township144
- Larned township320
- Larrabee township49
- Lawrence township (Cloud County)182
- Lawrence township (Osborne County)7
- Lecompton township1,648
- Lees township17
- Lehigh township322
- LeRoy township582
- Lewis township5
- Lexington township (Clark County)54
- Lexington township (Johnson County)1,248
- Liberal township695
- Liberty township (Barton County)126
- Liberty township (Coffey County)544
- Liberty township (Cowley County)49
- Liberty township (Decatur County)74
- Liberty township (Dickinson County)353
- Liberty township (Elk County)155
- Liberty township (Geary County)152
- Liberty township (Jackson County)620
- Liberty township (Kingman County)95
- Liberty township (Labette County)553
- Liberty township (Linn County)1,118
- Liberty township (Marion County)216
- Liberty township (Montgomery County)391
- Liberty township (Osborne County)16
- Liberty township (Republic County)33
- Liberty township (Saline County)125
- Liberty township (Woodson County)170
- Limestone township79
- Lincoln township (Anderson County)136
- Lincoln township (Butler County)257
- Lincoln township (Cloud County)317
- Lincoln township (Coffey County)1,237
- Lincoln township (Crawford County)606
- Lincoln township (Decatur County)197
- Lincoln township (Dickinson County)1,584
- Lincoln township (Edwards County)103
- Lincoln township (Franklin County)916
- Lincoln township (Grant County)6,345
- Lincoln township (Jackson County)1,021
- Lincoln township (Linn County)2,621
- Lincoln township (Marshall County)232
- Lincoln township (Neosho County)297
- Lincoln township (Osage County)183
- Lincoln township (Ottawa County)159
- Lincoln township (Pawnee County)7
- Lincoln township (Pottawatomie County)77
- Lincoln township (Reno County)491
- Lincoln township (Republic County)198
- Lincoln township (Rice County)540
- Lincoln township (Russell County)65
- Lincoln township (Sedgwick County)485
- Lincoln township (Sherman County)25
- Lincoln township (Smith County)83
- Lincoln township (Stafford County)69
- Lincoln township (Washington County)55
- Linn township640
- Little Blue township34
- Little Caney township335
- Little River township1,965
- Little Valley township557
- Little Walnut township1,111
- Llanos township25
- Lockport township495
- Loda township87
- Logan township (Allen County)32
- Logan township (Barton County)140
- Logan township (Butler County)84
- Logan township (Decatur County)6
- Logan township (Dickinson County)177
- Logan township (Edwards County)72
- Logan township (Gray County)190
- Logan township (Lincoln County)9
- Logan township (Marion County)164
- Logan township (Marshall County)389
- Logan township (Meade County)82
- Logan township (Mitchell County)166
- Logan township (Ottawa County)65
- Logan township (Pawnee County)9
- Logan township (Phillips County)619
- Logan township (Sheridan County)84
- Logan township (Sherman County)284
- Logan township (Smith County)33
- Logan township (Washington County)43
- Logansport township10
- Lola township321
- London township572
- Lone Elm township261
- Lone Star township166
- Lone Tree township (McPherson County)693
- Lone Tree township (Pottawatomie County)313
- Long Island township223
- Longton township449
- Lost Springs township109
- Louisburg township533
- Louisville township954
- Lowe township17
- Lowell township629
- Ludell township18
- Lulu township54
- Luray township143
- Lyon township (Cherokee County)401
- Lyon township (Cloud County)124
- Lyon township (Dickinson County)196
- Lyon township (Geary County)330
- Macon township385
- Madison township (Greenwood County)1,099
- Madison township (Lincoln County)161
- Madison township (Riley County)9,271
- Manhattan township1,779
- Manter township220
- Maple Hill township1,219
- Maple township1,037
- Marena township321
- Marion township (Bourbon County)1,583
- Marion township (Doniphan County)64
- Marion township (Douglas County)962
- Marion township (Lincoln County)20
- Marion township (Nemaha County)284
- Marmaton township (Allen County)727
- Marmaton township (Bourbon County)470
- Marquette township635
- Marysville township (Marshall County)145
- Marysville township (Miami County)2,302
- Matfield township68
- May Day township102
- McAdoo township5
- McAllaster township54
- McCamish township965
- McPherson township (McPherson County)621
- McPherson township (Sherman County)10
- Meade Center township1,529
- Medford township170
- Medicine Lodge township2,011
- Medora township1,163
- Medway township11
- Melvern township655
- Menlo township40
- Menno township214
- Menoken township1,673
- Meredith township65
- Meridian township290
- Mertilla township238
- Miami township (Miami County)878
- Miami township (Reno County)373
- Michigan township62
- Middle Creek township1,833
- Milford township1,350
- Mill Creek township (Bourbon County)279
- Mill Creek township (Pottawatomie County)968
- Mill Creek township (Wabaunsee County)170
- Mill Creek township (Washington County)204
- Millbrook township68
- Milton township (Butler County)1,162
- Milton township (Marion County)348
- Mineral township53
- Mingona township11
- Minneha township3,396
- Mirage township43
- Mission Creek township659
- Mission township (Brown County)641
- Mission township (Neosho County)976
- Mission township (Shawnee County)10,074
- Mitchell township (Nemaha County)665
- Mitchell township (Rice County)67
- Monmouth township3,168
- Monroe township159
- Montana township (Jewell County)125
- Montana township (Labette County)57
- Montezuma township1,355
- Monument township138
- Moore township (Barber County)28
- Moore township (Marion County)63
- Morgan township524
- Morlan township55
- Morrill township359
- Morris township16
- Morton township (Ottawa County)414
- Morton township (Pawnee County)9
- Morton township (Sedgwick County)2,792
- Moscow township453
- Mound City township1,307
- Mound township (McPherson County)2,070
- Mound township (Miami County)949
- Mound township (Phillips County)140
- Mound Valley township727
- Mount Ayr township51
- Mount Pleasant township (Atchison County)979
- Mount Pleasant township (Labette County)1,356
- Mulberry township (Clay County)302
- Mulberry township (Ellsworth County)56
- Murdock township623
- Murray township635
- Natoma township434
- Nelson township27
- Nemaha township54
- Neodesha township420
- Neosho Falls township403
- Neosho township (Cherokee County)72
- Neosho township (Coffey County)134
- Neosho township (Labette County)86
- Netawaka township404
- Neuchatel township96
- Nevada township382
- New Gottland township867
- Newark township281
- Newbern township251
- Newbury township1,120
- Newton township2,369
- Ninnescah township (Cowley County)964
- Ninnescah township (Kingman County)195
- Ninnescah township (Reno County)468
- Ninnescah township (Sedgwick County)3,398
- Noble township (Dickinson County)1,788
- Noble township (Ellsworth County)18
- Noble township (Marshall County)106
- North Brown township86
- North Homestead township283
- North Randall township66
- North Roscoe township30
- North Seward township234
- North township (Labette County)559
- North township (Woodson County)39
- Norton township1,076
- Norway township163
- Oak township321
- Oak Valley township101
- Oakland township (Clay County)256
- Oakland township (Cloud County)48
- Oakley township2,094
- Oberlin township28
- Odee township44
- Odessa township137
- Ogallah township260
- Ogden township2,345
- Ohio township (Franklin County)736
- Ohio township (Ness County)226
- Ohio township (Saline County)368
- Ohio township (Sedgwick County)2,157
- Ohio township (Stafford County)234
- Oketo township233
- Olathe township497
- Olive township15
- Olivet township434
- Omnia township255
- Orange township (Lincoln County)28
- Orange township (Pawnee County)41
- Orlando township50
- Osage township (Allen County)252
- Osage township (Bourbon County)128
- Osage township (Crawford County)685
- Osage township (Labette County)1,096
- Osage township (Miami County)998
- Osawatomie township1,055
- Osborne township151
- Oskaloosa township2,058
- Oswego township314
- Ottawa township (Franklin County)675
- Ottawa township (Ottawa County)40
- Otter Creek township173
- Otter township136
- Ottumwa township562
- Overland township60
- Oxford township (Johnson County)2,089
- Oxford township (Sumner County)1,200
- Ozark township498
- Ozawkie township1,405
- Padonia township203
- Painterhood township36
- Palestine township154
- Palmyra township7,758
- Paola township1,021
- Paradise township230
- Paris township522
- Park township7,531
- Parker township984
- Parnell township95
- Paw Paw township43
- Pawnee Rock township498
- Pawnee township (Bourbon County)315
- Pawnee township (Pawnee County)694
- Paxton township18
- Payne township (Gove County)212
- Payne township (Sedgwick County)1,125
- Peabody township1,242
- Penn township134
- Peoria township715
- Perry township79
- Peters township47
- Phillipsburg township206
- Pierceville township410
- Pike township782
- Pioneer township (Graham County)20
- Pioneer township (Rice County)30
- Pioneer township (Rush County)444
- Pittsburg township454
- Plainview township3
- Pleasant Grove township (Greenwood County)37
- Pleasant Grove township (Pawnee County)113
- Pleasant Ridge township185
- Pleasant township (Butler County)5,425
- Pleasant township (Coffey County)577
- Pleasant township (Harvey County)274
- Pleasant township (Lincoln County)534
- Pleasant township (Smith County)4
- Pleasant Valley township (Cowley County)978
- Pleasant Valley township (Decatur County)49
- Pleasant Valley township (Finney County)87
- Pleasant Valley township (Pawnee County)185
- Pleasant Valley township (Saline County)532
- Pleasant Valley township (Wilson County)227
- Pleasant View township294
- Pleasantdale township65
- Plevna township167
- Plum Creek township212
- Plum Grove township690
- Plum township317
- Plumb township582
- Plymouth township200
- Pomona township1,323
- Potosi township2,403
- Pottawatomie township (Coffey County)132
- Pottawatomie township (Franklin County)535
- Pottawatomie township (Pottawatomie County)714
- Powell township67
- Powhattan township767
- Prairie Dog township (Decatur County)3
- Prairie Dog township (Sheridan County)39
- Prairie township (Jewell County)198
- Prairie township (Wilson County)104
- Prairie View township179
- Prospect township2,561
- Protection township663
- Putnam township (Anderson County)155
- Putnam township (Stafford County)7
- Quincy township107
- Raymond township162
- Reading township354
- Red Vermillion township153
- Reeder township549
- Reilly township62
- Reno township (Leavenworth County)1,487
- Reno township (Reno County)4,337
- Republican township1,278
- Rich township494
- Richfield township151
- Richland township (Butler County)2,617
- Richland township (Cowley County)243
- Richland township (Ford County)414
- Richland township (Harvey County)241
- Richland township (Jewell County)47
- Richland township (Kingman County)71
- Richland township (Labette County)133
- Richland township (Marshall County)116
- Richland township (Miami County)2,357
- Richland township (Ottawa County)200
- Richland township (Republic County)219
- Richland township (Stafford County)91
- Richmond township (Franklin County)877
- Richmond township (Nemaha County)561
- Ridge township78
- Ridgeway township2,237
- Rinehart township185
- Risley township322
- River township87
- Riverside township (Sedgwick County)13,323
- Riverside township (Trego County)93
- Robinson township242
- Rocewood township377
- Rochester township158
- Rock Creek township (Butler County)335
- Rock Creek township (Coffey County)912
- Rock Creek township (Cowley County)234
- Rock Creek township (Jefferson County)2,778
- Rock Creek township (Nemaha County)327
- Rock Creek township (Pottawatomie County)559
- Rock Creek township (Wabaunsee County)106
- Rock township168
- Rockford township24,132
- Rockville township30
- Rolla township642
- Rosalia township549
- Roscoe township144
- Rose Creek township166
- Rose Valley township41
- Ross township (Cherokee County)812
- Ross township (Osborne County)777
- Rossville township1,581
- Round Mound township17
- Rovohl township123
- Royal township262
- Rural township (Jefferson County)486
- Rural township (Kingman County)202
- Russell Springs township31
- Russell township23
- Rutland township178
- Ryan township120
- Salamanca township181
- Salem township (Allen County)407
- Salem township (Cowley County)297
- Salem township (Greenwood County)45
- Salem township (Sedgwick County)9,499
- Salt Creek township (Chautauqua County)56
- Salt Creek township (Lincoln County)11
- Salt Creek township (Mitchell County)64
- Salt Creek township (Reno County)604
- Salt Springs township278
- Sand Creek township48
- Santa Fe township213
- Sarcoxie township976
- Sawlog township113
- Sawmill township12
- Scandia township340
- Scott township (Bourbon County)2,705
- Scott township (Lincoln County)96
- Scott township (Linn County)309
- Scott township (Scott County)470
- Scranton township1,287
- Sedan township1,388
- Sedgwick township1,677
- Seventy-Six township427
- Seward township222
- Shannon township (Atchison County)1,247
- Shannon township (Pottawatomie County)322
- Sharon Springs township900
- Sharon township256
- Shawnee township472
- Shell Rock township154
- Sheridan township (Cherokee County)228
- Sheridan township (Cowley County)149
- Sheridan township (Crawford County)1,107
- Sheridan township (Linn County)349
- Sheridan township (Ottawa County)356
- Sheridan township (Sheridan County)372
- Sheridan township (Washington County)65
- Sherlock township3,344
- Sherman township (Clay County)249
- Sherman township (Crawford County)459
- Sherman township (Dickinson County)184
- Sherman township (Ellsworth County)20
- Sherman township (Grant County)566
- Sherman township (Leavenworth County)2,851
- Sherman township (Ottawa County)19
- Sherman township (Pottawatomie County)186
- Sherman township (Riley County)775
- Sherman township (Sedgwick County)2,176
- Sherman township (Washington County)303
- Shiley township19
- Shiloh township449
- Shirley township87
- Sibley township112
- Silver Creek township755
- Silver Lake township1,844
- Silverdale township322
- Sinclair township95
- Sitka township54
- Smith township225
- Smoky Hill township (Geary County)8,996
- Smoky Hill township (McPherson County)277
- Smoky Hill township (Saline County)169
- Smoky township47
- Smoky View township728
- Smolan township605
- Sodville township39
- Soldier township (Jackson County)467
- Soldier township (Shawnee County)15,103
- Solomon Rapids township29
- Solomon township (Cloud County)441
- Solomon township (Graham County)133
- Solomon township (Phillips County)247
- Solomon township (Saline County)421
- Solomon township (Sheridan County)133
- Solomon-District 3 township114
- South Bend township641
- South Brown township66
- South Haven township513
- South Homestead township196
- South Randall township450
- South Roscoe township53
- South Salem township71
- South Seward township21
- South Sharps Creek township185
- Southside township224
- Spearville township1,324
- Spring Creek township (Coffey County)86
- Spring Creek township (Cowley County)51
- Spring Creek township (Greenwood County)98
- Spring Creek township (Pottawatomie County)56
- Spring Creek township (Saline County)297
- Spring Hill township2,041
- Spring township1,266
- Spring Valley township (Cherokee County)1,241
- Spring Valley township (McPherson County)258
- Springbrook township108
- Springdale township828
- St. Bridget township148
- St. Clere township30
- St. George township4,787
- St. John township1,007
- St. Marys township3,932
- Stafford township879
- Stanton township (Linn County)97
- Stanton township (Miami County)809
- Stanton township (Ottawa County)104
- Stanton township (Stanton County)1,651
- Star township141
- Starr township612
- Stateline township258
- Sterling township (Hodgeman County)238
- Sterling township (Rice County)224
- Straight Creek township144
- Stranger township5,286
- Strawberry township61
- Strong township553
- Sugar Creek township383
- Sullivan township318
- Summers township55
- Summit township (Chautauqua County)59
- Summit township (Cloud County)92
- Summit township (Decatur County)88
- Summit township (Marion County)20
- Sumner township (Osborne County)141
- Sumner township (Phillips County)74
- Sumner township (Reno County)458
- Sumner township (Sumner County)101
- Sun City township35
- Superior township (McPherson County)1,681
- Superior township (Osage County)282
- Swan township32
- Swede Creek township216
- Sycamore township (Butler County)427
- Sycamore township (Montgomery County)1,028
- Sylvia township257
- Syracuse township2,095
- Talleyrand township234
- Taloga township1,668
- Tecumseh township7,744
- Ten Mile township1,343
- Terry township241
- Thomas township68
- Tilden township59
- Timberhill township259
- Tioga township926
- Tisdale township239
- Toledo township328
- Tonganoxie township6,203
- Topeka township865
- Toronto township420
- Towanda township (Butler County)2,588
- Towanda township (Phillips County)10
- Township 1 (Harper County)917
- Township 1 (Morris County)446
- Township 1 (Rooks County)116
- Township 2 (Harper County)162
- Township 2 (Morris County)616
- Township 2 (Rooks County)342
- Township 3 (Harper County)190
- Township 3 (Morris County)478
- Township 3 (Rooks County)1,471
- Township 4 (Harper County)70
- Township 4 (Morris County)199
- Township 4 (Rooks County)19
- Township 5 (Harper County)397
- Township 5 (Morris County)513
- Township 5 (Rooks County)35
- Township 6 (Harper County)282
- Township 6 (Morris County)109
- Township 6 (Pratt County)566
- Township 6 (Rooks County)34
- Township 7 (Morris County)285
- Township 7 (Pratt County)255
- Township 7 (Rooks County)161
- Township 8 (Morris County)99
- Township 8 (Pratt County)48
- Township 8 (Rooks County)271
- Township 9 (Morris County)201
- Township 9 (Pratt County)351
- Township 9 (Rooks County)16
- Township 10 (Pratt County)142
- Township 10 (Rooks County)108
- Township 11 (Pratt County)310
- Township 11 (Rooks County)2,137
- Township 12 (Pratt County)878
- Township 12 (Rooks County)103
- Trenton township256
- Trivoli township39
- Troy township55
- Turkey Creek township (McPherson County)191
- Turkey Creek township (Mitchell County)203
- Twin Grove township308
- Union Center township160
- Union township (Barton County)46
- Union township (Butler County)210
- Union township (Clay County)48
- Union township (Dickinson County)170
- Union township (Doniphan County)204
- Union township (Jefferson County)1,976
- Union township (Kingman County)37
- Union township (McPherson County)120
- Union township (Pottawatomie County)93
- Union township (Rawlins County)97
- Union township (Republic County)11
- Union township (Rice County)570
- Union township (Rush County)59
- Union township (Sedgwick County)2,651
- Union township (Sheridan County)37
- Union township (Sherman County)75
- Union township (Stafford County)19
- Union township (Washington County)57
- Valley Brook township1,562
- Valley Center township (Pawnee County)6
- Valley Center township (Sedgwick County)4,843
- Valley township (Barber County)132
- Valley township (Ellsworth County)479
- Valley township (Hodgeman County)63
- Valley township (Kingman County)102
- Valley township (Lincoln County)14
- Valley township (Linn County)134
- Valley township (Miami County)969
- Valley township (Phillips County)74
- Valley township (Reno County)982
- Valley township (Rice County)205
- Valley township (Scott County)177
- Valley township (Sheridan County)111
- Valley township (Smith County)34
- Valverde township36
- Verdigris township173
- Vermillion township850
- Vernon township324
- Vesper township106
- Victor township3
- Victoria township475
- Vienna township41
- Vinita township354
- Viola township606
- Voltaire township278
- Voorhees township141
- Wabaunsee township340
- Waco township857
- Wakarusa township2,313
- WaKeeney township2,206
- Waldo township62
- Walker township591
- Wallace township85
- Walnut Creek township75
- Walnut Grove township420
- Walnut township (Atchison County)198
- Walnut township (Barton County)304
- Walnut township (Bourbon County)82
- Walnut township (Brown County)718
- Walnut township (Butler County)1,168
- Walnut township (Cowley County)826
- Walnut township (Crawford County)607
- Walnut township (Jewell County)5
- Walnut township (Marshall County)219
- Walnut township (Pawnee County)80
- Walnut township (Phillips County)4
- Walnut township (Reno County)13
- Walnut township (Saline County)601
- Walton township (Harvey County)620
- Walton township (Labette County)657
- Walton township (Sumner County)318
- Wamego township5,751
- Wano township1,624
- Waring township61
- Washington township (Anderson County)433
- Washington township (Brown County)478
- Washington township (Chautauqua County)64
- Washington township (Crawford County)3,537
- Washington township (Doniphan County)2,922
- Washington township (Jackson County)623
- Washington township (Jewell County)214
- Washington township (Nemaha County)399
- Washington township (Republic County)82
- Washington township (Saline County)150
- Washington township (Sherman County)79
- Washington township (Wabaunsee County)142
- Washington township (Washington County)108
- Waterloo township140
- Waterville township851
- Wayne township (Doniphan County)201
- Wayne township (Edwards County)528
- Wea township1,522
- Webster township (Smith County)22
- Webster township (Wilson County)34
- Welda township270
- Wellington township148
- Wells township100
- Wendell township81
- Weskan township333
- West Branch township913
- West Center township289
- West Cherry township83
- West Cooper township68
- West Hale township536
- West Hibbard township42
- West Plains township1,211
- West Saline township48
- West Washington township81
- Western township48
- Westminster township255
- Westola township74
- Westphalia township531
- Wetmore township404
- Wheatland township (Barton County)5
- Wheatland township (Dickinson County)62
- Wheatland township (Ford County)94
- White Rock township (Lane County)3
- White Rock township (Republic County)42
- White Rock township (Smith County)13
- White township329
- Whiting township487
- Wilburn township99
- Wilcox township66
- Wildcat township (Elk County)487
- Wildcat township (Riley County)771
- Wildhorse township271
- Williamsburg township646
- Williamsport township4,285
- Willow Springs township1,533
- Willowdale township131
- Wilmington township558
- Wilson township (Ellsworth County)889
- Wilson township (Lane County)26
- Wilson township (Marion County)292
- Wilson township (Rice County)40
- Windsor township90
- Winfield township20
- Wingfield township78
- Winona township271
- Winterset township48
- Wolf River township306
- Yoder township385
- York township1
- Zeandale township172
Consolidated cities
A city and county governed as one, with the towns inside it that keep governments of their own.
School districts
Each of the 286 with people in it, from ACS 2020–2024 5-year estimates.
- Abilene Unified School District 4358,461
- Altoona-Midway Unified School District 3871,702
- Andover Unified School District 38529,031
- Argonia Public Schools Unified School District 359988
- Arkansas City Unified School District 47015,191
- Ashland Unified School District 2201,035
- Atchison County Community Schools Unified School District 3774,595
- Atchison Public Schools Unified School District 40911,518
- Attica Unified School District 511779
- Auburn-Washburn Unified School District 43737,439
- Augusta Unified School District 40212,449
- Baldwin City Unified School District 3489,000
- Barber County North Unified School District 2542,726
- Barnes Unified School District 2232,699
- Basehor-Linwood Unified School District 45815,961
- Baxter Springs Unified School District 5084,538
- Belle Plaine Unified School District 3572,804
- Beloit Unified School District 2734,286
- Blue Valley Unified School District 229135,858
- Blue Valley Unified School District 3841,962
- Bluestem Unified School District 2053,415
- Bonner Springs Unified School District 20414,835
- Brewster Unified School District 314736
- Bucklin Unified School District 4591,233
- Buhler Unified School District 31312,247
- Burlingame Public School Unified School District 4541,715
- Burlington Unified School District 2443,982
- Burrton Unified School District 3691,239
- Caldwell Unified School District 3601,458
- Caney Valley Unified School District 4363,660
- Canton-Galva Unified School District 4192,515
- Cedar Vale Unified School District 285952
- Central Heights Unified School District 2882,885
- Central Plains Unified School District 1122,917
- Central Unified School District 4621,747
- Centre Unified School District 3971,233
- Chanute Public Schools Unified School District 41310,311
- Chaparral Schools Unified School District 3614,600
- Chapman Unified School District 4736,006
- Chase County Unified School District 2842,704
- Chase-Raymond Unified School District 401838
- Chautauqua County Community Unified School District 2862,221
- Cheney Unified School District 2683,945
- Cherokee Unified School District 2473,935
- Cherryvale Unified School District 4474,151
- Chetopa-St. Paul Unified School District 5052,642
- Cheylin Unified School District 1031,329
- Cimarron-Ensign Unified School District 1022,838
- Circle Unified School District 37511,305
- Clay Center Unified School District 3797,873
- Clearwater Unified School District 2646,214
- Clifton-Clyde Unified School District 2241,858
- Coffeyville Unified School District 44511,483
- Colby Public Schools Unified School District 3156,381
- Columbus Unified School District 4936,147
- Comanche County Unified School District 3001,740
- Concordia Unified School District 3336,431
- Conway Springs Unified School District 3562,914
- Copeland Unified School District 476857
- Crest Unified School District 4791,447
- Cunningham Unified School District 3321,247
- De Soto Unified School District 23239,078
- Deerfield Unified School District 2161,035
- Derby Unified School District 26039,269
- Dexter Unified School District 471783
- Dighton Unified School District 4821,041
- Dodge City Unified School District 44331,226
- Doniphan West Unified School District 1112,291
- Douglass Public Schools Unified School District 3963,342
- Durham-Hillsboro-Lehigh Unified School District 4104,129
- Easton Unified School District 4493,602
- El Dorado Unified School District 49013,966
- Elk Valley Unified School District 283790
- Elkhart Unified School District 2181,818
- Ell-Saline Unified School District 3071,501
- Ellinwood Public Schools Unified School District 3552,915
- Ellis Unified School District 3882,653
- Ellsworth Unified School District 3274,575
- Emporia Unified School District 25326,180
- Erie-Galesburg Unified School District 1013,048
- Eudora Unified School District 4917,827
- Eureka Unified School District 3893,997
- Fairfield Unified School District 3102,016
- Flinthills Unified School District 4921,499
- Fort Larned Unified School District 4956,197
- Fort Leavenworth Unified School District 2079,081
- Fort Scott Unified School District 23411,731
- Fowler Unified School District 225823
- Fredonia Unified School District 4843,972
- Frontenac Public Schools Unified School District 2493,958
- Galena Unified School District 4993,140
- Garden City Unified School District 45734,392
- Gardner Edgerton Unified School District 23130,199
- Garnett Unified School District 3656,596
- Geary County Schools Unified School District 47542,835
- Girard Unified School District 2485,247
- Goddard Unified School District 26530,779
- Goessel Unified School District 4111,484
- Golden Plains Unified School District 316717
- Goodland Unified School District 3525,763
- Graham County Unified School District 2812,274
- Great Bend Unified School District 42817,226
- Greeley County Schools Unified School District 2001,304
- Grinnell Public Schools Unified School District 291615
- Halstead Unified School District 4405,200
- Hamilton Unified School District 390368
- Haven Public Schools Unified School District 3126,270
- Haviland Unified School District 474801
- Hays Unified School District 48924,700
- Haysville Unified School District 26123,902
- Healy Public Schools Unified School District 468486
- Herington Unified School District 4872,619
- Hesston Unified School District 4604,265
- Hiawatha Unified School District 4155,627
- Hodgeman County Schools Unified School District 2271,507
- Hoisington Unified School District 4313,367
- Holcomb Unified School District 3633,692
- Holton Unified School District 3365,863
- Hoxie Community Schools Unified School District 4121,987
- Hugoton Public Schools Unified School District 2104,774
- Humboldt Unified School District 2582,818
- Hutchinson Public Schools Unified School District 30831,997
- Independence Unified School District 44612,749
- Ingalls Unified School District 477917
- Inman Unified School District 4482,615
- Iola Unified School District 2578,071
- Jayhawk Unified School District 3463,039
- Jefferson County North Unified School District 3392,413
- Jefferson West Unified School District 3405,063
- Kansas City Unified School District 500117,475
- Kaw Valley Unified School District 3218,070
- Kingman-Norwich Unified School District 3315,575
- Kinsley-Offerle Unified School District 3471,973
- Kiowa County Unified School District 4221,622
- Kismet-Plains Unified School District 4832,685
- Labette County Unified School District 5067,574
- LaCrosse Unified School District 3952,072
- Lakin Unified School District 2152,829
- Lansing Unified School District 46914,584
- Lawrence Unified School District 49799,700
- Leavenworth Unified School District 45327,302
- Lebo-Waverly Unified School District 2432,797
- Leoti Unified School District 4672,117
- Leroy-Gridley Unified School District 2451,566
- Lewis Unified School District 502775
- Liberal Unified School District 48019,964
- Lincoln Unified School District 2982,032
- Little River Unified School District 4441,241
- Logan Unified School District 326928
- Louisburg Unified School District 4168,846
- Lyndon Unified School District 4212,874
- Lyons Unified School District 4053,953
- Macksville Unified School District 3511,214
- Madison-Virgil Unified School District 3861,435
- Maize Unified School District 26642,210
- Manhattan-Ogden Unified School District 38362,572
- Marais des Cygnes Valley Unified School District 4561,498
- Marion-Florence Unified School District 4083,325
- Marmaton Valley Unified School District 2561,531
- Marysville Unified School District 3645,377
- McLouth Unified School District 3423,056
- McPherson Unified School District 41815,850
- Meade Unified School District 2261,717
- Minneola Unified School District 2191,007
- Mission Valley Unified School District 3302,908
- Montezuma Unified School District 3711,474
- Morris County Unified School District 4174,840
- Moscow Public Schools Unified School District 209423
- Moundridge Unified School District 4233,187
- Mulvane Unified School District 2639,616
- Nemaha Unified School District 1154,243
- Neodesha Unified School District 4613,343
- Ness City Unified School District 3031,388
- Newton Unified School District 37322,117
- Nickerson Unified School District 3098,093
- North Jackson Unified School District 3352,353
- North Lyon County Unified School District 2513,299
- North Ottawa County Unified School District 2393,260
- Northeast Unified School District 2464,002
- Northern Valley Unified School District 2121,035
- Norton Community Schools Unified School District 2114,593
- Oakley Unified School District 2742,737
- Oberlin Unified School District 2942,570
- Olathe Unified School District 233165,976
- Onaga-Havensville-Wheaton Unified School District 3221,944
- Osage City Unified School District 4203,650
- Osawatomie Unified School District 3676,405
- Osborne County Unified School District 3922,040
- Oskaloosa Public Schools Unified School District 3413,216
- Oswego Unified School District 5042,177
- Otis-Bison Unified School District 4031,185
- Ottawa Unified School District 29014,561
- Oxford Unified School District 3581,743
- Palco Unified School District 269630
- Paola Unified School District 36812,284
- Paradise Unified School District 399695
- Parsons Unified School District 5038,842
- Pawnee Heights Unified School District 496587
- Peabody-Burns Unified School District 3982,100
- Perry Public Schools Unified School District 3436,215
- Phillipsburg Unified School District 3252,895
- Pike Valley Unified School District 4261,106
- Piper-Kansas City Unified School District 20316,176
- Pittsburg Unified School District 25023,145
- Plainville Unified School District 2702,258
- Pleasanton Unified School District 3442,534
- Prairie Hills Unified School District 1136,159
- Prairie View Unified School District 3626,161
- Pratt Unified School District 3828,059
- Pretty Prairie Unified School District 3111,707
- Quinter Public Schools Unified School District 2931,622
- Rawlins County Unified School District 1052,110
- Remington-Whitewater Unified School District 2063,702
- Renwick Unified School District 26710,040
- Republic County-Hillcrest Rural Schools Unified School District 1093,559
- Riley County Unified School District 3785,033
- Riverside Unified School District 1143,199
- Riverton Unified School District 4043,881
- Rock Creek Unified School District 3236,285
- Rock Hills Unified School District 1072,647
- Rolla Unified School District 217793
- Rose Hill Public Schools Unified School District 3948,128
- Royal Valley Unified School District 3373,805
- Rural Vista Unified School District 4811,908
- Russell County Unified School District 4075,668
- Salina Unified School District 30548,044
- Santa Fe Trail Unified School District 4345,893
- Satanta Unified School District 5071,219
- Scott County Unified School District 4664,965
- Seaman Unified School District 34520,653
- Sedgwick Public Schools Unified School District 4392,011
- Shawnee Heights Unified School District 45021,126
- Shawnee Mission Public Schools Unified School District232,095
- Silver Lake Unified School District 3723,623
- Skyline Schools Unified School District 438954
- Smith Center Unified School District 2372,475
- Smoky Valley Unified School District 4006,418
- Solomon Unified School District 3931,794
- South Barber Unified School District 2551,377
- South Brown County Unified School District 4303,227
- South Haven Unified School District 5091,071
- Southeast of Saline Unified School District 3063,022
- Southern Cloud Unified School District 3341,361
- Southern Lyon County Unified School District 2522,528
- Spearville Unified School District 3811,347
- Spring Hill Unified School District 23022,347
- St. Francis Community Schools Unified School District 2971,677
- St. John-Hudson Unified School District 3501,837
- Stafford Unified School District 3491,092
- Stanton County Unified School District 4522,038
- Sterling Unified School District 3763,022
- Stockton Unified School District 2712,006
- Sublette Unified School District 3742,406
- Sylvan Grove Unified School District 2991,700
- Syracuse Unified School District 4942,471
- Thunder Ridge Unified School District 1101,751
- Tonganoxie Unified School District 46411,637
- Topeka Public Schools Unified School District 50192,750
- Triplains Unified School District 275526
- Troy Public Schools Unified School District 4292,025
- Turner Unified School District 20219,316
- Twin Valley Unified School District 2402,510
- Udall Unified School District 4631,996
- Ulysses Unified School District 2147,201
- Uniontown Unified School District 2352,569
- Valley Center Public Schools Unified School District 26215,943
- Valley Falls Unified School District 3382,564
- Valley Heights Unified School District 4982,173
- Vermillion Unified School District 3802,820
- Victoria Unified School District 4321,701
- Wabaunsee Unified School District 3293,974
- Waconda Unified School District 2722,571
- WaKeeney Unified School District 2082,565
- Wallace County Schools Unified School District 2411,124
- Wamego Unified School District 3207,904
- Washington Co. Schools Unified School District 1082,350
- Wellington Unified School District 3538,757
- Wellsville Unified School District 2894,595
- Weskan Unified School District 242327
- West Elk Unified School District 2821,814
- West Franklin Unified School District 2874,757
- Western Plains Unified School District 1061,272
- Wheatland Unified School District 292711
- Wichita Unified School District 259329,246
- Winfield Unified School District 46514,331
- Woodson Unified School District 3662,729
Congressional districts
As drawn for the 119th Congress (2025–2027).
- Congressional District 1731,585
- Congressional District 2732,657
- Congressional District 3744,760
- Congressional District 4738,195
State senate districts
The upper chamber’s districts, as drawn in 2024.
- State Senate District 172,047
- State Senate District 274,875
- State Senate District 374,030
- State Senate District 472,301
- State Senate District 578,066
- State Senate District 670,525
- State Senate District 775,175
- State Senate District 876,768
- State Senate District 978,556
- State Senate District 1076,771
- State Senate District 1175,348
- State Senate District 1272,966
- State Senate District 1372,553
- State Senate District 1474,578
- State Senate District 1572,288
- State Senate District 1676,761
- State Senate District 1773,341
- State Senate District 1873,346
- State Senate District 1971,796
- State Senate District 2072,593
- State Senate District 2173,210
- State Senate District 2271,946
- State Senate District 2373,836
- State Senate District 2472,113
- State Senate District 2572,787
- State Senate District 2674,410
- State Senate District 2770,336
- State Senate District 2875,276
- State Senate District 2974,070
- State Senate District 3071,300
- State Senate District 3177,431
- State Senate District 3275,923
- State Senate District 3372,586
- State Senate District 3472,808
- State Senate District 3576,177
- State Senate District 3671,383
- State Senate District 3771,464
- State Senate District 3872,431
- State Senate District 3971,342
- State Senate District 4071,684
State house districts
The lower chamber’s districts, as drawn in 2024.
- State House District 123,291
- State House District 222,722
- State House District 324,107
- State House District 423,043
- State House District 525,322
- State House District 621,648
- State House District 723,564
- State House District 822,394
- State House District 924,042
- State House District 1023,486
- State House District 1122,666
- State House District 1222,855
- State House District 1322,461
- State House District 1426,268
- State House District 1521,997
- State House District 1623,306
- State House District 1723,319
- State House District 1823,696
- State House District 1926,099
- State House District 2024,274
- State House District 2122,933
- State House District 2222,703
- State House District 2324,911
- State House District 2423,500
- State House District 2524,549
- State House District 2626,151
- State House District 2723,386
- State House District 2823,979
- State House District 2925,332
- State House District 3023,147
- State House District 3124,305
- State House District 3222,276
- State House District 3323,331
- State House District 3421,911
- State House District 3524,130
- State House District 3626,777
- State House District 3723,086
- State House District 3824,932
- State House District 3923,148
- State House District 4022,801
- State House District 4123,489
- State House District 4223,274
- State House District 4325,061
- State House District 4424,448
- State House District 4524,300
- State House District 4624,110
- State House District 4721,746
- State House District 4824,788
- State House District 4923,448
- State House District 5023,460
- State House District 5123,003
- State House District 5223,328
- State House District 5321,420
- State House District 5421,939
- State House District 5523,656
- State House District 5624,860
- State House District 5724,872
- State House District 5822,068
- State House District 5923,012
- State House District 6022,918
- State House District 6121,529
- State House District 6223,616
- State House District 6323,711
- State House District 6422,170
- State House District 6522,435
- State House District 6625,871
- State House District 6723,773
- State House District 6825,303
- State House District 6924,201
- State House District 7022,533
- State House District 7123,301
- State House District 7222,808
- State House District 7324,205
- State House District 7422,907
- State House District 7523,511
- State House District 7623,375
- State House District 7724,197
- State House District 7822,763
- State House District 7923,658
- State House District 8023,853
- State House District 8122,744
- State House District 8223,848
- State House District 8324,000
- State House District 8424,308
- State House District 8524,297
- State House District 8624,404
- State House District 8723,245
- State House District 8824,069
- State House District 8925,263
- State House District 9024,408
- State House District 9125,905
- State House District 9224,021
- State House District 9322,625
- State House District 9422,548
- State House District 9522,909
- State House District 9622,877
- State House District 9726,168
- State House District 9823,445
- State House District 9923,796
- State House District 10023,152
- State House District 10124,367
- State House District 10224,664
- State House District 10322,996
- State House District 10421,790
- State House District 10522,283
- State House District 10623,088
- State House District 10724,138
- State House District 10824,117
- State House District 10922,966
- State House District 11021,876
- State House District 11124,418
- State House District 11221,747
- State House District 11323,955
- State House District 11423,887
- State House District 11523,503
- State House District 11623,361
- State House District 11725,528
- State House District 11823,245
- State House District 11923,595
- State House District 12023,030
- State House District 12122,458
- State House District 12223,333
- State House District 12322,188
- State House District 12423,152
- State House District 12522,712
PUMAs
Public Use Microdata Areas: areas of 100,000 people or more that the state draws from census tracts, for the Census Bureau’s microdata.
- Central Kansas–Hutchinson City PUMA101,108
- Douglas County–Lawrence City PUMA120,302
- Flint Hills Region–Emporia City PUMA134,262
- Johnson County (Northeast)–Overland Park (North), Prairie Village & Merriam PUMA156,041
- Johnson County (Northwest)–Shawnee, Lenexa & De Soto Cities PUMA126,885
- Johnson County (Southeast)–Blue Valley Region PUMA160,575
- Johnson County (Southwest)–Olathe, Gardner, Spring Hill & Edgerton Cities PUMA177,130
- Leavenworth, Miami & Linn County PUMA127,828
- North Central Kansas–Salina City PUMA143,188
- Northwest Kansas PUMA106,252
- Riley, Geary & Pottawatomie Counties–Manhattan City PUMA133,965
- Sedgwick (Northeast) & Butler (North & East) Counties–Wichita City (Northeast) PUMA169,903
- Sedgwick (Northwest) & Harvey Counties–Wichita (Northwest) & Newton Cities PUMA169,343
- Sedgwick (South) & Butler (Southwest) Counties–Wichita (South) & Derby Cities PUMA173,029
- Sedgwick County (Central)–Wichita City (Central) PUMA117,994
- Shawnee (Outside Topeka City) & Northeast Kansas PUMA135,137
- Shawnee County (Central)–Topeka City PUMA130,385
- South Central Kansas PUMA107,825
- Southeast Kansas PUMA154,501
- Southwest Kansas–Dodge City, Garden City & Liberal City PUMA133,890
- Wyandotte County–Kansas City PUMA167,654
Urban areas
Each that reaches into Kansas, with its whole population. Urban areas are the densely settled land the Census Bureau draws after each census, whatever the city lines.
- Abilene, KS6,728
- Arkansas City, KS11,744
- Atchison, KS10,761
- Augusta, KS9,229
- Chanute, KS8,648
- Clay Center, KS4,132
- Coffeyville, KS–OK9,301
- Colby, KS5,272
- Concordia, KS4,973
- Dodge City, KS27,222
- El Dorado, KS12,413
- Emporia, KS24,105
- Eudora, KS6,163
- Fort Scott, KS7,503
- Garden City, KS30,312
- Goodland, KS4,203
- Great Bend, KS14,433
- Hays, KS22,002
- Hutchinson, KS41,959
- Independence, KS8,466
- Iola, KS5,749
- Junction City, KS40,300
- Kansas City, MO–KS1.69M
- Larned, KS3,423
- Lawrence, KS96,218
- Leavenworth, KS47,527
- Liberal, KS19,316
- Manhattan, KS60,920
- McPherson, KS13,922
- Newton, KS20,505
- Ottawa, KS12,607
- Paola, KS5,532
- Parsons, KS9,345
- Pittsburg, KS22,443
- Pratt, KS6,577
- Russell, KS3,806
- Salina, KS45,592
- Spring Hill, KS7,573
- St. Joseph, MO–KS75,724
- Tonganoxie, KS5,807
- Topeka, KS148,534
- Ulysses, KS5,520
- Wamego, KS4,477
- Wellington, KS6,986
- Wichita, KS504,847
- Winfield, KS11,663
Tribal areas
Each that reaches into Kansas, with its whole population.
Turn Kansas into your planning report.
Social Explorer Studio builds an editable profile of any place, with tables and charts beside the county and state, and exports to Word, PDF and Excel.
Questions about Kansas
What is the population of Kansas?
2,977,222 people, according to the ACS 2025 1-year estimates, which the Census Bureau adjusts to match its own population estimate. That’s the 34th largest of the 50 states and DC.
What is the FIPS code for Kansas?
20. Every county’s and place’s FIPS code in Kansas starts with it. The Census Bureau’s full geographic identifier (GEOID) is 0400000US20.
What is the largest city in Kansas?
Wichita, with 400,989 people. Other large cities here include Overland Park, Kansas City and Olathe.
What is the median household income in Kansas?
$77,824 (±$1,333), according to the ACS 2025 1-year estimates, lower than the US ($84,780).
What is the median age in Kansas?
38.4 years (±0.3), according to the ACS 2025 1-year estimates, lower than the US (39.5).
How much does housing cost in Kansas?
Kansas’s median home value is $252,600 (±$4,302) and its median gross rent is $1,134 (±$15) a month, according to the ACS 2025 1-year estimates. 40.1% (±1.9%) of its renters pay 30% or more of their income on rent.
Is Kansas growing?
Kansas’s population grew 2.3%, from 2,911,641 in 2015 to 2,977,222 in 2025, according to the ACS 1-year estimates.
Where do people who work in Kansas live?
1,248,210 of its 1,408,766 jobs are held by people who live here. Of those who commute in, the most come from Missouri, Oklahoma, Nebraska.
Where does this census data come from?
The U.S. Census Bureau’s American Community Survey, through Social Explorer’s tables: the latest 1-year estimates where they exist, for the most recent numbers, and 5-year estimates otherwise. Each table lists its code, so you can find it again.
Is this data free to use?
Yes. You can read it, cite it, download the CSV and embed the charts, with no account. To map other variables, compare your own areas or build a report, see Social Explorer’s plans in a live demo.
Sources and how to cite
American Community Survey 2025 1-year estimates, or 2020–2024 5-year estimates where noted, U.S. Census Bureau, from Social Explorer’s tables A00001, A00002, A01004, A04001, A06001, A08001, A09005, A10001, A10003, A10008, A10030, A10036, A10040, A10047, A10055, A10060, A12001, A13004, A14006, A14024, A14028, A16002, A17005, A18002, A18009, A20001, B02002, B09001, B13002, B18101, C16001. Maps by census tract use 2020–2024 5-year estimates, since the 1-year survey doesn’t cover tracts. Commuting: LEHD LODES 2023. These are estimates from a sample, each with its margin of error. Data retrieved November 14, 2026. How these profiles are made.
U.S. Census Bureau, American Community Survey 2025 1-year estimates, or 2020–2024 5-year estimates where noted, via Social Explorer. “Kansas.” https://www.socialexplorer.com/places/kansas. Accessed November 14, 2026.