

Texas: Population, demographics and census data
Home to 31,709,821 people, the 2nd largest of the 50 states and DC, anchored by Houston. It grew 15.4% between 2015 and 2025.
- Population
- 31.71M. Census Bureau estimate · Rank 2 of the 50 states and DC
- Median household income
- $82,625 ±$670. US $84,780
- Median age
- 36.2 ±0.2. US 39.5
ACS 2025 1-year estimates, U.S. Census Bureau
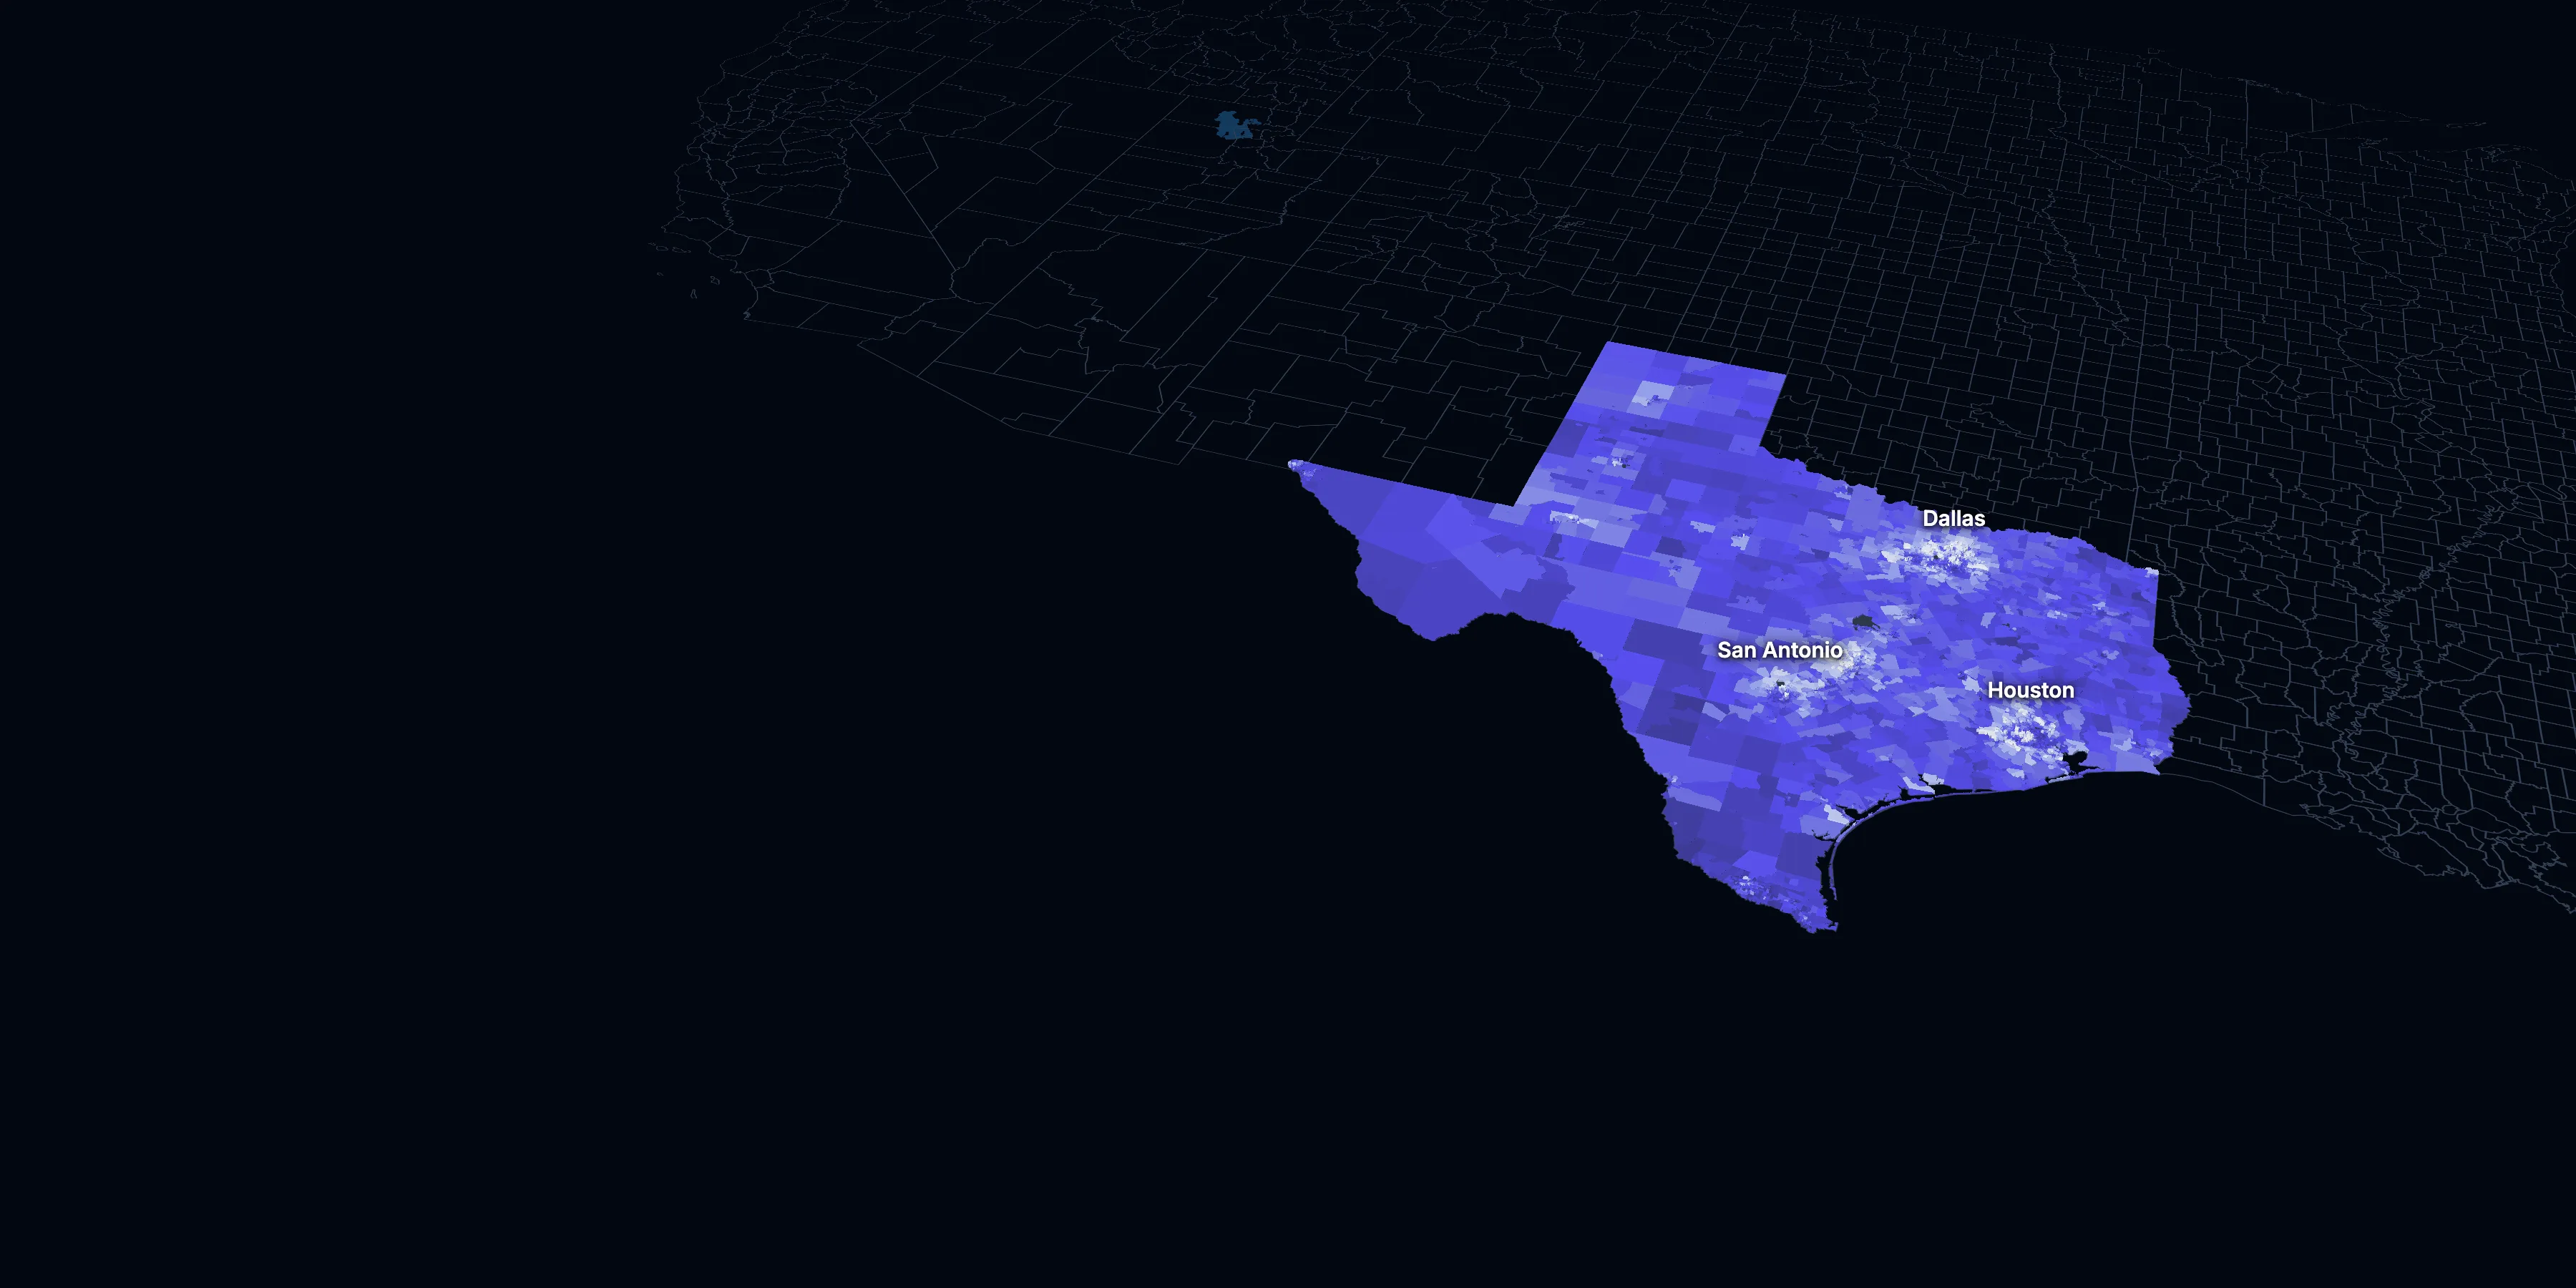
Taller, lighter tracts have higher household incomes
About Texas
Texas’s median household income is $82,625 (±$670), lower than the US ($84,780), and its median age is 36.2 (±0.2), according to the ACS 2025 1-year estimates. Its largest city is Houston.
± is each figure’s margin of error, at 90% confidence, and † marks one too uncertain to lean on. Under each percentage in the tables is the number it counts. How the margins are worked out.
FIPS code 48
Highlights
What stands out in Texas
The numbers where Texas sits furthest from the nation, or past a recognized policy benchmark.
Past a policy benchmark
+10 points
HighRent growth ahead of income
After inflation, rent grew 19% from 2015 to 2025, and household income 8%. The dots show rent growth.
5.2%
ElevatedUnemployment rate
That’s higher than the US (4.9%). The Department of Labor uses 6% as its floor for a labor surplus area.
Furthest from the national picture
16.5%
Highest among statesNo health insurance
That’s higher than the US (8.4%). It’s the highest of the 50 states and DC.
14.9%
3rd lowest among states65 and over
That’s lower than the US (19.0%). It’s the 3rd lowest of the 50 states and DC.
23.9%
2nd among statesUnder 18
That’s higher than the US (21.0%). It’s the 2nd highest of the 50 states and DC.
36.2
3rd lowest among statesMedian age
That’s lower than the US (39.5). It’s the 3rd lowest of the 50 states and DC.
2015 to 2025
How Texas changed in ten years
The state added 4,240,707 people. It got older, more foreign-born and better educated, and poverty fell 3.2 points.
Population, change since 2015
+15.4% in the state and +6.3% in the US.
Source: ACS 1-year, 2015 to 2025, table A00001.
Show data
| Texas | United States | |
|---|---|---|
| 2015 | 0.0% | 0.0% |
| 2016 | +1.4% | +0.5% |
| 2017 | +3.0% | +1.3% |
| 2018 | +4.5% | +1.8% |
| 2019 | +5.6% | +2.1% |
| 2021 | +7.5% | +3.3% |
| 2022 | +9.3% | +3.7% |
| 2023 | +11.0% | +4.2% |
| 2024 | +13.9% | +5.8% |
| 2025 | +15.4% | +6.3% |
Embed
Median household income, in 2025 dollars
+8.4% in the state and +10.9% in the US.
Source: ACS 1-year, 2015 to 2025, table A14006.
Show data
| Texas | United States | |
|---|---|---|
| 2015 | $76,246 | $76,413 |
| 2016 | $76,508 | $77,931 |
| 2017 | $78,395 | $79,891 |
| 2018 | $78,368 | $80,059 |
| 2019 | $81,297 | $83,427 |
| 2021 | $80,221 | $83,521 |
| 2022 | $80,074 | $82,811 |
| 2023 | $80,621 | $82,683 |
| 2024 | $82,393 | $84,339 |
| 2025 | $82,625 | $84,780 |
Embed
Living in poverty
−3.2 points in the state and −3.0 points in the US.
Source: ACS 1-year, 2015 to 2025, table A13004.
Show data
| Texas | United States | |
|---|---|---|
| 2015 | 15.9% | 14.7% |
| 2016 | 15.6% | 14.0% |
| 2017 | 14.7% | 13.4% |
| 2018 | 14.9% | 13.1% |
| 2019 | 13.6% | 12.3% |
| 2021 | 14.2% | 12.8% |
| 2022 | 14.0% | 12.6% |
| 2023 | 13.7% | 12.5% |
| 2024 | 13.4% | 12.1% |
| 2025 | 12.7% | 11.8% |
Embed
Bachelor’s degree or more
+7.2 points in the state and +6.7 points in the US.
Source: ACS 1-year, 2015 to 2025, table A12001.
Show data
| Texas | United States | |
|---|---|---|
| 2015 | 28.4% | 30.6% |
| 2016 | 28.9% | 31.3% |
| 2017 | 29.6% | 32.0% |
| 2018 | 30.3% | 32.6% |
| 2019 | 30.8% | 33.1% |
| 2021 | 33.1% | 35.0% |
| 2022 | 33.9% | 35.7% |
| 2023 | 34.2% | 36.2% |
| 2024 | 35.2% | 36.8% |
| 2025 | 35.5% | 37.4% |
Embed
Median gross rent, in 2025 dollars
+18.6% in the state and +18.5% in the US.
Source: ACS 1-year, 2015 to 2025, table A18009.
Show data
| Texas | United States | |
|---|---|---|
| 2015 | $1,277 | $1,314 |
| 2016 | $1,293 | $1,327 |
| 2017 | $1,307 | $1,340 |
| 2018 | $1,352 | $1,368 |
| 2019 | $1,385 | $1,393 |
| 2021 | $1,398 | $1,427 |
| 2022 | $1,429 | $1,440 |
| 2023 | $1,503 | $1,496 |
| 2024 | $1,524 | $1,537 |
| 2025 | $1,515 | $1,557 |
Embed
Median home value, in 2025 dollars
+52.8% in the state and +39.3% in the US.
Source: ACS 1-year, 2015 to 2025, table A10036.
Show data
| Texas | United States | |
|---|---|---|
| 2015 | $208,243 | $266,469 |
| 2016 | $218,441 | $277,278 |
| 2017 | $228,010 | $288,124 |
| 2018 | $240,422 | $296,908 |
| 2019 | $254,425 | $305,336 |
| 2021 | $284,404 | $337,116 |
| 2022 | $305,078 | $355,481 |
| 2023 | $315,865 | $361,931 |
| 2024 | $323,696 | $372,685 |
| 2025 | $318,100 | $371,100 |
Embed
ACS 1-year estimates. The dotted stretch of each line spans 2020, when the Census Bureau released no standard 1-year estimates. Dollar values are in 2025 dollars.
| Indicator | 2015 | 2025 | Change |
|---|---|---|---|
| Population | 27,469,114 | 31,709,821 | +15.4% |
| Median age | 34.4 | 36.2 | +1.8 years |
| 65 and over | 11.7% | 14.9% | +3.2 points |
| Born outside the US | 17.0% | 18.5% | +1.4 points |
| Hispanic or Latino | 38.9% | 40.9% | +2.0 points |
| Median household income | $76,246 | $82,625 | +8.4% |
| Living in poverty | 15.9% | 12.7% | −3.2 points |
| Bachelor’s degree or more | 28.4% | 35.5% | +7.2 points |
| Households that rent | 38.9% | 37.3% | −1.6 points |
| Median gross rent | $1,277 | $1,515 | +18.6% |
| Median home value | $208,243 | $318,100 | +52.8% |
6896 census tracts
Texas, tract by tract
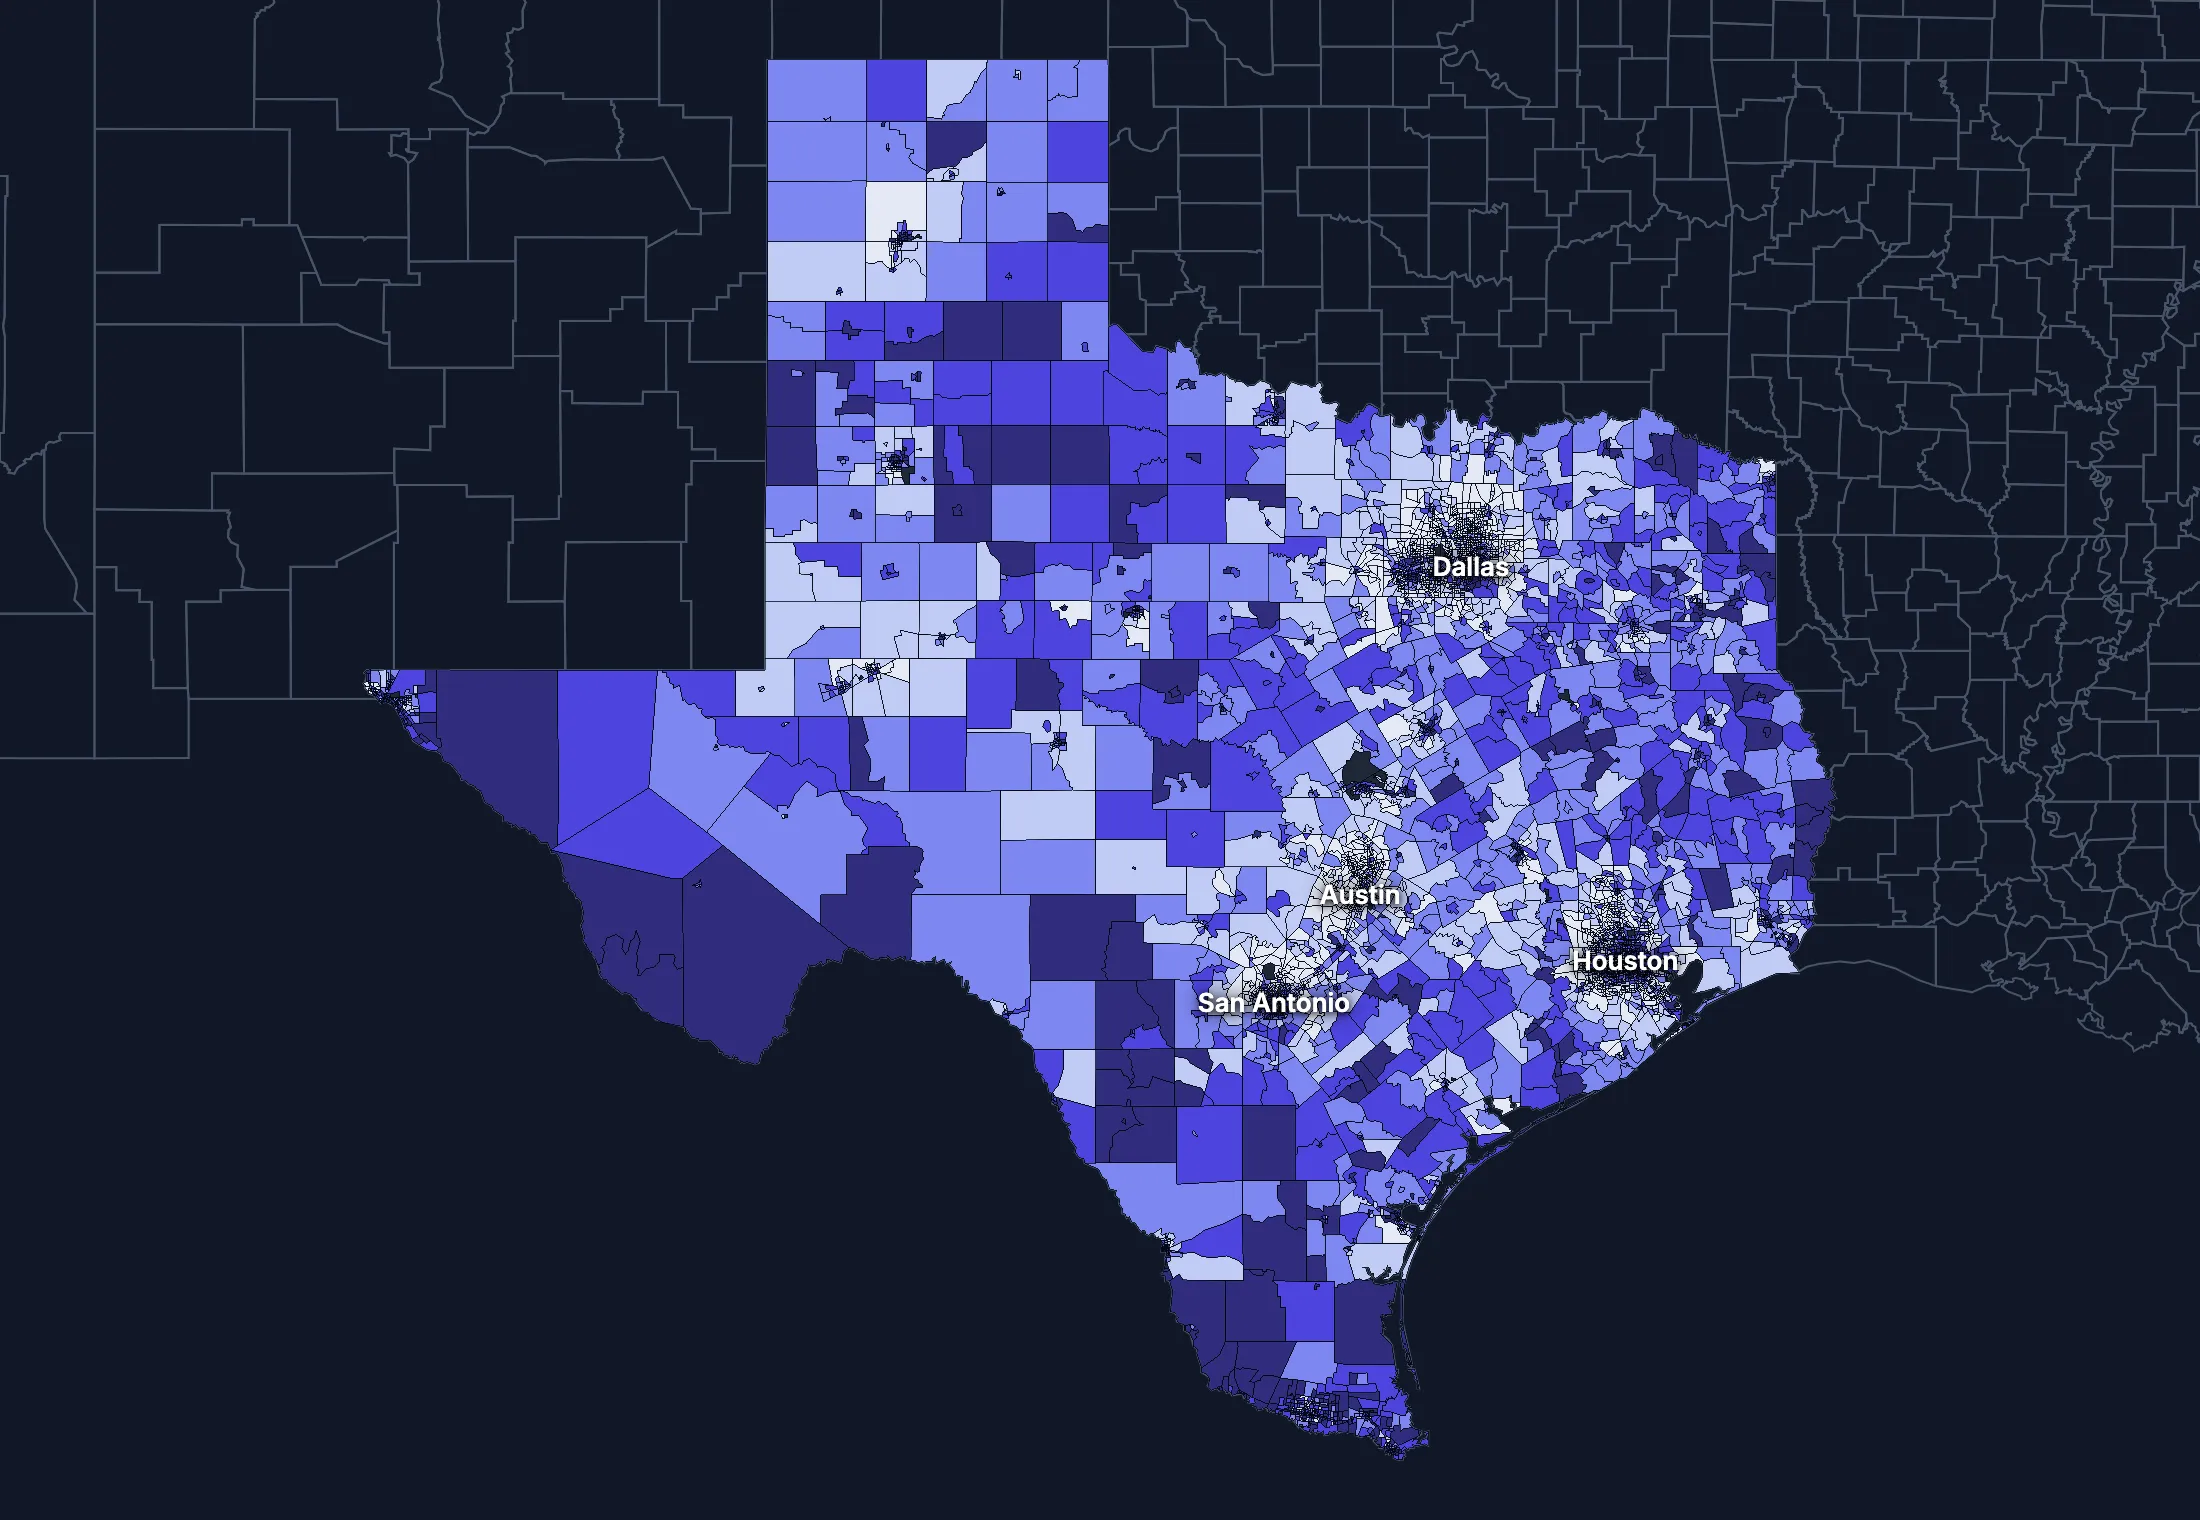
State averages hide a lot. These census tracts are the closest the census comes to neighborhoods.
Where the state’s average misleads
Each tick is one census tract, and the dark line marks the state. Hover over a tick or tap it to see the tract.
Poverty
1707 of 6828 tracts are at least 1.5 times the state’s overall 13.8%, and 2492 are at two-thirds of it or less.
Highest: Tract 9504.02, 100.0%. Lowest: Tract 9504.01, 0.0%.
Renters paying 30% or more of income
440 of 6600 tracts are at least 1.5 times the state’s overall 48.5%, and 1534 are at two-thirds of it or less.
Highest: Tract 3107.08, 100.0%. Lowest: Tract 9505.01, 0.0%.
Adults with a bachelor’s degree
1358 of 6842 tracts are at least 1.5 times the state’s overall 33.8%, and 2871 are at two-thirds of it or less.
Highest: Tract 6.06, 97.4%. Lowest: Tract 1607.01, 0.0%.
Median household income
1317 of 6808 tracts are at least 1.5 times the typical tract’s $73,285, and 1225 are at two-thirds of it or less.
Highest: Tract 1204.02, $250,000 or more. Lowest: Tract 33, under $2,500.
American Community Survey 2020–2024 5-year estimates, by census tract. Income is capped at $250,000+ by the Census Bureau.
People
Who lives in Texas
Its median age of 36.2 is lower than the US (39.5). 18.5% of residents were born outside the US, and 35.4% speak a language other than English at home.
Age
Source: ACS 2025 1-year, table A01001.
Show data
| Texas | United States | |
|---|---|---|
| Under 18 | 23.9% ±0.1% , number 7,570,172 ±42,920 | 21.0% ±<0.1% , number 71,689,151 ±111,800 |
| 18 to 24 | 9.8% ±0.1% , number 3,117,790 ±33,670 | 9.3% ±<0.1% , number 31,716,680 ±98,660 |
| 25 to 34 | 14.5% ±0.1% , number 4,611,665 ±16,650 | 13.6% ±<0.1% , number 46,357,354 ±55,690 |
| 35 to 44 | 14.0% ±0.1% , number 4,442,644 ±37,060 | 13.4% ±<0.1% , number 45,746,189 ±105,700 |
| 45 to 54 | 12.1% ±<0.1% , number 3,828,887 ±15,110 | 11.8% ±<0.1% , number 40,257,563 ±53,540 |
| 55 to 64 | 10.8% ±0.1% , number 3,412,235 ±32,330 | 12.1% ±<0.1% , number 41,242,904 ±104,700 |
| 65 to 74 | 8.8% ±0.1% , number 2,802,569 ±26,950 | 10.8% ±<0.1% , number 36,895,650 ±91,520 |
| 75 and over | 6.1% ±0.1% , number 1,923,859 ±20,970 | 8.2% ±<0.1% , number 27,879,368 ±78,140 |
Embed
Race and ethnicity
Source: ACS 2025 1-year, table A04001.
Show data
| Texas | United States | |
|---|---|---|
| White, not Hispanic | 36.4% ±0.1% , number 11,557,356 ±16,520 | 55.0% ±<0.1% , number 187,959,031 ±58,340 |
| Hispanic or Latino | 40.9% ±<0.1% , number 12,967,096 ±321 | 20.5% ±<0.1% , number 69,975,516 ±13,270 |
| Black, not Hispanic | 11.7% ±0.1% , number 3,712,994 ±24,680 | 11.7% ±<0.1% , number 40,096,453 ±106,200 |
| Asian, not Hispanic | 6.3% ±0.1% , number 2,000,158 ±17,680 | 6.5% ±<0.1% , number 22,096,709 ±58,340 |
| Other or multiracial | 4.6% ±0.1% , number 1,472,217 ±37,170 | 6.3% ±<0.1% , number 21,657,150 ±150,100 |
Embed
Language spoken at home
Source: ACS 2025 1-year, table C16001.
Show data
| Texas | United States | |
|---|---|---|
| English only | 64.6% ±0.2% , number 19,204,634 ±66,740 | 77.1% ±0.1% , number 249,390,588 ±275,300 |
| Spanish | 27.6% ±0.2% , number 8,209,568 ±60,660 | 13.9% ±0.1% , number 44,921,985 ±177,800 |
| Other Indo-European | 2.9% ±0.1% , number 856,280 ±31,000 | 4.0% ±<0.1% , number 12,862,980 ±113,500 |
| Asian and Pacific Island | 3.7% ±0.1% , number 1,085,700 ±34,490 | 3.8% ±<0.1% , number 12,288,841 ±99,740 |
| Arabic and other | 1.3% ±0.1% , number 380,314 ±27,830 | 1.3% ±<0.1% , number 4,116,949 ±71,480 |
Embed
Marital status
Source: ACS 2025 1-year, table A11001.
Show data
| Texas | United States | |
|---|---|---|
| Now married | 48.9% ±0.2% , number 12,451,831 ±59,700 | 47.9% ±0.1% , number 135,567,564 ±223,300 |
| Never married | 34.7% ±0.2% , number 8,829,006 ±45,390 | 34.8% ±0.1% , number 98,647,238 ±152,600 |
| Divorced | 9.8% ±0.1% , number 2,486,888 ±35,510 | 10.2% ±<0.1% , number 28,879,967 ±112,900 |
| Widowed | 4.8% ±0.1% , number 1,224,676 ±19,900 | 5.5% ±<0.1% , number 15,599,094 ±69,430 |
| Separated | 1.9% ±0.1% , number 485,035 ±16,110 | 1.6% ±<0.1% , number 4,441,399 ±49,160 |
Embed
Where people lived a year ago
Source: ACS 2025 1-year, table A08001.
Show data
| Texas | United States | |
|---|---|---|
| Same home | 86.2% ±0.2% , number 27,009,094 ±78,360 | 88.4% ±0.1% , number 298,889,697 ±214,800 |
| Same county | 7.3% ±0.2% , number 2,296,811 ±61,660 | 6.0% ±<0.1% , number 20,202,671 ±166,300 |
| Another county in the state | 3.9% ±0.1% , number 1,226,070 ±41,930 | 3.0% ±<0.1% , number 10,168,097 ±89,190 |
| Another state | 1.8% ±0.1% , number 554,655 ±30,090 | 2.1% ±<0.1% , number 7,025,589 ±81,660 |
| Another country | 0.8% ±0.1% , number 235,308 ±17,590 | 0.6% ±<0.1% , number 1,984,943 ±47,210 |
Embed
Top countries of birth, among those born abroad
Source: ACS 2025 1-year, table A07001.
Show data
| Texas | |
|---|---|
| Mexico | 39.9% , number 2,335,699 |
| India | 8.3% , number 487,209 |
| El Salvador | 4.0% , number 233,000 |
| Vietnam | 3.7% , number 215,206 |
| Venezuela | 3.7% , number 214,257 |
| Honduras | 3.4% , number 196,020 |
Embed
All the numbers
| Indicator | Texas | US | Rank among states* | Table |
|---|---|---|---|---|
| Population | 31,709,821 | 341,784,859 | 2nd | A00001 |
| People per square mile | 121 | 97 | 24th | A00002 |
| Land area (square miles) | 261,260 | – | – | A00002 |
| Median age | 36.2 ±0.2 | 39.5 ±0.1 | 49th | A01004 |
| Under 18 | 23.9% ±0.1% , number 7,570,172 ±42,920 | 21.0% ±<0.1% , number 71,689,151 ±111,800 | 2nd | B02002 |
| 65 and over | 14.9% ±0.1% , number 4,726,428 ±34,150 | 19.0% ±<0.1% , number 64,775,018 ±120,300 | 49th | B02002 |
| Born outside the US | 18.5% ±0.2% , number 5,850,851 ±62,990 | 14.7% ±0.1% , number 50,409,320 ±204,800 | 8th | A06001 |
| Speak a language other than English at home | 35.4% ±0.2% , number 10,531,862 ±81,270 | 22.9% ±0.1% , number 74,190,755 ±244,000 | 2nd | C16001 |
| Veterans (adults) | 6.0% ±0.1% , number 1,446,930 ±27,630 | 5.9% ±<0.1% , number 15,746,228 ±85,320 | 36th | A16002 |
| Living with a disability | 12.8% ±0.1% , number 4,005,363 ±41,990 | 13.7% ±<0.1% , number 46,271,455 ±126,000 | 40th | B18101 |
| Women 15–50 who had a baby in the past year | 5.5% ±0.2% , number 436,120 ±14,870 | 5.0% ±0.1% , number 4,016,759 ±44,040 | 13th | B13002 |
| Lived in the same home a year ago | 86.2% ±0.2% , number 27,009,094 ±78,360 | 88.4% ±0.1% , number 298,889,697 ±214,800 | 40th | A08001 |
| White, not Hispanic | 36.4% ±0.1% , number 11,557,356 ±16,520 | 55.0% ±<0.1% , number 187,959,031 ±58,340 | 47th | A04001 |
| Hispanic or Latino | 40.9% ±<0.1% , number 12,967,096 ±321 | 20.5% ±<0.1% , number 69,975,516 ±13,270 | 3rd | A04001 |
| Black, not Hispanic | 11.7% ±0.1% , number 3,712,994 ±24,680 | 11.7% ±<0.1% , number 40,096,453 ±106,200 | 19th | A04001 |
| Asian, not Hispanic | 6.3% ±0.1% , number 2,000,158 ±17,680 | 6.5% ±<0.1% , number 22,096,709 ±58,340 | 12th | A04001 |
*1 is the highest. Population is ranked among all states, and the rest among those of 1,000 people or more, whose figures can be ranked. Ranks use 5-year estimates, the only ones covering every state, so they can differ slightly from the figures here.
Income and work
Typical incomes, but a wide coverage gap
The median household income is $82,625, lower than the US ($84,780). 12.7% of people live in poverty, and 16.5% have no health insurance, higher than the US (8.4%).
Household income
Source: ACS 2025 1-year, table A14001.
Show data
| Texas | United States | |
|---|---|---|
| Under $25,000 | 13.7% ±0.3% , number 1,589,399 ±29,440 | 14.0% ±0.1% , number 18,727,548 ±88,990 |
| $25,000 to $49,999 | 15.9% ±0.3% , number 1,841,457 ±31,870 | 15.4% ±0.1% , number 20,665,585 ±101,400 |
| $50,000 to $74,999 | 16.0% ±0.3% , number 1,855,267 ±32,550 | 15.3% ±0.1% , number 20,513,565 ±88,500 |
| $75,000 to $99,999 | 12.7% ±0.2% , number 1,473,610 ±23,380 | 12.5% ±0.1% , number 16,814,245 ±87,520 |
| $100,000 to $149,999 | 17.8% ±0.3% , number 2,066,817 ±30,040 | 17.9% ±0.1% , number 24,018,984 ±99,670 |
| $150,000 to $199,999 | 10.1% ±0.2% , number 1,169,409 ±23,100 | 10.1% ±0.1% , number 13,521,827 ±70,660 |
| $200,000 or more | 13.9% ±0.2% , number 1,611,315 ±23,420 | 14.8% ±0.1% , number 19,801,668 ±84,120 |
Embed
What residents do for work
Source: ACS 2025 1-year, table A17004.
Show data
| Texas | United States | |
|---|---|---|
| Education and health care | 22.3% ±0.2% , number 3,447,108 ±36,620 | 24.4% ±0.1% , number 40,862,193 ±140,800 |
| Professional and business services | 13.2% ±0.2% , number 2,043,107 ±31,250 | 12.8% ±0.1% , number 21,375,231 ±87,110 |
| Retail trade | 11.0% ±0.2% , number 1,694,139 ±34,660 | 10.6% ±0.1% , number 17,781,181 ±96,660 |
| Manufacturing | 8.8% ±0.2% , number 1,362,251 ±26,910 | 9.6% ±0.1% , number 16,064,394 ±91,270 |
| Arts, food and lodging | 8.5% ±0.2% , number 1,306,757 ±34,560 | 8.9% ±0.1% , number 14,811,502 ±87,840 |
| Construction | 8.2% ±0.2% , number 1,264,717 ±26,060 | 6.7% ±<0.1% , number 11,254,981 ±79,620 |
| Finance, insurance and real estate | 7.1% ±0.1% , number 1,102,720 ±21,970 | 6.6% ±<0.1% , number 11,025,569 ±68,570 |
| Transportation and warehousing | 6.7% ±0.2% , number 1,028,467 ±25,240 | 5.9% ±<0.1% , number 9,832,211 ±73,020 |
Embed
Where workers come from and go
Texas has 13,543,073 jobs and 13,543,462 employed residents. 207,970 people commute in to work and 208,359 commute out, while 13,335,103 both live and work here. The most commuters come from Louisiana.
Most commuters come from
- Louisiana: 32,912
- New Mexico: 30,685
- Oklahoma: 28,288
Most residents commute to
- California: 30,787
- Louisiana: 29,165
- New Mexico: 25,286
Show data
| Texas | |
|---|---|
| Live and work here | 13,335,103 |
| Work here, live elsewhere | 207,970 |
| Live here, work elsewhere | 208,359 |
Embed
All the numbers
| Indicator | Texas | US | Rank among states* | Table |
|---|---|---|---|---|
| Median household income | $82,625 ±$670 | $84,780 ±$215 | 22nd | A14006 |
| Income per person | $43,008 ±$282 | $47,171 ±$115 | 35th | A14024 |
| Income inequality (Gini index) | 0.478 ±0.003 | 0.482 ±0.001 | 13th | A14028 |
| Living in poverty | 12.7% ±0.3% , number 3,944,498 ±84,250 | 11.8% ±0.1% , number 39,264,183 ±277,400 | 12th | A13004 |
| Unemployment rate | 5.2% ±0.2% , number 849,725 ±24,660 | 4.9% ±<0.1% , number 8,574,594 ±64,350 | 16th | A17005 |
| No health insurance | 16.5% ±0.2% , number 5,162,677 ±57,400 | 8.4% ±<0.1% , number 28,323,306 ±152,000 | 1st | A20001 |
*1 is the highest. Population is ranked among all states, and the rest among those of 1,000 people or more, whose figures can be ranked. Ranks use 5-year estimates, the only ones covering every state, so they can differ slightly from the figures here.
Education
College degrees close to the US
35.5% of adults 25 and over have a bachelor’s degree or more, lower than the US (37.4%).
Highest level of education
Source: ACS 2025 1-year, table A12001.
Show data
| Texas | United States | |
|---|---|---|
| Less than high school | 12.2% ±0.2% , number 2,569,828 ±41,810 | 9.4% ±0.1% , number 22,321,002 ±120,500 |
| High school only | 24.3% ±0.3% , number 5,117,656 ±57,550 | 25.6% ±0.1% , number 61,096,726 ±203,400 |
| Some college | 27.9% ±0.3% , number 5,862,871 ±60,340 | 27.7% ±0.1% , number 65,920,977 ±173,500 |
| Bachelor’s degree | 22.2% ±0.2% , number 4,666,309 ±44,630 | 22.3% ±0.1% , number 53,224,312 ±196,700 |
| Graduate degree | 13.3% ±0.2% , number 2,805,195 ±38,970 | 15.0% ±0.1% , number 35,816,011 ±159,400 |
Embed
All the numbers
| Indicator | Texas | US | Rank among states* | Table |
|---|---|---|---|---|
| Bachelor’s degree or more | 35.5% ±0.3% , number 7,471,504 ±59,250 | 37.4% ±0.1% , number 89,040,323 ±253,200 | 28th | A12001 |
| High school graduate or more | 87.8% ±0.5% , number 18,452,031 ±102,300 | 90.6% ±0.2% , number 216,058,026 ±368,200 | 50th | A12001 |
*1 is the highest. Population is ranked among all states, and the rest among those of 1,000 people or more, whose figures can be ranked. Ranks use 5-year estimates, the only ones covering every state, so they can differ slightly from the figures here.
Housing
Home values outran incomes
37.3% of households rent, higher than the US (34.7%). The median home is worth $318,100 and the median rent is $1,515. After inflation, home values rose 53% from 2015 to 2025, while household income rose 8%.
Housing costs and income, 2015 to 2025, after inflation
Source: ACS 1-year, table A10036, A18009, A14006.
Show data
| Texas | United States | |
|---|---|---|
| Median home value | +52.8% | +39.3% |
| Median rent | +18.6% | +18.5% |
| Median household income | +8.4% | +10.9% |
Embed
Types of homes
Source: ACS 2025 1-year, table A10032.
Show data
| Texas | United States | |
|---|---|---|
| Single-family, detached | 64.5% ±0.3% , number 8,280,662 ±32,190 | 60.9% ±0.1% , number 90,335,844 ±173,300 |
| Single-family, attached | 3.0% ±0.1% , number 380,798 ±14,200 | 6.4% ±<0.1% , number 9,527,703 ±51,230 |
| 2 to 4 units | 5.0% ±0.1% , number 647,065 ±17,720 | 7.5% ±0.1% , number 11,109,005 ±75,790 |
| 5 to 19 units | 9.3% ±0.2% , number 1,195,866 ±28,400 | 8.7% ±0.1% , number 12,829,882 ±97,590 |
| 20 or more units | 12.1% ±0.2% , number 1,556,404 ±30,770 | 11.1% ±0.1% , number 16,381,450 ±92,310 |
| Mobile homes and other | 6.1% ±0.1% , number 787,169 ±15,290 | 5.4% ±<0.1% , number 8,045,083 ±53,680 |
Embed
When homes were built
Source: ACS 2025 1-year, table A10055.
Show data
| Texas | United States | |
|---|---|---|
| 2010 or later | 27.8% ±0.3% , number 3,223,150 ±40,810 | 15.1% ±0.1% , number 20,257,912 ±101,300 |
| 2000 to 2009 | 18.0% ±0.3% , number 2,090,975 ±29,680 | 13.8% ±0.1% , number 18,535,840 ±92,260 |
| 1980 to 1999 | 24.7% ±0.3% , number 2,869,218 ±35,860 | 24.1% ±0.1% , number 32,332,570 ±118,900 |
| 1960 to 1979 | 18.8% ±0.3% , number 2,183,940 ±30,930 | 22.9% ±0.1% , number 30,726,302 ±110,000 |
| Before 1960 | 10.7% ±0.2% , number 1,239,991 ±22,390 | 24.0% ±0.1% , number 32,210,798 ±121,500 |
Embed
All the numbers
| Indicator | Texas | US | Rank among states* | Table |
|---|---|---|---|---|
| Housing units | 12,847,964 | – | – | A10001 |
| Households | 11,607,274 ±26,150 | – | – | A10008 |
| People per household | 2.68 ±0.01 | 2.49 ±0.01 | 4th | A10003 |
| Households that rent | 37.3% ±0.3% , number 4,333,910 ±35,840 | 34.7% ±0.1% , number 46,551,688 ±193,200 | 6th | A10060 |
| Vacant homes | 9.7% ±0.2% , number 1,240,690 ±26,300 | 9.6% ±0.1% , number 14,165,545 ±137,100 | 31st | A10047, A10060 |
| Median gross rent | $1,515 ±$11 | $1,557 ±$4 | 19th | A18009 |
| Median home value | $318,100 ±$1,418 | $371,100 ±$646 | 30th | A10036 |
| Renters paying 30% or more of income | 48.2% ±0.8% , number 2,088,946 ±37,730 | 48.3% ±0.2% , number 22,486,693 ±122,100 | 12th | A18002 |
| Owners paying 30% or more of income | 24.1% ±0.4% , number 1,754,836 ±30,470 | 24.2% ±0.1% , number 21,201,943 ±93,050 | 16th | A10040 |
| Homes built before 1960 | 10.7% ±0.2% , number 1,239,991 ±22,390 | 24.0% ±0.1% , number 32,210,798 ±121,500 | 46th | A10055 |
*1 is the highest. Population is ranked among all states, and the rest among those of 1,000 people or more, whose figures can be ranked. Ranks use 5-year estimates, the only ones covering every state, so they can differ slightly from the figures here.
Getting around
A driving state
72.3% of workers drive alone and 12.9% work from home. 41.0% of those who travel to work spend 30 minutes or more getting there, and 5.9% of households have no vehicle.
How people get to work
Source: ACS 2025 1-year, table A09005.
Show data
| Texas | United States | |
|---|---|---|
| Drive alone | 72.3% ±0.2% , number 11,051,873 ±50,640 | 69.8% ±0.1% , number 115,297,377 ±192,900 |
| Carpool | 10.3% ±0.2% , number 1,577,041 ±34,450 | 8.9% ±0.1% , number 14,712,170 ±97,240 |
| Public transit | 1.4% ±0.1% , number 207,235 ±13,090 | 4.3% ±<0.1% , number 7,100,386 ±63,330 |
| Walk | 1.4% ±0.1% , number 217,240 ±12,410 | 2.4% ±<0.1% , number 4,016,469 ±41,070 |
| Work from home | 12.9% ±0.2% , number 1,975,585 ±35,220 | 12.9% ±0.1% , number 21,288,393 ±105,700 |
| Other | 1.6% ±0.1% , number 249,765 ±14,670 | 1.7% ±<0.1% , number 2,799,658 ±41,510 |
Embed
Time spent getting to work
Source: ACS 2025 1-year, table B09001.
Show data
| Texas | United States | |
|---|---|---|
| Under 10 minutes | 11.1% ±0.2% , number 1,472,405 ±27,410 | 12.0% ±0.1% , number 17,199,225 ±93,440 |
| 10 to 19 minutes | 27.4% ±0.3% , number 3,646,423 ±45,330 | 27.8% ±0.1% , number 40,059,540 ±137,700 |
| 20 to 29 minutes | 20.5% ±0.4% , number 2,730,150 ±48,180 | 21.0% ±0.1% , number 30,221,743 ±111,100 |
| 30 to 39 minutes | 17.8% ±0.2% , number 2,374,112 ±32,740 | 17.1% ±0.1% , number 24,659,138 ±103,800 |
| 40 to 59 minutes | 13.5% ±0.2% , number 1,802,554 ±27,270 | 12.6% ±0.1% , number 18,104,709 ±97,070 |
| 60 minutes or more | 9.6% ±0.2% , number 1,277,510 ±29,610 | 9.5% ±0.1% , number 13,681,705 ±84,440 |
Embed
Vehicles per household
Source: ACS 2025 1-year, table A10030.
Show data
| Texas | United States | |
|---|---|---|
| None | 5.9% ±0.2% , number 681,783 ±19,520 | 8.8% ±0.1% , number 11,781,997 ±77,240 |
| One | 33.3% ±0.3% , number 3,871,004 ±40,660 | 33.1% ±0.1% , number 44,424,682 ±160,700 |
| Two | 38.0% ±0.3% , number 4,407,176 ±41,730 | 36.0% ±0.1% , number 48,200,889 ±176,800 |
| Three or more | 22.8% ±0.3% , number 2,647,311 ±33,720 | 22.1% ±0.1% , number 29,655,854 ±113,300 |
Embed
All the numbers
| Indicator | Texas | US | Rank among states* | Table |
|---|---|---|---|---|
| Drive to work alone | 72.3% ±0.2% , number 11,051,873 ±50,640 | 69.8% ±0.1% , number 115,297,377 ±192,900 | 27th | A09005 |
| Take public transit | 1.4% ±0.1% , number 207,235 ±13,090 | 4.3% ±<0.1% , number 7,100,386 ±63,330 | 28th | A09005 |
| Work from home | 12.9% ±0.2% , number 1,975,585 ±35,220 | 12.9% ±0.1% , number 21,288,393 ±105,700 | 24th | A09005 |
| Commute 30 minutes or more | 41.0% ±0.4% , number 5,454,176 ±51,890 | 39.2% ±0.1% , number 56,445,552 ±165,300 | 12th | B09001 |
| Households with no vehicle | 5.9% ±0.2% , number 681,783 ±19,080 | 8.8% ±<0.1% , number 11,781,997 ±64,240 | 38th | A10030 |
*1 is the highest. Population is ranked among all states, and the rest among those of 1,000 people or more, whose figures can be ranked. Ranks use 5-year estimates, the only ones covering every state, so they can differ slightly from the figures here.
Places
The largest cities in Texas
Population, from the latest estimates available. Figures cover the whole of each place.
Largest cities
- Houston: 2,395,938
- San Antonio: 1,548,406
- Dallas: 1,329,489
- Fort Worth: 1,034,450
- Austin: 1,002,536
- El Paso: 682,987
- Arlington: 402,095
- Corpus Christi: 317,254
States like this one
- California: 39,287,377
- New York: 19,852,366
- Illinois: 12,694,798
- Georgia: 10,940,407
States at least a third this size, with the closest income, education, age, housing and origins.
Every county and place in Texas
Find any county, city, town, metro area, ZIP code, school district or district in Texas.
Counties
Each of the 254 counties with its population, from ACS 2020–2024 5-year estimates.
- Anderson County58,439
- Andrews County18,610
- Angelina County87,275
- Aransas County24,876
- Archer County8,867
- Armstrong County1,822
- Atascosa County51,008
- Austin County31,170
- Bailey County6,913
- Bandera County22,021
- Bastrop County106,582
- Baylor County3,485
- Bee County31,083
- Bell County386,897
- Bexar County2.07M
- Blanco County12,446
- Borden County713
- Bosque County18,687
- Bowie County92,115
- Brazoria County391,255
- Brazos County242,311
- Brewster County9,503
- Briscoe County1,301
- Brooks County6,943
- Brown County38,347
- Burleson County18,857
- Burnet County52,652
- Caldwell County48,669
- Calhoun County19,868
- Callahan County14,241
- Cameron County426,120
- Camp County12,798
- Carson County5,801
- Cass County28,568
- Castro County7,344
- Chambers County51,498
- Cherokee County51,886
- Childress County6,743
- Clay County10,495
- Cochran County2,550
- Coke County3,353
- Coleman County7,833
- Collin County1.16M
- Collingsworth County2,588
- Colorado County21,006
- Comal County183,826
- Comanche County13,950
- Concho County3,328
- Cooke County43,046
- Coryell County84,748
- Cottle County1,368
- Crane County4,610
- Crockett County2,822
- Crosby County5,041
- Culberson County2,195
- Dallam County7,298
- Dallas County2.62M
- Dawson County12,134
- Deaf Smith County18,460
- Delta County5,438
- Denton County979,561
- DeWitt County20,016
- Dickens County1,747
- Dimmit County8,380
- Donley County3,257
- Duval County9,742
- Eastland County18,011
- Ector County164,654
- Edwards County1,290
- El Paso County870,779
- Ellis County213,160
- Erath County43,794
- Falls County17,291
- Fannin County37,326
- Fayette County25,042
- Fisher County3,655
- Floyd County5,216
- Foard County991
- Fort Bend County893,767
- Franklin County10,632
- Freestone County20,049
- Frio County18,582
- Gaines County22,232
- Galveston County358,990
- Garza County5,118
- Gillespie County27,524
- Glasscock County1,068
- Goliad County7,141
- Gonzales County19,851
- Gray County21,045
- Grayson County143,337
- Gregg County125,480
- Grimes County31,340
- Guadalupe County183,642
- Hale County32,131
- Hall County2,820
- Hamilton County8,406
- Hansford County5,119
- Hardeman County3,501
- Hardin County57,642
- Harris County4.84M
- Harrison County70,155
- Hartley County5,215
- Haskell County5,421
- Hays County268,638
- Hemphill County3,234
- Henderson County84,862
- Hidalgo County891,977
- Hill County37,328
- Hockley County21,363
- Hood County65,894
- Hopkins County37,784
- Houston County22,051
- Howard County32,290
- Hudspeth County3,403
- Hunt County108,972
- Hutchinson County20,184
- Irion County1,409
- Jack County8,882
- Jackson County15,152
- Jasper County32,727
- Jeff Davis County1,865
- Jefferson County253,878
- Jim Hogg County4,727
- Jim Wells County38,850
- Johnson County195,597
- Jones County20,304
- Karnes County14,968
- Kaufman County172,604
- Kendall County48,567
- Kenedy County145
- Kent County734
- Kerr County53,489
- Kimble County4,389
- King County211
- Kinney County3,157
- Kleberg County30,579
- Knox County3,307
- La Salle County6,839
- Lamar County50,669
- Lamb County12,828
- Lampasas County22,715
- Lavaca County20,552
- Lee County17,971
- Leon County16,263
- Liberty County103,380
- Limestone County22,283
- Lipscomb County2,918
- Live Oak County11,620
- Llano County22,424
- Loving County33
- Lubbock County318,884
- Lynn County5,752
- Madison County13,648
- Marion County9,737
- Martin County5,218
- Mason County3,955
- Matagorda County36,329
- Maverick County58,082
- McCulloch County7,514
- McLennan County266,067
- McMullen County700
- Medina County53,547
- Menard County1,955
- Midland County174,801
- Milam County25,567
- Mills County4,511
- Mitchell County9,018
- Montague County21,046
- Montgomery County684,432
- Moore County21,373
- Morris County12,076
- Motley County1,183
- Nacogdoches County65,162
- Navarro County54,711
- Newton County12,093
- Nolan County14,454
- Nueces County352,955
- Ochiltree County9,786
- Oldham County2,249
- Orange County85,307
- Palo Pinto County29,295
- Panola County22,726
- Parker County165,168
- Parmer County9,731
- Pecos County14,896
- Polk County52,800
- Potter County115,975
- Presidio County5,930
- Rains County12,775
- Randall County146,070
- Reagan County3,232
- Real County2,802
- Red River County11,611
- Reeves County12,664
- Refugio County6,707
- Roberts County832
- Robertson County17,167
- Rockwall County123,617
- Runnels County9,874
- Rusk County52,842
- Sabine County10,023
- San Augustine County7,874
- San Jacinto County28,441
- San Patricio County70,181
- San Saba County5,696
- Schleicher County2,381
- Scurry County16,488
- Shackelford County3,175
- Shelby County24,155
- Sherman County2,295
- Smith County241,740
- Somervell County9,691
- Starr County66,067
- Stephens County9,351
- Sterling County1,468
- Stonewall County1,227
- Sutton County3,277
- Swisher County6,937
- Tarrant County2.17M
- Taylor County145,863
- Terrell County835
- Terry County11,629
- Throckmorton County1,639
- Titus County31,363
- Tom Green County119,577
- Travis County1.33M
- Trinity County14,046
- Tyler County20,238
- Upshur County42,567
- Upton County3,191
- Uvalde County24,881
- Val Verde County47,741
- Van Zandt County62,649
- Victoria County91,413
- Walker County80,209
- Waller County61,552
- Ward County11,144
- Washington County36,647
- Webb County269,294
- Wharton County41,794
- Wheeler County4,862
- Wichita County129,996
- Wilbarger County12,616
- Willacy County20,139
- Williamson County672,688
- Wilson County52,781
- Winkler County7,454
- Wise County75,005
- Wood County46,961
- Yoakum County7,571
- Young County18,029
- Zapata County13,841
- Zavala County9,412
Cities, towns and other places
Each of the 1,795 with its population, from ACS 2020–2024 5-year estimates. Census-designated places are communities without a local government of their own, drawn by the Census Bureau so they can be counted.
- Abbott470
- Abernathy3,278
- Abilene128,053
- Abram1,741
- Acala29
- Ackerly384
- Addison17,290
- Adrian129
- Agua Dulce CDP2,697
- Agua Dulce city251
- Aguilares119
- Airport Road Addition174
- Alamo20,255
- Alamo Beach90
- Alamo Heights7,492
- Alanreed15
- Alba664
- Albany1,849
- Aldine17,167
- Aledo5,825
- Alfred227
- Alice17,707
- Alice Acres819
- Allen110,265
- Allison101
- Alma541
- Alpine6,014
- Alto1,222
- Alto Bonito Heights1,121
- Alton20,214
- Alvarado6,307
- Alvin28,333
- Alvord1,294
- Amada Acres52
- Amargosa60
- Amarillo201,885
- Ames1,142
- Amherst902
- Amistad24
- Anahuac2,892
- Anderson202
- Andrews13,468
- Angleton19,972
- Angus475
- Anna24,330
- Annetta3,264
- Annetta North389
- Annetta South763
- Annona313
- Anson2,531
- Anthony4,580
- Anton1,053
- Appleby619
- Aquilla79
- Aransas Pass8,972
- Archer City1,233
- Arcola1,911
- Argyle5,371
- Arlington397,742
- Arp1,111
- Arroyo Colorado Estates856
- Arroyo Gardens335
- Asherton543
- Aspermont920
- Atascocita99,354
- Athens13,200
- Atlanta5,439
- Aubrey7,396
- Aurora1,760
- Austin979,539
- Austwell149
- Avery575
- Avinger351
- Azle14,126
- B and E169
- Bacliff9,541
- Bailey198
- Bailey's Prairie708
- Baird1,642
- Balch Springs27,255
- Balcones Heights2,715
- Ballinger3,583
- Balmorhea456
- Bandera655
- Bangs1,633
- Banquete619
- Bardwell963
- Barrera49
- Barrett3,273
- Barry236
- Barstow198
- Bartlett1,941
- Barton Creek3,440
- Bartonville2,112
- Bastrop11,156
- Batesville994
- Bay City17,730
- Bayou Vista1,754
- Bayside412
- Baytown85,205
- Bayview887
- Beach City3,309
- Bear Creek515
- Bear Creek Ranch1,604
- Beasley999
- Beaumont113,279
- Beauxart Gardens1,276
- Beaver Creek958
- Beckville690
- Bedford49,085
- Bedias478
- Bee Cave8,862
- Beeville13,412
- Bellaire17,206
- Bellevue359
- Bellmead10,566
- Bells2,497
- Bellville4,221
- Belterra6,978
- Belton24,356
- Ben Arnold84
- Ben Bolt2,152
- Ben Wheeler1,792
- Benavides1,470
- Benbrook24,557
- Benjamin266
- Benjamin Perez133
- Berryville1,184
- Bertram2,037
- Beverly Hills1,590
- Bevil Oaks1,133
- Big Lake2,990
- Big Sandy1,289
- Big Spring23,975
- Big Thicket Lake Estates596
- Big Wells544
- Bigfoot1,067
- Bishop3,103
- Bishop Hills202
- Bivins87
- Bixby294
- Blackwell211
- Blanco2,175
- Blanket434
- Bledsoe130
- Blessing418
- Bloomburg330
- Blooming Grove658
- Bloomington1,895
- Blossom1,393
- Blue Berry Hill852
- Blue Mound2,366
- Blue Ridge1,104
- Bluetown271
- Bluff Dale182
- Blum336
- Boerne20,518
- Bogata804
- Boling374
- Bolivar Peninsula2,951
- Bonanza Hills28
- Bonham10,697
- Bonney251
- Booker1,311
- Borger12,226
- Botines69
- Bovina1,488
- Bowie5,770
- Box Canyon19
- Boyd1,351
- Boys Ranch309
- Brackettville1,595
- Brady5,230
- Brazoria2,880
- Brazos18
- Brazos Country619
- Breckenridge5,170
- Bremond855
- Brenham18,641
- Briar7,228
- Briarcliff2,735
- Briaroaks614
- Bridge City9,640
- Bridgeport6,331
- Briggs44
- Bristol649
- Broaddus390
- Bronte1,041
- Brookshire5,495
- Brookside Village1,565
- Browndell141
- Brownfield8,738
- Brownsboro1,658
- Brownsville189,177
- Brownwood18,777
- Bruceville-Eddy1,584
- Bruni278
- Brushy Creek19,576
- Bryan87,939
- Bryson659
- Buchanan Dam1,513
- Buchanan Lake Village425
- Buckholts374
- Buda15,859
- Buffalo1,652
- Buffalo Gap534
- Buffalo Springs Lake571
- Bullard4,346
- Bulverde6,486
- Buna2,249
- Bunker Hill Village3,829
- Burkburnett11,059
- Burke663
- Burleson52,918
- Burlington58
- Burnet6,732
- Burton174
- Bushland2,779
- Butterfield71
- Byers393
- Bynum236
- Cactus3,091
- Caddo Mills3,340
- Cade Lakes329
- Caldwell4,394
- Callender Lake744
- Callisburg459
- Calvert760
- Camargito376
- Cameron5,416
- Cameron Park5,955
- Camp Swift8,239
- Camp Wood939
- Campbell866
- Campo Verde43
- Canadian2,241
- Caney City192
- Canton4,545
- Cantu Addition32
- Canutillo5,962
- Canyon15,723
- Canyon Creek1,646
- Canyon Lake33,883
- Cape Royale574
- Carbon280
- Carl's Corner298
- Carlsbad831
- Carlton10
- Carmine173
- Carrizo Hill1,198
- Carrizo Springs4,723
- Carrollton133,740
- Carter1,738
- Carthage6,601
- Cashion Community309
- Castle Hills3,943
- Castroville3,092
- Catarina155
- Cedar Creek4,440
- Cedar Hill48,879
- Cedar Park78,301
- Cedar Point328
- Celeste1,019
- Celina34,268
- Center5,271
- Center Point1,733
- Centerville1,053
- Central Gardens3,976
- César Chávez1,351
- Chandler3,518
- Channelview43,605
- Channing242
- Chaparrito16
- Chapeno95
- Charlotte1,466
- Chester156
- Chico1,512
- Childress5,834
- Chillicothe479
- Chilton698
- China963
- China Grove1,215
- China Spring1,126
- Chireno589
- Christine295
- Christoval490
- Chula Vista (Cameron County)284
- Chula Vista (Maverick County)4,746
- Chula Vista (Zavala County)311
- Cibolo35,109
- Cienegas Terrace1,868
- Cinco Ranch18,611
- Circle D-KC Estates3,135
- Cisco3,955
- Citrus City2,395
- Clarendon1,859
- Clarksville2,853
- Clarksville City883
- Claude1,163
- Clay100
- Clear Lake Shores1,140
- Cleburne34,344
- Cleveland8,984
- Clifton3,503
- Clint1,258
- Cloverleaf24,063
- Clute10,715
- Clyde3,954
- Coahoma749
- Cockrell Hill3,703
- Coffee City266
- Coldspring1,274
- Coleman3,973
- College Station124,570
- Colleyville26,012
- Collinsville2,060
- Colmesneil642
- Colorado Acres51
- Colorado City3,976
- Columbus3,860
- Comanche4,295
- Combes3,178
- Combine2,785
- Comfort1,565
- Commerce9,383
- Como616
- Concepcion16
- Conroe102,360
- Converse29,607
- Cool159
- Coolidge754
- Cooper2,055
- Coppell42,154
- Copper Canyon2,514
- Copperas Cove37,947
- Corinth23,385
- Corpus Christi317,419
- Corral City7
- Corrigan1,784
- Corsicana25,511
- Cottonwood254
- Cottonwood Shores1,859
- Cotulla3,664
- Coupland491
- Cove378
- Covington274
- Coyanosa107
- Coyote Acres977
- Coyote Flats365
- Crandall4,763
- Crane2,640
- Cranfills Gap305
- Crawford1,020
- Creedmoor518
- Cresson1,313
- Crockett6,364
- Crosby4,617
- Crosbyton1,774
- Cross Mountain3,752
- Cross Plains1,019
- Cross Roads2,035
- Cross Timber875
- Crowell640
- Crowley19,532
- Crystal City6,159
- Cuero8,165
- Cumby720
- Cumings2,535
- Cuney161
- Cushing784
- Cut and Shoot864
- D'Hanis480
- Daingerfield2,529
- Daisetta1,016
- Dalhart7,902
- Dallas1.31M
- Dalworthington Gardens2,180
- Damon196
- Danbury2,161
- Darrouzett270
- Dawson1,322
- Dayton9,058
- Dayton Lakes85
- De Kalb1,976
- De Leon2,516
- Dean536
- Deanville16
- Decatur7,426
- DeCordova3,152
- Deer Park33,967
- Deerwood2,366
- Del Rio34,668
- Del Sol543
- Dell City82
- Delmita183
- Denison25,778
- Dennis1,402
- Denton152,866
- Denver City4,368
- Deport756
- DeSoto56,211
- Detroit573
- Devers386
- Devine4,476
- Deweyville357
- Diboll4,995
- Dickens170
- Dickinson21,753
- Dilley3,769
- Dime Box145
- Dimmitt4,107
- DISH541
- Dodd City503
- Dodson20
- Doffing5,004
- Domino18
- Donna16,833
- Doolittle6,203
- Dorchester64
- Double Horn404
- Double Oak3,071
- Douglassville372
- Driftwood28
- Dripping Springs7,405
- Driscoll511
- Dublin3,419
- Dumas14,452
- Duncanville39,683
- E. Lopez108
- Eagle Lake3,485
- Eagle Pass28,339
- Early3,143
- Earth925
- East Alto Bonito340
- East Bernard3,053
- East Columbia96
- East Mountain958
- East Tawakoni869
- Eastland3,704
- Easton429
- Ector820
- Edcouch2,739
- Eden1,730
- Edgecliff Village3,766
- Edgewood1,927
- Edinburg104,550
- Edmonson120
- Edna6,027
- Edom315
- Edroy341
- Eidson Road9,684
- El Brazil94
- El Camino Angosto95
- El Campo12,202
- El Castillo566
- El Cenizo CDP377
- El Cenizo city2,122
- El Chaparral282
- El Lago2,997
- El Mesquite32
- El Paso680,130
- El Quiote51
- El Rancho Vela623
- El Refugio780
- El Socio49
- Elbert5
- Eldorado1,737
- Electra2,351
- Elgin11,563
- Elkhart1,701
- Ellinger253
- Elm Creek3,680
- Elmendorf2,389
- Elmo1,379
- Elsa5,697
- Emerald Bay970
- Emhouse142
- Emory1,207
- Encantada-Ranchito-El Calaboz2,552
- Enchanted Oaks269
- Encinal1,298
- Encino127
- Ennis22,588
- Escobares2,573
- Estelline90
- Eugenio Saenz120
- Euless60,421
- Eureka310
- Eustace1,039
- Evadale949
- Evant535
- Evergreen116
- Everman6,106
- Fabens4,818
- Fabrica774
- Fair Oaks Ranch10,728
- Fairchilds815
- Fairfield2,924
- Fairview10,783
- Falcon Lake Estates1,075
- Falcon Mesa426
- Falfurrias4,646
- Falls City541
- Falman39
- Fannett1,654
- Farmers Branch36,645
- Farmersville4,018
- Farnsworth7
- Farwell1,306
- Fate22,884
- Fayetteville335
- Ferris3,238
- Fifth Street1,453
- Flat354
- Flatonia1,830
- Flor del Rio326
- Florence1,061
- Floresville8,007
- Flowella9
- Flower Mound78,389
- Floydada2,588
- Fluvanna130
- Follett305
- Forest Heights1,795
- Forest Hill14,062
- Forney31,532
- Forsan371
- Fort Bliss11,460
- Fort Clark Springs1,048
- Fort Davis879
- Fort Hancock1,345
- Fort Hood26,814
- Fort Stockton8,278
- Fort Worth963,194
- Four Corners11,692
- Four Points63
- Fowlerton129
- Franklin1,530
- Frankston1,088
- Fredericksburg11,419
- Freeport10,621
- Freer2,253
- Fresno24,560
- Friendswood41,030
- Friona4,102
- Frisco219,304
- Fritch2,293
- Fronton205
- Fronton Ranchettes98
- Frost968
- Fruitvale396
- Fulshear34,868
- Fulton818
- Gail243
- Gainesville17,883
- Galena Park10,487
- Gallatin384
- Galveston53,424
- Ganado1,534
- Garceno149
- Garciasville196
- Garden City109
- Garden Ridge4,332
- Gardendale1,544
- Garfield1,926
- Garland246,844
- Garner493
- Garrett1,260
- Garrison1,065
- Garwood386
- Gary City407
- Garza-Salinas II559
- Gatesville16,228
- Gause312
- George West3,094
- Georgetown85,999
- Geronimo1,507
- Gholson1,112
- Giddings5,151
- Gilmer5,025
- Girard20
- Gladewater6,227
- Glazier48
- Glen Rose2,836
- Glenn Heights18,096
- Glidden1,071
- Godley2,809
- Goldsmith177
- Goldthwaite1,843
- Goliad1,651
- Golinda836
- Gonzales7,200
- Goodlow211
- Goodrich323
- Gordon460
- Goree131
- Gorman997
- Graford654
- Graham8,792
- Granbury12,136
- Grand Prairie201,883
- Grand Saline3,203
- Grandfalls375
- Grandview2,176
- Granger1,046
- Grangerland920
- Granite Shoals5,328
- Granjeno315
- Grape Creek4,036
- Grapeland1,595
- Grapevine51,139
- Grays Prairie334
- Green Valley Farms371
- Greenville31,222
- Gregory2,003
- Grey Forest640
- Groesbeck3,914
- Groom549
- Groves16,976
- Groveton924
- Gruver1,280
- Guadalupe Guerra98
- Gun Barrel City6,570
- Gunter2,398
- Gustine449
- Guthrie156
- Gutierrez11
- Hackberry2,979
- Hale Center2,037
- Hallettsville2,755
- Hallsburg400
- Hallsville4,628
- Haltom City45,767
- Hamilton2,934
- Hamlin2,011
- Hamshire1,388
- Happy647
- Hardin621
- Hargill609
- Harker Heights34,128
- Harlingen72,087
- Harper1,214
- Harrold78
- Hart919
- Hartley504
- Haskell2,817
- Haslet3,280
- Havana150
- Hawk Cove644
- Hawkins1,876
- Hawley572
- Hays198
- Hearne4,555
- Heartland10,607
- Heath10,777
- Hebbronville4,194
- Hebron253
- Hedley318
- Hedwig Village2,291
- Heidelberg2,215
- Helotes9,630
- Hemphill1,488
- Hempstead6,137
- Henderson13,385
- Henrietta3,167
- Hereford14,840
- Hermleigh473
- Hewitt16,432
- Hickory Creek5,611
- Hico1,771
- Hidalgo14,498
- Hideaway3,301
- Higgins462
- Highland Haven448
- Highland Park8,773
- Highland Village16,101
- Highlands6,335
- Hill Country Village815
- Hillcrest Village760
- Hillsboro8,506
- Hillside Acres6
- Hilltop (Frio County)688
- Hilltop Lakes797
- Hilshire Village1,220
- Hitchcock7,563
- Holiday Beach427
- Holiday Lakes862
- Holland1,299
- Holliday1,661
- Holly Lake Ranch2,956
- Hollywood Park3,143
- Homestead Meadows North5,795
- Homestead Meadows South6,660
- Hondo8,713
- Honey Grove1,824
- Hooks2,299
- Horizon City23,668
- Hornsby Bend12,367
- Horseshoe Bay4,854
- Horseshoe Bend606
- Houston2.33M
- Howardwick412
- Howe3,689
- Hubbard1,327
- Huckabay212
- Hudson5,104
- Hudson Bend4,127
- Hudson Oaks2,586
- Hughes Springs1,781
- Hull275
- Humble16,521
- Hungerford171
- Hunters Creek Village4,390
- Huntington4,053
- Huntsville47,864
- Hurst39,861
- Hutchins7,496
- Hutto35,483
- Huxley322
- Iago49
- Idalou2,151
- Iglesia Antigua211
- Impact13
- Imperial189
- Indian Hills2,961
- Indian Lake962
- Indian Springs938
- Industry235
- Inez2,031
- Ingleside9,997
- Ingleside on the Bay745
- Ingram1,917
- Iola372
- Iowa Colony12,891
- Iowa Park6,578
- Iraan1,038
- Iredell294
- Irving256,492
- Italy2,372
- Itasca2,073
- Ivanhoe1,680
- J.F. Villareal353
- Jacinto City9,432
- Jacksboro4,334
- Jacksonville14,325
- Jamaica Beach967
- Jardin de San Julian34
- Jarrell3,295
- Jasper7,299
- Jayton458
- Jefferson2,131
- Jersey Village7,817
- Jewett1,075
- Joaquin869
- Johnson City1,921
- Jolly185
- Jones Creek2,343
- Jonestown2,535
- Josephine5,842
- Joshua8,550
- Jourdanton4,407
- Juarez196
- Junction2,475
- Justin5,447
- K-Bar Ranch361
- Karnes City3,605
- Katy25,184
- Kaufman8,538
- Keene6,691
- Keller45,976
- Kemah2,168
- Kemp1,302
- Kempner1,215
- Kendleton434
- Kenedy3,430
- Kenefick898
- Kennard270
- Kennedale9,439
- Kerens1,778
- Kermit5,689
- Kerrville24,755
- Kilgore13,470
- Killeen158,159
- Kingsbury248
- Kingsland7,330
- Kingsville24,994
- Kirby8,117
- Kirbyville2,032
- Kirvin65
- Knippa844
- Knollwood701
- Knox City974
- Kopperl123
- Kosse430
- Kountze2,367
- Kress642
- Krugerville1,577
- Krum6,189
- Kurten555
- Kyle56,823
- La Blanca2,998
- La Casita25
- La Chuparosa148
- La Coma Heights127
- La Escondida167
- La Esperanza347
- La Feria6,891
- La Feria North134
- La Grange4,452
- La Grulla1,341
- La Homa11,285
- La Joya4,763
- La Loma de Falcon57
- La Marque19,268
- La Minita337
- La Moca Ranch26
- La Paloma2,797
- La Paloma Ranchettes319
- La Paloma-Lost Creek439
- La Porte36,730
- La Presa163
- La Pryor1,236
- La Puerta582
- La Rosita56
- La Tina Ranch405
- La Vernia1,095
- La Victoria314
- La Villa3,005
- La Ward178
- Lackland AFB6,785
- LaCoste1,365
- Lacy-Lakeview7,274
- Ladonia537
- Lago85
- Lago Vista CDP48
- Lago Vista city9,650
- Laguna Heights357
- Laguna Park1,596
- Laguna Seca239
- Laguna Vista3,673
- Lake Bridgeport358
- Lake Brownwood1,544
- Lake Bryan2,165
- Lake Cherokee3,093
- Lake City508
- Lake Colorado City980
- Lake Dallas7,822
- Lake Dunlap1,411
- Lake Jackson27,974
- Lake Kiowa2,476
- Lake Medina Shores1,411
- Lake Meredith Estates183
- Lake Tanglewood624
- Lake View349
- Lake Worth4,829
- Lakehills6,130
- Lakeport1,170
- Lakeshore Gardens-Hidden Acres970
- Lakeside (San Patricio County)339
- Lakeside (Tarrant County)1,401
- Lakeside City1,234
- Lakeview62
- Lakeway19,307
- Lakewood Village627
- Lamar1,202
- Lamesa8,393
- Lamkin21
- Lampasas7,671
- Lancaster40,820
- Lantana12,766
- Laredo257,619
- Las Lomas2,154
- Las Lomitas118
- Las Palmas47
- Las Palmas II808
- Las Quintas Fronterizas2,203
- Lasana54
- Lasara1,467
- Latexo246
- Laughlin AFB1,595
- Laureles4,224
- Lavon6,498
- Lawn280
- League City116,215
- Leakey721
- Leander74,067
- Leary540
- Lefors557
- Lelia Lake30
- Leming681
- Leon Valley11,446
- Leona244
- Leonard2,505
- Leroy458
- Levelland12,466
- Lewisville131,080
- Lexington1,365
- Liberty8,650
- Liberty City2,648
- Liberty Hill8,371
- Lindale6,644
- Linden1,932
- Lindsay CDP434
- Lindsay city1,142
- Lingleville272
- Linn801
- Lipan490
- Lipscomb81
- Little Cypress1,963
- Little Elm54,820
- Little River-Academy2,233
- Littlefield5,822
- Live Oak15,984
- Liverpool477
- Livingston5,718
- Llano3,494
- Llano Grande2,283
- Lockett195
- Lockhart15,326
- Lockney1,752
- Log Cabin998
- Lolita217
- Loma Grande324
- Loma Linda340
- Loma Linda East (Jim Wells County)9
- Loma Vista130
- Lometa812
- Lone Oak487
- Lone Star1,543
- Longoria23
- Longview82,923
- Loop128
- Lopeño89
- Lopezville2,227
- Loraine813
- Lorena1,497
- Lorenzo834
- Los Altos1,082
- Los Alvarez245
- Los Angeles553
- Los Arcos51
- Los Barreras148
- Los Centenarios41
- Los Ebanos (Hidalgo County)20
- Los Ebanos (Starr County)281
- Los Fresnos CDP177
- Los Fresnos city8,291
- Los Indios948
- Lost Creek954
- Lott583
- Louise890
- Lovelady490
- Loving87
- Lowry Crossing1,433
- Lozano149
- Lubbock264,814
- Lucas8,351
- Lueders271
- Lufkin34,251
- Luling5,531
- Lumberton13,963
- Lyford2,054
- Lyons528
- Lytle2,492
- Mabank5,187
- Macdona349
- Madisonville4,552
- Magnolia4,068
- Magnolia Beach97
- Malakoff2,045
- Malone280
- Manchaca2,171
- Manor18,603
- Mansfield77,510
- Manuel Garcia219
- Manvel14,758
- Marathon283
- Marble Falls7,752
- Marfa2,482
- Marietta277
- Marion939
- Markham873
- Marlin5,516
- Marquez198
- Marshall23,825
- Mart1,704
- Martindale1,072
- Martinez11
- Mason1,999
- Matador745
- Matagorda182
- Mathis4,308
- Maud988
- Mauriceville2,945
- May204
- Maypearl907
- McAllen145,385
- McCamey1,643
- McCaulley35
- McDade1,070
- McGregor5,761
- McKinney210,600
- McKinney Acres562
- McLean799
- McLendon-Chisholm4,511
- McLeod520
- McQueeney2,392
- Meadow623
- Meadowlakes1,861
- Meadows Place4,689
- Medina4,226
- Megargel256
- Melissa20,136
- Melvin114
- Memphis2,174
- Menard1,008
- Mentone10
- Mercedes16,733
- Meridian1,638
- Merkel2,699
- Mertens123
- Mertzon764
- Mesquite CDP515
- Mesquite city149,299
- Mexia6,859
- Mi Ranchito Estate1,091
- Miami523
- Midland136,640
- Midlothian39,356
- Midway257
- Midway North3,594
- Midway South2,308
- Mikes1,688
- Mila Doce7,731
- Milam1,258
- Milano487
- Mildred312
- Miles1,030
- Milford966
- Miller's Cove71
- Millsap433
- Mineola5,068
- Mineral Wells15,244
- Mingus380
- Mirando City92
- Mission87,038
- Mission Bend36,586
- Missouri City76,558
- Mobeetie64
- Mobile City296
- Monahans7,452
- Mont Belvieu9,020
- Montague189
- Monte Alto2,350
- Montgomery2,489
- Moody1,390
- Moore372
- Moore Station155
- Moran259
- Morgan525
- Morgan Farm358
- Morgan's Point233
- Morgan's Point Resort4,750
- Morning Glory431
- Morse373
- Morton1,513
- Mosheim85
- Moulton884
- Mound57
- Mount Calm439
- Mount Enterprise357
- Mount Pleasant16,136
- Mount Vernon2,548
- Mountain City787
- Muenster1,329
- Muleshoe5,667
- Mullin220
- Munday1,407
- Muniz1,601
- Murchison568
- Murillo8,883
- Murphy21,188
- Mustang Ridge1,750
- Myra263
- Myrtle Springs692
- Nacogdoches32,197
- Nada177
- Naples1,412
- Narciso Pena91
- Nash4,032
- Nassau Bay5,230
- Natalia981
- Navarro288
- Navasota8,542
- Nazareth273
- Neches352
- Nederland18,381
- Needville3,094
- Nesbitt268
- Nevada1,319
- New Berlin633
- New Boston4,571
- New Braunfels104,643
- New Chapel Hill891
- New Deal668
- New Fairview1,570
- New Home267
- New Hope680
- New London1,085
- New Summerfield618
- New Ulm185
- New Waverly955
- Newark1,177
- Newcastle716
- Newton2,534
- Neylandville73
- Niederwald1,029
- Nina965
- Nixon2,231
- Nocona3,144
- Nocona Hills687
- Nolanville6,690
- Nome253
- Noonday707
- Nordheim476
- Normangee826
- Normanna6
- North Alamo4,819
- North Cleveland376
- North Escobares171
- North Pearsall440
- North Richland Hills70,780
- North San Pedro721
- Northlake8,283
- Novice101
- O'Brien130
- O'Donnell533
- Oak Grove615
- Oak Island354
- Oak Leaf1,827
- Oak Point5,887
- Oak Ridge (Cooke County)353
- Oak Ridge (Kaufman County)1,192
- Oak Ridge North3,034
- Oak Trail Shores3,040
- Oak Valley364
- Oakhurst266
- Oakwood570
- Odem2,102
- Odessa115,322
- Oglesby418
- Oilton101
- Oklaunion132
- Old River-Winfree2,448
- Olivarez6,326
- Olivia Lopez de Gutierrez455
- Olmito887
- Olmito and Olmito79
- Olmos Park2,115
- Olney3,015
- Olton1,552
- Omaha1,316
- Onalaska3,210
- Opdyke West285
- Orange19,177
- Orange Grove1,089
- Orason424
- Orchard338
- Ore City851
- Overton2,444
- Ovilla4,375
- Owl Ranch148
- Oyster Creek1,288
- Ozona2,405
- Pablo Pena319
- Paducah1,077
- Paige129
- Paint Rock350
- Paisano Park34
- Palacios4,388
- Palestine19,136
- Palisades265
- Palm Valley2,155
- Palmer CDP1,435
- Palmer town2,515
- Palmhurst2,601
- Palmview15,921
- Palmview South1,819
- Palo Blanco321
- Palo Pinto208
- Paloma Creek3,016
- Paloma Creek South8,860
- Pampa16,659
- Panhandle2,505
- Panorama Village2,525
- Pantego2,337
- Paradise627
- Paris24,775
- Parker5,999
- Pasadena149,433
- Pattison706
- Patton Village1,629
- Pawnee81
- Payne Springs1,201
- Pearland127,514
- Pearsall9,045
- Peaster515
- Pecan Acres4,161
- Pecan Gap258
- Pecan Grove24,272
- Pecan Hill723
- Pecan Plantation6,452
- Pelican Bay2,399
- Pendleton649
- Penelope235
- Penitas6,444
- Perezville2,237
- Perrin249
- Perryton8,585
- Petersburg699
- Petrolia416
- Petronila120
- Pettus602
- Petty213
- Pflugerville65,971
- Pharr80,333
- Pilot Point5,332
- Pine Forest519
- Pine Harbor566
- Pine Island1,321
- Pinebrook307
- Pinehurst CDP4,266
- Pinehurst city1,999
- Pineland817
- Pinewood Estates1,516
- Piney Point Village3,097
- Pittsburg4,432
- Placedo539
- Plains1,235
- Plainview19,711
- Plano290,594
- Plantersville579
- Pleak2,344
- Pleasant Hill830
- Pleasant Valley357
- Pleasanton11,011
- Plum138
- Plum Grove1,832
- Poetry1,642
- Point912
- Point Blank837
- Point Comfort304
- Point Venture1,598
- Ponder2,626
- Port Aransas3,268
- Port Arthur55,828
- Port Isabel5,111
- Port Lavaca11,358
- Port Mansfield245
- Port Neches13,664
- Port O'Connor620
- Porter Heights987
- Portland20,543
- Post4,326
- Post Oak Bend651
- Poteet2,910
- Poth1,532
- Potosi4,322
- Pottsboro2,691
- Powderly1,140
- Powell104
- Poynor467
- Prado Verde474
- Praesel265
- Prairie View8,431
- Premont2,428
- Presidio3,163
- Preston1,747
- Priddy92
- Primera5,344
- Princeton25,229
- Proctor141
- Progreso4,998
- Progreso Lakes240
- Prosper37,869
- Providence Village8,721
- Pueblo Nuevo511
- Putnam9
- Pyote115
- Quail17
- Quail Creek1,715
- Quanah2,109
- Queen City1,390
- Quemado119
- Quesada40
- Quinlan1,618
- Quintana18
- Quitaque347
- Quitman2,420
- Rafael Pena42
- Ralls1,463
- Ramirez-Perez69
- Ramos115
- Ranchette Estates229
- Ranchitos del Norte263
- Ranchitos East282
- Ranchitos Las Lomas192
- Rancho Alegre1,337
- Rancho Banquete131
- Rancho Chico384
- Rancho Viejo CDP238
- Rancho Viejo town2,849
- Ranchos Penitas West395
- Randolph AFB1,240
- Ranger2,641
- Rangerville112
- Rankin1,087
- Ransom Canyon1,041
- Ratamosa465
- Ravenna272
- Raymondville10,185
- Realitos32
- Red Lick1,333
- Red Oak17,077
- Red Rock436
- Redfield625
- Redford71
- Redland866
- Redwater747
- Redwood3,441
- Refugio2,766
- Regino Ramirez369
- Reid Hope King932
- Reklaw255
- Relampago99
- Rendon14,632
- Reno (Lamar County)3,500
- Reno (Parker and Tarrant Counties)3,272
- Retreat707
- Rhome1,699
- Ricardo1,132
- Rice1,241
- Rice Tracts1,384
- Richards67
- Richardson118,731
- Richland353
- Richland Hills8,493
- Richland Springs362
- Richmond12,582
- Richwood4,791
- Riesel1,453
- Ringgold174
- Rio Bravo4,491
- Rio Grande City15,396
- Rio Hondo1,865
- Rio Vista1,312
- Rising Star668
- River Oaks7,584
- Riverside740
- Riviera627
- Road Runner1,021
- Roanoke10,286
- Roaring Springs247
- Robert Lee946
- Robinson12,800
- Robstown10,236
- Roby679
- Rochelle150
- Rochester228
- Rock Island414
- Rockdale5,523
- Rockport10,683
- Rocksprings625
- Rockwall51,168
- Rockwell Place2,016
- Rocky Mound62
- Rogers1,303
- Rollingwood1,316
- Roma11,545
- Roman Forest2,336
- Ropesville594
- Rosanky1,695
- Roscoe1,425
- Rose City391
- Rose Hill Acres324
- Rosebud1,007
- Rosenberg40,646
- Rosharon1,737
- Rosita2,933
- Ross202
- Rosser469
- Rotan1,204
- Round Mountain81
- Round Rock127,786
- Round Top105
- Rowena199
- Rowlett65,463
- Roxton391
- Royse City20,037
- Rule823
- Runaway Bay1,717
- Runge1,108
- Rusk5,477
- Sabinal799
- Sachse30,491
- Sadler230
- Saginaw24,970
- Saint Jo911
- Salado2,225
- Salida del Sol Estates7,766
- Salineño51
- Salineño North77
- Sam Rayburn1,366
- Sammy Martinez303
- Samnorwood27
- San Angelo99,674
- San Antonio1.48M
- San Augustine2,054
- San Benito24,709
- San Carlos3,678
- San Carlos II259
- San Diego3,675
- San Elizario10,116
- San Felipe1,334
- San Fernando55
- San Isidro214
- San Juan CDP161
- San Juan city36,149
- San Leanna1,047
- San Leon6,458
- San Marcos70,897
- San Patricio403
- San Pedro446
- San Perlita462
- San Saba3,056
- San Ygnacio416
- Sanctuary304
- Sand Springs682
- Sanderson643
- Sandia206
- Sandy Hollow-Escondidas539
- Sandy Oaks5,396
- Sandy Point183
- Sanford130
- Sanger9,641
- Sansom Park5,392
- Santa Anna1,022
- Santa Clara602
- Santa Cruz285
- Santa Fe12,901
- Santa Maria669
- Santa Monica98
- Santa Rita Ranch6,586
- Santa Rosa CDP502
- Santa Rosa town3,215
- Santo427
- Sargent1,422
- Sarita92
- Savannah6,469
- Savoy1,010
- Scenic Oaks10,569
- Schertz44,050
- Schulenburg2,768
- Scissors4,267
- Scotland629
- Scottsville297
- Scurry702
- Seabrook13,768
- Seadrift1,239
- Seagoville19,352
- Seagraves2,691
- Sealy7,053
- Sebastian1,021
- Seco Mines644
- Seguin33,754
- Seis Lagos1,391
- Selma11,503
- Seminole7,184
- Serenada1,444
- Seth Ward2,205
- Seven Oaks118
- Seven Points1,167
- Seymour2,623
- Shady Hollow5,709
- Shady Shores2,922
- Shadybrook2,810
- Shallowater2,955
- Shamrock1,710
- Shavano Park3,670
- Sheffield74
- Shelbyville188
- Sheldon2,208
- Shenandoah3,705
- Shepherd2,189
- Sheridan208
- Sherman46,397
- Sherwood Shores830
- Shiner2,154
- Shiro159
- Shoreacres1,580
- Sienna24,992
- Sierra Blanca734
- Siesta Acres1,573
- Siesta Shores1,640
- Silsbee6,842
- Silverton498
- Simonton914
- Sinton5,584
- Skellytown457
- Skidmore1,183
- Slaton5,761
- Smiley543
- Smithville4,216
- Smyer291
- Snook834
- Snyder11,241
- Socorro37,123
- Solis663
- Somerset2,005
- Somerville1,126
- Sonora2,691
- Sonterra10,563
- Sour Lake2,130
- South Alamo3,309
- South Fork Estates177
- South Frydek221
- South Houston16,033
- South La Paloma386
- South Mountain328
- South Padre Island2,891
- South Point1,054
- South Toledo Bend336
- Southlake31,137
- Southmayd1,413
- Southside Place1,706
- Southwest Sandhill1,143
- Spade33
- Sparks4,134
- Spearman2,810
- Splendora2,131
- Spofford29
- Spring68,580
- Spring Branch243
- Spring Gardens622
- Spring Valley Village4,290
- Springlake98
- Springtown3,855
- Spur779
- St. Hedwig2,313
- St. Paul CDP769
- St. Paul town879
- Stafford17,401
- Stagecoach637
- Stamford2,917
- Stanton2,638
- Staples288
- Star Harbor470
- Steiner Ranch18,619
- Stephenville21,682
- Sterling City1,256
- Stinnett1,170
- Stockdale1,377
- Stockton Bend600
- Stonewall295
- Stowell1,823
- Stratford1,326
- Strawn525
- Streetman220
- Study Butte114
- Sudan1,154
- Sugar Land110,016
- Sullivan City3,902
- Sulphur Springs16,401
- Sun Valley49
- Sundown1,374
- Sunnyvale8,336
- Sunray2,628
- Sunrise Beach Village936
- Sunrise Shores607
- Sunset (Montague County)402
- Sunset (Starr County)65
- Sunset Acres11
- Sunset Valley814
- Surfside Beach677
- Sweeny3,591
- Sweetwater10,385
- Taft2,871
- Taft Southwest1,635
- Tahoka2,424
- Talco394
- Talty2,881
- Tanquecitos South Acres167
- Tanquecitos South Acres II168
- Tatum1,435
- Taylor17,136
- Taylor Lake Village3,721
- Taylor Landing284
- Teague3,476
- Tehuacana341
- Temple89,602
- Tenaha1,239
- Terlingua178
- Terrell20,366
- Terrell Hills5,070
- Texarkana35,992
- Texas City55,364
- Texhoma336
- Texline569
- The Colony45,454
- The Hills2,516
- The Homesteads3,053
- The Woodlands121,002
- Thompsons222
- Thorndale1,113
- Thornton565
- Thorntonville626
- Thrall861
- Three Rivers1,256
- Throckmorton649
- Thunderbird Bay702
- Tierra Bonita405
- Tierra Grande161
- Tierra Verde39
- Tiki Island1,210
- Tilden259
- Timbercreek Canyon528
- Timberwood Park35,413
- Timpson1,063
- Tioga1,322
- Tira418
- Tivoli433
- Toco76
- Todd Mission132
- Tolar1,585
- Tom Bean799
- Tomball13,655
- Tool2,367
- Tornillo1,341
- Tow145
- Town of Pecos10,926
- Toyah22
- Tradewinds390
- Travis Ranch9,025
- Trent280
- Trenton653
- Trinidad806
- Trinity2,258
- Trophy Club13,733
- Troup2,338
- Troy2,844
- Tuleta302
- Tulia4,422
- Tulsita15
- Tunis35
- Turkey274
- Tuscola990
- Tye936
- Tyler109,215
- Tynan61
- Uhland2,520
- Uncertain90
- Union Grove676
- Union Valley751
- Universal City20,189
- University Park25,155
- Utopia169
- Uvalde15,417
- Uvalde Estates1,908
- Val Verde Park3,139
- Valentine69
- Valera94
- Valle Vista424
- Valley Mills1,136
- Valley View702
- Van2,806
- Van Alstyne5,952
- Van Horn1,908
- Van Vleck1,763
- Vanderbilt440
- Vega1,086
- Venus6,745
- Vernon9,848
- Victoria65,625
- Vidor9,708
- Villa del Sol31
- Villa Pancho294
- Villa Verde373
- Villarreal140
- Vinton2,585
- Volente784
- Von Ormy1,142
- Waco143,570
- Wadsworth366
- Waelder603
- Waka106
- Wake Village5,867
- Waller3,108
- Wallis1,701
- Walnut Springs787
- Warren847
- Warren City331
- Washburn278
- Waskom2,084
- Watauga23,233
- Waxahachie45,347
- Weatherford35,788
- Webberville439
- Webster12,366
- Weimar2,928
- Weinert235
- Weir434
- Welch205
- Wellington1,883
- Wellman286
- Wells484
- Wells Branch13,523
- Weslaco42,229
- West2,576
- West Alto Bonito822
- West Columbia3,621
- West Lake Hills3,285
- West Livingston8,199
- West Odessa32,594
- West Orange3,420
- West Sharyland1,664
- West Tawakoni2,382
- West University Place14,982
- Westbrook177
- Westdale212
- Western Lake1,165
- Westlake1,670
- Westminster738
- Weston284
- Weston Lakes4,217
- Westover Hills908
- Westway3,484
- Westwood Shores1,466
- Westworth Village2,643
- Wharton8,724
- Wheeler1,431
- White Deer1,191
- White Oak6,235
- White Settlement18,150
- Whiteface361
- Whitehouse9,122
- Whitesboro4,173
- Whitewright1,659
- Whitharral98
- Whitney2,050
- Wichita Falls102,581
- Wickett699
- Wild Peach Village2,502
- Wildorado157
- Wildwood584
- Willis6,878
- Willow Grove2,080
- Willow Park5,874
- Wills Point3,921
- Wilmer6,391
- Wilson449
- Wimberley2,891
- Windcrest5,820
- Windom73
- Windthorst537
- Winfield450
- Wingate128
- Wink1,373
- Winnie3,290
- Winnsboro3,485
- Winona1,025
- Winters2,405
- Wixon Valley200
- Wolfe City1,148
- Wolfforth6,701
- Woodbranch1,719
- Woodcreek2,333
- Woodloch381
- Woodsboro1,464
- Woodson504
- Woodville2,755
- Woodway9,570
- Wortham1,160
- Wyldwood4,934
- Wylie60,334
- Yancey23
- Yantis353
- Yoakum5,846
- Yorktown1,720
- Yznaga47
- Zapata4,897
- Zapata Ranch190
- Zarate146
- Zavalla567
- Zephyr244
- Zuehl401
Metro and micro areas
Each of the 67 that reach into Texas, with its whole population, from ACS 2020–2024 5-year estimates. Metro and micro areas are counties tied together by commuting, drawn by the Office of Management and Budget.
- Abilene, TX Metro Area180,408
- Alice, TX Micro Area45,793
- Amarillo, TX Metro Area271,917
- Andrews, TX Micro Area18,610
- Athens, TX Micro Area84,862
- Austin-Round Rock-San Marcos, TX Metro Area2.43M
- Bay City, TX Micro Area36,329
- Beaumont-Port Arthur, TX Metro Area396,827
- Beeville, TX Micro Area31,083
- Big Spring, TX Micro Area32,290
- Bonham, TX Micro Area37,326
- Borger, TX Micro Area20,184
- Brenham, TX Micro Area36,647
- Brownsville-Harlingen, TX Metro Area426,120
- Brownwood, TX Micro Area38,347
- College Station-Bryan, TX Metro Area278,335
- Corpus Christi, TX Metro Area448,012
- Corsicana, TX Micro Area54,711
- Dallas-Fort Worth-Arlington, TX Metro Area7.99M
- Del Rio, TX Micro Area47,741
- Dumas, TX Micro Area21,373
- Eagle Pass, TX Metro Area58,082
- El Campo, TX Micro Area41,794
- El Paso, TX Metro Area874,182
- Fredericksburg, TX Micro Area27,524
- Gainesville, TX Micro Area43,046
- Granbury, TX Micro Area65,894
- Hereford, TX Micro Area18,460
- Houston-Pasadena-The Woodlands, TX Metro Area7.44M
- Huntsville, TX Micro Area80,209
- Jacksonville, TX Micro Area51,886
- Kerrville, TX Micro Area53,489
- Killeen-Temple, TX Metro Area494,360
- Kingsville, TX Micro Area30,579
- Laredo, TX Metro Area269,294
- Longview, TX Metro Area291,044
- Lubbock, TX Metro Area358,708
- Lufkin, TX Micro Area87,275
- McAllen-Edinburg-Mission, TX Metro Area891,977
- Midland, TX Metro Area180,019
- Mineral Wells, TX Micro Area29,295
- Mount Pleasant, TX Micro Area56,237
- Nacogdoches, TX Micro Area65,162
- Odessa, TX Metro Area164,654
- Palestine, TX Micro Area58,439
- Pampa, TX Micro Area21,877
- Paris, TX Micro Area62,280
- Plainview, TX Micro Area37,347
- Port Lavaca, TX Micro Area19,868
- Raymondville, TX Micro Area20,139
- Rio Grande City-Roma, TX Micro Area66,067
- San Angelo, TX Metro Area120,986
- San Antonio-New Braunfels, TX Metro Area2.66M
- Sherman-Denison, TX Metro Area143,337
- Snyder, TX Micro Area16,488
- Stephenville, TX Micro Area43,794
- Sulphur Springs, TX Micro Area37,784
- Sweetwater, TX Micro Area14,454
- Texarkana, TX-AR Metro Area146,296
- Town of Pecos, TX Micro Area12,664
- Tyler, TX Metro Area241,740
- Uvalde, TX Micro Area24,881
- Vernon, TX Micro Area12,616
- Victoria, TX Metro Area98,554
- Waco, TX Metro Area302,045
- Wichita Falls, TX Metro Area149,358
- Zapata, TX Micro Area13,841
ZIP codes
Each of the 1,923 with people in it, by the town it's centered in, from ACS 2020–2024 5-year estimates. These are the Census Bureau's ZIP Code Tabulation Areas, which follow the Postal Service's ZIP codes as closely as census blocks allow.
- 75001Addison16,872
- 75002Lucas75,057
- 75006Carrollton47,807
- 75007Carrollton54,646
- 75009Celina34,260
- 75010Carrollton33,326
- 75013Allen49,796
- 75019Coppell44,917
- 75020Denison24,835
- 75021Denison9,173
- 75022Flower Mound26,090
- 75023Plano49,229
- 75024Plano45,652
- 75025Plano53,202
- 75028Flower Mound49,094
- 75032Heath39,865
- 75033Frisco52,795
- 75034Frisco53,818
- 75035Frisco89,682
- 75036Frisco33,496
- 75038Irving32,755
- 75039Irving24,164
- 75040Garland64,606
- 75041Garland32,943
- 75042Garland38,112
- 75043Garland63,152
- 75044Garland47,529
- 75048Sachse30,993
- 75050Grand Prairie44,889
- 75051Grand Prairie40,884
- 75052Grand Prairie97,278
- 75054Grand Prairie18,388
- 75056Lewisville69,628
- 75057Lewisville17,958
- 75058Gunter3,625
- 75060Irving47,591
- 75061Irving56,013
- 75062Irving52,116
- 75063Irving45,849
- 75065Hickory Creek13,657
- 75067Lewisville66,913
- 75068Oak Point72,710
- 75069McKinney40,032
- 75070McKinney64,078
- 75071McKinney72,964
- 75072McKinney55,087
- 75074Plano53,831
- 75075Plano38,135
- 75076Pottsboro7,989
- 75077Highland Village42,950
- 75078Prosper53,011
- 75080Richardson52,569
- 75081Richardson36,544
- 75082Richardson29,618
- 75087Rockwall44,326
- 75088Dallas28,075
- 75089Rowlett35,619
- 75090Sherman26,594
- 75092Sherman28,342
- 75093Plano47,954
- 75094Murphy24,200
- 75098Wylie69,325
- 75101Bardwell963
- 75102Barry1,583
- 75103Canton16,824
- 75104Cedar Hill49,228
- 75105Rice216
- 75109Mildred5,344
- 75110Corsicana31,552
- 75114Crandall9,333
- 75115DeSoto56,211
- 75116Duncanville19,954
- 75117Edgewood5,109
- 75119Ennis31,866
- 75124Eustace5,981
- 75125Ferris7,873
- 75126Forney84,799
- 75127Fruitvale1,576
- 75134Lancaster19,045
- 75135Caddo Mills11,326
- 75137Duncanville19,729
- 75140Grand Saline8,469
- 75141Hutchins5,703
- 75142Kaufman22,822
- 75143Seven Points14,709
- 75144Goodlow3,581
- 75146Bear Creek Ranch25,097
- 75147Mabank9,177
- 75148Malakoff5,842
- 75149Mesquite city58,262
- 75150Mesquite city62,738
- 75152Palmer town5,321
- 75153Powell647
- 75154Red Oak52,516
- 75155Rice2,951
- 75156Enchanted Oaks16,333
- 75157Rosser227
- 75158Cottonwood6,025
- 75159Combine23,456
- 75160Terrell28,206
- 75161Elmo8,011
- 75163Trinidad2,443
- 75164Josephine885
- 75165Waxahachie53,513
- 75166Lavon6,989
- 75167Waxahachie13,904
- 75169Wills Point16,029
- 75172Wilmer5,806
- 75173Nevada10,664
- 75180Balch Springs26,455
- 75181Mesquite city29,788
- 75182Sunnyvale8,336
- 75189Royse City48,739
- 75201Dallas18,345
- 75202Dallas2,892
- 75203Dallas15,775
- 75204Dallas34,666
- 75205Highland Park26,572
- 75206Dallas38,909
- 75207Dallas8,287
- 75208Dallas29,367
- 75209Dallas14,211
- 75210Dallas7,722
- 75211Dallas73,534
- 75212Dallas28,259
- 75214Dallas34,274
- 75215Dallas18,895
- 75216Dallas55,894
- 75217Dallas85,028
- 75218Dallas22,544
- 75219Dallas23,934
- 75220Dallas40,239
- 75223Dallas11,994
- 75224Dallas35,105
- 75225University Park22,237
- 75226Dallas5,199
- 75227Dallas58,319
- 75228Dallas67,714
- 75229Dallas33,656
- 75230Dallas27,763
- 75231Dallas38,370
- 75232Dallas32,972
- 75233Dallas14,867
- 75234Farmers Branch32,961
- 75235Dallas19,637
- 75236Dallas18,963
- 75237Dallas18,260
- 75238Dallas33,199
- 75240Dallas25,290
- 75241Dallas33,840
- 75243Dallas63,481
- 75244Dallas13,389
- 75246Dallas2,286
- 75247Dallas627
- 75248Dallas38,459
- 75249Dallas16,447
- 75251Dallas3,525
- 75252Dallas28,618
- 75253Dallas24,395
- 75254Dallas25,050
- 75287Dallas53,959
- 75401Greenville22,669
- 75402Greenville20,098
- 75407Princeton34,171
- 75409Anna27,131
- 75410Alba4,556
- 75411Powderly1,090
- 75412488
- 75413Bailey118
- 75414Bells3,719
- 75415Cooper289
- 75416Deport2,873
- 75417Bogata2,162
- 75418Bonham15,155
- 75420Cumby1,041
- 75421Toco850
- 75422Campbell3,229
- 75423Celeste3,104
- 75424Blue Ridge3,790
- 75426Clarksville4,351
- 75428Commerce11,531
- 75431Como2,069
- 75432Cooper3,049
- 75433Cumby3,359
- 75434Deport6
- 75435Deport1,045
- 75436Detroit2,454
- 75437Tira1,023
- 75438Dodd City1,262
- 75439Ector1,087
- 75440Emory7,846
- 75441Cooper82
- 75442Farmersville10,805
- 75446Honey Grove3,814
- 754471,028
- 75448Cooper1,127
- 75449Ladonia868
- 75450Tira404
- 75451Rocky Mound1,156
- 75452Leonard5,024
- 75453Lone Oak3,430
- 75454Melissa22,990
- 75455Mount Pleasant26,903
- 75457Mount Vernon6,175
- 75459Dorchester6,554
- 75460Paris23,426
- 75462Reno12,372
- 75468Deport1,085
- 75469Pecan Gap372
- 75470Petty213
- 75471Como1,483
- 75472Point3,951
- 75473Powderly3,674
- 75474Quinlan17,671
- 75475Bailey203
- 75476Ravenna1,111
- 75477Roxton846
- 75478Mount Vernon927
- 75479Savoy2,284
- 75480Winnsboro1,661
- 75481487
- 75482Sulphur Springs26,483
- 75486Toco2,774
- 75487Talco1,437
- 754881,244
- 75489Tom Bean803
- 75490Trenton3,196
- 75491Whitewright5,471
- 75492Windom250
- 75493Miller's Cove629
- 75494Winnsboro11,470
- 75495Van Alstyne11,120
- 75496Wolfe City2,893
- 75497Yantis3,669
- 75501Wake Village34,866
- 75503Red Lick26,372
- 75550Annona561
- 75551Atlanta10,341
- 75554Avery1,883
- 75555McLeod1,630
- 75556Bloomburg1,184
- 75558Omaha2,126
- 75559De Kalb5,528
- 75560Douglassville962
- 75561Hooks5,014
- 75562Bivins23
- 75563Linden4,033
- 7556435
- 75565McLeod248
- 75566Marietta886
- 75567Maud3,660
- 75568Marietta2,677
- 75569Nash3,523
- 75570New Boston11,391
- 75571Omaha2,653
- 75572Domino3,130
- 75573Redwater263
- 755741,227
- 75601Longview15,780
- 75602Lakeport20,671
- 75603Lakeport6,061
- 75604Longview31,924
- 75605Longview35,417
- 75630Avinger2,452
- 75631Beckville2,483
- 75633Carthage13,271
- 75638Daingerfield5,212
- 756392,536
- 75640Ore City6,142
- 75641Easton83
- 7564286
- 75643Gary City2,300
- 75644Gilmer12,774
- 75645Gilmer10,400
- 75647Gladewater13,299
- 75650Hallsville10,703
- 75651Pine Harbor1,871
- 75652Henderson15,290
- 75654Henderson12,164
- 75656Hughes Springs4,507
- 75657Jefferson7,503
- 75658Henderson31
- 75659Waskom37
- 75661Uncertain2,360
- 75662Kilgore25,034
- 756671,413
- 75668Lone Star2,094
- 756691,034
- 75670Nesbitt18,670
- 75672Marshall16,509
- 75681Mount Enterprise2,248
- 75682Overton678
- 75683Ore City3,413
- 75684New London8,040
- 75686Pittsburg14,195
- 75689Arp98
- 75691Tatum4,130
- 75692Waskom5,563
- 75693White Oak5,935
- 75701Tyler36,344
- 75702Tyler27,927
- 75703Noonday46,039
- 75704Hideaway8,913
- 75705New Chapel Hill1,704
- 75706Lindale9,560
- 75707New Chapel Hill17,532
- 75708Winona9,732
- 75709Tyler6,015
- 75711Tyler156
- 75750Arp3,132
- 75751Malakoff18,644
- 75752Murchison7,536
- 75754Edom7,841
- 75755Big Sandy5,244
- 75756Brownsboro4,414
- 75757Bullard14,328
- 75758Chandler9,945
- 75759Cuney278
- 75760Cushing2,396
- 75762Noonday15,704
- 75763Frankston6,259
- 75764Gallatin202
- 75765Hawkins8,734
- 75766Jacksonville25,850
- 75770Moore Station2,523
- 75771Lindale21,238
- 75773Mineola14,230
- 75778Murchison3,152
- 75779Neches62
- 75780New Summerfield373
- 75782Poynor120
- 75783Quitman8,263
- 75784Reklaw531
- 75785Rusk10,705
- 75788Cushing48
- 75789Troup9,095
- 75790Van3,915
- 75791Whitehouse15,786
- 75792Winona3,898
- 75801Palestine17,531
- 75803Palestine21,770
- 75831Buffalo4,881
- 75833Centerville3,550
- 75835Crockett12,439
- 75838209
- 75839Elkhart6,796
- 75840Fairfield6,994
- 75844Grapeland4,770
- 75845Groveton2,473
- 75846Jewett2,741
- 75847Kennard1,328
- 75848Kirvin64
- 75849Latexo62
- 75850Leona1,239
- 75851Lovelady4,336
- 75852Midway3,323
- 75853999
- 75855Oakwood2,635
- 7585665
- 75858Kennard57
- 75859Streetman2,337
- 75860Teague6,624
- 758611,381
- 75862Westwood Shores9,968
- 758842,697
- 758862,456
- 75901Huntington28,234
- 75903Redland64
- 75904Hudson34,462
- 75925Alto3,657
- 759261,389
- 75928899
- 75929Broaddus1,498
- 75930Pineland2,330
- 75931Sam Rayburn2,323
- 75932South Toledo Bend1,291
- 75933Kirbyville1,418
- 75934Seven Oaks105
- 75935Center12,621
- 75936Chester717
- 75937Chireno1,313
- 75938Colmesneil2,846
- 75939Pleasant Hill4,725
- 75941Diboll8,461
- 759431,144
- 75944Broaddus771
- 75946Garrison4,170
- 75948Hemphill5,238
- 75949Huntington9,138
- 75951Jasper15,144
- 75954Joaquin3,607
- 75956Kirbyville6,982
- 75959Milam1,025
- 75960Seven Oaks1,304
- 7596115,183
- 75962Nacogdoches3,159
- 75964Nacogdoches20,470
- 75965Appleby18,243
- 75966Newton4,994
- 75968Pineland1,818
- 75969Wells4,479
- 75972San Augustine5,708
- 75973Huxley2,453
- 75974Tenaha2,592
- 75975Timpson3,671
- 75976Wells912
- 75977547
- 75979Woodville11,273
- 75980Zavalla2,539
- 76001Arlington38,913
- 76002Arlington35,265
- 76005Arlington7,102
- 76006Arlington23,446
- 76008Annetta South25,165
- 76009Alvarado22,803
- 76010Arlington54,978
- 76011Arlington22,752
- 76012Arlington27,991
- 76013Pantego35,715
- 76014Arlington32,818
- 76015Arlington18,135
- 76016Arlington31,280
- 76017Arlington47,074
- 76018Arlington26,834
- 76020Azle34,602
- 76021Bedford35,354
- 76022Bedford13,760
- 76023Briar7,534
- 76028Burleson81,549
- 76031Coyote Flats18,920
- 76033Cleburne29,538
- 76034Colleyville26,103
- 76035Cresson2,656
- 76036Crowley36,044
- 76039Euless39,855
- 76040Fort Worth31,677
- 76041Italy755
- 76043Glen Rose6,858
- 76044Godley9,196
- 76048Granbury27,000
- 76049Granbury31,506
- 76050Grandview7,282
- 76051Grapevine50,618
- 76052Fort Worth34,249
- 76053Hurst32,323
- 76054Hurst11,744
- 76055Itasca3,577
- 76058Burleson22,276
- 76059Keene5,586
- 76060Kennedale9,444
- 76061The Homesteads22
- 76063Mansfield82,625
- 76064Maypearl2,513
- 76065Midlothian47,438
- 76066Millsap5,865
- 76067Mineral Wells21,080
- 76070Glen Rose1,164
- 76071Newark5,159
- 76073Paradise7,648
- 76077Glen Rose1,001
- 76078New Fairview10,828
- 76082Springtown24,880
- 76084Venus14,097
- 76085Carter12,357
- 76086Weatherford23,328
- 76087Western Lake36,822
- 76088Peaster15,290
- 76092Southlake31,520
- 76093Rio Vista4,198
- 76102Fort Worth11,895
- 76103Fort Worth15,975
- 76104Fort Worth20,443
- 76105Fort Worth22,228
- 76106Fort Worth35,946
- 76107Fort Worth30,994
- 76108Lakeside45,537
- 76109Fort Worth26,006
- 76110Fort Worth33,441
- 76111Fort Worth20,989
- 76112Fort Worth44,514
- 76114River Oaks27,357
- 76115Fort Worth19,655
- 76116Fort Worth49,856
- 76117Haltom City32,950
- 76118Fort Worth17,991
- 76119Fort Worth52,974
- 76120Fort Worth21,102
- 76123Fort Worth42,957
- 76126Fort Worth27,689
- 76127Fort Worth1,729
- 76129Fort Worth1,641
- 76131Saginaw56,322
- 76132Fort Worth26,927
- 76133Fort Worth53,958
- 76134Fort Worth29,949
- 76135Fort Worth19,445
- 76137Fort Worth60,352
- 76140Fort Worth33,321
- 76148Watauga23,367
- 76155Fort Worth6,533
- 76164Fort Worth13,457
- 76177Fort Worth25,012
- 76179Fort Worth80,090
- 76180North Richland Hills38,371
- 76182North Richland Hills30,242
- 76201Denton31,143
- 76203Denton1,085
- 76205Denton18,978
- 76207Denton19,862
- 76208Denton30,025
- 76209Denton27,982
- 76210Denton47,610
- 76225Alvord3,487
- 76226Argyle43,587
- 76227Krugerville62,127
- 76228Bellevue1,263
- 76230Bowie10,536
- 76233Collinsville3,711
- 76234Decatur21,418
- 76238657
- 762391,341
- 76240Gainesville29,419
- 76244Fort Worth76,728
- 76245Sherwood Shores1,814
- 76247Justin21,726
- 76248Keller40,936
- 76249Krum10,637
- 76250Lindsay city881
- 76251Montague708
- 76252Muenster2,947
- 76253Myra232
- 76255Nocona6,053
- 76258Pilot Point8,444
- 76259Ponder6,596
- 76261Ringgold221
- 76262Roanoke43,620
- 7626335
- 76264Sadler997
- 76265Saint Jo1,566
- 76266Sanger18,155
- 76267113
- 76268Southmayd243
- 76270Sunset1,826
- 76271Tioga1,859
- 76272Valley View5,335
- 76273Callisburg11,229
- 76301Wichita Falls15,479
- 76302Wichita Falls11,932
- 76305Dean4,941
- 76306Wichita Falls13,963
- 76308Wichita Falls21,896
- 76309Wichita Falls13,395
- 76310Lakeside City19,029
- 76311Wichita Falls6,362
- 76351Archer City1,256
- 76354Burkburnett11,990
- 76357Byers525
- 763602,699
- 76363Goree137
- 76364Harrold268
- 76365Henrietta4,842
- 76366Holliday2,074
- 76367Iowa Park14,367
- 76370Megargel429
- 76371Munday1,675
- 76372Elbert1,053
- 76373Oklaunion181
- 76374Olney4,073
- 76377Petrolia464
- 76379Scotland672
- 76380Seymour3,509
- 76384Vernon12,069
- 76388Weinert248
- 76389Windthorst1,739
- 76401Stephenville31,375
- 76402Stephenville750
- 76424Breckenridge8,629
- 76426Runaway Bay11,632
- 76427Bryson1,001
- 76429330
- 76430Albany2,395
- 76431Chico4,494
- 76432Blanket1,459
- 76433Bluff Dale2,178
- 76435Carbon726
- 76436Lamkin115
- 76437Cisco5,882
- 76442Comanche7,372
- 76443Cross Plains1,999
- 76444De Leon4,081
- 76445222
- 76446Dublin8,131
- 76448Eastland5,100
- 76449Graford2,113
- 76450Graham12,999
- 76452Gustine142
- 76453Gordon1,440
- 76454Gorman1,320
- 76455Gustine784
- 76457Hico4,244
- 76458Jacksboro6,240
- 76459Bryson77
- 76460Loving469
- 76462Lipan5,167
- 76463Mingus577
- 76464Moran477
- 76466Ranger564
- 76469Putnam9
- 76470Ranger3,218
- 76471Rising Star1,484
- 76472Santo1,725
- 76474May494
- 76475Strawn997
- 76476Tolar4,144
- 7648196
- 76483Throckmorton822
- 76484Palo Pinto879
- 76486Perrin1,123
- 76487Peaster4,133
- 76490Perrin41
- 76491Woodson743
- 76501Temple17,752
- 76502Temple52,669
- 76504Temple26,166
- 76511Bartlett2,702
- 76513Belton45,928
- 76518Buckholts1,031
- 76519Burlington782
- 76520Cameron8,426
- 76522Copperas Cove42,118
- 76523Rogers354
- 76524Bruceville-Eddy3,668
- 76525Evant1,289
- 76527Florence4,918
- 76528Gatesville18,935
- 76530Granger2,598
- 76531Hamilton4,703
- 76534Holland2,675
- 76537Sonterra16,272
- 76538882
- 76539Kempner9,415
- 76541Killeen19,011
- 76542Harker Heights53,892
- 76543Nolanville34,457
- 76544Mound28,191
- 76548Harker Heights33,729
- 76549Killeen56,038
- 76550Lampasas13,675
- 76554Little River-Academy2,344
- 76556Milano1,692
- 76557Moody5,644
- 76559Nolanville7,197
- 76561Oglesby996
- 76566370
- 76567Praesel9,032
- 76569Rogers2,761
- 76570Rosebud2,339
- 76571Salado9,000
- 76574Taylor20,242
- 76577Thorndale3,128
- 76578Thrall1,762
- 76579Troy5,448
- 76596Gatesville1,060
- 76597Gatesville3,005
- 76598Gatesville491
- 76599Gatesville1,980
- 76621Abbott1,104
- 76622Aquilla1,447
- 76623Italy186
- 76624Leroy2,660
- 76626Blooming Grove1,036
- 76627Blum1,736
- 76628Mertens50
- 76629Bremond2,053
- 76630Lorena1,589
- 76631Bynum455
- 76632Chilton1,350
- 76633China Spring6,268
- 76634Clifton7,537
- 76635Coolidge1,392
- 76636Covington1,748
- 76637Cranfills Gap440
- 76638Crawford3,671
- 76639Dawson2,153
- 76640Ross3,089
- 76641Frost2,487
- 76642Groesbeck6,363
- 76643Hewitt16,432
- 76645Hillsboro11,494
- 76648Hubbard2,777
- 76649Iredell813
- 76650Malone55
- 76651Italy3,984
- 76652Kopperl1,044
- 76653Kosse1,067
- 76654Leroy175
- 76655Lorena10,603
- 76656Lott2,391
- 76657McGregor12,760
- 76660Malone572
- 76661Marlin7,602
- 76664Mart3,231
- 76665Meridian2,771
- 76666Mertens261
- 76667Mexia10,494
- 76670Milford1,963
- 76671Morgan2,093
- 76673Mount Calm1,196
- 76676Penelope344
- 76678Mart102
- 76679Oak Valley1,433
- 76680Bremond130
- 76681Richland674
- 76682Riesel3,661
- 76685Golinda28
- 76686Tehuacana341
- 76687Thornton1,830
- 76689Valley Mills4,564
- 76690Walnut Springs1,214
- 76691West6,661
- 76692Whitney9,853
- 76693Wortham2,153
- 76701Waco1,871
- 76704Waco7,018
- 76705Bellmead31,616
- 76706Robinson41,627
- 76707Waco15,879
- 76708Waco27,790
- 76710Waco23,329
- 76711Waco9,676
- 76712Woodway29,118
- 76798Waco2,883
- 76801Bangs25,146
- 76802Early5,415
- 76820104
- 76821Ballinger4,670
- 76823Bangs2,785
- 76825Brady6,454
- 76827731
- 76828168
- 76832544
- 76834Coleman4,981
- 7683625
- 76837Eden1,926
- 76841262
- 76842297
- 76844Goldthwaite3,284
- 76845168
- 7684860
- 76849Junction3,584
- 76852278
- 76853Lometa1,618
- 76854345
- 76856Mason3,532
- 76857May2,024
- 76858Melvin212
- 76859Menard1,641
- 76861Miles2,177
- 76862158
- 76864Mullin798
- 76865Bronte206
- 76866Paint Rock1,111
- 76870Priddy65
- 76871Richland Springs728
- 76872Rochelle754
- 76873120
- 76875Rowena404
- 76877San Saba4,111
- 76878Santa Anna1,585
- 76882313
- 76884Valera121
- 76885142
- 7688787
- 76888150
- 76890Zephyr803
- 76901Carlsbad31,831
- 76903San Angelo29,947
- 76904Christoval36,954
- 76905San Angelo14,456
- 76908San Angelo1,322
- 76909San Angelo405
- 7693081
- 76932Big Lake3,232
- 76933Bronte1,435
- 76934Carlsbad1,471
- 769351,696
- 76936Eldorado2,369
- 76937280
- 7694071
- 76941Mertzon1,158
- 769432,651
- 76945Robert Lee1,689
- 769503,352
- 76951Sterling City1,468
- 7695333
- 7695580
- 7695749
- 76958Carlsbad213
- 77002Houston21,015
- 77003Houston10,164
- 77004Houston35,997
- 77005West University Place28,874
- 77006Houston24,892
- 77007Houston47,808
- 77008Houston41,645
- 77009Houston35,769
- 77010Houston718
- 77011Houston14,940
- 77012Houston16,286
- 77013Houston18,259
- 77014Aldine36,119
- 77015Cloverleaf58,415
- 77016Houston29,841
- 77017Houston29,640
- 77018Houston31,031
- 77019Houston23,708
- 77020Houston23,686
- 77021Houston26,153
- 77022Houston25,805
- 77023Houston24,281
- 77024Hunters Creek Village38,288
- 77025Houston29,715
- 77026Houston21,981
- 77027Houston20,317
- 77028Houston19,109
- 77029Houston16,154
- 77030Houston13,380
- 77031Houston15,179
- 77032Houston12,403
- 77033Houston29,154
- 77034Houston36,456
- 77035Houston36,019
- 77036Houston71,770
- 77037Aldine19,004
- 77038Aldine32,637
- 77039Aldine27,862
- 77040Jersey Village50,977
- 77041Jersey Village33,349
- 77042Houston38,721
- 77043Houston29,048
- 77044Sheldon58,347
- 77045Houston33,563
- 77046Houston1,793
- 77047Houston34,987
- 77048Houston21,151
- 77049Sheldon40,418
- 77050Humble6,566
- 77051Houston19,795
- 77053Houston30,198
- 77054Houston28,272
- 77055Houston45,435
- 77056Houston22,877
- 77057Houston46,569
- 77058Houston17,850
- 77059Houston18,767
- 77060Houston45,340
- 77061Houston24,004
- 77062Houston25,523
- 77063Houston42,690
- 77064Jersey Village49,591
- 77065Jersey Village38,926
- 77066Jersey Village39,311
- 77067Aldine30,491
- 77068Spring13,189
- 77069Jersey Village20,608
- 77070Jersey Village58,229
- 77071Houston27,056
- 77072Houston57,108
- 77073Spring46,084
- 77074Houston38,660
- 77075Houston40,626
- 77076Houston31,222
- 77077Houston60,098
- 77078Houston14,247
- 77079Houston37,276
- 77080Houston47,638
- 77081Houston50,129
- 77082Houston59,412
- 77083Mission Bend73,230
- 77084Houston110,217
- 77085Houston16,513
- 77086Houston28,653
- 77087Houston34,347
- 77088Houston57,047
- 77089Houston57,741
- 77090Spring40,110
- 77091Houston28,728
- 77092Houston36,938
- 77093Houston46,407
- 77094Cinco Ranch10,395
- 77095Jersey Village69,767
- 77096Houston35,032
- 77098Houston17,210
- 77099Houston50,064
- 77204Houston4,579
- 77301Conroe37,769
- 77302Grangerland21,546
- 77303Cut and Shoot28,854
- 77304Conroe44,225
- 77306Deerwood18,086
- 77316Montgomery34,694
- 77318Willis20,792
- 77320Huntsville38,152
- 77326Big Thicket Lake Estates275
- 7732742,685
- 77328North Cleveland17,208
- 77331Coldspring7,556
- 77334Riverside197
- 77335Goodrich2,468
- 77336Roman Forest14,342
- 77338Humble48,031
- 77339Houston44,538
- 77340Huntsville37,517
- 77345Houston27,917
- 77346Atascocita79,538
- 77350Seven Oaks347
- 77351Indian Springs37,143
- 77354Pinehurst CDP44,900
- 77355Stagecoach32,847
- 77356Montgomery32,583
- 77357Woodbranch37,592
- 77358New Waverly5,087
- 77359Oakhurst683
- 77360Onalaska6,223
- 77362Stagecoach8,017
- 77363Plantersville3,468
- 77364Point Blank2,178
- 77365Porter Heights46,418
- 77367Riverside446
- 77369Big Thicket Lake Estates738
- 77371Shepherd7,800
- 77372Splendora14,367
- 77373Spring69,739
- 77374244
- 77375Tomball72,311
- 77376Big Thicket Lake Estates570
- 77377Tomball41,680
- 77378Willis17,629
- 77379Tomball85,190
- 77380The Woodlands31,369
- 77381The Woodlands36,139
- 77382The Woodlands38,986
- 77384Conroe26,781
- 77385Shenandoah28,156
- 77386Spring69,980
- 77388Spring53,425
- 77389The Woodlands45,701
- 77396Humble61,735
- 77401Bellaire17,213
- 77406Pecan Grove69,918
- 77407Four Corners88,319
- 77412Rock Island6
- 77414Wadsworth24,334
- 77415Sweeny63
- 77417Beasley3,920
- 77418Bellville10,171
- 77419Blessing609
- 77420Boling2,236
- 77422Brazoria14,547
- 77423Pattison18,767
- 77426Brenham2,007
- 77428Palacios151
- 77429Tomball96,334
- 77430Damon1,664
- 77431Van Vleck250
- 77433116,550
- 77434Eagle Lake3,970
- 77435East Bernard4,812
- 77436Nada28
- 77437El Campo18,238
- 77440Blessing45
- 77441Fulshear41,324
- 77442Garwood1,123
- 77444Damon911
- 77445Hempstead16,142
- 77446Prairie View5,780
- 77447Waller25,231
- 77448Hungerford171
- 77449Cinco Ranch130,028
- 77450Cinco Ranch71,906
- 77451Kendleton515
- 77453Iago91
- 77454Eagle Lake178
- 77455Louise1,629
- 77456Markham1,394
- 77457Matagorda353
- 77459Missouri City84,221
- 77460Nada76
- 77461Fairchilds12,365
- 77464Orchard407
- 77465Palacios7,681
- 77466Pattison220
- 77467El Campo80
- 77469Thompsons69,826
- 77470Rock Island414
- 77471Rosenberg45,325
- 77473San Felipe49
- 77474Sealy15,146
- 77475Sheridan431
- 77476Simonton423
- 77477Stafford33,752
- 77478Sugar Land23,182
- 77479Sugar Land92,221
- 77480Sweeny7,626
- 77481Thompsons78
- 77482Van Vleck2,050
- 77483Wadsworth257
- 77484Waller14,348
- 77485Wallis4,378
- 77486West Columbia7,195
- 77488Wharton14,548
- 77489Missouri City39,292
- 77493Katy71,484
- 77494Cinco Ranch140,157
- 77498Four Corners52,806
- 77502Pasadena36,371
- 77503Pasadena23,866
- 77504Pasadena25,779
- 77505Pasadena23,174
- 77506Galena Park35,114
- 77507Shoreacres567
- 77510Santa Fe14,155
- 77511Hillcrest Village51,892
- 77514Oak Island5,480
- 77515Angleton34,088
- 77517Santa Fe5,529
- 77518Bacliff9,541
- 77519Hull716
- 77520Baytown36,355
- 77521Baytown69,038
- 77523Beach City30,186
- 77530Channelview31,527
- 77531Richwood16,406
- 77532Crosby33,780
- 77533Daisetta1,016
- 77534Danbury3,403
- 77535Dayton39,504
- 77536Deer Park33,174
- 77538Devers917
- 77539Dickinson49,375
- 77541Oyster Creek16,996
- 77545Fresno26,236
- 77546Friendswood54,789
- 77547Galena Park9,217
- 77550Galveston23,489
- 77551Galveston21,696
- 77554Galveston10,414
- 77555Galveston2
- 77560Anahuac1,238
- 77561Hardin36
- 77562Highlands8,914
- 77563Hitchcock9,955
- 77564Hull1,806
- 77565Clear Lake Shores6,943
- 77566Lake Jackson30,246
- 77568La Marque23,083
- 77571La Porte38,543
- 77573League City98,109
- 77575Liberty16,613
- 77577Liverpool1,562
- 77578Manvel30,210
- 77581Pearland51,332
- 77582Devers135
- 77583Rosharon52,747
- 77584Pearland91,065
- 775851,112
- 77586Seabrook23,807
- 77587South Houston16,033
- 77590Texas City31,642
- 77591Texas City18,294
- 77597Anahuac623
- 77598Webster26,110
- 77611Bridge City10,112
- 77612Buna9,101
- 77613China692
- 77614Deweyville330
- 77615Evadale252
- 77616860
- 77617Bolivar Peninsula44
- 77619Groves16,976
- 77622Hamshire1,818
- 77623Bolivar Peninsula585
- 77624Ivanhoe573
- 77625Kountze9,049
- 77627Central Gardens22,357
- 77629Nome435
- 77630Bridge City28,983
- 77632Little Cypress22,976
- 77640Port Arthur17,167
- 77642Groves38,358
- 77650Bolivar Peninsula2,322
- 77651Port Neches13,664
- 77655Port Arthur330
- 77656Silsbee17,525
- 77657Lumberton22,258
- 77659Sour Lake5,650
- 776601,151
- 77661Stowell102
- 77662Pine Forest25,041
- 77663Wildwood584
- 77664Warren2,474
- 77665Stowell7,511
- 77701Beaumont12,381
- 77702Beaumont3,121
- 77703Beaumont11,004
- 77705Taylor Landing38,259
- 77706Beaumont30,393
- 77707Beaumont18,323
- 77708Beaumont12,065
- 77713China15,541
- 77801Bryan15,461
- 77802Bryan25,762
- 77803Bryan31,525
- 77807Lake Bryan13,227
- 77808Kurten15,797
- 77830Anderson3,238
- 77831Bedias3,676
- 77833Brenham29,498
- 77835Burton2,569
- 77836Caldwell12,670
- 77837Calvert1,030
- 77840College Station54,864
- 77843College Station8,259
- 77845College Station76,764
- 77852Deanville16
- 77853Dime Box884
- 77855Leona165
- 77856Franklin5,515
- 77857Gause1,078
- 77859Hearne7,532
- 77861Iola3,065
- 77863Lyons482
- 77864Madisonville7,640
- 77865Marquez1,510
- 77867Lake Bryan206
- 77868Navasota18,416
- 77871Normangee3,058
- 77872Iola2,026
- 77873Richards1,383
- 77876Shiro34
- 77878Snook1,113
- 77879Lyons4,611
- 77880Navasota2,517
- 77901Victoria39,854
- 77904Victoria30,061
- 77905Quail Creek16,599
- 77950Holiday Beach178
- 77951Bloomington1,930
- 77954Cuero11,424
- 77957Edna9,069
- 77961La Ward58
- 77962Ganado3,491
- 77963Goliad5,191
- 77964Hallettsville8,204
- 77968Inez2,605
- 77969Vanderbilt84
- 77970La Ward217
- 77971Lolita744
- 77974695
- 77975Moulton1,780
- 7797616
- 77977Placedo539
- 77978Point Comfort304
- 77979Port Lavaca16,488
- 77982Port O'Connor620
- 77983Seadrift2,529
- 77984Shiner4,800
- 77987Yoakum253
- 77988Victoria281
- 77990Tivoli590
- 77991Vanderbilt440
- 77993370
- 77994424
- 77995Yoakum10,365
- 78002Macdona7,035
- 78003Bandera9,967
- 78004Bulverde547
- 78005Bigfoot1,573
- 78006Boerne44,560
- 78007Tilden196
- 78008234
- 78009Castroville9,151
- 78010Center Point3,635
- 78011Charlotte1,757
- 78012Christine328
- 78013Comfort4,809
- 78014Cotulla5,002
- 78015Fair Oaks Ranch24,867
- 78016Devine11,670
- 78017Hilltop5,551
- 78019Encinal1,836
- 78021Fowlerton165
- 78022George West4,682
- 78023Grey Forest28,462
- 780241,401
- 78025Ingram4,999
- 78026Christine7,031
- 78027318
- 78028Kerrville41,206
- 78039LaCoste1,862
- 78040Laredo35,709
- 78041Laredo46,550
- 78043Pueblo Nuevo45,760
- 78044Hillside Acres220
- 7804567,333
- 78046La Presa72,951
- 78050Leming529
- 78052Lytle6,389
- 780551,753
- 78056Lakehills2,526
- 78057Moore881
- 78058985
- 78059Natalia7,061
- 78061Pearsall10,500
- 78063Lakehills10,778
- 78064Pleasanton16,365
- 78065Poteet11,695
- 78066Castroville259
- 78067San Ygnacio629
- 78069Somerset7,038
- 78070Spring Branch20,200
- 78071Three Rivers3,576
- 78072403
- 78073Somerset10,088
- 78075252
- 78076Medina13,123
- 78101St. Hedwig7,267
- 78102Beeville27,455
- 78104Normanna21
- 78107254
- 78108Cibolo49,784
- 78109San Antonio63,067
- 78112Sandy Oaks9,769
- 78113Falls City3,026
- 78114Floresville24,283
- 78116226
- 78117Karnes City661
- 78118Karnes City4,676
- 78119Kenedy7,270
- 78121La Vernia16,120
- 78122338
- 78123McQueeney2,127
- 78124Marion6,157
- 78125Pawnee32
- 78130New Braunfels104,009
- 78132New Braunfels40,953
- 78133Canyon Lake21,959
- 78140Nixon3,474
- 78141Nordheim868
- 78144Karnes City47
- 78145Pawnee64
- 78146Pettus752
- 78147Poth1,532
- 78148Universal City22,187
- 78151Runge1,378
- 78152St. Hedwig4,521
- 78154Schertz41,907
- 78155Seguin55,600
- 78159Smiley623
- 78160Stockdale4,885
- 78161Stockdale579
- 78162Tuleta331
- 78163Bulverde19,141
- 78164Yorktown2,927
- 78201San Antonio41,981
- 78202San Antonio10,224
- 78203San Antonio5,200
- 78204San Antonio11,983
- 78205San Antonio1,538
- 78207San Antonio55,474
- 78208San Antonio3,861
- 78209San Antonio43,400
- 78210San Antonio34,940
- 78211San Antonio30,857
- 78212San Antonio27,437
- 78213Castle Hills40,526
- 78214San Antonio22,118
- 78215San Antonio3,506
- 78216San Antonio41,180
- 78217San Antonio34,055
- 78218San Antonio39,428
- 78219San Antonio17,924
- 78220San Antonio19,423
- 78221San Antonio42,178
- 78222San Antonio26,476
- 78223Elmendorf58,983
- 78224San Antonio22,232
- 78225San Antonio13,104
- 78226San Antonio6,554
- 78227San Antonio44,035
- 78228San Antonio56,165
- 78229San Antonio35,664
- 78230San Antonio41,387
- 78231Shavano Park9,744
- 78232Hollywood Park36,636
- 78233San Antonio48,911
- 78234San Antonio7,149
- 78235San Antonio2,304
- 78236Lackland AFB7,635
- 78237San Antonio37,379
- 78238San Antonio26,032
- 78239Windcrest28,609
- 78240San Antonio57,921
- 78242San Antonio36,168
- 78243Lackland AFB232
- 78244Kirby38,092
- 78245Macdona96,015
- 78247San Antonio51,933
- 78248San Antonio14,488
- 78249San Antonio63,439
- 78250San Antonio57,323
- 78251San Antonio59,435
- 78252Macdona21,790
- 78253Castroville69,282
- 78254Helotes77,893
- 78255Cross Mountain17,379
- 78256San Antonio13,453
- 78257Shavano Park10,992
- 78258San Antonio52,448
- 78259San Antonio29,826
- 78260Timberwood Park38,023
- 78261Timberwood Park26,657
- 78263China Grove4,253
- 78264Sandy Oaks11,841
- 78266Garden Ridge7,338
- 78330Agua Dulce city351
- 78332Coyote Acres27,042
- 78336Falman12,424
- 7833836
- 78339Banquete465
- 78340Bayside455
- 78341Benavides1,550
- 78342Ben Bolt399
- 78343Driscoll4,345
- 78344Bruni295
- 78347186
- 78349Concepcion438
- 78351Driscoll483
- 78352Edroy54
- 78353Encino476
- 78355Cantu Addition6,772
- 78357Freer2,624
- 78358Fulton478
- 78359Gregory2,154
- 783614,727
- 78362Ingleside10,816
- 78363Ricardo28,920
- 78368Mathis9,464
- 78369Aguilares211
- 78370Odem5,353
- 78371Aguilares101
- 78372Westdale5,383
- 78373Corpus Christi3,348
- 78374Portland20,408
- 78375Premont2,754
- 78376Realitos105
- 78377Refugio3,421
- 78379Riviera1,659
- 78380Spring Gardens23,149
- 78382Fulton20,568
- 78383Lake City4,081
- 783845,747
- 78385Sarita109
- 78387St. Paul CDP9,640
- 78389Skidmore1,754
- 78390Taft6,013
- 78391Tynan77
- 78393Woodsboro2,063
- 78401Corpus Christi4,344
- 78402Corpus Christi554
- 78404Corpus Christi12,635
- 78405Corpus Christi14,602
- 78406Corpus Christi2,301
- 78407Portland1,674
- 78408Corpus Christi10,111
- 784092,937
- 78410Corpus Christi29,040
- 78411Corpus Christi23,682
- 78412Corpus Christi38,631
- 78413Corpus Christi34,289
- 78414Corpus Christi54,263
- 78415Tierra Grande43,080
- 78416Corpus Christi12,480
- 78417Corpus Christi4,703
- 7841829,790
- 78419Corpus Christi693
- 78501McAllen58,935
- 78503McAllen22,621
- 78504McAllen63,094
- 78516South Alamo34,370
- 78520Brownsville64,740
- 78521Reid Hope King87,380
- 78526Brownsville60,012
- 78535Combes425
- 78536Delmita371
- 78537Donna51,426
- 78538Monte Alto11,982
- 78539Edinburg37,168
- 7854151,710
- 78542La Coma Heights89,401
- 78543Elsa8,400
- 78545Lago Vista CDP392
- 78547Ramirez-Perez306
- 78548La Grulla1,341
- 78549Hargill609
- 78550Lasana53,335
- 78552Palm Valley42,332
- 78557Hidalgo14,498
- 78558La Blanca722
- 78559La Feria12,169
- 78560Havana4,635
- 78561Lasara1,457
- 78562Laguna Seca3,211
- 7856392
- 78564Lopeño89
- 78565Los Ebanos20
- 78566Bayview25,110
- 78567Los Indios323
- 78569Lyford4,342
- 78570Mercedes34,348
- 78572Mission78,024
- 78573Alton44,809
- 78574Citrus City62,456
- 78575Rancho Viejo town4,575
- 78576Salida del Sol Estates15,484
- 78577Pharr80,540
- 78578Port Isabel10,016
- 78579Progreso2,039
- 78580Los Angeles12,964
- 78582El Brazil44,741
- 78583La Tina Ranch5,236
- 78584Regino Ramirez18,464
- 78586El Camino Angosto50,964
- 78588San Isidro289
- 78589Pharr40,231
- 78590San Perlita428
- 78591San Isidro158
- 78592Santa Maria677
- 78593Tierra Bonita5,455
- 78594Sebastian1,206
- 78595Sullivan City6,118
- 78596Villa Verde39,518
- 785972,935
- 78598Port Mansfield245
- 78599Olivarez35,454
- 78602Bastrop38,190
- 78605Bertram7,573
- 78606Blanco7,272
- 78607Buchanan Dam118
- 78608Briggs428
- 78609Buchanan Dam1,983
- 78610Buda48,319
- 78611Burnet14,560
- 78612Cedar Creek19,799
- 78613Cedar Park89,956
- 78614262
- 78615Coupland1,637
- 78616Red Rock10,683
- 78617Garfield30,756
- 78618346
- 78619Driftwood6,693
- 78620Dripping Springs22,860
- 78621Elgin30,411
- 78622Staples331
- 78623Canyon Lake1,645
- 78624Fredericksburg23,741
- 78626Weir48,072
- 78628Santa Rita Ranch50,822
- 78629Gonzales12,740
- 78631Harper3,465
- 786321,245
- 78633Georgetown29,309
- 78634Hutto46,413
- 78635Stonewall92
- 78636Johnson City4,134
- 78638Kingsbury2,135
- 78639Kingsland8,719
- 78640Niederwald77,531
- 78641Leander99,865
- 78642Liberty Hill26,434
- 78643Llano7,088
- 78644Lockhart22,348
- 78645Lago Vista city15,256
- 78648Luling7,863
- 78650McDade2,409
- 78652Hays5,287
- 78653Manor41,291
- 78654Marble Falls20,650
- 78655Martindale3,730
- 78656Uhland2,847
- 78657Horseshoe Bay7,591
- 78658Luling94
- 78659Paige2,660
- 78660Pflugerville124,834
- 78661Staples835
- 78662Red Rock3,015
- 78663Round Mountain503
- 78664Round Rock62,060
- 78665Round Rock66,171
- 78666San Marcos88,583
- 78669Briarcliff12,592
- 78670Staples130
- 78671Stonewall413
- 78672Tow570
- 78674Weir108
- 78675102
- 78676Woodcreek15,822
- 78677Smiley44
- 78681Round Rock56,691
- 78701Austin11,824
- 78702Austin25,985
- 78703Austin23,483
- 78704Austin50,688
- 78705Austin33,238
- 78712Austin201
- 78717Austin37,262
- 78719Creedmoor1,796
- 78721Austin10,997
- 78722Austin6,767
- 78723Austin38,129
- 78724Austin31,103
- 78725Hornsby Bend10,746
- 78726Austin14,506
- 78727Austin29,958
- 78728Wells Branch26,777
- 78729Brushy Creek30,460
- 78730Austin9,142
- 78731Austin27,507
- 78732Steiner Ranch21,087
- 78733Lost Creek9,029
- 78734Lakeway22,145
- 78735Barton Creek20,996
- 78736Bee Cave9,651
- 78737Bear Creek27,023
- 78738Bee Cave31,019
- 78739Austin20,659
- 78741Austin45,951
- 78742Hornsby Bend847
- 78744Austin50,986
- 78745Austin61,219
- 78746West Lake Hills28,256
- 78747Creedmoor22,180
- 78748San Leanna55,631
- 78749Austin34,562
- 78750Austin29,277
- 78751Austin16,961
- 78752Austin23,317
- 78753Austin56,920
- 78754Austin32,690
- 78756Austin9,197
- 78757Austin23,856
- 78758Austin49,617
- 78759Austin43,182
- 7880121,607
- 78827Asherton663
- 78829Batesville1,028
- 78830Big Wells597
- 78832Brackettville3,157
- 78833Camp Wood1,219
- 78834Carrizo Springs6,971
- 78836Catarina155
- 78837128
- 78838125
- 78839Crystal City7,091
- 7884047,256
- 78843Laughlin AFB307
- 78850D'Hanis779
- 7885144
- 7885257,434
- 78861Hondo14,008
- 78870Knippa1,070
- 7887132
- 78872La Pryor1,287
- 78873Leakey1,472
- 78877Quemado648
- 78879Leakey184
- 78880Rocksprings1,194
- 78881Sabinal1,283
- 78883208
- 78884Utopia1,171
- 7888523
- 78886Yancey286
- 78931Industry185
- 78932Carmine576
- 789331,395
- 78934Columbus6,731
- 78935Columbus734
- 78938Ellinger270
- 78940Fayetteville2,188
- 78941Flatonia3,619
- 78942Giddings10,136
- 78943Glidden886
- 78944Industry720
- 78945La Grange10,394
- 78946Carmine1,117
- 78947Lexington5,044
- 78948Lexington567
- 78949Plum760
- 78950New Ulm2,300
- 78953Rosanky1,089
- 78954Round Top1,173
- 78956Schulenburg5,243
- 78957Smithville10,543
- 78959Waelder1,157
- 78962Weimar5,236
- 78963Plum605
- 79001Adrian168
- 79002Alanreed15
- 79003Allison177
- 79005Booker1,536
- 79007Borger13,889
- 79009Bovina1,795
- 79010Boys Ranch616
- 79011Allison176
- 79013Cactus3,048
- 79014Canadian3,201
- 79015Canyon23,765
- 79016Canyon310
- 79018Channing367
- 79019Claude1,671
- 7902146
- 79022Dalhart10,826
- 79024Darrouzett349
- 79027Dimmitt4,858
- 79029Dumas15,411
- 79031Earth1,156
- 79032Edmonson133
- 79033Farnsworth20
- 79034Follett418
- 79035Friona5,391
- 79036Fritch5,007
- 79039Groom744
- 790401,979
- 79041Hale Center2,861
- 79042Happy1,218
- 79043Hart1,462
- 79044Hartley583
- 79045Hereford18,189
- 79046Higgins514
- 790519
- 79052Kress1,101
- 7905374
- 79054Lefors660
- 79056Lipscomb107
- 79057McLean1,010
- 79059Miami726
- 79061Mobeetie288
- 79062Morse435
- 79063Nazareth665
- 79064Olton2,099
- 79065Pampa19,378
- 79066Pampa19
- 79068Panhandle2,784
- 790709,626
- 79072Plainview25,389
- 79078Sanford184
- 79079Shamrock2,222
- 79080Skellytown541
- 79081Spearman2,974
- 79082Springlake382
- 79083Stinnett1,669
- 79084Stratford1,595
- 79086Sunray3,219
- 79087Texline813
- 79088Tulia5,302
- 79092Vega1,361
- 79093Waka110
- 790947
- 79095Wellington2,405
- 79096Wheeler2,095
- 79097White Deer1,347
- 79098Wildorado576
- 79101Amarillo2,526
- 79102Amarillo9,393
- 79103Amarillo11,306
- 79104Amarillo6,561
- 79106Amarillo26,161
- 79107Amarillo36,662
- 7910811,216
- 79109Amarillo43,578
- 79110Amarillo16,994
- 79111Amarillo1,575
- 79118Lake Tanglewood28,107
- 79119Bushland24,907
- 79121Amarillo6,437
- 79124Bushland12,019
- 79201Childress6,779
- 79220225
- 7922361
- 79225Chillicothe756
- 79226Clarendon2,855
- 79227Crowell1,065
- 79229Dickens243
- 79230Dodson31
- 7923124
- 79233Estelline90
- 7923485
- 79235Floydada2,924
- 79236Guthrie197
- 79237Hedley503
- 79239Lakeview121
- 79240Lelia Lake30
- 79241Lockney2,204
- 7924326
- 79244Matador776
- 79245Memphis2,230
- 7924736
- 79248Paducah1,273
- 79250Petersburg980
- 79251Quail31
- 79252Quanah2,784
- 79255Quitaque399
- 79256Roaring Springs290
- 79257Silverton845
- 7925814
- 7925927
- 79261Turkey411
- 79311Abernathy3,536
- 79312Amherst1,130
- 79313Anton1,527
- 79314Bledsoe130
- 79316Brownfield10,055
- 79322Crosbyton1,983
- 79323Denver City7,485
- 7932472
- 79325Farwell2,277
- 79326Olton51
- 79329Idalou3,322
- 7933056
- 79331Lamesa11,711
- 79336Levelland15,132
- 79339Littlefield6,685
- 79342Loop249
- 79343Lorenzo1,233
- 79345Meadow916
- 79346Morton1,767
- 79347Muleshoe7,176
- 79350New Deal296
- 79351O'Donnell1,044
- 7935367
- 79355Plains1,660
- 79356Post5,083
- 79357Ralls1,810
- 79358Ropesville1,622
- 79359Seagraves3,294
- 79360Seminole17,342
- 79363Shallowater5,717
- 79364Slaton7,129
- 79366Ransom Canyon1,041
- 79367Smyer519
- 79369Spade43
- 79370Spur1,363
- 793711,396
- 79372Sundown1,359
- 79373Tahoka3,087
- 7937610
- 79377Welch230
- 79378Wellman289
- 79379Whiteface660
- 79380Whitharral98
- 79381Wilson1,463
- 79382Wolfforth10,512
- 79383New Home38
- 79401Lubbock8,741
- 79403Idalou16,089
- 79404Lubbock8,529
- 79406Lubbock7,995
- 79407Smyer24,000
- 79410Lubbock10,137
- 79411Lubbock6,865
- 79412Lubbock15,018
- 79413Lubbock23,343
- 79414Lubbock17,596
- 79415New Deal15,794
- 79416Lubbock36,442
- 79423New Home46,998
- 79424Lubbock53,478
- 79501Anson3,630
- 79502Aspermont1,135
- 79503Lueders202
- 79504Baird2,969
- 79505Benjamin266
- 79506Blackwell538
- 79508Buffalo Gap1,078
- 795108,369
- 795111,811
- 79512Lake Colorado City7,834
- 79517Fluvanna210
- 79518Girard104
- 79519Novice99
- 79520Hamlin2,319
- 79521Stamford3,487
- 79525Hawley3,121
- 79526Hermleigh986
- 79527219
- 79528Jayton578
- 79529Knox City1,131
- 79530Lawn392
- 79532Loraine1,029
- 79533Lueders475
- 79534McCaulley360
- 79535129
- 79536Merkel5,047
- 7953754
- 79538Novice185
- 79539O'Brien220
- 79540Aspermont52
- 79541Lawn1,550
- 79543Roby1,091
- 79544Rochester382
- 79545Roscoe1,798
- 79546Rotan1,597
- 79547Rule957
- 79548Rule104
- 7954915,233
- 795533,089
- 79556Sweetwater12,532
- 79560McCaulley37
- 79561Trent665
- 79562Buffalo Gap5,070
- 79563Tye964
- 79565Westbrook202
- 79566Wingate230
- 79567Winters2,995
- 79601Impact28,050
- 79602Potosi27,425
- 79603Buffalo Gap23,548
- 79605Abilene28,467
- 79606Buffalo Gap29,182
- 79607Abilene3,315
- 79699Abilene113
- 79701Midland27,131
- 79703Midland20,419
- 79705Midland46,653
- 7970634,281
- 79707Midland40,010
- 79713Ackerly840
- 79714Andrews18,610
- 79718Balmorhea629
- 79719Barstow198
- 79720Big Spring29,936
- 79721Big Spring352
- 79730Coyanosa123
- 797314,196
- 79733Forsan371
- 79734Fort Davis1,779
- 79735Fort Stockton13,357
- 79738Gail353
- 79739Garden City780
- 79741Goldsmith177
- 79742Grandfalls620
- 79743Imperial231
- 79744Iraan1,283
- 79745Kermit6,034
- 79748232
- 79749Stanton477
- 79752McCamey1,933
- 7975433
- 7975567
- 79756Southwest Sandhill9,485
- 79758Gardendale2,016
- 79761Odessa30,164
- 79762Odessa39,927
- 79763West Odessa35,174
- 79764West Odessa27,013
- 79765Odessa25,904
- 7976611,041
- 79772Town of Pecos11,987
- 79777Pyote116
- 79778Rankin1,175
- 79780Balmorhea52
- 79781Sheffield74
- 79782Stanton3,867
- 79783113
- 79785Toyah22
- 79788Wickett699
- 79789Wink1,420
- 79821Anthony7,227
- 798307,853
- 79832Alpine330
- 79834331
- 79835Canutillo11,440
- 79836Morning Glory7,711
- 79837113
- 79838Fabens4,969
- 798391,416
- 79842285
- 798432,633
- 79845Presidio3,226
- 7984671
- 79847201
- 79848Sanderson791
- 79849San Elizario14,409
- 79851Sierra Blanca1,198
- 79852Study Butte641
- 79853Tornillo2,686
- 79854Valentine86
- 79855Van Horn2,177
- 79901El Paso8,554
- 79902El Paso19,031
- 79903El Paso14,715
- 79904El Paso32,976
- 79905El Paso22,594
- 79906Fort Bliss5,917
- 79907El Paso46,365
- 79908Fort Bliss4,148
- 79911El Paso10,192
- 79912El Paso78,819
- 79915El Paso34,230
- 79916Fort Bliss3,055
- 79918Fort Bliss274
- 79920El Paso28
- 79922El Paso6,800
- 79924El Paso60,364
- 79925El Paso38,621
- 79927Socorro44,444
- 79928Agua Dulce CDP86,599
- 79930El Paso24,123
- 79932El Paso30,786
- 79934El Paso28,861
- 79935El Paso18,720
- 79936El Paso102,991
- 79938Butterfield99,621
School districts
Each of the 1,019 with people in it, from ACS 2020–2024 5-year estimates. Elementary districts teach the lower grades and secondary districts the upper ones, under them; the rest are unified, teaching every grade.
- Abbott Independent School District1,249
- Abernathy Independent School District3,561
- Abilene Independent School District104,623
- Academy Independent School District8,696
- Adrian Independent School District202
- Agua Dulce Independent School District1,015
- Alamo Heights Independent School District30,624
- Alba-Golden Independent School District6,180
- Albany Independent School District2,399
- Aldine Independent School District307,014
- Aledo Independent School District36,629
- Alice Independent School District23,836
- Alief Independent School District274,527
- Allen Independent School District118,775
- Alpine Independent School District8,157
- Alto Independent School District3,420
- Alvarado Independent School District21,113
- Alvin Independent School District143,917
- Alvord Independent School District3,872
- Amarillo Independent School District167,625
- Amherst Independent School District1,136
- Anahuac Independent School District7,690
- Anderson-Shiro Consolidated Independent School District4,686
- Andrews Independent School District18,610
- Angleton Independent School District44,419
- Anna Independent School District26,424
- Anson Independent School District3,640
- Anthony Independent School District4,733
- Anton Independent School District1,339
- Apple Springs Independent School District1,266
- Aquilla Independent School District1,977
- Aransas Pass Independent School District11,182
- Archer City Independent School District2,356
- Argyle Independent School District20,056
- Arlington Independent School District361,017
- Arp Independent School District5,231
- Aspermont Independent School District1,211
- Athens Independent School District23,399
- Atlanta Independent School District9,855
- Aubrey Independent School District19,095
- Austin Independent School District734,748
- Austwell-Tivoli Independent School District768
- Avalon Independent School District943
- Avery Independent School District1,562
- Avinger Independent School District1,137
- Axtell Independent School District3,683
- Azle Independent School District44,941
- Baird Independent School District2,724
- Ballinger Independent School District5,099
- Balmorhea Independent School District529
- Bandera Independent School District19,059
- Bangs Independent School District6,307
- Banquete Independent School District3,891
- Barbers Hill Independent School District30,249
- Bartlett Independent School District3,216
- Bastrop Independent School District70,025
- Bay City Independent School District20,724
- Beaumont Independent School District128,449
- Beckville Independent School District2,403
- Beeville Independent School District26,638
- Bellevue Independent School District896
- Bells Independent School District4,148
- Bellville Independent School District13,570
- Belton Independent School District69,473
- Ben Bolt-Palito Blanco Independent School District2,735
- Benavides Independent School District1,634
- Benjamin Independent School District334
- Big Sandy Independent School District (Polk County)2,598
- Big Sandy Independent School District (Upshur and Wood Counties)4,159
- Big Spring Independent School District25,799
- Birdville Independent School District142,081
- Bishop Consolidated Independent School District5,286
- Blackwell Consolidated Independent School District681
- Blanco Independent School District9,056
- Bland Independent School District4,285
- Blanket Independent School District1,430
- Bloomburg Independent School District1,439
- Blooming Grove Independent School District4,620
- Bloomington Independent School District3,227
- Blue Ridge Independent School District3,921
- Bluff Dale Independent School District1,652
- Blum Independent School District2,075
- Boerne Independent School District62,243
- Boles Independent School District908
- Boling Independent School District3,923
- Bonham Independent School District17,130
- Booker Independent School District1,546
- Borden County Independent School District726
- Borger Independent School District14,004
- Bosqueville Independent School District1,892
- Bovina Independent School District1,820
- Bowie Independent School District11,254
- Boyd Independent School District6,994
- Boys Ranch Independent School District297
- Brackett Independent School District3,157
- Brady Independent School District6,379
- Brazos Independent School District4,850
- Brazosport Independent School District63,655
- Breckenridge Independent School District9,182
- Bremond Independent School District2,203
- Brenham Independent School District33,026
- Bridge City Independent School District16,627
- Bridgeport Independent School District12,384
- Broaddus Independent School District2,655
- Brock Independent School District8,866
- Bronte Independent School District1,623
- Brookeland Independent School District1,882
- Brookesmith Independent School District1,126
- Brooks County Independent School District6,943
- Brownfield Independent School District9,503
- Brownsboro Independent School District17,273
- Brownsville Independent School District193,347
- Brownwood Independent School District21,039
- Bruceville-Eddy Independent School District4,269
- Bryan Independent School District106,540
- Bryson Independent School District1,581
- Buckholts Independent School District713
- Buena Vista Independent School District274
- Buffalo Independent School District4,848
- Bullard Independent School District14,179
- Buna Independent School District7,823
- Burkburnett Independent School District21,031
- Burkeville Independent School District1,950
- Burleson Independent School District72,912
- Burnet Consolidated Independent School District27,291
- Burton Independent School District3,227
- Bushland Independent School District7,195
- Bynum Independent School District1,205
- Caddo Mills Independent School District11,211
- Calallen Independent School District23,198
- Caldwell Independent School District10,364
- Calhoun County Independent School District19,868
- Callisburg Independent School District6,834
- Calvert Independent School District1,046
- Cameron Independent School District8,368
- Campbell Independent School District2,462
- Canadian Independent School District3,779
- Canton Independent School District15,124
- Canutillo Independent School District39,282
- Canyon Independent School District72,350
- Carlisle Independent School District2,454
- Carrizo Springs Consolidated Independent School District8,380
- Carroll Independent School District32,861
- Carrollton-Farmers Branch Independent School District192,410
- Carthage Independent School District16,079
- Castleberry Independent School District20,377
- Cayuga Independent School District8,601
- Cedar Hill Independent School District50,177
- Celeste Independent School District2,407
- Celina Independent School District24,248
- Center Independent School District10,949
- Center Point Independent School District4,311
- Centerville Independent School District (Leon County)5,137
- Centerville Independent School District (Trinity County)672
- Central Heights Independent School District3,741
- Central Independent School District10,006
- Channelview Independent School District41,921
- Channing Independent School District596
- Chapel Hill Independent School District (Smith County)23,211
- Chapel Hill Independent School District (Titus County)3,327
- Charlotte Independent School District2,224
- Cherokee Independent School District557
- Chester Independent School District1,034
- Chico Independent School District4,640
- Childress Independent School District6,751
- Chillicothe Independent School District850
- Chilton Independent School District2,220
- China Spring Independent School District15,679
- Chireno Independent School District1,938
- Chisum Independent School District5,500
- Christoval Independent School District2,436
- Cisco Independent School District5,368
- City View Independent School District3,640
- Clarendon Independent School District2,799
- Clarksville Independent School District5,001
- Claude Independent School District1,791
- Clear Creek Independent School District247,496
- Cleburne Independent School District42,946
- Cleveland Independent School District41,217
- Clifton Independent School District7,146
- Clint Independent School District49,333
- Clyde Consolidated Independent School District13,302
- Coahoma Independent School District3,594
- Coldspring-Oakhurst Consolidated Independent School District14,215
- Coleman Independent School District4,870
- College Station Independent School District134,383
- Collinsville Independent School District3,687
- Colmesneil Independent School District2,743
- Colorado Independent School District6,742
- Columbia-Brazoria Independent School District20,620
- Columbus Independent School District10,738
- Comal Independent School District180,778
- Comanche Independent School District7,058
- Comfort Independent School District6,867
- Commerce Independent School District12,728
- Community Independent School District22,439
- Como-Pickton Consolidated Independent School District3,830
- Comstock Independent School District268
- Connally Independent School District15,048
- Conroe Independent School District382,731
- Coolidge Independent School District1,102
- Cooper Independent School District5,044
- Coppell Independent School District57,729
- Copperas Cove Independent School District42,582
- Corpus Christi Independent School District243,652
- Corrigan-Camden Independent School District6,001
- Corsicana Independent School District32,215
- Cotton Center Independent School District413
- Cotulla Independent School District6,731
- Coupland Independent School District1,809
- Covington Independent School District1,505
- Crandall Independent School District24,889
- Crane Independent School District4,610
- Cranfills Gap Independent School District881
- Crawford Independent School District3,263
- Crockett County Consolidated Common School District2,822
- Crockett Independent School District9,388
- Crosby Independent School District31,945
- Crosbyton Consolidated Independent School District2,145
- Cross Plains Independent School District2,660
- Cross Roads Independent School District3,511
- Crowell Independent School District997
- Crowley Independent School District118,704
- Crystal City Independent School District7,131
- Cuero Independent School District10,158
- Culberson County-Allamoore Independent School District2,204
- Cumby Collegiate Independent School District2,082
- Cushing Independent School District3,199
- Cypress-Fairbanks Independent School District632,275
- D'Hanis Independent School District1,157
- Daingerfield-Lone Star Independent School District7,808
- Dalhart Independent School District10,466
- Dallas Independent School District1.11M
- Damon Independent School District749
- Danbury Independent School District4,695
- Darrouzett Independent School District396
- Dawson Independent School District (Dawson, Lynn, and Terry Counties)413
- Dawson Independent School District (Hill and Navarro Counties)3,603
- Dayton Independent School District33,005
- De Leon Independent School District4,281
- Decatur Independent School District21,724
- Deer Park Independent School District49,190
- DeKalb Independent School District4,847
- Del Valle Independent School District86,569
- Dell City Independent School District218
- Denison Independent School District31,805
- Denton Independent School District242,689
- Denver City Independent School District5,732
- DeSoto Independent School District63,359
- Detroit Independent School District2,541
- Devers Independent School District929
- Devine Independent School District10,818
- Dew Independent School District1,056
- Deweyville Independent School District2,427
- Diboll Independent School District8,183
- Dickinson Independent School District72,783
- Dilley Independent School District5,347
- Dime Box Independent School District1,053
- Dimmitt Independent School District5,232
- Divide Independent School District131
- Dodd City Independent School District1,188
- Donna Independent School District72,592
- Doss Consolidated Common School District285
- Douglass Independent School District2,067
- Dripping Springs Independent School District46,100
- Driscoll Independent School District1,220
- Dublin Independent School District6,518
- Dumas Independent School District18,474
- Duncanville Independent School District76,490
- Eagle Mountain-Saginaw Independent School District133,803
- Eagle Pass Independent School District58,082
- Eanes Independent School District37,570
- Early Independent School District5,469
- East Bernard Independent School District3,939
- East Central Independent School District72,555
- East Chambers Independent School District6,599
- Eastland Independent School District6,219
- Ector County Independent School District164,654
- Ector Independent School District1,487
- Edcouch-Elsa Independent School District17,641
- Eden Consolidated Independent School District2,222
- Edgewood Independent School District (Bexar County)58,211
- Edgewood Independent School District (Van Zandt County)6,475
- Edinburg Consolidated Independent School District182,188
- Edna Independent School District9,072
- El Campo Independent School District18,456
- El Paso Independent School District314,227
- Electra Independent School District2,672
- Elgin Independent School District29,657
- Elkhart Independent School District7,776
- Elysian Fields Independent School District5,301
- Ennis Independent School District32,746
- Era Independent School District2,190
- Eula Independent School District3,185
- Eustace Independent School District9,992
- Evadale Independent School District1,116
- Evant Independent School District1,982
- Everman Independent School District28,260
- Excelsior Independent School District369
- Ezzell Independent School District1,168
- Fabens Independent School District5,003
- Fairfield Independent School District10,833
- Falls City Independent School District1,936
- Fannindel Independent School District1,270
- Farmersville Independent School District9,731
- Farwell Independent School District2,310
- Fayetteville Independent School District1,677
- Ferris Independent School District11,059
- Flatonia Independent School District4,400
- Florence Independent School District5,735
- Floresville Independent School District26,089
- Flour Bluff Independent School District30,483
- Floydada Collegiate Independent School District2,954
- Follett Independent School District394
- Forestburg Independent School District1,290
- Forney Independent School District71,121
- Forsan Independent School District2,667
- Fort Bend Independent School District467,199
- Fort Davis Independent School District1,590
- Fort Elliott Consolidated Independent School District768
- Fort Hancock Independent School District1,967
- Fort Sam Houston Independent School District7,149
- Fort Stockton Independent School District13,443
- Fort Worth Independent School District521,467
- Franklin Independent School District5,919
- Frankston Independent School District4,829
- Fredericksburg Independent School District24,287
- Freer Independent School District2,596
- Frenship Independent School District62,400
- Friendswood Independent School District30,527
- Friona Independent School District5,223
- Frisco Independent School District299,338
- Frost Independent School District2,436
- Fruitvale Independent School District1,618
- Gainesville Independent School District20,204
- Galena Park Independent School District89,971
- Galveston Independent School District56,693
- Ganado Independent School District3,228
- Garland Independent School District311,259
- Garner Independent School District2,216
- Garrison Independent School District3,208
- Gary Independent School District1,882
- Gatesville Independent School District25,926
- Gause Independent School District1,089
- George West Independent School District7,198
- Georgetown Independent School District111,711
- Gholson Independent School District1,343
- Giddings Independent School District11,239
- Gilmer Independent School District16,665
- Gladewater Independent School District10,935
- Glasscock County Independent School District1,068
- Glen Rose Independent School District9,676
- Godley Independent School District14,179
- Gold-Burg Independent School District1,063
- Goldthwaite Consolidated Independent School District3,391
- Goliad Independent School District7,141
- Gonzales Independent School District13,759
- Goodrich Independent School District2,446
- Goose Creek Consolidated Independent School District116,986
- Gordon Independent School District1,408
- Gorman Independent School District2,010
- Grady Independent School District432
- Graford Independent School District2,111
- Graham Independent School District13,318
- Granbury Independent School District60,977
- Grand Prairie Independent School District126,131
- Grand Saline Independent School District7,438
- Grandfalls-Royalty Independent School District623
- Grandview Independent School District6,049
- Grandview-Hopkins Independent School District93
- Granger Independent School District1,927
- Grape Creek Independent School District8,329
- Grapeland Independent School District3,727
- Grapevine-Colleyville Independent School District84,261
- Greenville Independent School District38,504
- Greenwood Independent School District12,905
- Gregory-Portland Independent School District23,330
- Groesbeck Independent School District8,793
- Groom Independent School District711
- Groveton Independent School District4,866
- Gruver Independent School District1,842
- Gunter Independent School District3,580
- Gustine Independent School District972
- Guthrie Common School District211
- Hale Center Independent School District2,459
- Hallettsville Independent School District6,989
- Hallettsville Independent School District (9-12) in Vysehradsecondary850
- Hallsburg Independent School District1,113
- Hallsville Independent School District23,740
- Hamilton Independent School District4,843
- Hamlin Independent School District2,481
- Hamshire-Fannett Independent School District9,238
- Happy Independent School District1,128
- Hardin Independent School District7,012
- Hardin-Jefferson Independent School District12,014
- Harlandale Independent School District60,734
- Harleton Independent School District2,498
- Harlingen Consolidated Independent School District91,821
- Harmony Independent School District6,127
- Harper Independent School District3,857
- Harrold Independent School District162
- Hart Independent School District1,274
- Hartley Independent School District595
- Harts Bluff Independent School District2,687
- Haskell Consolidated Independent School District3,777
- Hawkins Independent School District6,100
- Hawley Independent School District3,363
- Hays Consolidated Independent School District131,682
- Hearne Independent School District7,547
- Hedley Independent School District546
- Hemphill Independent School District6,857
- Hempstead Independent School District9,862
- Henderson Independent School District23,238
- Henrietta Independent School District5,183
- Hereford Independent School District17,939
- Hermleigh Independent School District865
- Hico Independent School District3,655
- Hidalgo Independent School District6,317
- High Island Independent School District649
- Highland Independent School District299
- Highland Park Independent School District (Dallas County)35,314
- Highland Park Independent School District (Potter County)7,855
- Hillsboro Independent School District10,526
- Hitchcock Independent School District12,344
- Holland Independent School District2,594
- Holliday Independent School District4,763
- Hondo Independent School District13,410
- Honey Grove Independent School District3,789
- Hooks Independent School District3,712
- Houston Independent School District1.50M
- Howe Independent School District7,254
- Hubbard Independent School District (Bowie County)396
- Hubbard Independent School District (Hill, Limestone, and Navarro Counties)2,151
- Huckabay Independent School District1,894
- Hudson Independent School District12,853
- Huffman Independent School District17,599
- Hughes Springs Independent School District4,283
- Hull-Daisetta Independent School District2,917
- Humble Independent School District230,209
- Hunt Independent School District1,999
- Huntington Independent School District9,792
- Huntsville Independent School District74,201
- Hurst-Euless-Bedford Independent School District165,285
- Hutto Independent School District55,001
- Idalou Independent School District3,940
- Industrial Independent School District3,724
- Ingleside Independent School District10,871
- Ingram Independent School District7,902
- Iola Independent School District3,330
- Iowa Park Consolidated Independent School District14,505
- Ira Independent School District626
- Iraan-Sheffield Collegiate Independent School District1,179
- Iredell Independent School District924
- Irion County Independent School District1,409
- Irving Independent School District194,020
- Italy Independent School District3,531
- Itasca Independent School District4,179
- Jacksboro Independent School District6,274
- Jacksonville Independent School District26,885
- Jarrell Independent School District22,454
- Jasper Independent School District15,804
- Jayton-Girard Independent School District653
- Jefferson Independent School District8,967
- Jim Hogg County Independent School District4,727
- Jim Ned Consolidated Independent School District6,701
- Joaquin Independent School District3,763
- Johnson City Independent School District5,887
- Jonesboro Independent School District1,295
- Joshua Independent School District31,109
- Jourdanton Independent School District7,793
- Judson Independent School District155,716
- Junction Independent School District3,907
- Karnack Independent School District2,078
- Karnes City Independent School District5,023
- Katy Independent School District423,484
- Kaufman Independent School District20,116
- Keene Independent School District5,773
- Keller Independent School District186,847
- Kelton Independent School District114
- Kemp Independent School District9,801
- Kenedy County-Wide Common School District145
- Kenedy Independent School District6,804
- Kennard Independent School District1,709
- Kennedale Independent School District22,381
- Kerens Independent School District4,054
- Kermit Independent School District6,018
- Kerrville Independent School District37,217
- Kilgore Independent School District20,450
- Killeen Independent School District230,962
- Kingsville Independent School District24,904
- Kirbyville Consolidated Independent School District6,569
- Klein Independent School District289,142
- Klondike Independent School District717
- Knippa Independent School District1,064
- Knox City-O'Brien Consolidated Independent School District1,346
- Kopperl Independent School District2,036
- Kountze Independent School District8,628
- Kress Independent School District960
- Krum Independent School District11,878
- La Feria Independent School District14,726
- La Gloria Independent School District305
- La Grange Independent School District11,730
- La Joya Independent School District104,498
- La Porte Independent School District45,028
- La Pryor Independent School District1,287
- La Vega Independent School District15,436
- La Vernia Independent School District18,666
- La Villa Independent School District4,681
- Lackland Independent School District7,663
- Lago Vista Independent School District13,982
- Lake Dallas Independent School District26,108
- Lake Travis Independent School District63,993
- Lake Worth Independent School District17,647
- Lamar Consolidated Independent School District229,308
- Lamesa Independent School District11,173
- Lampasas Independent School District21,940
- Lancaster Independent School District41,371
- Laneville Independent School District1,946
- LaPoyner Independent School District2,316
- Laredo Independent School District78,173
- Lasara Independent School District1,601
- Latexo Independent School District2,307
- Lazbuddie Independent School District504
- Leakey Independent School District1,674
- Leander Independent School District233,956
- Leary Independent School District1,404
- Lefors Independent School District677
- Leggett Independent School District1,319
- Leon Independent School District3,933
- Leonard Independent School District4,304
- Levelland Independent School District14,842
- Leveretts Chapel Independent School District1,164
- Lewisville Independent School District327,521
- Lexington Independent School District6,209
- Liberty Hill Independent School District36,087
- Liberty Independent School District11,577
- Liberty-Eylau Independent School District13,534
- Lindale Independent School District23,970
- Linden-Kildare Consolidated Independent School District4,991
- Lindsay Independent School District2,206
- Lingleville Independent School District1,499
- Lipan Independent School District2,652
- Little Cypress-Mauriceville Consolidated Independent School District19,287
- Little Elm Independent School District56,205
- Littlefield Independent School District6,554
- Livingston Independent School District31,529
- Llano Independent School District20,476
- Lockhart Independent School District33,309
- Lockney Independent School District2,167
- Lohn Independent School District329
- Lometa Independent School District1,516
- London Independent School District4,527
- Lone Oak Independent School District4,842
- Longview Independent School District57,379
- Loop Independent School District302
- Loraine Independent School District1,106
- Lorena Independent School District8,265
- Lorenzo Independent School District1,461
- Los Fresnos Consolidated Independent School District53,099
- Louise Independent School District2,258
- Lovejoy Independent School District16,333
- Lovelady Independent School District4,796
- Lubbock Independent School District187,625
- Lubbock-Cooper Independent School District42,657
- Lueders-Avoca Independent School District820
- Lufkin Independent School District43,800
- Luling Independent School District7,933
- Lumberton Independent School District21,615
- Lyford Consolidated Independent School District5,632
- Lytle Independent School District6,913
- Mabank Independent School District22,809
- Madisonville Consolidated Independent School District12,418
- Magnolia Independent School District79,262
- Malakoff Independent School District9,531
- Malone Independent School District614
- Malta Independent School District751
- Manor Independent School District78,224
- Mansfield Independent School District184,901
- Marathon Independent School District336
- Marble Falls Independent School District27,951
- Marfa Independent School District2,704
- Marion Independent School District8,067
- Marlin Independent School District8,200
- Marshall Independent School District34,773
- Mart Independent School District3,344
- Martins Mill Independent School District2,669
- Martinsville Independent School District1,739
- Mason Independent School District4,125
- Matagorda Independent School District820
- Mathis Independent School District8,343
- Maud Independent School District2,246
- May Independent School District2,153
- Maypearl Independent School District6,589
- McAllen Independent School District119,052
- McCamey Independent School District1,933
- McDade Independent School District3,069
- McGregor Independent School District6,906
- McKinney Independent School District143,617
- McLean Independent School District1,007
- McLeod Independent School District1,003
- McMullen County Independent School District700
- Meadow Independent School District839
- Medina Independent School District2,024
- Medina Valley Independent School District41,806
- Melissa Independent School District24,492
- Memphis Independent School District2,441
- Menard Independent School District1,955
- Mercedes Independent School District21,743
- Meridian Independent School District2,716
- Merkel Independent School District6,268
- Mesquite Independent School District182,484
- Mexia Independent School District11,274
- Meyersville Independent School District1,545
- Miami Independent School District788
- Midland Independent School District161,896
- Midlothian Independent School District55,414
- Midway Independent School District (Clay and Jack Counties)1,052
- Midway Independent School District (McLennan County)52,541
- Milano Independent School District2,263
- Mildred Independent School District4,049
- Miles Independent School District1,937
- Milford Independent School District1,794
- Miller Grove Independent School District2,113
- Millsap Independent School District7,375
- Mineola Independent School District10,484
- Mineral Wells Independent School District20,657
- Mission Consolidated Independent School District65,179
- Monahans-Wickett-Pyote Independent School District10,297
- Montague Independent School District422
- Monte Alto Independent School District4,086
- Montgomery Independent School District53,999
- Moody Independent School District5,278
- Moran Independent School District482
- Morgan Independent School District1,073
- Morgan Mill Independent School District896
- Morton Independent School District1,728
- Motley County Independent School District1,163
- Moulton Independent School District1,988
- Mount Calm Independent School District997
- Mount Enterprise Independent School District1,336
- Mount Pleasant Independent School District23,553
- Mount Vernon Independent School District8,932
- Muenster Independent School District3,375
- Muleshoe Independent School District6,680
- Mullin Independent School District840
- Mumford Independent School District295
- Munday Consolidated Independent School District1,817
- Murchison Independent School District815
- Nacogdoches Independent School District47,012
- Natalia Independent School District8,249
- Navarro Independent School District13,246
- Navasota Independent School District22,854
- Nazareth Independent School District686
- Neches Independent School District1,699
- Nederland Independent School District30,018
- Needville Independent School District15,632
- New Boston Independent School District7,402
- New Braunfels Independent School District68,514
- New Caney Independent School District88,581
- New Deal Independent School District2,984
- New Diana Independent School District5,493
- New Home Independent School District1,538
- New Summerfield Independent School District1,215
- New Waverly Independent School District4,704
- Newcastle Independent School District1,188
- Newton Independent School District7,359
- Nixon-Smiley Consolidated Independent School District4,617
- Nocona Independent School District5,013
- Nordheim Independent School District930
- Normangee Independent School District3,135
- North East Independent School District441,559
- North Hopkins Independent School District2,747
- North Lamar Independent School District18,152
- North Zulch Independent School District1,996
- Northside Independent School District (Bandera, Bexar, and Medina Counties)678,044
- Northside Independent School District (Wilbarger County)230
- Northwest Independent School District142,125
- Nueces Canyon Consolidated Independent School District1,330
- Nursery Independent School District1,431
- O'Donnell Independent School District977
- Oakwood Independent School District1,341
- Odem-Edroy Independent School District5,149
- Oglesby Independent School District1,118
- Olfen Independent School District124
- Olney Independent School District4,059
- Olton Independent School District2,609
- Onalaska Independent School District8,394
- Orange Grove Independent School District7,830
- Orangefield Independent School District8,673
- Ore City Independent School District4,601
- Overton Independent School District3,072
- Paducah Independent School District1,325
- Paint Creek Independent School District290
- Paint Rock Independent School District1,026
- Palacios Independent School District7,455
- Palestine Independent School District21,483
- Palmer Independent School District6,295
- Palo Pinto Independent School District867
- Pampa Independent School District19,061
- Panhandle Independent School District2,910
- Panther Creek Consolidated Independent School District1,117
- Paradise Independent School District7,041
- Paris Independent School District21,626
- Pasadena Independent School District255,022
- Patton Springs Independent School District379
- Pawnee Independent School District421
- Pearland Independent School District105,584
- Pearsall Independent School District11,865
- Peaster Independent School District7,529
- Pecos-Barstow-Toyah Independent School District12,359
- Penelope Independent School District712
- Perrin-Whitt Consolidated Independent School District2,143
- Perryton Independent School District9,745
- Petersburg Independent School District952
- Petrolia Consolidated Independent School District2,665
- Pettus Independent School District1,525
- Pewitt Consolidated Independent School District6,065
- Pflugerville Independent School District185,578
- Pharr-San Juan-Alamo Independent School District135,247
- Pilot Point Independent School District10,758
- Pine Tree Independent School District27,535
- Pittsburg Independent School District13,679
- Plains Independent School District1,815
- Plainview Independent School District25,647
- Plano Independent School District369,224
- Pleasant Grove Independent School District12,356
- Pleasanton Independent School District18,240
- Plemons-Stinnett-Phillips Consolidated Independent School District1,749
- Point Isabel Independent School District13,186
- Ponder Independent School District7,469
- Poolville Independent School District2,979
- Port Aransas Independent School District3,348
- Port Arthur Independent School District51,626
- Port Neches-Groves Independent School District28,539
- Post Independent School District4,980
- Poteet Independent School District9,017
- Poth Independent School District3,882
- Pottsboro Independent School District8,812
- Prairie Lea Independent School District1,679
- Prairie Valley Independent School District691
- Prairiland Independent School District5,938
- Premont Independent School District3,121
- Presidio Independent School District3,226
- Priddy Independent School District307
- Princeton Independent School District34,024
- Pringle-Morse Consolidated Independent School District533
- Progreso Independent School District7,963
- Prosper Independent School District96,876
- Quanah Independent School District2,783
- Queen City Independent School District4,785
- Quinlan Independent School District20,848
- Quitman Independent School District9,121
- Rains Independent School District12,424
- Ralls Independent School District1,629
- Ramirez Common School District108
- Randolph Field Independent School District1,240
- Ranger Independent School District3,123
- Rankin Independent School District1,258
- Raymondville Independent School District12,622
- Reagan County Independent School District3,232
- Red Lick Independent School District2,609
- Red Oak Independent School District35,472
- Redwater Independent School District5,221
- Refugio Independent School District3,468
- Ricardo Independent School District3,959
- Rice Consolidated Independent School District5,957
- Rice Independent School District3,122
- Richards Independent School District2,146
- Richardson Independent School District231,435
- Richland Springs Independent School District959
- Riesel Independent School District2,807
- Rio Grande City Grulla Independent School District42,671
- Rio Hondo Independent School District8,086
- Rio Vista Independent School District5,518
- Rising Star Independent School District1,252
- River Road Independent School District6,673
- Rivercrest Independent School District3,242
- Riviera Independent School District1,662
- Robert Lee Independent School District1,645
- Robinson Independent School District11,966
- Robstown Independent School District14,283
- Roby Consolidated Independent School District1,352
- Rochelle Independent School District810
- Rockdale Independent School District8,981
- Rockport-Fulton Independent School District22,373
- Rocksprings Independent School District1,247
- Rockwall Independent School District96,578
- Rogers Independent School District4,448
- Roma Independent School District22,589
- Roosevelt Independent School District5,093
- Ropes Independent School District1,892
- Roscoe Collegiate Independent School District1,897
- Rosebud-Lott Independent School District4,682
- Rotan Independent School District1,608
- Round Rock Independent School District301,128
- Round Top-Carmine Independent School District1,993
- Royal Independent School District13,079
- Royse City Independent School District42,496
- Rule Independent School District1,153
- Runge Independent School District1,287
- Rusk Independent School District11,741
- S and S Consolidated Independent School District5,039
- Sabinal Independent School District1,231
- Sabine Independent School District6,998
- Sabine Pass Independent School District366
- Saint Jo Independent School District1,508
- Salado Independent School District9,841
- Saltillo Independent School District1,207
- Sam Rayburn Independent School District2,406
- San Angelo Independent School District100,500
- San Antonio Independent School District307,153
- San Augustine Independent School District4,834
- San Benito Consolidated Independent School District44,310
- San Diego Independent School District5,920
- San Elizario Independent School District14,994
- San Felipe-Del Rio Consolidated Independent School District47,473
- San Isidro Independent School District807
- San Marcos Consolidated Independent School District84,094
- San Perlita Independent School District822
- San Saba Independent School District4,070
- San Vicente Independent School District352
- Sands Consolidated Independent School District953
- Sanford-Fritch Independent School District4,822
- Sanger Independent School District17,513
- Santa Anna Independent School District1,795
- Santa Fe Independent School District25,602
- Santa Gertrudis Independent School District54
- Santa Maria Independent School District2,260
- Santa Rosa Independent School District4,763
- Santo Independent School District3,650
- Savoy Independent School District2,422
- Schertz-Cibolo-Universal City Independent School District87,713
- Schleicher Independent School District2,381
- Schulenburg Independent School District4,808
- Scurry-Rosser Independent School District6,142
- Seagraves Independent School District2,917
- Sealy Independent School District14,789
- Seguin Independent School District46,892
- Seminole Independent School District19,182
- Seymour Independent School District3,485
- Shallowater Independent School District6,022
- Shamrock Independent School District2,032
- Sharyland Independent School District56,732
- Shelbyville Independent School District3,332
- Sheldon Independent School District48,486
- Shepherd Independent School District9,479
- Sherman Independent School District49,239
- Shiner Independent School District4,423
- Sidney Independent School District879
- Sierra Blanca Independent School District1,209
- Silsbee Independent School District17,409
- Silverton Independent School District890
- Simms Independent School District4,949
- Sinton Independent School District9,533
- Sivells Bend Independent School District528
- Skidmore-Tynan Independent School District2,494
- Slaton Independent School District7,151
- Slidell Independent School District1,838
- Slocum Independent School District2,777
- Smithville Independent School District12,125
- Smyer Independent School District1,246
- Snook Independent School District4,033
- Snyder Independent School District15,143
- Socorro Independent School District254,733
- Somerset Independent School District17,540
- Somerville Independent School District4,460
- Sonora Independent School District3,277
- South San Antonio Independent School District49,040
- Southland Independent School District173
- Southside Independent School District30,255
- Southwest Independent School District71,162
- Spearman Independent School District2,923
- Splendora Independent School District19,732
- Spring Branch Independent School District189,806
- Spring Creek Independent School District92
- Spring Hill Independent School District9,412
- Spring Independent School District206,968
- Springlake-Earth Independent School District1,420
- Springtown Independent School District26,255
- Spur Independent School District1,368
- Spurger Independent School District2,591
- Stafford Municipal School District17,718
- Stamford Independent School District3,057
- Stanton Independent School District3,936
- Stephenville Independent School District29,502
- Sterling City Independent School District1,468
- Stockdale Independent School District5,546
- Stratford Independent School District1,638
- Strawn Independent School District682
- Sudan Independent School District1,471
- Sulphur Bluff Independent School District1,236
- Sulphur Springs Independent School District24,350
- Sundown Independent School District1,477
- Sunnyvale Independent School District8,336
- Sunray Collegiate Independent School District2,872
- Sweeny Independent School District9,554
- Sweet Home Independent School District1,085
- Sweetwater Independent School District12,303
- Taft Independent School District5,105
- Tahoka Independent School District2,570
- Tarkington Independent School District10,721
- Tatum Independent School District5,303
- Taylor Independent School District18,325
- Teague Independent School District5,273
- Temple Independent School District62,070
- Tenaha Independent School District2,319
- Terlingua Common School District658
- Terrell County Independent School District835
- Terrell Independent School District29,670
- Texarkana Independent School District32,688
- Texas City Independent School District59,605
- Texhoma Independent School District597
- Texline Independent School District1,025
- Thorndale Independent School District3,052
- Thrall Independent School District3,352
- Three Rivers Independent School District3,723
- Three Way Independent School District328
- Throckmorton Collegiate Independent School District896
- Tidehaven Independent School District2,821
- Timpson Independent School District3,547
- Tioga Independent School District1,662
- Tolar Independent School District3,817
- Tom Bean Independent School District3,978
- Tomball Independent School District103,386
- Tornillo Independent School District2,686
- Trent Independent School District667
- Trenton Independent School District3,769
- Trinidad Independent School District768
- Trinity Independent School District7,637
- Troup Independent School District6,509
- Troy Independent School District7,085
- Tulia Independent School District5,212
- Tuloso-Midway Independent School District14,378
- Turkey-Quitaque Independent School District822
- Tyler Independent School District131,162
- Union Grove Independent School District3,564
- Union Hill Independent School District2,360
- United Independent School District190,514
- Utopia Independent School District1,437
- Uvalde Consolidated Independent School District22,505
- Valentine Independent School District275
- Valley Mills Independent School District4,085
- Valley View Independent School District (Cooke County)3,368
- Valley View Independent School District (Hidalgo County)18,006
- Van Alstyne Independent School District11,429
- Van Independent School District15,586
- Van Vleck Independent School District5,483
- Vega Independent School District1,420
- Venus Independent School District12,110
- Veribest Independent School District1,548
- Vernon Independent School District12,124
- Victoria Independent School District84,619
- Vidor Independent School District23,816
- Vysehrad Independent School Districtelementary850
- Waco Independent School District109,227
- Waelder Independent School District1,529
- Walcott Independent School District191
- Wall Independent School District4,143
- Waller Independent School District52,899
- Walnut Bend Independent School District273
- Walnut Springs Independent School District1,142
- Warren Independent School District4,368
- Waskom Independent School District3,663
- Water Valley Independent School District1,941
- Waxahachie Independent School District60,729
- Weatherford Independent School District58,529
- Webb Consolidated Independent School District607
- Weimar Independent School District4,948
- Wellington Independent School District2,528
- Wellman-Union Consolidated Independent School District990
- Wells Independent School District1,519
- Weslaco Independent School District76,036
- West Hardin County Consolidated Independent School District3,472
- West Independent School District8,175
- West Orange-Cove Consolidated Independent School District17,186
- West Oso Independent School District8,181
- West Rusk County Consolidated Independent School District6,163
- West Sabine Independent School District2,793
- Westbrook Independent School District1,086
- Westhoff Independent School District631
- Westphalia Independent School District447
- Westwood Independent School District12,494
- Wharton Independent School District13,286
- Wheeler Independent School District2,073
- White Deer Independent School District1,948
- White Oak Independent School District6,383
- White Settlement Independent School District36,641
- Whiteface Consolidated Independent School District940
- Whitehouse Independent School District31,429
- Whitesboro Independent School District11,376
- Whitewright Independent School District4,492
- Whitharral Independent School District370
- Whitney Independent School District9,572
- Wichita Falls Independent School District87,995
- Wildorado Independent School District379
- Willis Independent School District51,115
- Wills Point Independent School District16,162
- Wilson Independent School District675
- Wimberley Independent School District16,395
- Windthorst Independent School District1,820
- Wink-Loving Independent School District1,469
- Winnsboro Independent School District9,870
- Winona Independent School District8,821
- Winters Independent School District3,101
- Woden Independent School District3,177
- Wolfe City Independent School District3,031
- Woodsboro Independent School District2,526
- Woodson Independent School District858
- Woodville Independent School District10,163
- Wortham Independent School District2,419
- Wylie Independent School District (Collin County)84,360
- Wylie Independent School District (Taylor County)28,200
- Yantis Independent School District3,523
- Yoakum Independent School District9,196
- Yorktown Independent School District2,706
- Ysleta Independent School District185,788
- Zapata County Independent School District13,841
- Zavalla Independent School District2,615
- Zephyr Independent School District763
Congressional districts
As drawn for the 119th Congress (2025–2027).
- Congressional District 1779,066
- Congressional District 2814,076
- Congressional District 3846,484
- Congressional District 4823,011
- Congressional District 5806,900
- Congressional District 6793,946
- Congressional District 7796,950
- Congressional District 8846,118
- Congressional District 9776,446
- Congressional District 10797,070
- Congressional District 11777,036
- Congressional District 12816,916
- Congressional District 13782,513
- Congressional District 14777,988
- Congressional District 15790,465
- Congressional District 16776,702
- Congressional District 17791,966
- Congressional District 18791,493
- Congressional District 19773,548
- Congressional District 20783,289
- Congressional District 21810,199
- Congressional District 22833,743
- Congressional District 23770,809
- Congressional District 24761,741
- Congressional District 25806,742
- Congressional District 26830,132
- Congressional District 27777,664
- Congressional District 28789,743
- Congressional District 29752,781
- Congressional District 30779,620
- Congressional District 31843,922
- Congressional District 32767,505
- Congressional District 33777,278
- Congressional District 34778,225
- Congressional District 35819,409
- Congressional District 36784,320
- Congressional District 37774,416
- Congressional District 38788,192
State senate districts
The upper chamber’s districts, as drawn in 2024.
- State Senate District 1942,588
- State Senate District 21.02M
- State Senate District 3983,924
- State Senate District 41.02M
- State Senate District 51.01M
- State Senate District 6939,748
- State Senate District 7994,464
- State Senate District 81.06M
- State Senate District 9988,860
- State Senate District 10980,870
- State Senate District 11945,681
- State Senate District 12989,746
- State Senate District 13952,807
- State Senate District 14990,901
- State Senate District 15997,580
- State Senate District 16960,130
- State Senate District 17951,718
- State Senate District 181.02M
- State Senate District 19952,969
- State Senate District 20932,859
- State Senate District 21932,499
- State Senate District 22997,084
- State Senate District 23976,234
- State Senate District 241.00M
- State Senate District 25976,058
- State Senate District 26936,306
- State Senate District 27936,113
- State Senate District 28917,743
- State Senate District 29920,600
- State Senate District 301.05M
- State Senate District 31909,299
State house districts
The lower chamber’s districts, as drawn in 2024.
- State House District 1195,039
- State House District 2209,405
- State House District 3228,331
- State House District 4225,067
- State House District 5191,603
- State House District 6196,601
- State House District 7205,372
- State House District 8197,435
- State House District 9204,284
- State House District 10213,160
- State House District 11187,001
- State House District 12211,240
- State House District 13195,142
- State House District 14210,082
- State House District 15211,502
- State House District 16211,754
- State House District 17217,646
- State House District 18222,308
- State House District 19214,450
- State House District 20225,252
- State House District 21188,396
- State House District 22183,516
- State House District 23209,116
- State House District 24201,372
- State House District 25201,251
- State House District 26215,452
- State House District 27199,902
- State House District 28237,652
- State House District 29190,004
- State House District 30190,603
- State House District 31188,373
- State House District 32192,591
- State House District 33211,690
- State House District 34185,240
- State House District 35198,384
- State House District 36189,405
- State House District 37186,387
- State House District 38187,098
- State House District 39190,149
- State House District 40194,599
- State House District 41192,214
- State House District 42181,876
- State House District 43197,268
- State House District 44203,493
- State House District 45224,353
- State House District 46229,750
- State House District 47205,643
- State House District 48203,169
- State House District 49200,815
- State House District 50215,212
- State House District 51202,165
- State House District 52240,390
- State House District 53204,563
- State House District 54187,988
- State House District 55198,909
- State House District 56202,826
- State House District 57197,350
- State House District 58205,288
- State House District 59202,842
- State House District 60203,814
- State House District 61225,464
- State House District 62196,733
- State House District 63203,290
- State House District 64211,723
- State House District 65221,696
- State House District 66222,717
- State House District 67218,938
- State House District 68199,047
- State House District 69186,323
- State House District 70192,579
- State House District 71194,862
- State House District 72183,432
- State House District 73228,111
- State House District 74203,980
- State House District 75207,368
- State House District 76211,438
- State House District 77196,378
- State House District 78207,169
- State House District 79201,259
- State House District 80199,681
- State House District 81183,285
- State House District 82192,153
- State House District 83190,337
- State House District 84190,003
- State House District 85209,887
- State House District 86190,845
- State House District 87183,451
- State House District 88185,161
- State House District 89215,566
- State House District 90203,267
- State House District 91188,279
- State House District 92185,798
- State House District 93212,192
- State House District 94186,662
- State House District 95205,659
- State House District 96201,905
- State House District 97196,659
- State House District 98184,562
- State House District 99201,547
- State House District 100184,230
- State House District 101200,860
- State House District 102187,929
- State House District 103189,423
- State House District 104187,213
- State House District 105191,992
- State House District 106220,507
- State House District 107183,092
- State House District 108181,544
- State House District 109190,307
- State House District 110185,292
- State House District 111190,627
- State House District 112184,638
- State House District 113182,831
- State House District 114183,650
- State House District 115198,411
- State House District 116208,653
- State House District 117216,142
- State House District 118214,515
- State House District 119207,901
- State House District 120206,647
- State House District 121206,796
- State House District 122207,624
- State House District 123201,919
- State House District 124189,927
- State House District 125207,217
- State House District 126202,084
- State House District 127217,029
- State House District 128193,048
- State House District 129201,421
- State House District 130199,671
- State House District 131207,584
- State House District 132221,285
- State House District 133187,066
- State House District 134205,478
- State House District 135209,038
- State House District 136207,046
- State House District 137201,493
- State House District 138203,082
- State House District 139213,424
- State House District 140184,046
- State House District 141203,505
- State House District 142196,038
- State House District 143193,571
- State House District 144201,270
- State House District 145183,855
- State House District 146194,504
- State House District 147202,649
- State House District 148209,370
- State House District 149198,209
- State House District 150209,583
PUMAs
Public Use Microdata Areas: areas of 100,000 people or more that the state draws from census tracts, for the Census Bureau’s microdata.
- Alamo Area COG (Northeast)–Comal County PUMA183,826
- Alamo Area COG (Northeast)–Guadalupe County PUMA183,642
- Alamo Area COG (Northwest) & Blanco County PUMA142,026
- Alamo Area COG (Southwest) PUMA145,158
- Ark-Tex COG (East)–Bowie & Cass Counties PUMA120,683
- Ark-Tex COG (West) PUMA159,573
- Austin City (Central) PUMA156,565
- Austin City (North) PUMA113,368
- Austin City (Northeast) PUMA167,682
- Austin City (Northwest) PUMA121,632
- Austin City (South) PUMA127,837
- Austin City (Southeast) PUMA135,612
- Austin City (Southwest), Lost Creek & Barton Creek PUMA121,947
- Bexar County (North)–San Antonio City (Far North) & Timberwood Park PUMA150,543
- Bexar County (Northeast)–San Antonio (Northeast), Universal City & Converse Cities PUMA124,424
- Bexar County (Northwest)–San Antonio (Far Northwest) & Helotes Cities PUMA200,602
- Bexar County (South)–San Antonio City (Far South) PUMA171,220
- Brazos County–College Station & Bryan Cities (Central) PUMA129,656
- Brazos County–College Station & Bryan Cities (Outer) PUMA112,655
- Brazos Valley COG (Outside Brazos County) & Milam County PUMA159,489
- Cameron County (East)–Brownsville City (North) PUMA126,100
- Cameron County (South)–Brownsville City (Central) PUMA149,090
- Cameron County (West)–Harlingen & San Benito Cities PUMA150,930
- Capital Area COG (East)–Bastrop, Caldwell, Fayette & Lee Counties PUMA198,264
- Capital Area COG (Southwest)–Hays County (East) PUMA151,127
- Capital Area COG (Southwest)–Hays County (West) PUMA117,511
- Capital Area COG–Williamson County (North), Georgetown (East) & Taylor Cities PUMA181,748
- Capital Area COG–Williamson County (Southeast), Round Rock City PUMA141,976
- Capital Area COG–Williamson County (West), Cedar Park & Leander Cities PUMA212,855
- Central Texas COG (West), Burnet & Llano Counties PUMA201,152
- Central Texas COG–Bell County (North, East & South), Temple & Belton Cities PUMA201,998
- Central Texas COG–Bell County (West), Killeen & Harker Heights Cities PUMA184,899
- Coastal Bend COG (Central) & Willacy County PUMA108,276
- Coastal Bend COG (Northeast) PUMA132,847
- Coastal Bend COG–Nueces County (Central), Corpus Christi City (Northwest) PUMA121,351
- Coastal Bend COG–Nueces County (Central), Corpus Christi City (South Central) PUMA114,293
- Coastal Bend COG–Nueces County, Corpus Christi City (Outer) PUMA117,311
- Collin County (Central)–McKinney City PUMA167,152
- Collin County (East) PUMA226,064
- Collin County (Northwest)–Celina City & Prosper Town PUMA131,337
- Collin County (Northwest)–Frisco City (East) PUMA111,780
- Collin County (South Central)–Allen, Murphy, Plano (East) & Parker Cities PUMA156,122
- Collin County (Southwest)–Dallas (North), Plano (South) & Richardson (North) Cities PUMA141,480
- Collin County (Southwest)–Plano City (Central) PUMA110,844
- Collin County (Southwest)–Plano City (West) PUMA118,558
- Concho Valley COG & Permian Basin Regional Planning Commission (East) PUMA109,428
- Concho Valley COG–Tom Green County, San Angelo City PUMA119,577
- Dallas (East) & Mesquite (West) Cities–South of I-30 & West of I-635 PUMA133,871
- Dallas (Far North) & Richardson (Southwest) Cities PUMA108,584
- Dallas (Far North)–Carrollton (Southeast) Cities & Addison Town, North of I-635 PUMA114,602
- Dallas (Northeast) & Mesquite (North) Cities–North of I-30 & West of I-635 PUMA126,088
- Dallas (West Central), University Park Cities & Highland Park Town PUMA112,742
- Dallas City (Downtown)–North of I-30 PUMA131,824
- Dallas City (East Central)–South of I-30 & East of I-35E PUMA126,041
- Dallas City (North)–South of I-635 & West of US-75 PUMA112,858
- Dallas City (Northeast)–East of US-75 PUMA126,297
- Dallas City (South Central)–North of I-20 & West of I-35E PUMA106,232
- Dallas City (West Central)–East of Loop TX-12 & West of I-35E PUMA113,214
- Dallas County (East)–Mesquite City (Central & Southeast) PUMA131,303
- Dallas County (Northeast)–Garland (Northwest) & Richardson (East) Cities PUMA115,591
- Dallas County (Northeast)–Garland City (South) PUMA104,352
- Dallas County (Northeast)–Rowlett & Garland (Northeast) Cities PUMA118,767
- Dallas County (Northwest)–Irving (Central) & Dallas (Northwest) Cities PUMA117,881
- Dallas County (Northwest)–Irving (North), Coppell & Carrollton (Southwest) Cities PUMA131,091
- Dallas County (South)–DeSoto & Lancaster Cities PUMA118,284
- Dallas County (Southeast)–Dallas City (Southeast) PUMA126,057
- Dallas County (Southwest)–Cedar Hill & Duncanville Cities PUMA112,786
- Dallas County (West)–Grand Prairie (Central) & Dallas (Southwest) Cities PUMA116,751
- Dallas County (West)–Irving (South) & Grand Prairie (North) Cities PUMA115,963
- Deep East Texas COG (Central)–Angelina & Nacogdoches Counties PUMA152,437
- Deep East Texas COG (East) & Jasper County PUMA107,110
- Deep East Texas COG (West) & Walker County PUMA197,547
- Denton County (Central)–Denton (Central) & Corinth Cities PUMA135,754
- Denton County (East Central)–Frisco (West), The Colony & Little Elm Cities PUMA199,821
- Denton County (Far Southeast)–Carrollton (North) & Dallas (North) Cities PUMA138,261
- Denton County (North & West)–Denton City (Outer) PUMA224,355
- Denton County (South Central)–Flower Mound Town & Highland Village City PUMA160,861
- Denton County (Southeast)–Lewisville City PUMA120,509
- East Texas COG (Central)–Gregg County (Longview City) PUMA125,480
- East Texas COG (Central)–Smith County (Outside Tyler City) PUMA119,031
- East Texas COG (Central)–Smith County (West) (Tyler City) PUMA122,709
- East Texas COG (Northeast)–Harrison, Upshur & Marion Counties PUMA122,459
- East Texas COG (Northwest)–Van Zandt, Wood, Camp & Rains Counties PUMA135,183
- East Texas COG (Southeast)–Rusk, Cherokee & Panola Counties PUMA127,454
- East Texas COG (Southwest)–Henderson & Anderson Counties PUMA143,301
- El Paso City (Central) PUMA141,110
- El Paso City (East) PUMA181,564
- El Paso City (North) PUMA136,217
- El Paso City (Northwest) PUMA146,844
- El Paso City (Southeast)–Socorro City PUMA120,191
- El Paso County (Outside El Paso City)–Horizon City PUMA144,853
- Ellis County PUMA213,160
- Fort Bend County (Central)–Rosenberg City, Pecan Grove & New Territory PUMA130,352
- Fort Bend County (East)–Missouri City PUMA118,019
- Fort Bend County (North)–Mission Bend (Southwest), Cinco Ranch & Four Corners PUMA193,228
- Fort Bend County (Northeast)–Sugar Land & Stafford Cities PUMA128,771
- Fort Bend County (Northwest) PUMA188,039
- Fort Bend County (South) PUMA135,358
- Fort Worth (Northeast)–Hurst (South) Cities, North of I-30 PUMA147,980
- Fort Worth City (East Central)-South of I-30, East of I-35W & Inside Loop I-820 PUMA121,127
- Fort Worth City (North Central) & Haltom City (North)–Inside Loop I-820 PUMA111,248
- Fort Worth City (North)–East of I-35W & West of US-377 PUMA131,865
- Fort Worth City (South Central) & Edgecliff Village Town PUMA136,111
- Galveston County (Central, South & East)–Galveston, Texas City & La Marque Cities PUMA179,467
- Galveston County (Northwest)–League City & Friendswood City PUMA179,523
- Golden Crescent Regional Planning Commission (North) & Wilson & Karnes Counties PUMA150,461
- Golden Crescent Regional Planning Commission (Southeast)–Victoria & Calhoun Counties PUMA111,281
- Harris County (East)–Baytown City PUMA123,384
- Harris County (East)–Deer Park, La Porte (North) Cities & Channelview PUMA116,185
- Harris County (Far North)–Spring PUMA152,300
- Harris County (Far North)–Tomball City & The Woodlands (Southwest) PUMA179,893
- Harris County (Far Northwest) PUMA122,006
- Harris County (Far Northwest)–Katy City (Northeast) PUMA137,717
- Harris County (North)–Houston (North), Humble Cities & Atascocita PUMA153,104
- Harris County (North)–Houston City (North)-I-45, Between Beltway TX-8 & FM-1960 PUMA139,477
- Harris County (North)–North of FM-1960, West of I-45 & East of TX-249 PUMA130,746
- Harris County (Northeast)–Houston City (Far Northeast) PUMA138,005
- Harris County (Northwest)–Jersey Village City-Between Beltway TX-8 & FM-1960 PUMA116,367
- Harris County (Northwest)–North of US-290 & North of FM-1960 PUMA138,427
- Harris County (Northwest)–South of US-290 & West of TX-6 PUMA112,480
- Harris County (Southeast)–Pasadena City (North & Central)-Inside Beltway TX-8 PUMA115,250
- Harris County (West)–Houston City (West)-North of US-90 & West of TX-6 PUMA119,163
- Heart of Texas COG–McLennan County-Waco (Outer), Hewitt & Robinson Cities PUMA156,830
- Heart of Texas COG–McLennan County-Waco City (Central) PUMA109,237
- Heart of Texas COG–Outside McLennan County & Navarro County PUMA170,349
- Hidalgo County (Central)–McAllen City PUMA140,627
- Hidalgo County (East)–Alamo & Donna Cities PUMA118,310
- Hidalgo County (North & West) PUMA120,105
- Hidalgo County (North Central)–Edinburg City PUMA145,885
- Hidalgo County (South Central)–Pharr, San Juan & Hidalgo Cities PUMA136,604
- Hidalgo County (Southeast)–Weslaco & Mercedes Cities PUMA114,009
- Hidalgo County (Southwest)–Mission City PUMA116,437
- Houston (East), Galena Park, Jacinto Cities & Cloverleaf PUMA113,321
- Houston (Southeast) & South Houston Cities–Inside Beltway TX-8 PUMA105,359
- Houston (Southeast) & Webster Cities PUMA116,377
- Houston (Southeast), Pasadena (Southeast), La Porte (South) & Seabrook (East) Cities PUMA113,935
- Houston (Southwest) & Bellaire (Southeast) Cities–Between Loop I-610 & Beltway TX-8 PUMA97,808
- Houston (West) & Hunters Creek Village Cities–Between Loop I-610 & Beltway TX-8 PUMA124,290
- Houston (West) & Spring Valley Village Cities–Between Loop I-610 & Beltway TX-8 PUMA114,096
- Houston City (East Central)–East of I-45 & Inside Loop I-610 PUMA105,248
- Houston City (North Central)–North of I-10 & Inside Loop I-610 PUMA124,516
- Houston City (North) & Aldine–Between Loop I-610 & Beltway TX-8 PUMA101,400
- Houston City (North)–South of Aldine & Inside Beltway TX-8 PUMA130,346
- Houston City (North)–West of Aldine & Inside Beltway TX-8 PUMA117,195
- Houston City (Northeast)–Between Loop I-610 & Beltway TX-8 PUMA131,903
- Houston City (Northwest)–Between Loop I-610 & Beltway TX-8 PUMA112,542
- Houston City (South Central)–South of US-59, West of I-45 & Inside Loop I-610 PUMA134,057
- Houston City (South)–Between Loop I-610 & Beltway TX-8 PUMA117,529
- Houston City (Southeast)–West of Pasadena City & Outside Loop I-610 PUMA121,808
- Houston City (Southwest)–Between Loop I-610 & Beltway TX-8 PUMA110,829
- Houston City (Southwest)–East of TX-6 & West of Beltway TX-8 PUMA109,217
- Houston City (West Central)–South of I-10 & Inside Loop I-610 PUMA160,475
- Houston City (West)–East of TX-6 & West of Beltway TX-8 PUMA121,702
- Houston City (West)–South of I-10 & West of TX-6 PUMA118,001
- Houston City (West)–Westpark Tollway, Between Loop I-610 & Beltway TX-8 PUMA115,405
- Houston City (West)–Westpark Tollway, West of Beltway TX-8 PUMA126,440
- Houston-Galveston Area Council (West) PUMA191,851
- Houston-Galveston Area Council–Brazoria County (Central), Alvin City PUMA144,383
- Houston-Galveston Area Council–Brazoria County (North), Pearland City PUMA141,210
- Houston-Galveston Area Council–Brazoria County (Southwest), Lake Jackson City PUMA105,662
- Houston-Galveston Area Council–Liberty & Chambers Counties PUMA154,878
- Houston-Galveston Area Council–Montgomery County (Northeast), Conroe City (East) PUMA193,174
- Houston-Galveston Area Council–Montgomery County (South), The Woodlands (North) PUMA124,507
- Houston-Galveston Area Council–Montgomery County (Southeast) PUMA171,981
- Houston-Galveston Area Council–Montgomery County (West), Conroe City (West) PUMA194,770
- Hunt & Rockwall Counties–Rockwall, Greenville & Dallas (Far Northeast) Cities PUMA232,589
- Jefferson County (North Central)–Beaumont City PUMA113,201
- Jefferson County (Outside Beaumont City)–Port Arthur City PUMA140,677
- Johnson County PUMA195,597
- Kaufman County PUMA172,604
- Middle Rio Grande Development Council–Excluding Dimmit & La Salle Counties PUMA147,365
- North Central Texas COG (West)–Hood, Erath, Palo Pinto & Somervell Counties PUMA148,674
- North Texas Regional Planning Commission (Wichita County)–Wichita Falls City PUMA129,996
- North Texas Regional Planning Commission–Outside Wichita County & Wise County PUMA164,285
- Orange & Hardin Counties PUMA142,949
- Panhandle Regional Planning Commission (Potter County)–Amarillo City (North) PUMA115,975
- Panhandle Regional Planning Commission (Randall County)–Amarillo City (South) PUMA146,070
- Panhandle Regional Planning Commission–Outside Potter & Randall Counties PUMA173,214
- Parker County PUMA165,168
- Permian Basin Regional Planning Commission (Central)–Ector County, Odessa City PUMA164,654
- Permian Basin Regional Planning Commission (Central)–Midland County, Midland City PUMA174,801
- Rio Grande COG & Permian Basin Regional Planning Commission (West) PUMA99,643
- San Antonio (Northeast), Kirby & Windcrest Cities PUMA139,819
- San Antonio (Northwest) & Leon Valley Cities PUMA112,790
- San Antonio City (Central) PUMA107,319
- San Antonio City (North)–Hollywood Park Town & Shavano Park City PUMA122,590
- San Antonio City (Northeast)–Between Loop TX-1604 & Loop I-410 PUMA107,222
- San Antonio City (Northeast)–Inside Loop I-410 PUMA118,844
- San Antonio City (Northwest)–Between Loop TX-1604 & Loop I-410 PUMA132,794
- San Antonio City (Northwest)–Inside Loop I-410 PUMA104,630
- San Antonio City (Southeast)–Inside Loop I-410 PUMA118,893
- San Antonio City (Southwest)–Inside Loop I-410 PUMA119,840
- San Antonio City (West)–Between Loop TX-1604 & Loop I-410 PUMA122,558
- San Antonio City (West)–Inside Loop I-410 PUMA113,253
- South Plains Association of Governments–Lubbock County, Lubbock City (Central) PUMA161,016
- South Plains Association of Governments–Lubbock County, Lubbock City (Outer) PUMA157,868
- South Plains Association of Governments–Outside Lubbock County PUMA119,253
- South Texas Development Council (North)–Webb County, Laredo City (Central) PUMA117,010
- South Texas Development Council (South)–Coastal Bend COG (West), Dimmit & La Salle PUMA110,296
- South Texas Development Council-Webb County (North & East)-Laredo City (Outer) PUMA152,284
- Tarrant County (East)–Arlington (East) & Grand Prairie (West Central) Cities PUMA132,835
- Tarrant County (East)–Arlington City (West)-South of I-30 & East of Loop I-820 PUMA120,852
- Tarrant County (East)–Euless (South & West) & Arlington (North) Cities PUMA138,818
- Tarrant County (North)–North Richland Hills (North) & Keller Cities PUMA125,127
- Tarrant County (Northeast)–Grapevine, Southlake & Colleyville Cities PUMA121,860
- Tarrant County (Northwest)–Fort Worth (Northwest) & Saginaw Cities PUMA207,615
- Tarrant County (South Central)–Fort Worth City (Southeast)-South of I-20 PUMA147,824
- Tarrant County (Southeast)–Arlington (Southeast) & Grand Prairie (Southwest) Cities PUMA121,445
- Tarrant County (Southeast)–Mansfield (North) & Arlington (Southwest) Cities PUMA131,825
- Tarrant County (Southwest)–Fort Worth (Southwest) & Benbrook Cities PUMA153,789
- Tarrant County (West)–Fort Worth City (West) PUMA117,069
- Texoma COG–Grayson, Cooke & Fannin Counties PUMA223,709
- Travis County (Northeast)–Pflugerville, Manor Cities & Wells Branch PUMA202,924
- Travis County (West, South & Outside Austin City) PUMA182,448
- West Central Texas COG (Outside Taylor County) PUMA191,029
- West Central Texas COG–Taylor County, Abilene City PUMA145,863
- Williamson County (South)–Austin City (Far North), Brushy Creek & Jollyville PUMA136,109
Urban areas
Each that reaches into Texas, with its whole population. Urban areas are the densely settled land the Census Bureau draws after each census, whatever the city lines.
- Abilene, TX121,201
- Alice, TX19,432
- Alpine, TX6,244
- Alvarado, TX5,414
- Amarillo, TX206,382
- Andrews, TX15,034
- Angleton, TX20,873
- Aransas Pass–Port Aransas–Ingleside, TX22,432
- Athens, TX12,177
- Atlanta, TX5,041
- Aubrey, TX5,289
- Austin, TX1.88M
- Bastrop, TX21,551
- Bay City, TX19,378
- Beaumont, TX144,572
- Beeville, TX13,601
- Belterra, TX11,571
- Big Spring, TX25,616
- Boerne, TX20,884
- Bonham, TX8,158
- Borger, TX12,890
- Bowie, TX5,616
- Brady, TX4,995
- Breckenridge, TX5,314
- Brenham, TX18,232
- Brownfield, TX8,088
- Brownsville, TX219,665
- Brownwood, TX21,436
- Burkburnett, TX10,826
- Burnet, TX5,358
- Cameron, TX5,131
- Canyon Lake, TX7,728
- Canyon, TX17,283
- Carrizo Springs, TX6,096
- Carthage, TX6,511
- Center, TX5,093
- Childress, TX4,434
- Cleburne, TX47,867
- Cleveland, TX7,844
- Coleman, TX3,750
- College Station–Bryan, TX212,490
- Colorado City, TX4,627
- Commerce, TX8,883
- Corpus Christi, TX338,587
- Corsicana, TX24,640
- Crockett, TX6,230
- Crystal City, TX6,557
- Cuero, TX6,636
- Dalhart, TX7,827
- Dallas–Fort Worth–Arlington, TX5.84M
- Dayton, TX7,233
- Decatur, TX7,365
- Del Rio, TX42,701
- Denton Southwest, TX15,733
- Denton–Lewisville, TX451,113
- Dumas, TX14,509
- Eagle Pass, TX54,723
- Edna, TX5,931
- El Campo, TX12,791
- El Paso, TX–NM866,154
- Elgin, TX12,630
- Elsa, TX15,031
- Ennis, TX22,081
- Fabens, TX4,425
- Falfurrias, TX4,671
- Floresville, TX6,104
- Forney, TX49,278
- Fort Stockton, TX8,676
- Fredericksburg, TX12,108
- Gainesville, TX17,031
- Galveston–Texas City, TX195,223
- Gatesville, TX14,830
- Gilmer, TX5,277
- Gonzales, TX7,026
- Graham, TX8,717
- Granbury, TX30,496
- Greenville, TX29,869
- Gun Barrel City, TX19,582
- Harlingen, TX119,972
- Heartland, TX11,334
- Hempstead, TX5,483
- Henderson, TX14,757
- Hereford, TX15,043
- Hillsboro, TX8,425
- Hondo, TX6,451
- Hornsby Bend, TX11,756
- Horseshoe Bay, TX6,741
- Houston, TX6.02M
- Huntsville, TX44,863
- Iowa Park, TX6,467
- Jacksonville, TX13,983
- Jasper, TX7,529
- Kaufman, TX7,132
- Kermit, TX5,760
- Kerrville, TX33,678
- Kilgore, TX15,568
- Killeen, TX261,908
- Kingsland, TX8,549
- Kingsville, TX24,661
- Krum, TX6,354
- La Grange, TX5,224
- Lago Vista (Travis County), TX8,333
- Lake Conroe Eastshore, TX12,372
- Lake Conroe Westshore, TX31,311
- Lake Jackson, TX56,676
- Lamesa, TX8,506
- Lampasas, TX6,764
- Laredo, TX253,727
- Levelland, TX12,340
- Liberty, TX7,681
- Lindale–Hideaway, TX11,790
- Littlefield, TX5,610
- Livingston, TX5,553
- Lockhart, TX13,684
- Longview, TX108,724
- Lubbock, TX278,660
- Lufkin, TX40,137
- Luling, TX5,537
- Manor, TX22,580
- Marble Falls, TX7,628
- Marlin, TX5,447
- Marshall, TX22,082
- Mathis, TX5,010
- McAllen, TX797,093
- McGregor, TX5,462
- McKinney–Frisco, TX563,549
- Melissa–Anna, TX45,181
- Mexia, TX6,491
- Midland, TX146,186
- Midlothian, TX34,479
- Mineola, TX5,685
- Mineral Wells, TX14,373
- Monahans, TX8,504
- Mont Belvieu, TX16,809
- Mount Pleasant, TX15,250
- Muleshoe, TX5,667
- Nacogdoches, TX34,099
- Navasota, TX7,675
- New Boston, TX4,555
- New Braunfels, TX117,620
- Odessa, TX155,325
- Orange, TX40,186
- Palestine, TX18,652
- Pampa, TX16,724
- Paris, TX26,857
- Pearsall, TX9,196
- Pecan Plantation, TX7,263
- Pecos, TX10,742
- Perryton, TX8,486
- Pinehurst (Montgomery County)–Magnolia, TX11,206
- Plainview, TX22,481
- Pleasanton, TX14,027
- Port Arthur, TX115,697
- Port Isabel–South Padre Island–Laguna Vista, TX12,951
- Port Lavaca, TX11,421
- Princeton, TX21,913
- Raymondville, TX13,237
- Rio Grande City–Roma, TX45,948
- Robstown, TX10,728
- Rockdale, TX5,256
- Rockport, TX16,839
- Royse City, TX18,528
- San Angelo, TX99,672
- San Antonio, TX2.05M
- San Marcos, TX71,590
- Sanger, TX8,133
- Sealy, TX6,477
- Seguin, TX31,019
- Seminole, TX7,416
- Sherman–Denison, TX70,405
- Silsbee, TX8,751
- Sinton, TX5,852
- Slaton, TX5,707
- Snyder, TX11,185
- Sonterra, TX12,659
- Stephenville, TX21,599
- Sulphur Springs, TX15,913
- Sweetwater, TX10,149
- Taylor, TX15,769
- Temple, TX120,869
- Terrell, TX19,373
- Texarkana, TX–AR78,248
- The Woodlands–Conroe, TX439,008
- Tyler, TX134,580
- Uvalde, TX16,258
- Vernon, TX9,078
- Victoria, TX65,629
- Waco, TX196,900
- Weatherford, TX54,177
- West Columbia, TX6,049
- Wharton, TX8,676
- Whitehouse, TX10,836
- Wichita Falls, TX97,525
- Yoakum, TX5,420
- Zapata–Medina, TX10,973
Tribal areas
Each that reaches into Texas, with its whole population.
Turn Texas into your planning report.
Social Explorer Studio builds an editable profile of any place, with tables and charts beside the county and state, and exports to Word, PDF and Excel.
Questions about Texas
What is the population of Texas?
31,709,821 people, according to the ACS 2025 1-year estimates, which the Census Bureau adjusts to match its own population estimate. That’s the 2nd largest of the 50 states and DC.
What is the FIPS code for Texas?
48. Every county’s and place’s FIPS code in Texas starts with it. The Census Bureau’s full geographic identifier (GEOID) is 0400000US48.
What is the largest city in Texas?
Houston, with 2,395,938 people. Other large cities here include San Antonio, Dallas and Fort Worth.
What is the median household income in Texas?
$82,625 (±$670), according to the ACS 2025 1-year estimates, lower than the US ($84,780).
What is the median age in Texas?
36.2 years (±0.2), according to the ACS 2025 1-year estimates, lower than the US (39.5).
How much does housing cost in Texas?
Texas’s median home value is $318,100 (±$1,418) and its median gross rent is $1,515 (±$11) a month, according to the ACS 2025 1-year estimates. 48.2% (±0.8%) of its renters pay 30% or more of their income on rent.
Is Texas growing?
Texas’s population grew 15.4%, from 27,469,114 in 2015 to 31,709,821 in 2025, according to the ACS 1-year estimates.
Where do people who work in Texas live?
13,335,103 of its 13,543,073 jobs are held by people who live here. Of those who commute in, the most come from Louisiana, New Mexico, Oklahoma.
Where does this census data come from?
The U.S. Census Bureau’s American Community Survey, through Social Explorer’s tables: the latest 1-year estimates where they exist, for the most recent numbers, and 5-year estimates otherwise. Each table lists its code, so you can find it again.
Is this data free to use?
Yes. You can read it, cite it, download the CSV and embed the charts, with no account. To map other variables, compare your own areas or build a report, see Social Explorer’s plans in a live demo.
Sources and how to cite
American Community Survey 2025 1-year estimates, or 2020–2024 5-year estimates where noted, U.S. Census Bureau, from Social Explorer’s tables A00001, A00002, A01004, A04001, A06001, A08001, A09005, A10001, A10003, A10008, A10030, A10036, A10040, A10047, A10055, A10060, A12001, A13004, A14006, A14024, A14028, A16002, A17005, A18002, A18009, A20001, B02002, B09001, B13002, B18101, C16001. Maps by census tract use 2020–2024 5-year estimates, since the 1-year survey doesn’t cover tracts. Commuting: LEHD LODES 2023. These are estimates from a sample, each with its margin of error. Data retrieved November 14, 2026. How these profiles are made.
U.S. Census Bureau, American Community Survey 2025 1-year estimates, or 2020–2024 5-year estimates where noted, via Social Explorer. “Texas.” https://www.socialexplorer.com/places/texas. Accessed November 14, 2026.