

New Hampshire: Population, demographics and census data
Home to 1,415,342 people, the 41st largest of the 50 states and DC, anchored by Manchester and Nashua. It grew 6.4% between 2015 and 2025.
- Population
- 1.42M. Census Bureau estimate · Rank 41 of the 50 states and DC
- Median household income
- $106,759 ±$2,502. US $84,780
- Median age
- 44.2 ±0.3. US 39.5
ACS 2025 1-year estimates, U.S. Census Bureau
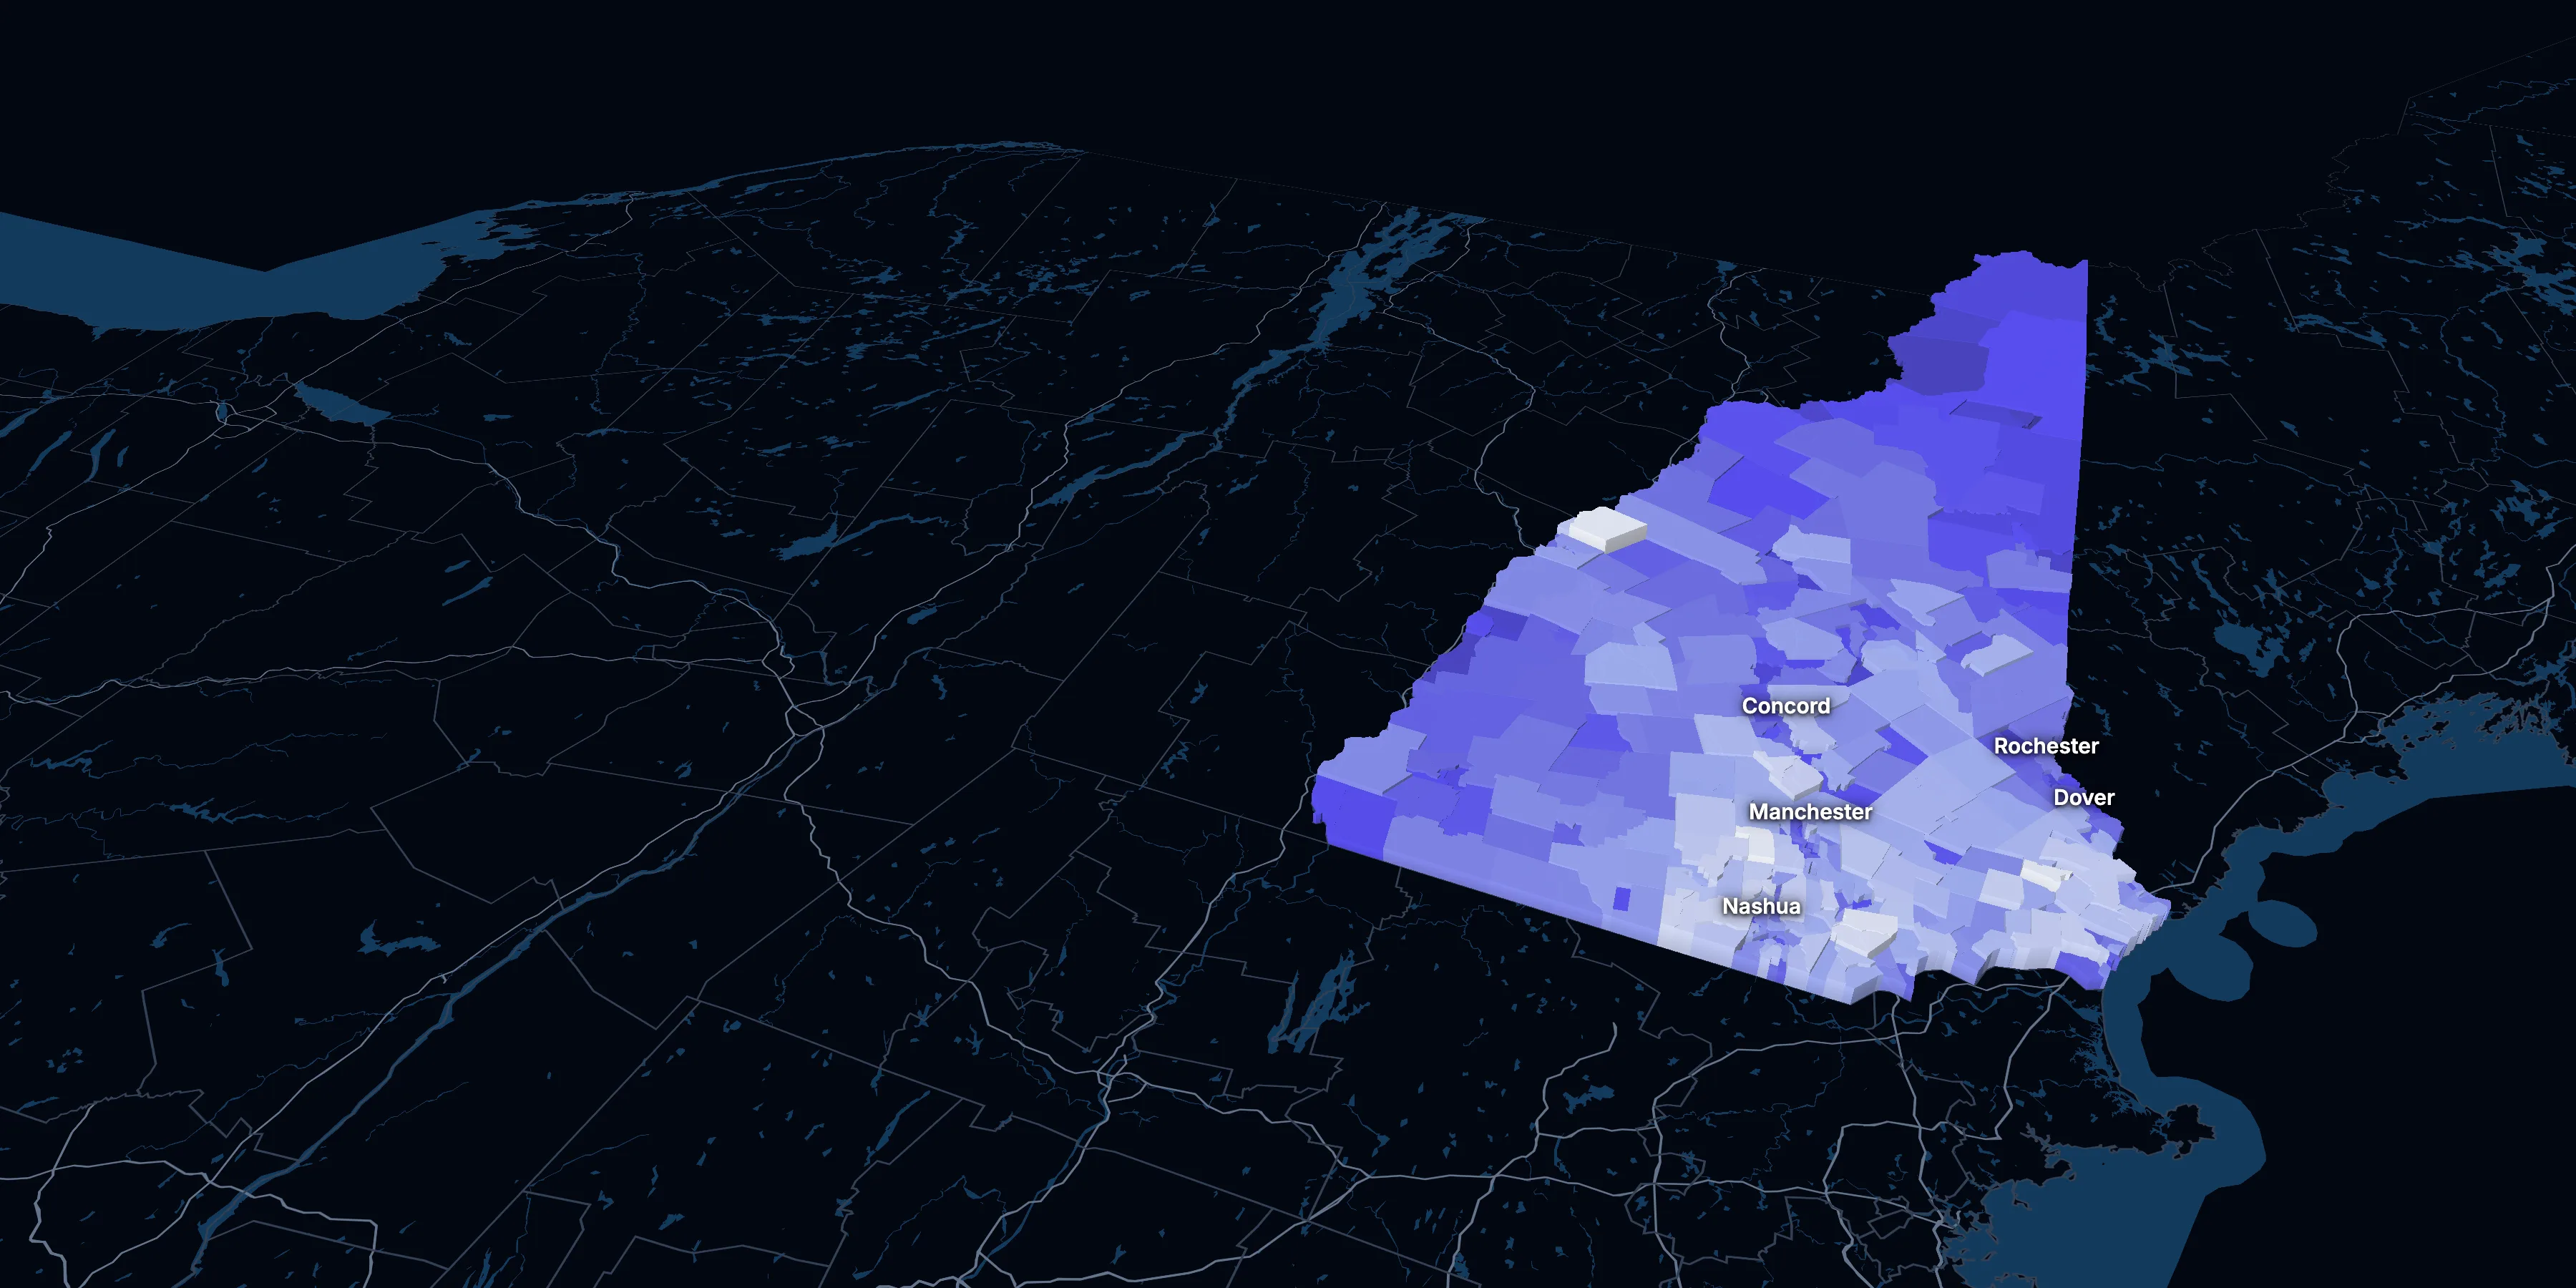
Taller, lighter tracts have higher household incomes
About New Hampshire
New Hampshire’s median household income is $106,759 (±$2,502), higher than the US ($84,780), and its median age is 44.2 (±0.3), according to the ACS 2025 1-year estimates. Its largest city is Manchester.
± is each figure’s margin of error, at 90% confidence, and † marks one too uncertain to lean on. Under each percentage in the tables is the number it counts. How the margins are worked out.
FIPS code 33
Highlights
What stands out in New Hampshire
The numbers where New Hampshire sits furthest from the nation, or past a recognized policy benchmark.
Past a policy benchmark
+14 points
HighRent growth ahead of income
After inflation, rent grew 25% from 2015 to 2025, and household income 11%. The dots show rent growth.
26.5%
ElevatedHomes built before 1960
That’s higher than the US (24.0%). Older homes carry more lead-paint risk: the EPA found lead paint in 69% of homes built from 1940 to 1959.
Furthest from the national picture
6.2%
Lowest among statesLiving in poverty
That’s lower than the US (11.8%). It’s the lowest of the 50 states and DC.
44.2
2nd among statesMedian age
That’s higher than the US (39.5). It’s the 2nd highest of the 50 states and DC.
23.0%
Higher than the US65 and over
That’s higher than the US (19.0%). It’s the 7th highest of the 50 states and DC.
17.3%
3rd lowest among statesUnder 18
That’s lower than the US (21.0%). It’s the 3rd lowest of the 50 states and DC.
2015 to 2025
How New Hampshire changed in ten years
The state added 84,734 people. It got older, more foreign-born and better educated, and poverty fell 2.1 points.
Population, change since 2015
+6.4% in the state and +6.3% in the US.
Source: ACS 1-year, 2015 to 2025, table A00001.
Show data
| New Hampshire | United States | |
|---|---|---|
| 2015 | 0.0% | 0.0% |
| 2016 | +0.3% | +0.5% |
| 2017 | +0.9% | +1.3% |
| 2018 | +1.9% | +1.8% |
| 2019 | +2.2% | +2.1% |
| 2021 | +4.4% | +3.3% |
| 2022 | +4.9% | +3.7% |
| 2023 | +5.4% | +4.2% |
| 2024 | +5.9% | +5.8% |
| 2025 | +6.4% | +6.3% |
Embed
Median household income, in 2025 dollars
+10.8% in the state and +10.9% in the US.
Source: ACS 1-year, 2015 to 2025, table A14006.
Show data
| New Hampshire | United States | |
|---|---|---|
| 2015 | $96,317 | $76,413 |
| 2016 | $95,946 | $77,931 |
| 2017 | $97,164 | $79,891 |
| 2018 | $96,933 | $80,059 |
| 2019 | $98,943 | $83,427 |
| 2021 | $105,981 | $83,521 |
| 2022 | $99,690 | $82,811 |
| 2023 | $103,024 | $82,683 |
| 2024 | $103,126 | $84,339 |
| 2025 | $106,759 | $84,780 |
Embed
Living in poverty
−2.1 points in the state and −3.0 points in the US.
Source: ACS 1-year, 2015 to 2025, table A13004.
Show data
| New Hampshire | United States | |
|---|---|---|
| 2015 | 8.2% | 14.7% |
| 2016 | 7.3% | 14.0% |
| 2017 | 7.7% | 13.4% |
| 2018 | 7.6% | 13.1% |
| 2019 | 7.3% | 12.3% |
| 2021 | 7.2% | 12.8% |
| 2022 | 7.2% | 12.6% |
| 2023 | 7.2% | 12.5% |
| 2024 | 7.2% | 12.1% |
| 2025 | 6.2% | 11.8% |
Embed
Bachelor’s degree or more
+5.9 points in the state and +6.7 points in the US.
Source: ACS 1-year, 2015 to 2025, table A12001.
Show data
| New Hampshire | United States | |
|---|---|---|
| 2015 | 35.7% | 30.6% |
| 2016 | 36.6% | 31.3% |
| 2017 | 36.9% | 32.0% |
| 2018 | 36.8% | 32.6% |
| 2019 | 37.6% | 33.1% |
| 2021 | 40.2% | 35.0% |
| 2022 | 41.3% | 35.7% |
| 2023 | 40.7% | 36.2% |
| 2024 | 41.5% | 36.8% |
| 2025 | 41.5% | 37.4% |
Embed
Median gross rent, in 2025 dollars
+25.1% in the state and +18.5% in the US.
Source: ACS 1-year, 2015 to 2025, table A18009.
Show data
| New Hampshire | United States | |
|---|---|---|
| 2015 | $1,393 | $1,314 |
| 2016 | $1,388 | $1,327 |
| 2017 | $1,419 | $1,340 |
| 2018 | $1,409 | $1,368 |
| 2019 | $1,456 | $1,393 |
| 2021 | $1,513 | $1,427 |
| 2022 | $1,546 | $1,440 |
| 2023 | $1,614 | $1,496 |
| 2024 | $1,610 | $1,537 |
| 2025 | $1,742 | $1,557 |
Embed
Median home value, in 2025 dollars
+45.4% in the state and +39.3% in the US.
Source: ACS 1-year, 2015 to 2025, table A10036.
Show data
| New Hampshire | United States | |
|---|---|---|
| 2015 | $334,970 | $266,469 |
| 2016 | $339,632 | $277,278 |
| 2017 | $349,033 | $288,124 |
| 2018 | $348,999 | $296,908 |
| 2019 | $357,262 | $305,336 |
| 2021 | $413,548 | $337,116 |
| 2022 | $426,157 | $355,481 |
| 2023 | $441,935 | $361,931 |
| 2024 | $474,176 | $372,685 |
| 2025 | $487,100 | $371,100 |
Embed
ACS 1-year estimates. The dotted stretch of each line spans 2020, when the Census Bureau released no standard 1-year estimates. Dollar values are in 2025 dollars.
| Indicator | 2015 | 2025 | Change |
|---|---|---|---|
| Population | 1,330,608 | 1,415,342 | +6.4% |
| Median age | 42.8 | 44.2 | +1.4 years |
| 65 and over | 16.4% | 23.0% | +6.6 points |
| Born outside the US | 6.0% | 7.3% | +1.3 points |
| Hispanic or Latino | 3.3% | 5.3% | +2.0 points |
| Median household income | $96,317 | $106,759 | +10.8% |
| Living in poverty | 8.2% | 6.2% | −2.1 points |
| Bachelor’s degree or more | 35.7% | 41.5% | +5.9 points |
| Households that rent | 29.1% | 28.1% | −1.1 points |
| Median gross rent | $1,393 | $1,742 | +25.1% |
| Median home value | $334,970 | $487,100 | +45.4% |
350 census tracts
New Hampshire, tract by tract
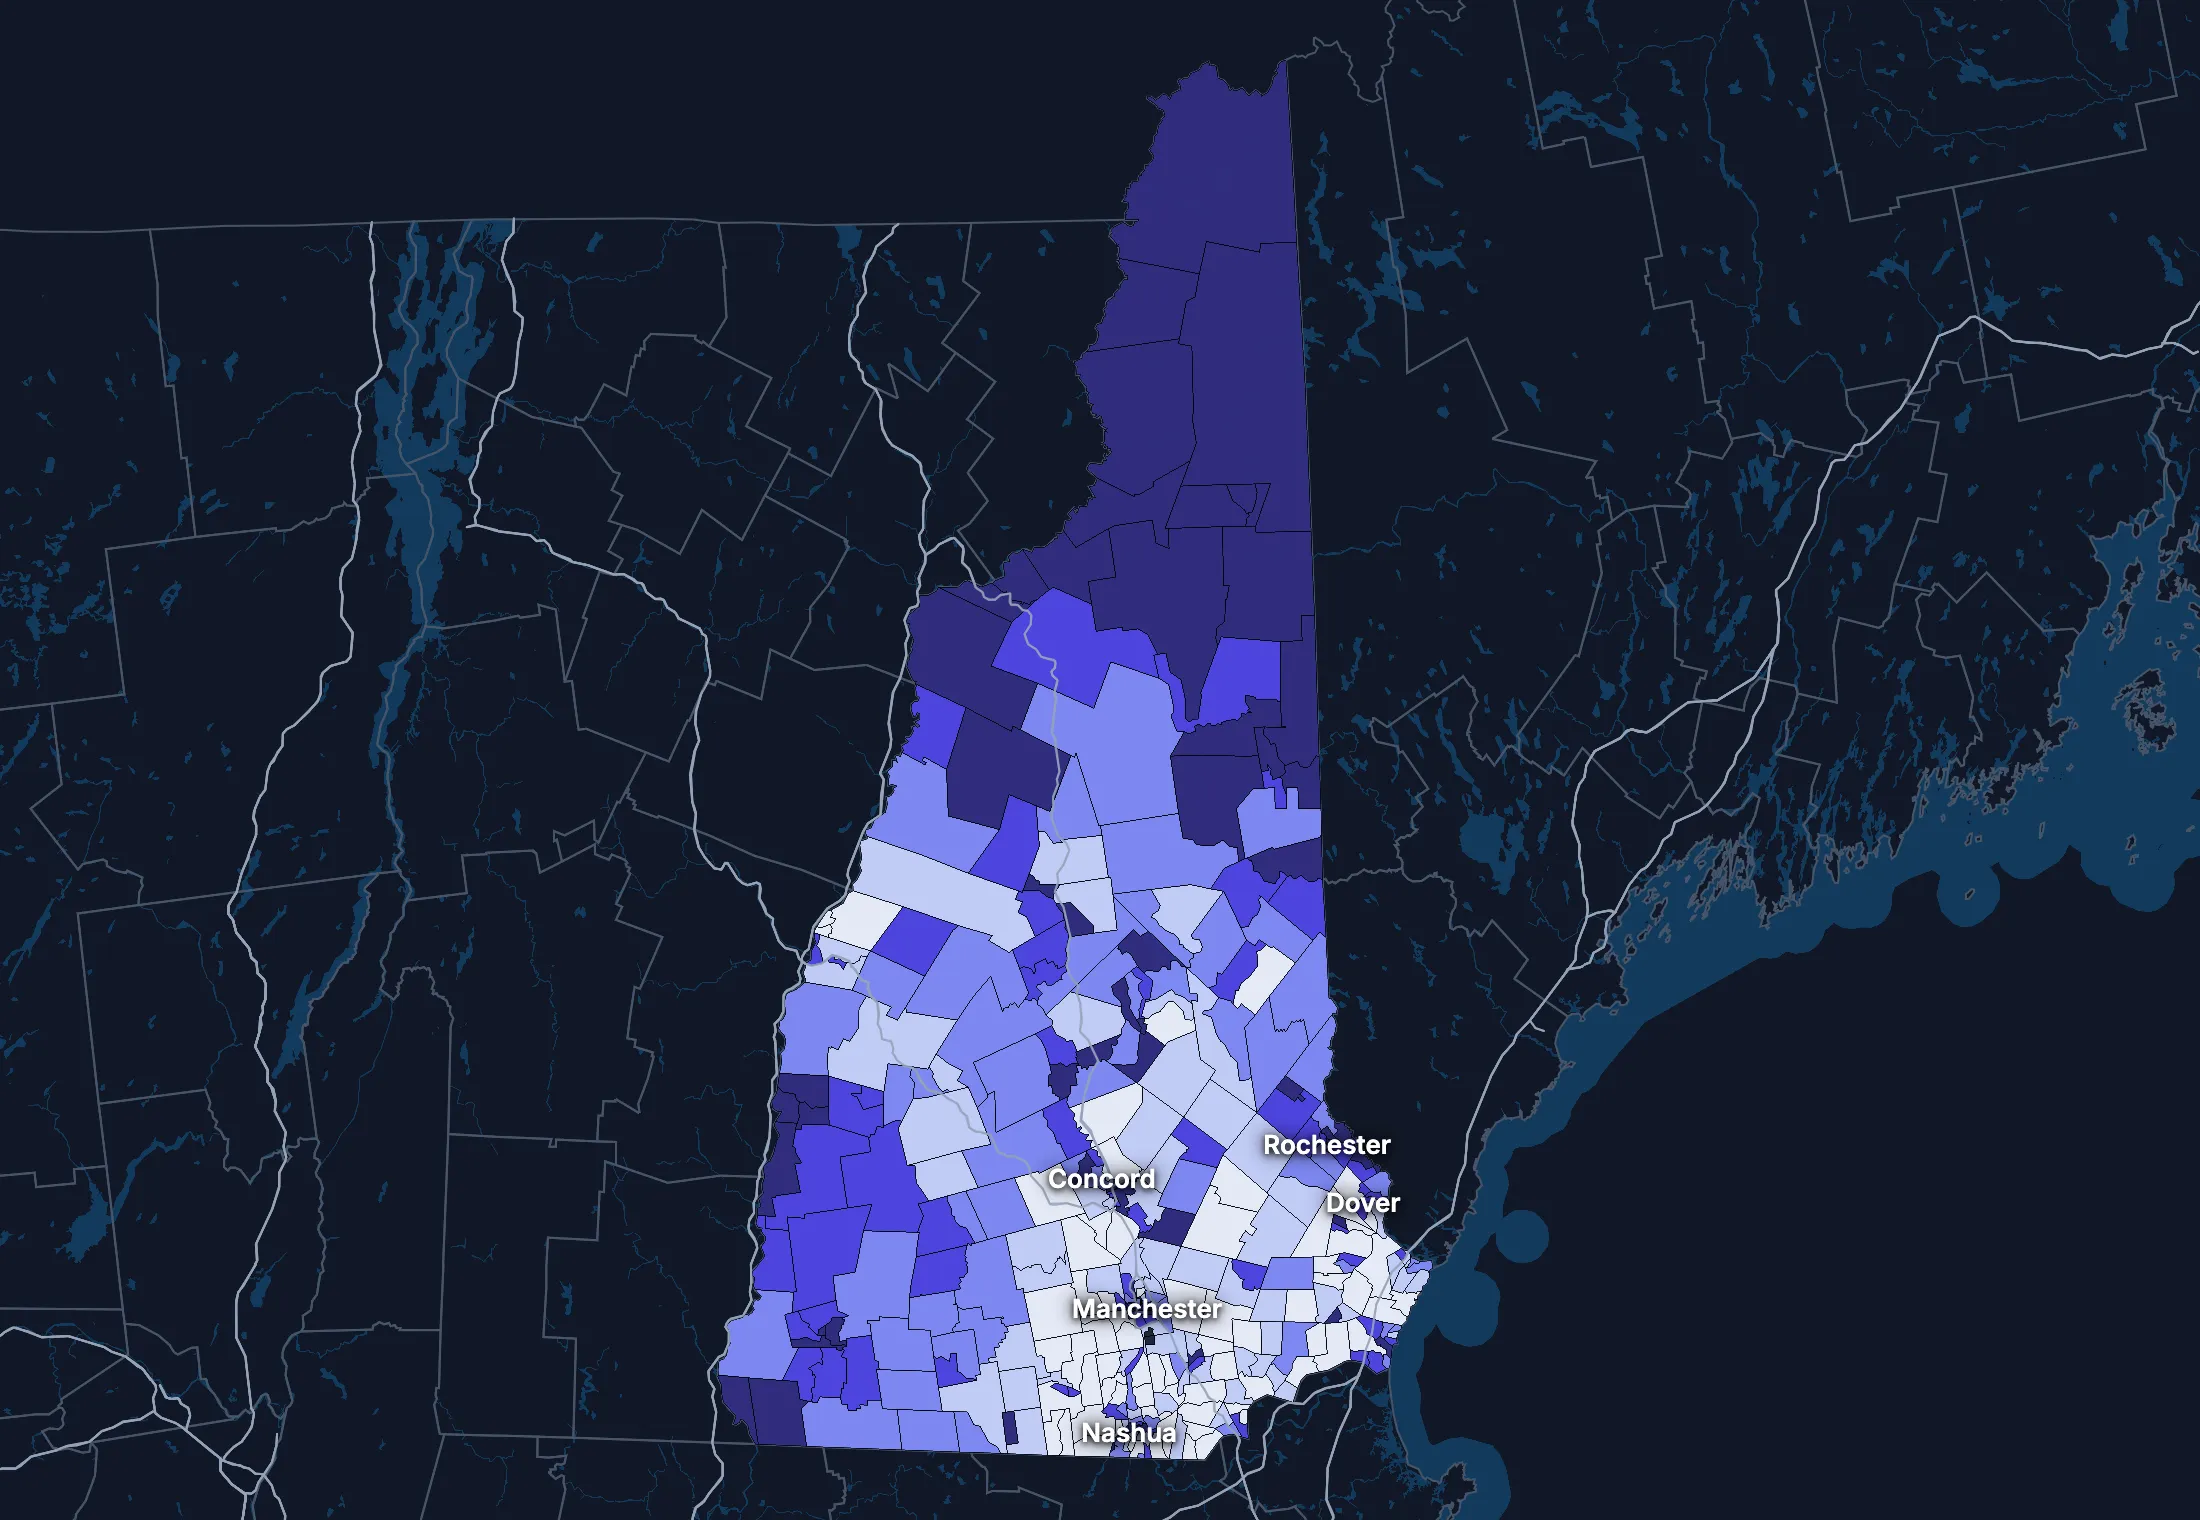
State averages hide a lot. These census tracts are the closest the census comes to neighborhoods.
Where the state’s average misleads
Each tick is one census tract, and the dark line marks the state. Hover over a tick or tap it to see the tract.
Poverty
61 of 347 tracts are at least 1.5 times the state’s overall 7.2%, and 43 are at two-thirds of it or less.
Highest: Tract 802.04, 44.3%. Lowest: Tract 410.01, 0.0%.
Renters paying 30% or more of income
22 of 328 tracts are at least 1.5 times the state’s overall 45.7%, and 66 are at two-thirds of it or less.
Highest: Tract 580, 92.1%. Lowest: Tract 9665.02, 0.0%.
Adults with a bachelor’s degree
32 of 347 tracts are at least 1.5 times the state’s overall 40.6%, and 67 are at two-thirds of it or less.
Highest: Tract 9616.03, 91.4%. Lowest: Tract 9506, 9.9%.
Median household income
38 of 347 tracts are at least 1.5 times the typical tract’s $97,941, and 36 are at two-thirds of it or less.
Highest: Tract 29.03, $207,183. Lowest: Tract 9506, $29,625.
American Community Survey 2020–2024 5-year estimates, by census tract. Income is capped at $250,000+ by the Census Bureau.
People
Who lives in New Hampshire
Its median age of 44.2 is higher than the US (39.5). 7.3% of residents were born outside the US, and 8.4% speak a language other than English at home.
Age
Source: ACS 2025 1-year, table A01001.
Show data
| New Hampshire | United States | |
|---|---|---|
| Under 18 | 17.3% ±0.4% , number 244,585 ±6,031 | 21.0% ±<0.1% , number 71,689,151 ±111,800 |
| 18 to 24 | 8.5% ±0.4% , number 120,561 ±5,437 | 9.3% ±<0.1% , number 31,716,680 ±98,660 |
| 25 to 34 | 12.3% ±0.2% , number 173,641 ±3,433 | 13.6% ±<0.1% , number 46,357,354 ±55,690 |
| 35 to 44 | 12.9% ±0.5% , number 182,390 ±6,695 | 13.4% ±<0.1% , number 45,746,189 ±105,700 |
| 45 to 54 | 11.4% ±0.2% , number 162,045 ±3,104 | 11.8% ±<0.1% , number 40,257,563 ±53,540 |
| 55 to 64 | 14.5% ±0.5% , number 205,922 ±7,076 | 12.1% ±<0.1% , number 41,242,904 ±104,700 |
| 65 to 74 | 13.5% ±0.4% , number 191,756 ±6,102 | 10.8% ±<0.1% , number 36,895,650 ±91,520 |
| 75 and over | 9.5% ±0.3% , number 134,442 ±4,544 | 8.2% ±<0.1% , number 27,879,368 ±78,140 |
Embed
Race and ethnicity
Source: ACS 2025 1-year, table A04001.
Show data
| New Hampshire | United States | |
|---|---|---|
| White, not Hispanic | 85.1% ±0.3% , number 1,204,746 ±4,566 | 55.0% ±<0.1% , number 187,959,031 ±58,340 |
| Hispanic or Latino | 5.3% ±0.1% , number 74,785 ±865 | 20.5% ±<0.1% , number 69,975,516 ±13,270 |
| Black, not Hispanic | 1.4% ±0.2% , number 19,827 ±2,917 | 11.7% ±<0.1% , number 40,096,453 ±106,200 |
| Asian, not Hispanic | 3.0% ±0.2% , number 41,846 ±2,888 | 6.5% ±<0.1% , number 22,096,709 ±58,340 |
| Other or multiracial | 5.2% ±0.5% , number 74,138 ±6,741 | 6.3% ±<0.1% , number 21,657,150 ±150,100 |
Embed
Language spoken at home
Source: ACS 2025 1-year, table C16001.
Show data
| New Hampshire | United States | |
|---|---|---|
| English only | 91.6% ±0.5% , number 1,240,044 ±7,376 | 77.1% ±0.1% , number 249,390,588 ±275,300 |
| Spanish | 2.6% ±0.3% , number 35,630 ±3,597 | 13.9% ±0.1% , number 44,921,985 ±177,800 |
| Other Indo-European | 3.5% ±0.4% , number 47,803 ±5,671 | 4.0% ±<0.1% , number 12,862,980 ±113,500 |
| Asian and Pacific Island | 1.4% ±0.3% , number 19,263 ±3,851 | 3.8% ±<0.1% , number 12,288,841 ±99,740 |
| Arabic and other | 0.8% ±0.3% , number 10,487 ±3,428 | 1.3% ±<0.1% , number 4,116,949 ±71,480 |
Embed
Marital status
Source: ACS 2025 1-year, table A11001.
Show data
| New Hampshire | United States | |
|---|---|---|
| Now married | 51.4% ±0.9% , number 626,371 ±11,230 | 47.9% ±0.1% , number 135,567,564 ±223,300 |
| Never married | 30.2% ±0.7% , number 367,820 ±8,380 | 34.8% ±0.1% , number 98,647,238 ±152,600 |
| Divorced | 11.6% ±0.6% , number 141,482 ±6,731 | 10.2% ±<0.1% , number 28,879,967 ±112,900 |
| Widowed | 5.7% ±0.3% , number 68,940 ±4,241 | 5.5% ±<0.1% , number 15,599,094 ±69,430 |
| Separated | 1.1% ±0.2% , number 13,505 ±2,754 | 1.6% ±<0.1% , number 4,441,399 ±49,160 |
Embed
Where people lived a year ago
Source: ACS 2025 1-year, table A08001.
Show data
| New Hampshire | United States | |
|---|---|---|
| Same home | 90.9% ±0.6% , number 1,274,772 ±8,628 | 88.4% ±0.1% , number 298,889,697 ±214,800 |
| Same county | 3.4% ±0.4% , number 47,385 ±5,347 | 6.0% ±<0.1% , number 20,202,671 ±166,300 |
| Another county in the state | 2.6% ±0.4% , number 35,932 ±5,021 | 3.0% ±<0.1% , number 10,168,097 ±89,190 |
| Another state | 2.8% ±0.3% , number 38,897 ±4,410 | 2.1% ±<0.1% , number 7,025,589 ±81,660 |
| Another country | 0.4% ±0.2% , number 5,847 ±2,573 | 0.6% ±<0.1% , number 1,984,943 ±47,210 |
Embed
Top countries of birth, among those born abroad
Source: ACS 2020–2024 5-year, table A07001.
Show data
| New Hampshire | |
|---|---|
| India | 8.9% , number 7,656 |
| Canada | 8.5% , number 7,305 |
| Dominican Republic | 7.1% , number 6,096 |
| China, Excluding Hong Kong and Taiwan | 4.2% , number 3,571 |
| Brazil | 3.7% , number 3,128 |
| Philippines | 3.5% , number 3,005 |
Embed
All the numbers
| Indicator | New Hampshire | US | Rank among states* | Table |
|---|---|---|---|---|
| Population | 1,415,342 | 341,784,859 | 41st | A00001 |
| People per square mile | 158 | 97 | 22nd | A00002 |
| Land area (square miles) | 8,954 | – | – | A00002 |
| Median age | 44.2 ±0.3 | 39.5 ±0.1 | 2nd | A01004 |
| Under 18 | 17.3% ±0.4% , number 244,585 ±6,031 | 21.0% ±<0.1% , number 71,689,151 ±111,800 | 49th | B02002 |
| 65 and over | 23.0% ±0.5% , number 326,198 ±7,608 | 19.0% ±<0.1% , number 64,775,018 ±120,300 | 7th | B02002 |
| Born outside the US | 7.3% ±0.4% , number 103,494 ±6,234 | 14.7% ±0.1% , number 50,409,320 ±204,800 | 32nd | A06001 |
| Speak a language other than English at home | 8.4% ±0.5% , number 113,183 ±8,466 | 22.9% ±0.1% , number 74,190,755 ±244,000 | 40th | C16001 |
| Veterans (adults) | 7.0% ±0.4% , number 82,036 ±4,577 | 5.9% ±<0.1% , number 15,746,228 ±85,320 | 16th | A16002 |
| Living with a disability | 13.5% ±0.5% , number 188,625 ±7,275 | 13.7% ±<0.1% , number 46,271,455 ±126,000 | 31st | B18101 |
| Women 15–50 who had a baby in the past year | 5.2% ±0.8% , number 15,820 ±2,277 | 5.0% ±0.1% , number 4,016,759 ±44,040 | 45th | B13002 |
| Lived in the same home a year ago | 90.9% ±0.6% , number 1,274,772 ±8,628 | 88.4% ±0.1% , number 298,889,697 ±214,800 | 6th | A08001 |
| White, not Hispanic | 85.1% ±0.3% , number 1,204,746 ±4,566 | 55.0% ±<0.1% , number 187,959,031 ±58,340 | 4th | A04001 |
| Hispanic or Latino | 5.3% ±0.1% , number 74,785 ±865 | 20.5% ±<0.1% , number 69,975,516 ±13,270 | 45th | A04001 |
| Black, not Hispanic | 1.4% ±0.2% , number 19,827 ±2,917 | 11.7% ±<0.1% , number 40,096,453 ±106,200 | 46th | A04001 |
| Asian, not Hispanic | 3.0% ±0.2% , number 41,846 ±2,888 | 6.5% ±<0.1% , number 22,096,709 ±58,340 | 29th | A04001 |
*1 is the highest. Population is ranked among all states, and the rest among those of 1,000 people or more, whose figures can be ranked. Ranks use 5-year estimates, the only ones covering every state, so they can differ slightly from the figures here.
Income and work
Higher incomes than the US
The median household income is $106,759, higher than the US ($84,780). 6.2% of people live in poverty, and 5.3% have no health insurance, lower than the US (8.4%).
Household income
Source: ACS 2025 1-year, table A14001.
Show data
| New Hampshire | United States | |
|---|---|---|
| Under $25,000 | 9.9% ±0.8% , number 56,736 ±4,733 | 14.0% ±0.1% , number 18,727,548 ±88,990 |
| $25,000 to $49,999 | 11.5% ±0.8% , number 66,141 ±4,632 | 15.4% ±0.1% , number 20,665,585 ±101,400 |
| $50,000 to $74,999 | 13.2% ±0.8% , number 75,707 ±4,446 | 15.3% ±0.1% , number 20,513,565 ±88,500 |
| $75,000 to $99,999 | 12.2% ±0.9% , number 69,875 ±5,047 | 12.5% ±0.1% , number 16,814,245 ±87,520 |
| $100,000 to $149,999 | 19.9% ±1.2% , number 114,431 ±6,756 | 17.9% ±0.1% , number 24,018,984 ±99,670 |
| $150,000 to $199,999 | 13.2% ±0.8% , number 75,985 ±4,729 | 10.1% ±0.1% , number 13,521,827 ±70,660 |
| $200,000 or more | 20.1% ±0.8% , number 115,214 ±4,953 | 14.8% ±0.1% , number 19,801,668 ±84,120 |
Embed
What residents do for work
Source: ACS 2025 1-year, table A17004.
Show data
| New Hampshire | United States | |
|---|---|---|
| Education and health care | 24.4% ±0.9% , number 186,986 ±7,574 | 24.4% ±0.1% , number 40,862,193 ±140,800 |
| Manufacturing | 12.8% ±0.8% , number 98,227 ±6,262 | 9.6% ±0.1% , number 16,064,394 ±91,270 |
| Professional and business services | 12.6% ±0.7% , number 96,746 ±5,200 | 12.8% ±0.1% , number 21,375,231 ±87,110 |
| Retail trade | 10.9% ±0.7% , number 83,750 ±5,322 | 10.6% ±0.1% , number 17,781,181 ±96,660 |
| Construction | 7.9% ±0.6% , number 60,437 ±4,944 | 6.7% ±<0.1% , number 11,254,981 ±79,620 |
| Arts, food and lodging | 7.8% ±0.5% , number 60,148 ±4,200 | 8.9% ±0.1% , number 14,811,502 ±87,840 |
| Finance, insurance and real estate | 6.8% ±0.6% , number 52,472 ±4,389 | 6.6% ±<0.1% , number 11,025,569 ±68,570 |
| Other services | 5.2% ±0.6% , number 40,005 ±4,840 | 4.8% ±<0.1% , number 7,958,726 ±65,120 |
Embed
Where workers come from and go
New Hampshire has 679,505 jobs and 718,561 employed residents. 91,887 people commute in to work and 130,943 commute out, while 587,618 both live and work here. The most commuters come from Massachusetts.
Most commuters come from
- Massachusetts: 45,903
- Maine: 20,571
- Vermont: 17,342
Most residents commute to
- Massachusetts: 99,667
- Vermont: 11,314
- Maine: 10,746
Show data
| New Hampshire | |
|---|---|
| Live and work here | 587,618 |
| Work here, live elsewhere | 91,887 |
| Live here, work elsewhere | 130,943 |
Embed
All the numbers
| Indicator | New Hampshire | US | Rank among states* | Table |
|---|---|---|---|---|
| Median household income | $106,759 ±$2,502 | $84,780 ±$215 | 7th | A14006 |
| Income per person | $56,994 ±$1,119 | $47,171 ±$115 | 7th | A14024 |
| Income inequality (Gini index) | 0.442 ±0.008 | 0.482 ±0.001 | 47th | A14028 |
| Living in poverty | 6.2% ±0.6% , number 84,687 ±7,755 | 11.8% ±0.1% , number 39,264,183 ±277,400 | 51st | A13004 |
| Unemployment rate | 2.6% ±0.4% , number 20,443 ±2,914 | 4.9% ±<0.1% , number 8,574,594 ±64,350 | 47th | A17005 |
| No health insurance | 5.3% ±0.4% , number 74,677 ±6,289 | 8.4% ±<0.1% , number 28,323,306 ±152,000 | 41st | A20001 |
*1 is the highest. Population is ranked among all states, and the rest among those of 1,000 people or more, whose figures can be ranked. Ranks use 5-year estimates, the only ones covering every state, so they can differ slightly from the figures here.
Education
More college degrees than the US
41.5% of adults 25 and over have a bachelor’s degree or more, higher than the US (37.4%).
Highest level of education
Source: ACS 2025 1-year, table A12001.
Show data
| New Hampshire | United States | |
|---|---|---|
| Less than high school | 5.1% ±0.4% , number 53,041 ±4,560 | 9.4% ±0.1% , number 22,321,002 ±120,500 |
| High school only | 26.8% ±0.8% , number 281,255 ±8,751 | 25.6% ±0.1% , number 61,096,726 ±203,400 |
| Some college | 26.6% ±0.9% , number 279,578 ±9,353 | 27.7% ±0.1% , number 65,920,977 ±173,500 |
| Bachelor’s degree | 24.0% ±0.7% , number 251,646 ±7,829 | 22.3% ±0.1% , number 53,224,312 ±196,700 |
| Graduate degree | 17.6% ±0.8% , number 184,676 ±7,916 | 15.0% ±0.1% , number 35,816,011 ±159,400 |
Embed
All the numbers
| Indicator | New Hampshire | US | Rank among states* | Table |
|---|---|---|---|---|
| Bachelor’s degree or more | 41.5% ±1.1% , number 436,322 ±11,130 | 37.4% ±0.1% , number 89,040,323 ±253,200 | 9th | A12001 |
| High school graduate or more | 94.9% ±1.6% , number 997,155 ±16,970 | 90.6% ±0.2% , number 216,058,026 ±368,200 | 4th | A12001 |
*1 is the highest. Population is ranked among all states, and the rest among those of 1,000 people or more, whose figures can be ranked. Ranks use 5-year estimates, the only ones covering every state, so they can differ slightly from the figures here.
Housing
Home values outran incomes
28.1% of households rent, lower than the US (34.7%). The median home is worth $487,100 and the median rent is $1,742. After inflation, home values rose 45% from 2015 to 2025, while household income rose 11%.
Housing costs and income, 2015 to 2025, after inflation
Source: ACS 1-year, table A10036, A18009, A14006.
Show data
| New Hampshire | United States | |
|---|---|---|
| Median home value | +45.4% | +39.3% |
| Median rent | +25.1% | +18.5% |
| Median household income | +10.8% | +10.9% |
Embed
Types of homes
Source: ACS 2025 1-year, table A10032.
Show data
| New Hampshire | United States | |
|---|---|---|
| Single-family, detached | 61.9% ±1.1% , number 409,710 ±6,963 | 60.9% ±0.1% , number 90,335,844 ±173,300 |
| Single-family, attached | 5.9% ±0.5% , number 39,048 ±3,344 | 6.4% ±<0.1% , number 9,527,703 ±51,230 |
| 2 to 4 units | 10.9% ±0.7% , number 72,093 ±4,829 | 7.5% ±0.1% , number 11,109,005 ±75,790 |
| 5 to 19 units | 7.7% ±0.8% , number 51,227 ±5,236 | 8.7% ±0.1% , number 12,829,882 ±97,590 |
| 20 or more units | 7.8% ±0.7% , number 51,404 ±4,472 | 11.1% ±0.1% , number 16,381,450 ±92,310 |
| Mobile homes and other | 5.8% ±0.5% , number 38,660 ±3,539 | 5.4% ±<0.1% , number 8,045,083 ±53,680 |
Embed
When homes were built
Source: ACS 2025 1-year, table A10055.
Show data
| New Hampshire | United States | |
|---|---|---|
| 2010 or later | 10.0% ±0.7% , number 57,647 ±4,292 | 15.1% ±0.1% , number 20,257,912 ±101,300 |
| 2000 to 2009 | 12.7% ±0.8% , number 73,007 ±4,920 | 13.8% ±0.1% , number 18,535,840 ±92,260 |
| 1980 to 1999 | 29.0% ±1.3% , number 166,374 ±7,599 | 24.1% ±0.1% , number 32,332,570 ±118,900 |
| 1960 to 1979 | 21.8% ±1.1% , number 124,986 ±6,613 | 22.9% ±0.1% , number 30,726,302 ±110,000 |
| Before 1960 | 26.5% ±1.2% , number 152,075 ±6,920 | 24.0% ±0.1% , number 32,210,798 ±121,500 |
Embed
All the numbers
| Indicator | New Hampshire | US | Rank among states* | Table |
|---|---|---|---|---|
| Housing units | 662,142 | – | – | A10001 |
| Households | 574,089 ±5,217 | – | – | A10008 |
| People per household | 2.39 ±0.02 | 2.49 ±0.01 | 27th | A10003 |
| Households that rent | 28.1% ±1.2% , number 161,116 ±6,908 | 34.7% ±0.1% , number 46,551,688 ±193,200 | 46th | A10060 |
| Vacant homes | 13.3% ±0.8% , number 88,053 ±5,240 | 9.6% ±0.1% , number 14,165,545 ±137,100 | 9th | A10047, A10060 |
| Median gross rent | $1,742 ±$39 | $1,557 ±$4 | 16th | A18009 |
| Median home value | $487,100 ±$8,193 | $371,100 ±$646 | 15th | A10036 |
| Renters paying 30% or more of income | 46.2% ±3.0% , number 74,391 ±5,732 | 48.3% ±0.2% , number 22,486,693 ±122,100 | 20th | A18002 |
| Owners paying 30% or more of income | 23.6% ±1.3% , number 97,277 ±5,695 | 24.2% ±0.1% , number 21,201,943 ±93,050 | 12th | A10040 |
| Homes built before 1960 | 26.5% ±1.2% , number 152,075 ±6,920 | 24.0% ±0.1% , number 32,210,798 ±121,500 | 20th | A10055 |
*1 is the highest. Population is ranked among all states, and the rest among those of 1,000 people or more, whose figures can be ranked. Ranks use 5-year estimates, the only ones covering every state, so they can differ slightly from the figures here.
Getting around
A driving state
74.1% of workers drive alone and 14.4% work from home. 38.6% of those who travel to work spend 30 minutes or more getting there, and 5.3% of households have no vehicle.
How people get to work
Source: ACS 2025 1-year, table A09005.
Show data
| New Hampshire | United States | |
|---|---|---|
| Drive alone | 74.1% ±1.1% , number 561,324 ±10,170 | 69.8% ±0.1% , number 115,297,377 ±192,900 |
| Carpool | 7.2% ±0.7% , number 54,506 ±5,318 | 8.9% ±0.1% , number 14,712,170 ±97,240 |
| Public transit | 0.6% ±0.2% , number 4,908 ±1,342 | 4.3% ±<0.1% , number 7,100,386 ±63,330 |
| Walk | 2.4% ±0.3% , number 18,178 ±2,084 | 2.4% ±<0.1% , number 4,016,469 ±41,070 |
| Work from home | 14.4% ±0.8% , number 109,153 ±6,070 | 12.9% ±0.1% , number 21,288,393 ±105,700 |
| Other | 1.2% ±0.2% , number 8,956 ±1,840 | 1.7% ±<0.1% , number 2,799,658 ±41,510 |
Embed
Time spent getting to work
Source: ACS 2025 1-year, table B09001.
Show data
| New Hampshire | United States | |
|---|---|---|
| Under 10 minutes | 14.0% ±0.9% , number 90,485 ±6,247 | 12.0% ±0.1% , number 17,199,225 ±93,440 |
| 10 to 19 minutes | 27.7% ±1.2% , number 179,284 ±8,142 | 27.8% ±0.1% , number 40,059,540 ±137,700 |
| 20 to 29 minutes | 19.7% ±1.1% , number 127,924 ±7,226 | 21.0% ±0.1% , number 30,221,743 ±111,100 |
| 30 to 39 minutes | 16.7% ±0.9% , number 108,315 ±6,042 | 17.1% ±0.1% , number 24,659,138 ±103,800 |
| 40 to 59 minutes | 13.0% ±0.8% , number 84,445 ±5,480 | 12.6% ±0.1% , number 18,104,709 ±97,070 |
| 60 minutes or more | 8.9% ±0.7% , number 57,419 ±4,434 | 9.5% ±0.1% , number 13,681,705 ±84,440 |
Embed
Vehicles per household
Source: ACS 2025 1-year, table A10030.
Show data
| New Hampshire | United States | |
|---|---|---|
| None | 5.3% ±0.7% , number 30,556 ±3,968 | 8.8% ±0.1% , number 11,781,997 ±77,240 |
| One | 31.0% ±1.2% , number 177,921 ±7,260 | 33.1% ±0.1% , number 44,424,682 ±160,700 |
| Two | 38.9% ±1.1% , number 223,598 ±6,710 | 36.0% ±0.1% , number 48,200,889 ±176,800 |
| Three or more | 24.7% ±1.1% , number 142,014 ±6,322 | 22.1% ±0.1% , number 29,655,854 ±113,300 |
Embed
All the numbers
| Indicator | New Hampshire | US | Rank among states* | Table |
|---|---|---|---|---|
| Drive to work alone | 74.1% ±1.1% , number 561,324 ±10,170 | 69.8% ±0.1% , number 115,297,377 ±192,900 | 24th | A09005 |
| Take public transit | 0.6% ±0.2% , number 4,908 ±1,342 | 4.3% ±<0.1% , number 7,100,386 ±63,330 | 37th | A09005 |
| Work from home | 14.4% ±0.8% , number 109,153 ±6,070 | 12.9% ±0.1% , number 21,288,393 ±105,700 | 13th | A09005 |
| Commute 30 minutes or more | 38.6% ±1.3% , number 250,179 ±9,284 | 39.2% ±0.1% , number 56,445,552 ±165,300 | 14th | B09001 |
| Households with no vehicle | 5.3% ±0.6% , number 30,556 ±3,675 | 8.8% ±<0.1% , number 11,781,997 ±64,240 | 48th | A10030 |
*1 is the highest. Population is ranked among all states, and the rest among those of 1,000 people or more, whose figures can be ranked. Ranks use 5-year estimates, the only ones covering every state, so they can differ slightly from the figures here.
Places
The largest cities in New Hampshire
Population, from the latest estimates available. Figures cover the whole of each place.
Largest places
- Manchester: 116,821
- Nashua: 92,431
- Concord: 44,375
- Dover: 33,364
- Rochester: 33,144
- Keene: 22,939
- Portsmouth: 22,545
- Derry: 21,339
Every county and place in New Hampshire
Find any county, city, town, metro area, ZIP code, school district or district in New Hampshire.
Counties
Each of the 10 counties with its population, from ACS 2020–2024 5-year estimates.
- Belknap County64,659
- Carroll County51,804
- Cheshire County77,297
- Coos County31,271
- Grafton County92,120
- Hillsborough County426,378
- Merrimack County155,967
- Rockingham County319,082
- Strafford County132,575
- Sullivan County43,715
Cities, towns and other places
Each of the 100 with its population, from ACS 2020–2024 5-year estimates. Census-designated places are communities without a local government of their own, drawn by the Census Bureau so they can be counted.
- Alton281
- Amherst726
- Antrim1,265
- Ashland1,404
- Bartlett312
- Belmont1,378
- Bennington326
- Berlin9,383
- Bethlehem1,058
- Blodgett Landing100
- Bradford404
- Bristol2,098
- Canaan257
- Center Ossipee583
- Center Sandwich101
- Charlestown659
- Claremont13,078
- Colebrook1,268
- Concord44,375
- Contoocook1,376
- Conway3,879
- Derry21,339
- Dover33,364
- Durham10,681
- East Merrimack5,081
- Enfield1,994
- Epping2,796
- Exeter9,964
- Farmington3,924
- Francestown133
- Franklin8,799
- Goffstown3,490
- Gorham2,092
- Greenville865
- Groveton834
- Hampton10,101
- Hampton Beach2,605
- Hancock132
- Hanover8,479
- Henniker2,993
- Hillsborough1,616
- Hinsdale1,580
- Hooksett5,876
- Hudson7,469
- Jaffrey3,277
- Keene22,939
- Klondike Corner488
- Laconia17,085
- Lancaster2,230
- Lebanon14,999
- Lincoln923
- Lisbon730
- Littleton4,114
- Londonderry12,225
- Loudon614
- Manchester115,643
- Marlborough1,048
- Melvin Village324
- Meredith2,617
- Milford8,956
- Milton356
- Milton Mills72
- Mountain Lakes354
- Nashua91,294
- New Boston245
- New Hampton302
- New London1,278
- Newfields294
- Newmarket5,679
- Newport4,758
- North Conway2,041
- North Haverhill728
- North Walpole513
- North Woodstock447
- Peterborough2,539
- Pinardville4,418
- Pittsfield1,744
- Plainfield220
- Plymouth4,969
- Portsmouth22,545
- Raymond3,645
- Rochester33,144
- Sanbornville1,317
- Seabrook Beach1,001
- Somersworth12,111
- South Hooksett5,902
- Suissevale230
- Suncook5,432
- Tilton Northfield3,101
- Troy1,081
- Union131
- Walpole512
- Warner341
- West Stewartstown312
- West Swanzey1,188
- Whitefield1,512
- Wilton1,038
- Winchester1,306
- Wolfeboro2,531
- Woodsville1,422
Metro and micro areas
Each of the 6 that reach into New Hampshire, with its whole population, from ACS 2020–2024 5-year estimates. Metro and micro areas are counties tied together by commuting, drawn by the Office of Management and Budget.
ZIP codes
Each of the 245 with people in it, by the town it's centered in, from ACS 2020–2024 5-year estimates. These are the Census Bureau's ZIP Code Tabulation Areas, which follow the Postal Service's ZIP codes as closely as census blocks allow.
- 03031Amherst11,849
- 03032South Hooksett6,119
- 03033Milford5,736
- 03034South Hooksett4,352
- 03036Raymond5,300
- 03037Raymond4,714
- 03038Derry34,474
- 03042Epping7,430
- 03043Francestown1,398
- 03044Epping4,831
- 03045Goffstown14,080
- 03046Goffstown3,097
- 03047Francestown1,730
- 03048Greenville3,237
- 03049Nashua8,603
- 03051Hudson25,557
- 03052East Merrimack8,499
- 03053Londonderry26,327
- 03054East Merrimack28,176
- 03055Milford16,337
- 03057Klondike Corner2,709
- 03060Nashua31,657
- 03062Nashua29,441
- 03063Nashua15,805
- 03064Nashua14,391
- 03070New Boston6,177
- 03071Greenville5,310
- 03076Hudson14,449
- 03077Raymond10,900
- 03079Derry30,964
- 03082Wilton1,531
- 03084Greenville1,363
- 03086Wilton4,258
- 03087Londonderry16,038
- 03101Manchester3,201
- 03102Manchester33,959
- 03103Manchester37,775
- 03104Manchester35,237
- 03106Hooksett15,032
- 03109Manchester9,929
- 03110Pinardville23,746
- 03215Bartlett290
- 03216Franklin2,046
- 03217Ashland2,183
- 03218Pittsfield1,160
- 03220Belmont7,393
- 03221Bradford2,200
- 03222Bristol6,097
- 03223Plymouth3,441
- 03224Loudon2,392
- 03225Pittsfield3,834
- 03226Meredith1,005
- 03227Center Sandwich1,388
- 03229Contoocook6,046
- 03230Bristol1,451
- 03231Franklin89
- 03233New London156
- 03234Pittsfield4,939
- 03235Franklin8,903
- 03237Belmont2,575
- 0323864
- 03240Canaan1,354
- 03241Plymouth1,150
- 03242Henniker6,197
- 03243Bristol952
- 03244Hillsborough8,156
- 03245Ashland1,917
- 03246Laconia17,103
- 03249Laconia7,830
- 03251Lincoln1,461
- 03253Meredith6,707
- 03254Suissevale5,172
- 03255Bradford2,015
- 03256New Hampton2,497
- 03257New London4,484
- 03258Loudon2,721
- 03259Center Sandwich252
- 03260New London976
- 03261Pittsfield4,688
- 03262North Woodstock1,142
- 03263Pittsfield4,105
- 03264Plymouth6,885
- 032662,130
- 03268Franklin1,468
- 03269Tilton Northfield3,066
- 03273Bradford361
- 03275Suncook12,205
- 03276Tilton Northfield9,015
- 03278Warner3,079
- 03279878
- 03280Bradford1,224
- 03281Goffstown9,170
- 032821,052
- 03284New London890
- 03285North Woodstock2,799
- 03287New London1,487
- 03290Epping5,357
- 03293North Woodstock72
- 03301Concord33,995
- 03303Contoocook16,571
- 03304Suncook8,335
- 03307Loudon5,724
- 03431Keene25,065
- 03440Antrim2,661
- 03441Hinsdale593
- 03442Bennington1,588
- 03443Hinsdale581
- 03444Peterborough1,666
- 03445Keene687
- 03446West Swanzey6,588
- 03447Troy2,278
- 03448Keene716
- 03449Hancock1,838
- 03450Hancock885
- 03451Hinsdale3,997
- 03452Jaffrey5,448
- 03455Marlborough2,242
- 03456855
- 03457Hancock802
- 03458Peterborough6,872
- 03461Jaffrey6,497
- 03462West Swanzey1,726
- 03464Antrim902
- 03465Troy2,005
- 03466Hinsdale1,315
- 03467Keene2,237
- 03470Winchester4,933
- 03561Littleton6,040
- 03570Berlin9,383
- 03574Bethlehem2,573
- 0357511
- 03576Colebrook2,764
- 03579431
- 03580Lincoln1,402
- 03581Gorham3,246
- 03582Groveton1,949
- 03583Whitefield1,013
- 03584Lancaster3,501
- 03585Lisbon2,456
- 03586Lisbon658
- 03588Berlin1,633
- 03590Groveton1,297
- 035921,054
- 03593Gorham465
- 03595Whitefield648
- 03597527
- 03598Whitefield3,396
- 03601Charlestown382
- 03602North Walpole2,381
- 03603Charlestown5,238
- 03605Newport907
- 03607Charlestown368
- 03608Walpole3,167
- 03609North Walpole523
- 03740Woodsville1,097
- 03741Canaan4,131
- 03743Claremont13,704
- 03745Plainfield1,816
- 03748Enfield4,563
- 03750Hanover1,116
- 03751Blodgett Landing397
- 03752Bradford1,042
- 03753Enfield3,509
- 03755Enfield10,569
- 03765North Haverhill513
- 03766Lebanon11,195
- 037681,710
- 03770Plainfield604
- 03771Lisbon786
- 03773Newport7,681
- 03774North Haverhill1,420
- 037771,295
- 03779North Haverhill868
- 03780North Haverhill1,071
- 03781Plainfield1,918
- 03782Blodgett Landing3,122
- 03784Lebanon3,804
- 03785North Woodstock2,018
- 03801Portsmouth23,484
- 03809Alton3,680
- 03810Alton2,314
- 03811Derry7,267
- 03812Bartlett1,116
- 03813North Conway4,273
- 03814Center Ossipee2,324
- 03816Melvin Village1,538
- 03817Conway1,066
- 03818Bartlett3,805
- 03819Epping4,471
- 03820Dover33,440
- 03823Durham2,203
- 03824Durham15,080
- 03825Rochester9,489
- 03826Derry2,654
- 03827Exeter3,279
- 03830Sanbornville1,381
- 03832Conway501
- 03833Exeter22,817
- 03835Farmington6,804
- 03836Center Ossipee1,494
- 03837Alton1,451
- 03838Bartlett983
- 03839Rochester4,279
- 03840Portsmouth4,106
- 03841Derry6,508
- 03842Hampton16,324
- 03844Hampton2,370
- 03845North Conway1,173
- 03846897
- 03847North Conway87
- 03848Exeter6,275
- 03849Conway1,465
- 03850Melvin Village324
- 03851Milton4,333
- 03852Milton Mills205
- 03853Melvin Village656
- 03854Portsmouth827
- 03855Alton2,748
- 03856Newfields2,023
- 03857Newmarket9,463
- 03858Exeter4,836
- 03860North Conway3,693
- 03861Durham4,576
- 03862Hampton4,610
- 03864Center Ossipee2,131
- 038657,861
- 03867Rochester22,732
- 03868Rochester6,133
- 03869Dover2,456
- 03870Portsmouth5,188
- 03871Hampton356
- 03872Sanbornville4,438
- 03873Derry6,628
- 03874Seabrook Beach8,487
- 03875Conway1,005
- 03878Somersworth12,205
- 03882Center Ossipee1,912
- 03883Center Sandwich233
- 03884Pittsfield4,306
- 03885Newfields7,754
- 03886Center Sandwich1,618
- 03887Union1,739
- 03890Center Ossipee164
- 03894Wolfeboro6,554
- 03897Center Sandwich8
Towns and townships
Each of the 221 with people in it, from ACS 2020–2024 5-year estimates: the county subdivisions that are governments of their own. A city, borough or village that is one too is listed with the places above.
- Acworth town851
- Albany town790
- Alexandria town1,983
- Allenstown town4,743
- Alstead town1,551
- Alton town5,994
- Amherst town11,861
- Andover town2,135
- Antrim town2,692
- Ashland town2,183
- Atkinson town7,267
- Auburn town6,119
- Barnstead town4,994
- Barrington town9,489
- Bartlett town3,281
- Bath town1,097
- Bedford town23,746
- Belmont town7,392
- Bennington town1,588
- Benton town386
- Bethlehem town2,537
- Boscawen town4,044
- Bow town8,335
- Bradford town1,565
- Brentwood town4,641
- Bridgewater town1,169
- Bristol town3,273
- Brookfield town567
- Brookline town5,736
- Campton town3,407
- Canaan town3,811
- Candia town4,134
- Canterbury town2,353
- Carroll town659
- Center Harbor town955
- Charlestown town4,889
- Chatham town430
- Chester town5,300
- Chesterfield town3,622
- Chichester town2,745
- Clarksville town371
- Colebrook town1,988
- Columbia town683
- Conway town10,141
- Cornish town1,816
- Croydon town798
- Dalton town916
- Danbury town1,451
- Danville town4,531
- Deerfield town4,932
- Deering town1,938
- Derry town34,116
- Dorchester town410
- Dublin town1,688
- Dummer town299
- Dunbarton town3,097
- Durham town15,080
- East Kingston town2,311
- Easton town356
- Eaton town501
- Effingham town1,912
- Ellsworth town51
- Enfield town4,475
- Epping town7,430
- Epsom town4,939
- Errol town314
- Exeter town16,151
- Farmington town6,795
- Fitzwilliam town2,278
- Francestown town1,398
- Franconia town1,060
- Freedom town1,494
- Fremont town4,831
- Gilford town7,830
- Gilmanton town4,026
- Gilsum town716
- Goffstown town18,513
- Gorham town2,682
- Goshen town1,042
- Grafton town1,354
- Grantham town3,465
- Greenfield town1,730
- Greenland town4,106
- Greenville town2,084
- Groton town507
- Hampstead town9,102
- Hampton Falls town2,328
- Hampton town16,426
- Hancock town1,791
- Hanover town11,685
- Harrisville town885
- Hart's Location town49
- Haverhill town4,611
- Hebron town883
- Henniker town6,197
- Hill town908
- Hillsborough town5,980
- Hinsdale town3,997
- Holderness town1,917
- Hollis town8,603
- Hooksett town15,057
- Hopkinton town6,037
- Hudson town25,557
- Jackson town897
- Jaffrey town5,448
- Jefferson town1,013
- Kensington town2,009
- Kingston town6,275
- Lancaster town3,216
- Landaff town420
- Langdon town805
- Lee town4,576
- Lempster town953
- Lincoln town1,461
- Lisbon town1,583
- Litchfield town8,499
- Littleton town6,040
- Londonderry town26,685
- Loudon town5,692
- Lyman town464
- Lyme town1,710
- Lyndeborough town1,616
- Madbury town2,203
- Madison town2,680
- Marlborough town2,207
- Marlow town855
- Mason town1,451
- Meredith town6,758
- Merrimack town28,164
- Middleton town1,595
- Milan town1,334
- Milford town16,337
- Milton town4,538
- Monroe town786
- Mont Vernon town2,636
- Moultonborough town5,126
- Nelson town648
- New Boston town6,165
- New Castle town827
- New Durham town2,748
- New Hampton town2,509
- New Ipswich town5,310
- New London town4,433
- Newbury town2,027
- Newfields town2,023
- Newington town939
- Newmarket town9,463
- Newport town6,375
- Newton town4,836
- North Hampton town4,543
- Northfield town4,971
- Northumberland town1,815
- Northwood town4,688
- Nottingham town5,357
- Orange town320
- Orford town1,295
- Ossipee town4,521
- Pelham town14,449
- Pembroke town7,438
- Peterborough town6,408
- Piermont town868
- Pittsburg town683
- Pittsfield town4,105
- Plainfield town2,522
- Plaistow town7,861
- Plymouth town6,601
- Randolph town420
- Raymond town10,900
- Richmond town1,314
- Rindge town6,497
- Rollinsford town2,626
- Roxbury town299
- Rumney town1,458
- Rye town5,611
- Salem town30,964
- Salisbury town1,609
- Sanbornton town3,053
- Sandown town6,628
- Sandwich town1,757
- Seabrook town8,427
- Sharon town442
- Shelburne town530
- South Hampton town984
- Springfield town1,122
- Stark town419
- Stewartstown town960
- Stoddard town1,072
- Strafford town4,306
- Stratford town950
- Stratham town7,754
- Sugar Hill town658
- Sullivan town687
- Sunapee town3,416
- Surry town1,052
- Sutton town2,239
- Swanzey town7,398
- Tamworth town2,884
- Temple town1,363
- Thornton town2,799
- Tilton town4,063
- Troy town2,005
- Tuftonboro town2,569
- Unity town1,375
- Wakefield town5,405
- Walpole town3,690
- Warner town2,959
- Warren town942
- Washington town1,208
- Waterville Valley town290
- Weare town9,170
- Webster town2,227
- Wentworth town1,057
- Westmoreland town2,237
- Whitefield town2,516
- Wilmot town1,487
- Wilton town3,960
- Winchester town4,212
- Windham town16,038
- Windsor town254
- Wolfeboro town6,571
- Woodstock town1,214
School districts
Each of the 179 with people in it, from ACS 2020–2024 5-year estimates. Elementary districts teach the lower grades and secondary districts the upper ones, under them; the rest are unified, teaching every grade.
- Albany School District790
- Allenstown School Districtelementary4,743
- Alton School Districtelementary5,994
- Amherst School Districtelementary11,861
- Andover School Districtelementary2,135
- Ashland School Districtelementary2,183
- Auburn School Districtelementary6,119
- Barnstead School Districtelementary4,994
- Barrington School Districtelementary9,489
- Bartlett School Districtelementary3,281
- Bath School Districtelementary1,097
- Bedford School District23,746
- Benton School District386
- Berlin School District9,383
- Bethlehem School Districtelementary2,537
- Bow School District8,335
- Brentwood School Districtelementary4,641
- Brookline School Districtelementary5,736
- Campton School Districtelementary3,407
- Candia School Districtelementary4,134
- Chatham School District430
- Chester School Districtelementary5,300
- Chesterfield School Districtelementary3,622
- Chichester School Districtelementary2,745
- Claremont School District13,078
- Clarksville School District371
- Colebrook School District1,988
- Columbia School District683
- Concord School District38,404
- Contoocook Valley School District19,100
- Conway School District10,141
- Coos County School District49
- Cornish School Districtelementary1,816
- Croydon School Districtelementary798
- Deerfield School Districtelementary4,932
- Derry School Districtelementary34,116
- Dover School District33,364
- Dresden School Districtsecondary11,685
- Dummer School District299
- Dunbarton School Districtelementary3,097
- East Kingston School Districtelementary2,311
- Eaton School District501
- Ellsworth School District51
- Epping School District7,430
- Epsom School Districtelementary4,939
- Errol School Districtelementary314
- Exeter Regional Cooperative School Districtsecondary34,889
- Exeter School Districtelementary16,151
- Fall Mountain Regional School District11,786
- Farmington School District6,795
- Franklin School District8,799
- Freedom School Districtelementary1,494
- Fremont School Districtelementary4,831
- Gilford School District7,830
- Gilmanton School Districtelementary4,026
- Goffstown School District18,513
- Gorham Randolph Shelburne Cooperative School District3,632
- Goshen School District1,042
- Governor Wentworth Regional School District18,888
- Grantham School Districtelementary3,465
- Greenland School Districtelementary4,106
- Hale's Location School District229
- Hampstead School Districtelementary9,102
- Hampton Falls School Districtelementary2,328
- Hampton School Districtelementary16,426
- Hanover School Districtelementary11,685
- Harrisville School Districtelementary885
- Hart's Location School District49
- Haverhill Cooperative School District4,611
- Henniker School Districtelementary6,197
- Hill School Districtelementary908
- Hillsboro-Deering Cooperative School District7,918
- Hinsdale School District3,997
- Holderness School Districtelementary1,917
- Hollis School Districtelementary8,603
- Hollis-Brookline Cooperative School Districtsecondary14,339
- Hooksett School Districtelementary15,057
- Hopkinton School District6,037
- Hudson School District25,557
- Inter-Lakes School District9,470
- Jackson School Districtelementary897
- Jaffrey-Rindge Cooperative School District11,945
- John Stark Regional School Districtsecondary15,367
- Kearsarge Regional School District15,832
- Keene School District22,939
- Kensington School Districtelementary2,009
- Laconia School District17,085
- Lafayette Regional School Districtelementary2,074
- Landaff School Districtelementary420
- Lebanon School District14,999
- Lempster School Districtelementary953
- Lincoln-Woodstock School District2,675
- Lisbon Regional School District2,047
- Litchfield School District8,499
- Littleton School District6,040
- Londonderry School District26,685
- Lyme School Districtelementary1,710
- Madison School Districtelementary2,680
- Manchester School District115,643
- Marlborough School Districtelementary2,207
- Marlow School Districtelementary855
- Mascenic Regional School District7,394
- Mascoma Valley Regional School District10,370
- Mason School Districtelementary1,451
- Merrimack School District28,164
- Merrimack Valley School District19,543
- Middleton School District1,595
- Milan School Districtelementary1,334
- Milford School District16,337
- Milton School District4,538
- Monadnock Regional School District14,010
- Monroe School Districtelementary786
- Mont Vernon School Districtelementary2,636
- Moultonborough School District5,126
- Nashua School District91,294
- Nelson School Districtelementary648
- New Boston School Districtelementary6,165
- New Castle School Districtelementary827
- Newfields School Districtelementary2,023
- Newfound Area School District11,775
- Newington School Districtelementary939
- Newmarket School District9,463
- Newport School District6,375
- North Hampton School Districtelementary4,543
- Northumberland School District1,815
- Northwood School Districtelementary4,688
- Nottingham School Districtelementary5,357
- Oyster River Cooperative School District21,859
- Pelham School District14,449
- Pembroke School District7,438
- Pemi-Baker Regional School Districtsecondary19,422
- Piermont School Districtelementary868
- Pittsburg School District683
- Pittsfield School District4,105
- Plainfield School Districtelementary2,522
- Plymouth School Districtelementary6,601
- Portsmouth School District22,545
- Profile School Districtsecondary4,611
- Prospect Mountain High School Joint Maintenance Agreement Districtsecondary10,988
- Raymond School District10,900
- Rivendell Interstate School District1,295
- Rochester School District33,144
- Rollinsford School Districtelementary2,626
- Rumney School Districtelementary1,458
- Rye School Districtelementary5,611
- Salem School District30,964
- Sanborn Regional School District11,111
- Seabrook School Districtelementary8,427
- Shaker Regional School District9,745
- Somersworth School District12,111
- Souhegan Cooperative School Districtsecondary14,497
- South Hampton School Districtelementary984
- Stark School Districtelementary419
- Stewartstown School Districtelementary960
- Stoddard School Districtelementary1,072
- Strafford School Districtelementary4,306
- Stratford School Districtelementary950
- Stratham School Districtelementary7,754
- Sullivan School District687
- Sunapee School District3,416
- Surry School District1,052
- Tamworth School Districtelementary2,884
- Thornton School Districtelementary2,799
- Timberlane Regional School District26,287
- Unity School Districtelementary1,375
- Wakefield School Districtelementary5,405
- Warren School Districtelementary942
- Washington School Districtelementary1,208
- Waterville Valley School Districtelementary290
- Weare School Districtelementary9,170
- Wentworth School Districtelementary1,057
- Westmoreland School Districtelementary2,237
- White Mountain Regional School District8,320
- Wilton-Lyndeborough School District5,576
- Winchester School Districtelementary4,212
- Windham School District16,038
- Windsor School District254
- Winnacunnet Cooperative School Districtsecondary31,724
- Winnisquam Regional School District12,087
Congressional districts
As drawn for the 119th Congress (2025–2027).
- Congressional District 1698,446
- Congressional District 2696,422
State senate districts
The upper chamber’s districts, as drawn in 2024.
- State Senate District 155,723
- State Senate District 257,645
- State Senate District 358,010
- State Senate District 457,590
- State Senate District 559,908
- State Senate District 657,013
- State Senate District 757,714
- State Senate District 856,528
- State Senate District 956,952
- State Senate District 1057,102
- State Senate District 1160,322
- State Senate District 1260,310
- State Senate District 1360,665
- State Senate District 1458,361
- State Senate District 1558,747
- State Senate District 1658,621
- State Senate District 1756,957
- State Senate District 1856,104
- State Senate District 1959,256
- State Senate District 2058,021
- State Senate District 2157,656
- State Senate District 2260,541
- State Senate District 2358,203
- State Senate District 2456,919
State house districts
The lower chamber’s districts, as drawn in 2024.
- State House District Belknap 013,464
- State House District Belknap 026,758
- State House District Belknap 037,116
- State House District Belknap 047,392
- State House District Belknap 0514,232
- State House District Belknap 0614,709
- State House District Belknap 0710,988
- State House District Carroll 0110,141
- State House District Carroll 027,433
- State House District Carroll 0310,690
- State House District Carroll 049,879
- State House District Carroll 054,521
- State House District Carroll 069,140
- State House District Cheshire 014,582
- State House District Cheshire 023,982
- State House District Cheshire 034,514
- State House District Cheshire 044,710
- State House District Cheshire 054,742
- State House District Cheshire 069,856
- State House District Cheshire 075,151
- State House District Cheshire 084,726
- State House District Cheshire 094,194
- State House District Cheshire 108,712
- State House District Cheshire 114,212
- State House District Cheshire 124,283
- State House District Cheshire 137,136
- State House District Cheshire 146,497
- State House District Coos 016,897
- State House District Coos 023,461
- State House District Coos 033,631
- State House District Coos 044,188
- State House District Coos 059,383
- State House District Coos 063,711
- State House District Grafton 0110,628
- State House District Grafton 023,597
- State House District Grafton 033,031
- State House District Grafton 043,140
- State House District Grafton 057,227
- State House District Grafton 063,810
- State House District Grafton 073,407
- State House District Grafton 0810,701
- State House District Grafton 094,541
- State House District Grafton 104,442
- State House District Grafton 114,727
- State House District Grafton 1213,395
- State House District Grafton 134,082
- State House District Grafton 145,274
- State House District Grafton 155,643
- State House District Grafton 164,475
- State House District Hillsborough 0114,449
- State House District Hillsborough 0223,746
- State House District Hillsborough 0310,593
- State House District Hillsborough 0410,043
- State House District Hillsborough 059,823
- State House District Hillsborough 069,369
- State House District Hillsborough 079,769
- State House District Hillsborough 0810,456
- State House District Hillsborough 0910,917
- State House District Hillsborough 1010,439
- State House District Hillsborough 119,885
- State House District Hillsborough 1228,164
- State House District Hillsborough 1325,557
- State House District Hillsborough 148,499
- State House District Hillsborough 1510,273
- State House District Hillsborough 168,418
- State House District Hillsborough 179,134
- State House District Hillsborough 1810,442
- State House District Hillsborough 199,566
- State House District Hillsborough 209,024
- State House District Hillsborough 2110,017
- State House District Hillsborough 229,518
- State House District Hillsborough 239,497
- State House District Hillsborough 249,864
- State House District Hillsborough 259,966
- State House District Hillsborough 269,924
- State House District Hillsborough 273,336
- State House District Hillsborough 289,170
- State House District Hillsborough 2918,513
- State House District Hillsborough 3010,514
- State House District Hillsborough 313,521
- State House District Hillsborough 3210,633
- State House District Hillsborough 336,850
- State House District Hillsborough 3411,861
- State House District Hillsborough 358,603
- State House District Hillsborough 369,271
- State House District Hillsborough 4210,417
- State House District Hillsborough 4316,337
- State House District Merrimack 014,044
- State House District Merrimack 024,971
- State House District Merrimack 038,799
- State House District Merrimack 048,045
- State House District Merrimack 058,330
- State House District Merrimack 063,726
- State House District Merrimack 076,460
- State House District Merrimack 0810,721
- State House District Merrimack 0914,372
- State House District Merrimack 1018,154
- State House District Merrimack 114,743
- State House District Merrimack 127,438
- State House District Merrimack 136,850
- State House District Merrimack 144,939
- State House District Merrimack 154,923
- State House District Merrimack 164,395
- State House District Merrimack 173,659
- State House District Merrimack 185,074
- State House District Merrimack 194,032
- State House District Merrimack 204,316
- State House District Merrimack 214,416
- State House District Merrimack 224,180
- State House District Merrimack 234,465
- State House District Merrimack 244,915
- State House District Rockingham 0110,045
- State House District Rockingham 0215,185
- State House District Rockingham 035,300
- State House District Rockingham 0410,900
- State House District Rockingham 057,430
- State House District Rockingham 064,641
- State House District Rockingham 074,831
- State House District Rockingham 084,531
- State House District Rockingham 096,628
- State House District Rockingham 1011,486
- State House District Rockingham 1116,151
- State House District Rockingham 127,754
- State House District Rockingham 1334,116
- State House District Rockingham 148,586
- State House District Rockingham 159,102
- State House District Rockingham 1626,685
- State House District Rockingham 1716,038
- State House District Rockingham 187,267
- State House District Rockingham 194,337
- State House District Rockingham 2013,681
- State House District Rockingham 215,055
- State House District Rockingham 225,050
- State House District Rockingham 234,543
- State House District Rockingham 249,717
- State House District Rockingham 2530,964
- State House District Rockingham 265,320
- State House District Rockingham 274,202
- State House District Rockingham 284,684
- State House District Rockingham 2916,426
- State House District Rockingham 308,427
- State House District Strafford 016,795
- State House District Strafford 0210,653
- State House District Strafford 034,343
- State House District Strafford 0413,795
- State House District Strafford 054,984
- State House District Strafford 065,061
- State House District Strafford 076,033
- State House District Strafford 085,285
- State House District Strafford 095,666
- State House District Strafford 1015,080
- State House District Strafford 1112,010
- State House District Strafford 1214,737
- State House District Strafford 135,460
- State House District Strafford 145,616
- State House District Strafford 155,944
- State House District Strafford 165,709
- State House District Strafford 175,404
- State House District Sullivan 013,465
- State House District Sullivan 024,338
- State House District Sullivan 0312,639
- State House District Sullivan 044,859
- State House District Sullivan 054,538
- State House District Sullivan 0613,876
PUMAs
Public Use Microdata Areas: areas of 100,000 people or more that the state draws from census tracts, for the Census Bureau’s microdata.
- Central New Hampshire–Merrimack County (Central), Concord City PUMA119,550
- Grafton, Sullivan, Coos Counties PUMA167,106
- Greater Nashua City (East) PUMA107,503
- Greater Nashua City (West) PUMA112,660
- Lakes Region–Belknap, Carroll & Merrimack (Northern) Counties PUMA137,823
- Manchester City PUMA115,643
- Outer Manchester City PUMA169,975
- Seacoast Region–Rockingham County (Southern), Portsmouth City PUMA202,250
- Southwestern New Hampshire–Cheshire & Hillsborough (Western) Counties PUMA110,275
- Strafford & Rockingham (Northern) Counties PUMA152,083
Urban areas
Each that reaches into New Hampshire, with its whole population. Urban areas are the densely settled land the Census Bureau draws after each census, whatever the city lines.
- Bellows Falls, VT–NH3,689
- Berlin, NH9,719
- Boston, MA–NH4.39M
- Claremont, NH9,914
- Concord, NH43,361
- Conway, NH5,860
- Dover–Rochester, NH–ME73,466
- Durham, NH11,844
- Exeter, NH15,473
- Franklin, NH7,186
- Keene, NH22,447
- Laconia, NH26,839
- Lebanon, NH–VT30,905
- Lincoln, NH1,596
- Manchester, NH163,954
- Meredith, NH3,657
- Nashua, NH–MA242,017
- Plymouth, NH6,307
- Portsmouth, NH–ME96,272
- Raymond, NH4,987
- South Berwick, ME–NH5,153
Turn New Hampshire into your planning report.
Social Explorer Studio builds an editable profile of any place, with tables and charts beside the county and state, and exports to Word, PDF and Excel.
Questions about New Hampshire
What is the population of New Hampshire?
1,415,342 people, according to the ACS 2025 1-year estimates, which the Census Bureau adjusts to match its own population estimate. That’s the 41st largest of the 50 states and DC.
What is the FIPS code for New Hampshire?
33. Every county’s and place’s FIPS code in New Hampshire starts with it. The Census Bureau’s full geographic identifier (GEOID) is 0400000US33.
What is the largest city in New Hampshire?
Manchester, with 116,821 people. Other large places here include Nashua, Concord and Dover.
What is the median household income in New Hampshire?
$106,759 (±$2,502), according to the ACS 2025 1-year estimates, higher than the US ($84,780).
What is the median age in New Hampshire?
44.2 years (±0.3), according to the ACS 2025 1-year estimates, higher than the US (39.5).
How much does housing cost in New Hampshire?
New Hampshire’s median home value is $487,100 (±$8,193) and its median gross rent is $1,742 (±$39) a month, according to the ACS 2025 1-year estimates. 46.2% (±3.0%) of its renters pay 30% or more of their income on rent.
Is New Hampshire growing?
New Hampshire’s population grew 6.4%, from 1,330,608 in 2015 to 1,415,342 in 2025, according to the ACS 1-year estimates.
Where do people who work in New Hampshire live?
587,618 of its 679,505 jobs are held by people who live here. Of those who commute in, the most come from Massachusetts, Maine, Vermont.
Where does this census data come from?
The U.S. Census Bureau’s American Community Survey, through Social Explorer’s tables: the latest 1-year estimates where they exist, for the most recent numbers, and 5-year estimates otherwise. Each table lists its code, so you can find it again.
Is this data free to use?
Yes. You can read it, cite it, download the CSV and embed the charts, with no account. To map other variables, compare your own areas or build a report, see Social Explorer’s plans in a live demo.
Sources and how to cite
American Community Survey 2025 1-year estimates, or 2020–2024 5-year estimates where noted, U.S. Census Bureau, from Social Explorer’s tables A00001, A00002, A01004, A04001, A06001, A08001, A09005, A10001, A10003, A10008, A10030, A10036, A10040, A10047, A10055, A10060, A12001, A13004, A14006, A14024, A14028, A16002, A17005, A18002, A18009, A20001, B02002, B09001, B13002, B18101, C16001. Maps by census tract use 2020–2024 5-year estimates, since the 1-year survey doesn’t cover tracts. Commuting: LEHD LODES 2023. These are estimates from a sample, each with its margin of error. Data retrieved November 14, 2026. How these profiles are made.
U.S. Census Bureau, American Community Survey 2025 1-year estimates, or 2020–2024 5-year estimates where noted, via Social Explorer. “New Hampshire.” https://www.socialexplorer.com/places/new-hampshire. Accessed November 14, 2026.