

Data dashboards and urban planning software:
A data dashboard for any place,
ready to present.
Studio is Social Explorer’s dashboard for profiling a place: a city, a county, a neighborhood or a study area you build from tracts, beside the places you compare it with. It gathers the data into one profile of tables, charts and summaries, laid out and ready to read. Export it as a Word, PDF or Excel report, or pull its charts and tables into a presentation. Planners use it as urban planning software, and it works just as well for researchers, consultants, grant writers and teachers.
Take a closer look.
-
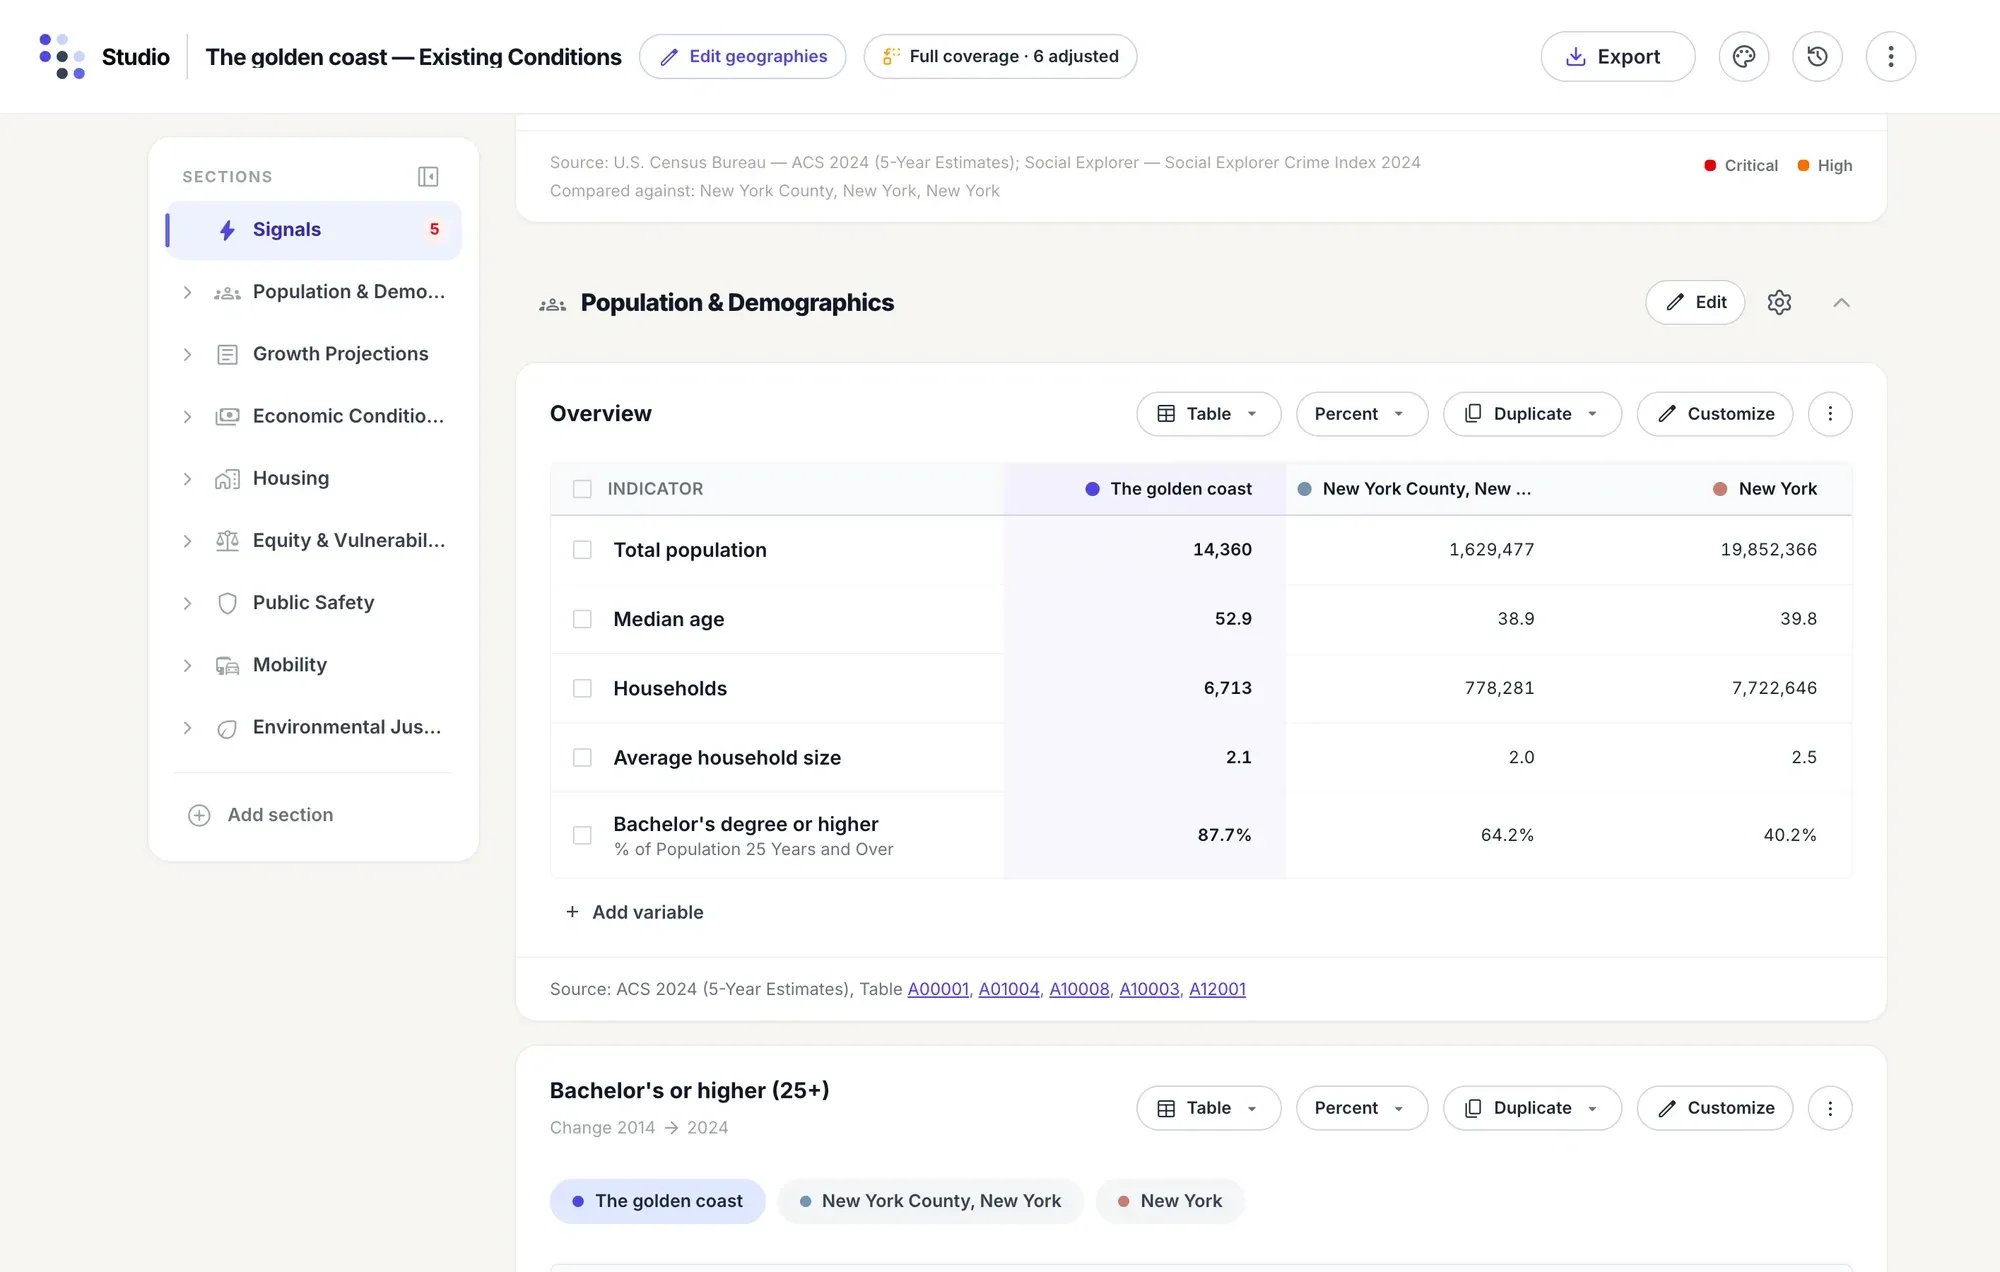
The study area sits in its own column, highlighted, beside the county and the state. Switch any table between counts and percents, or show the change over ten years.
-
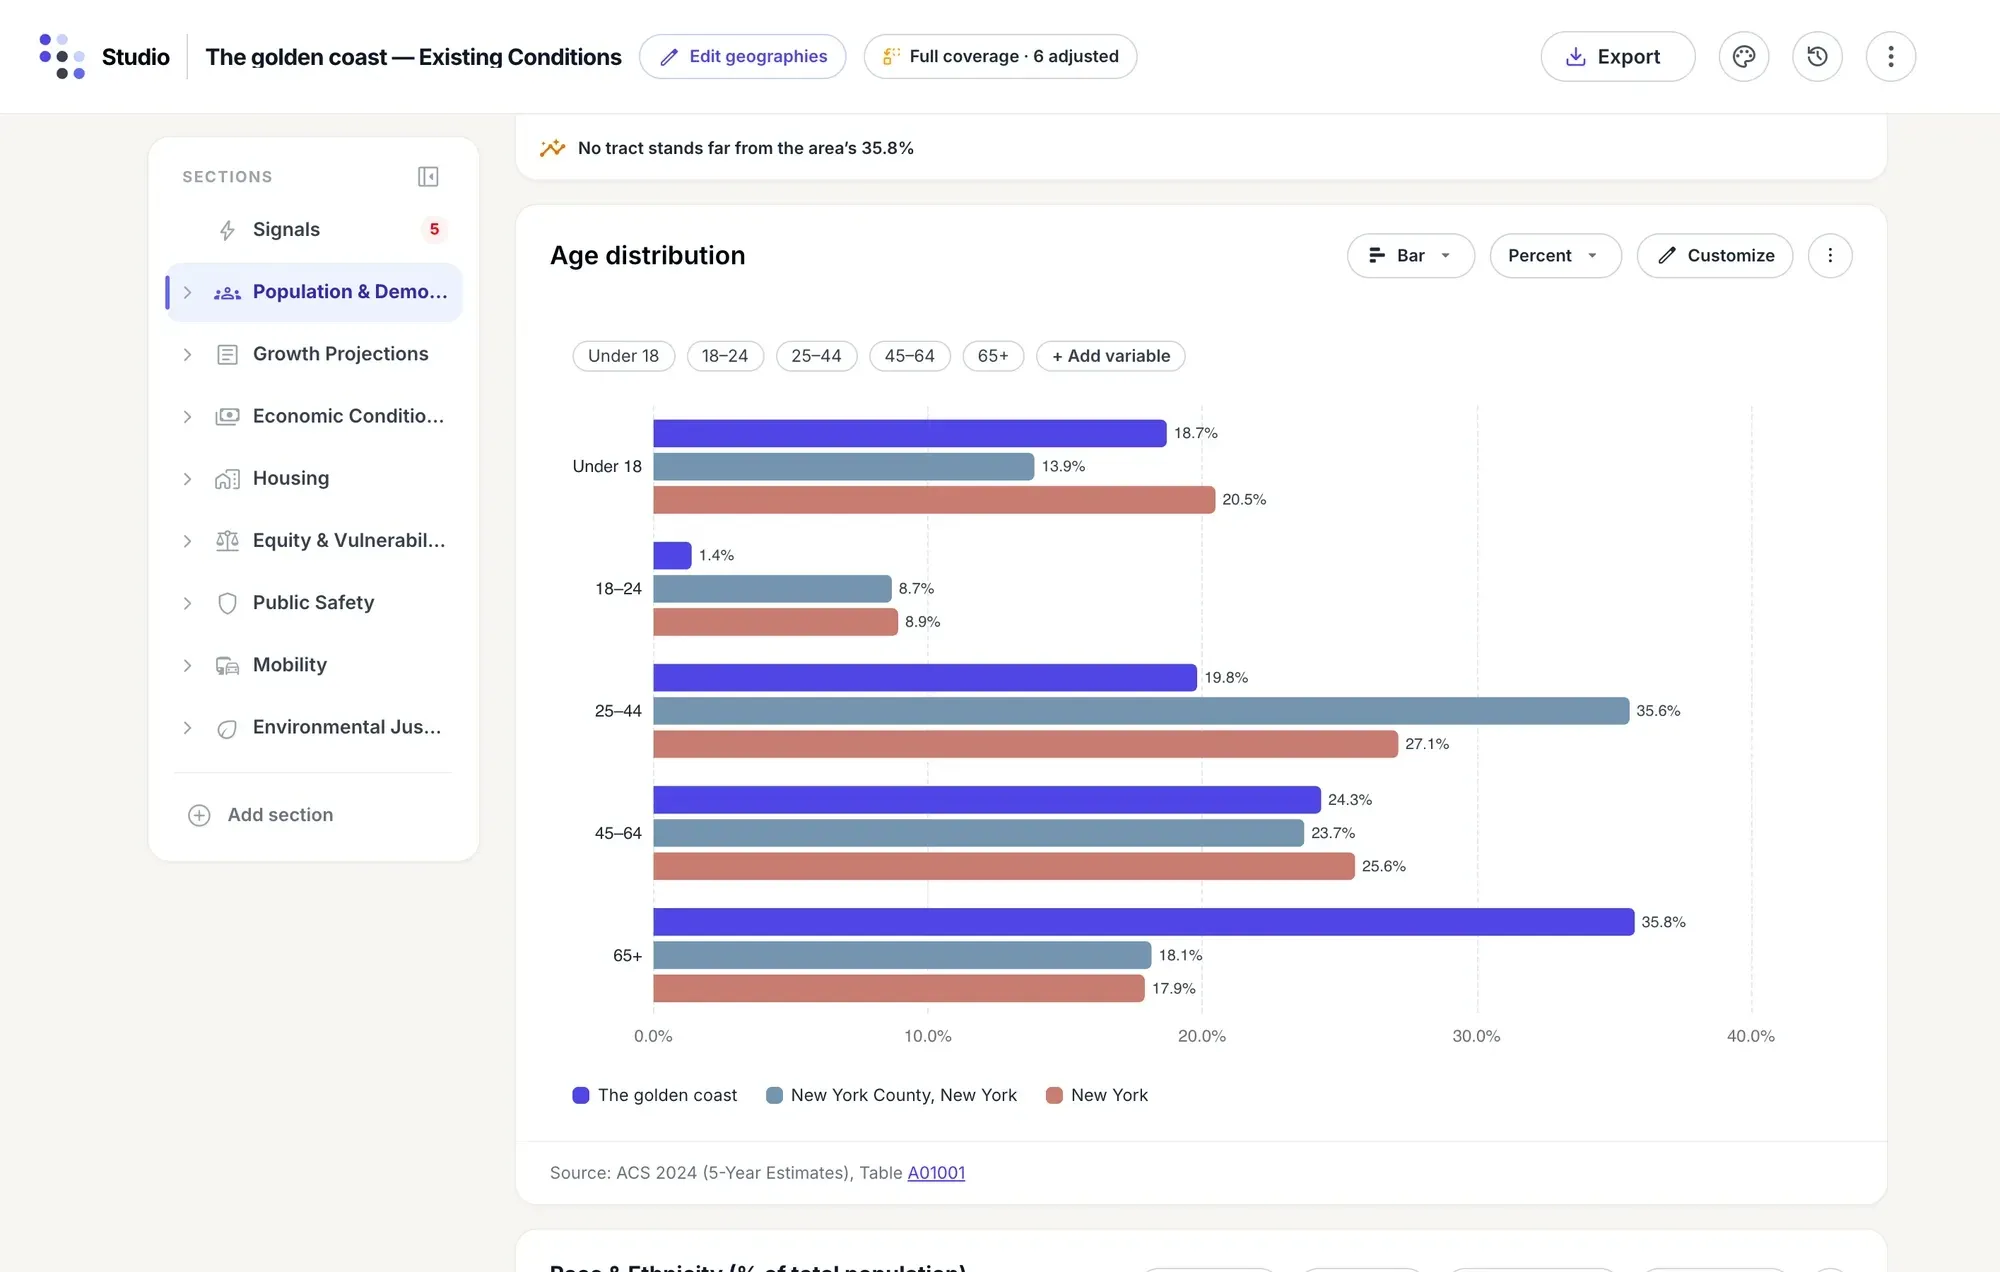
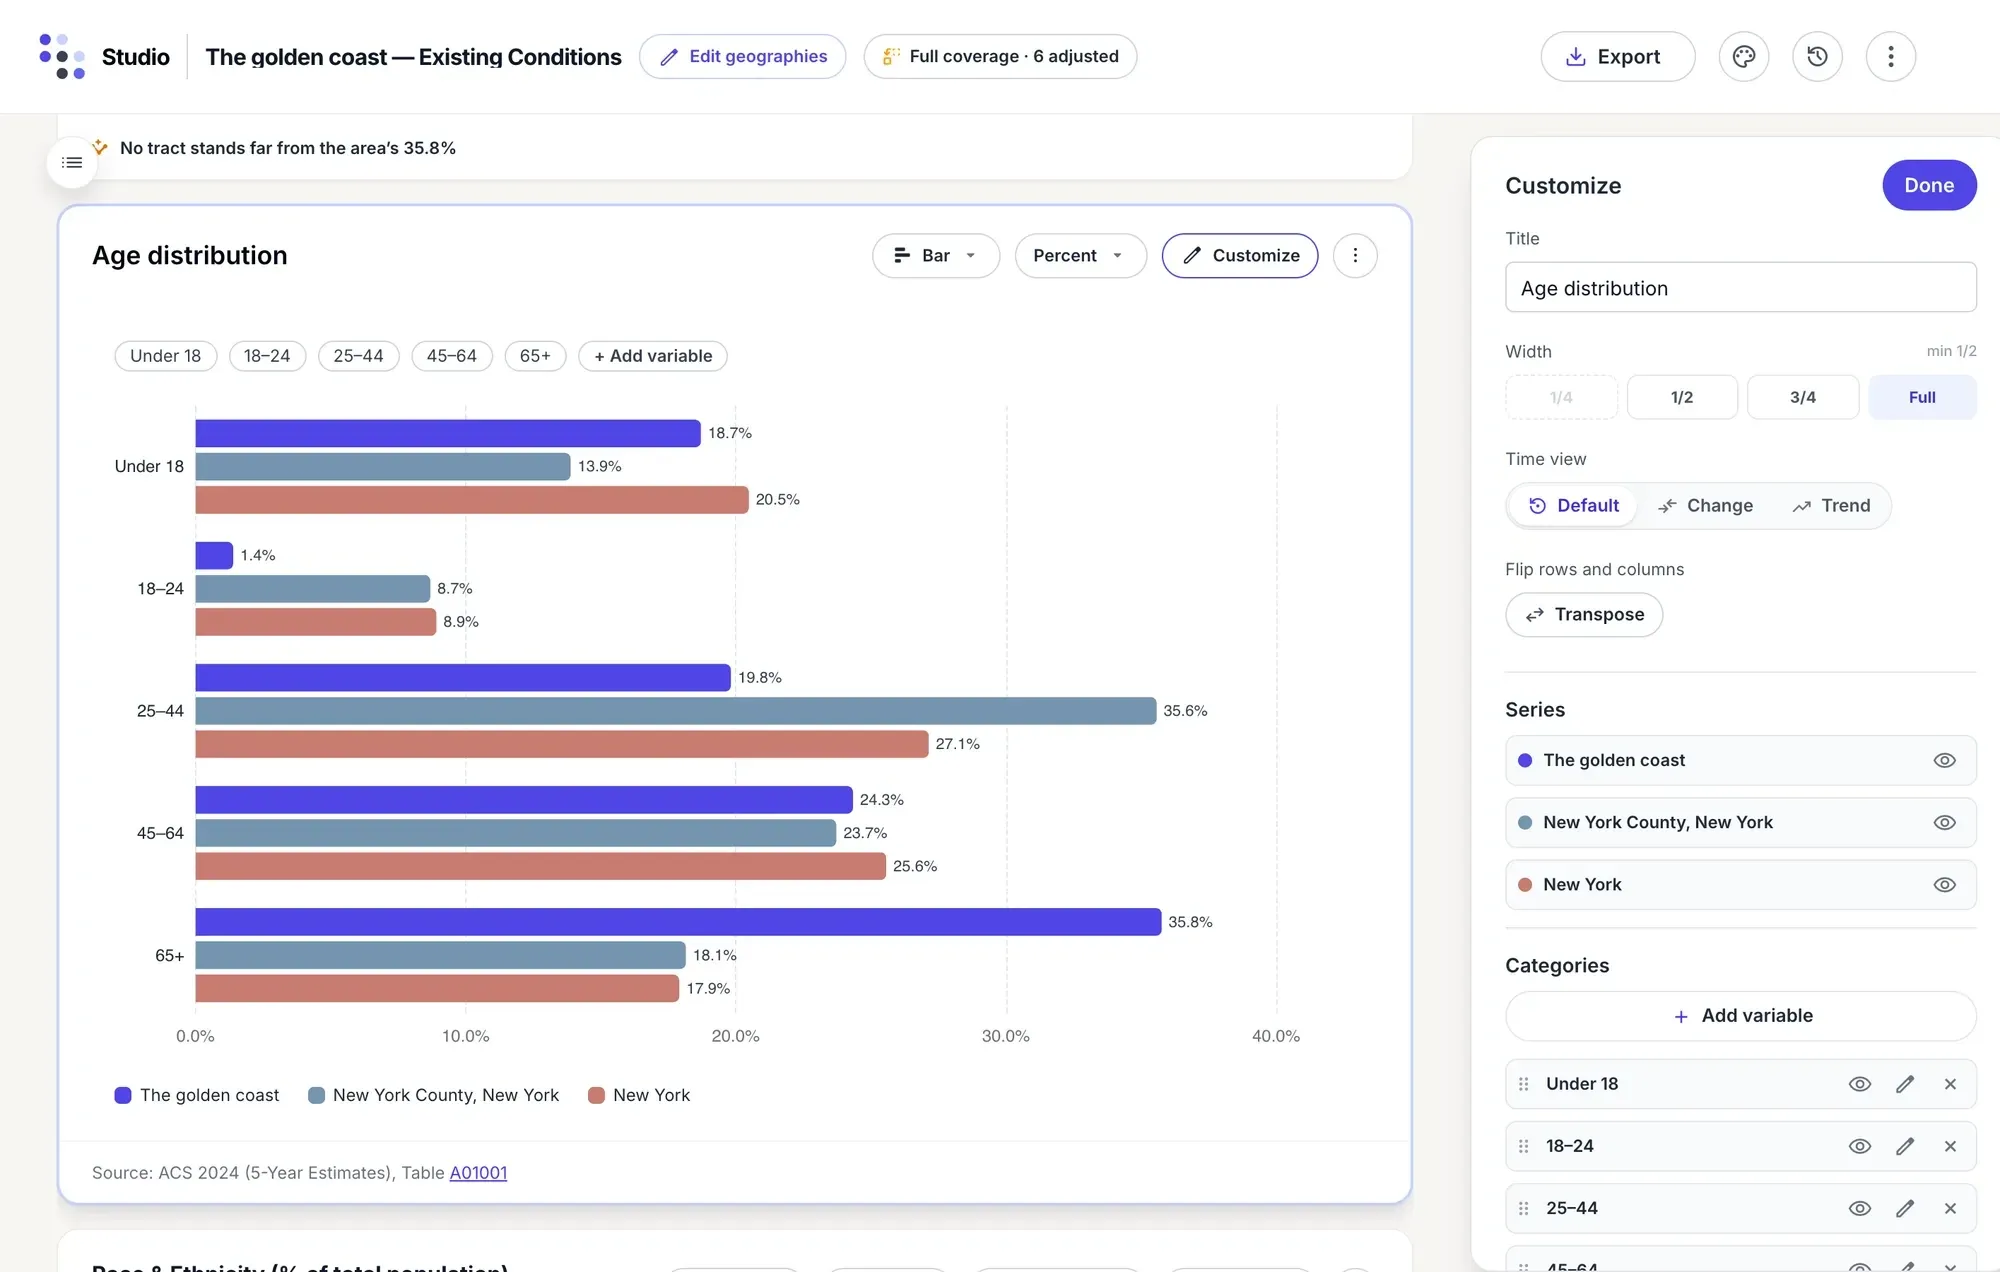
Show a table as a column, bar, line, area, stacked bar or pie chart, and give each place its own color in every table, chart and export.
-
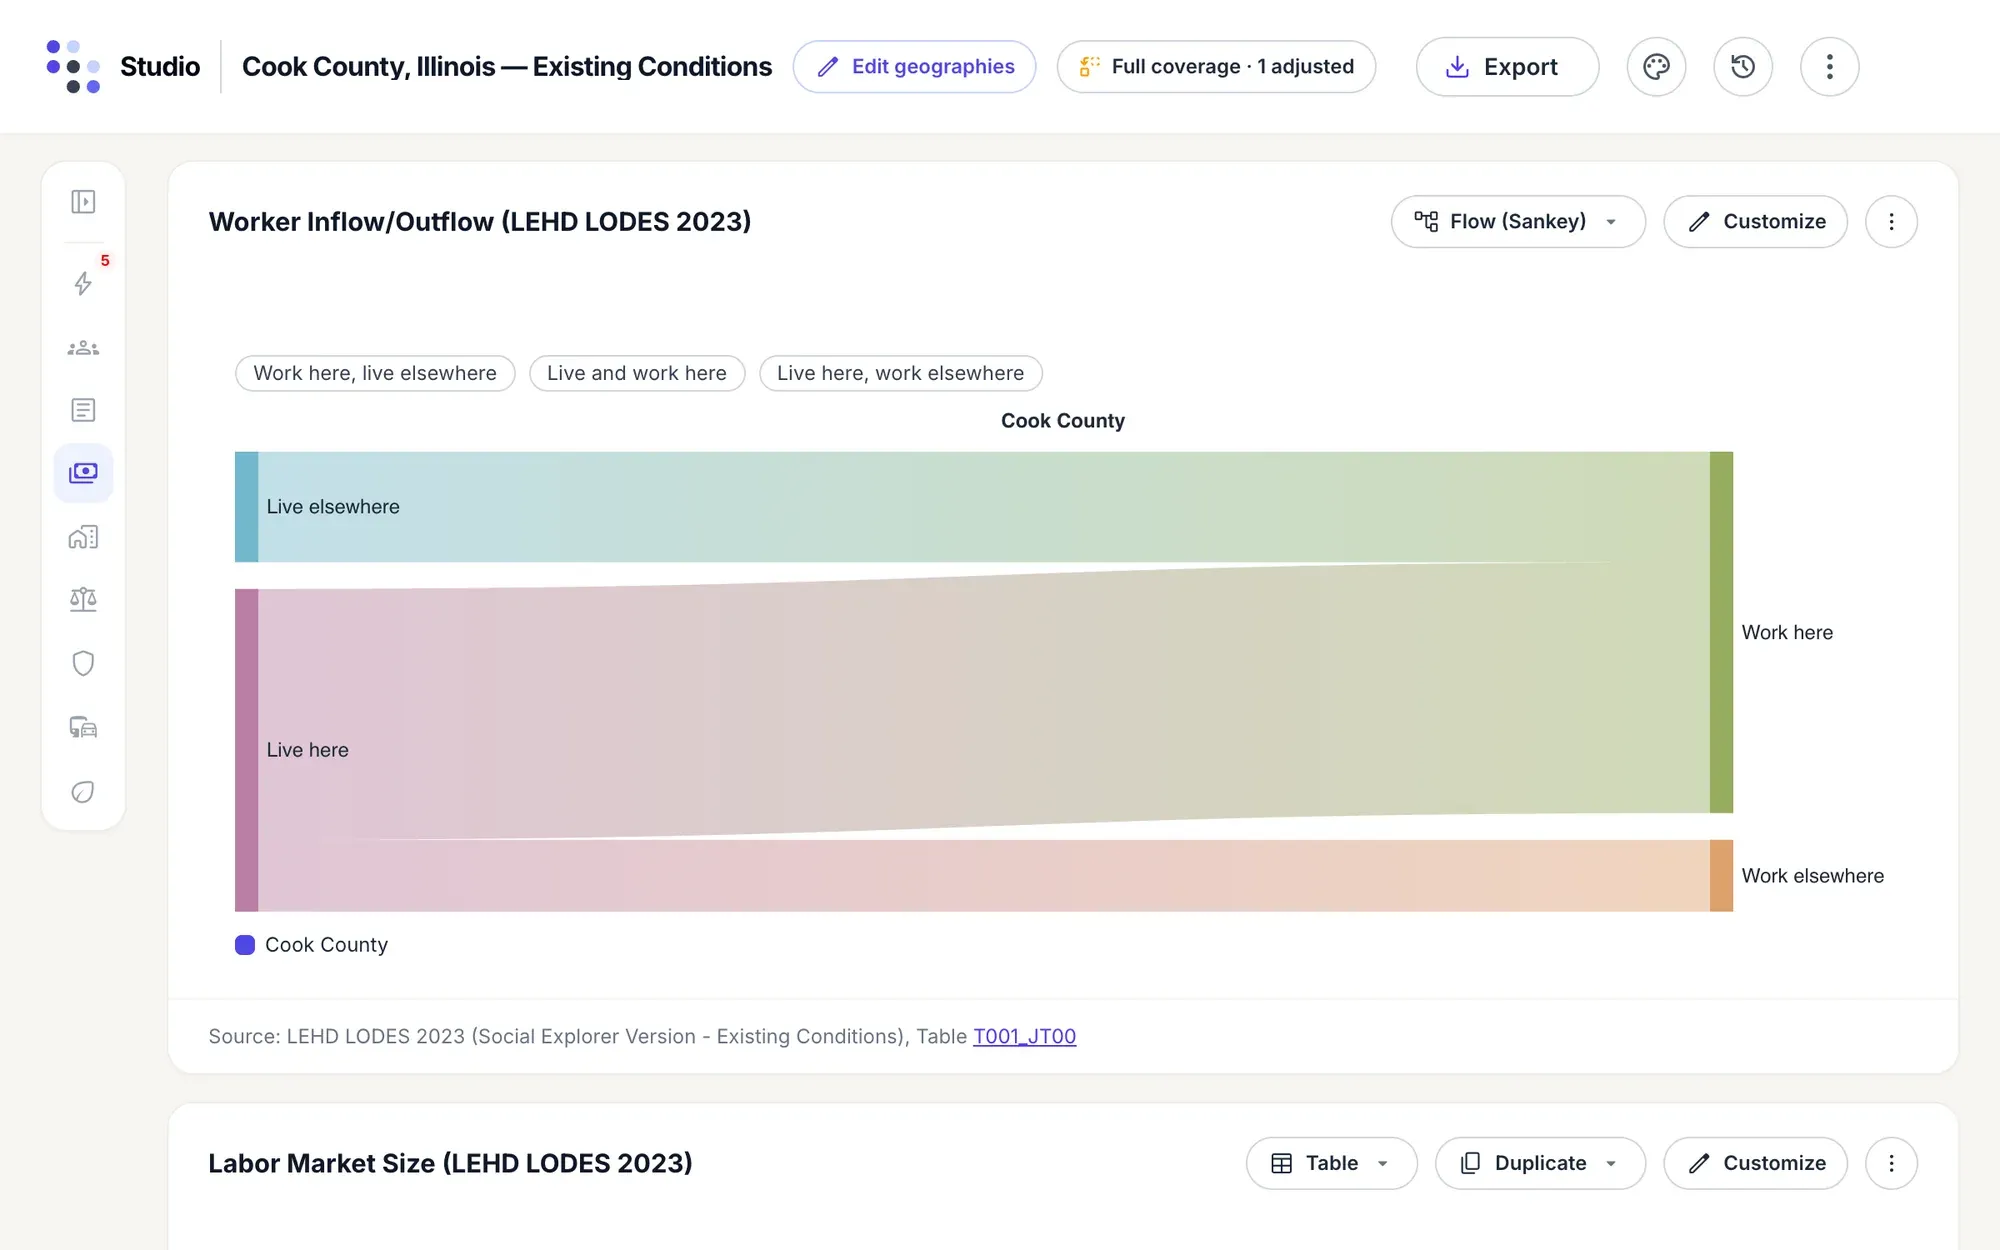
A flow chart shows movement, such as commuting from the Census Bureau’s LEHD data: who comes into the county to work, who leaves it, and who lives and works there.
-
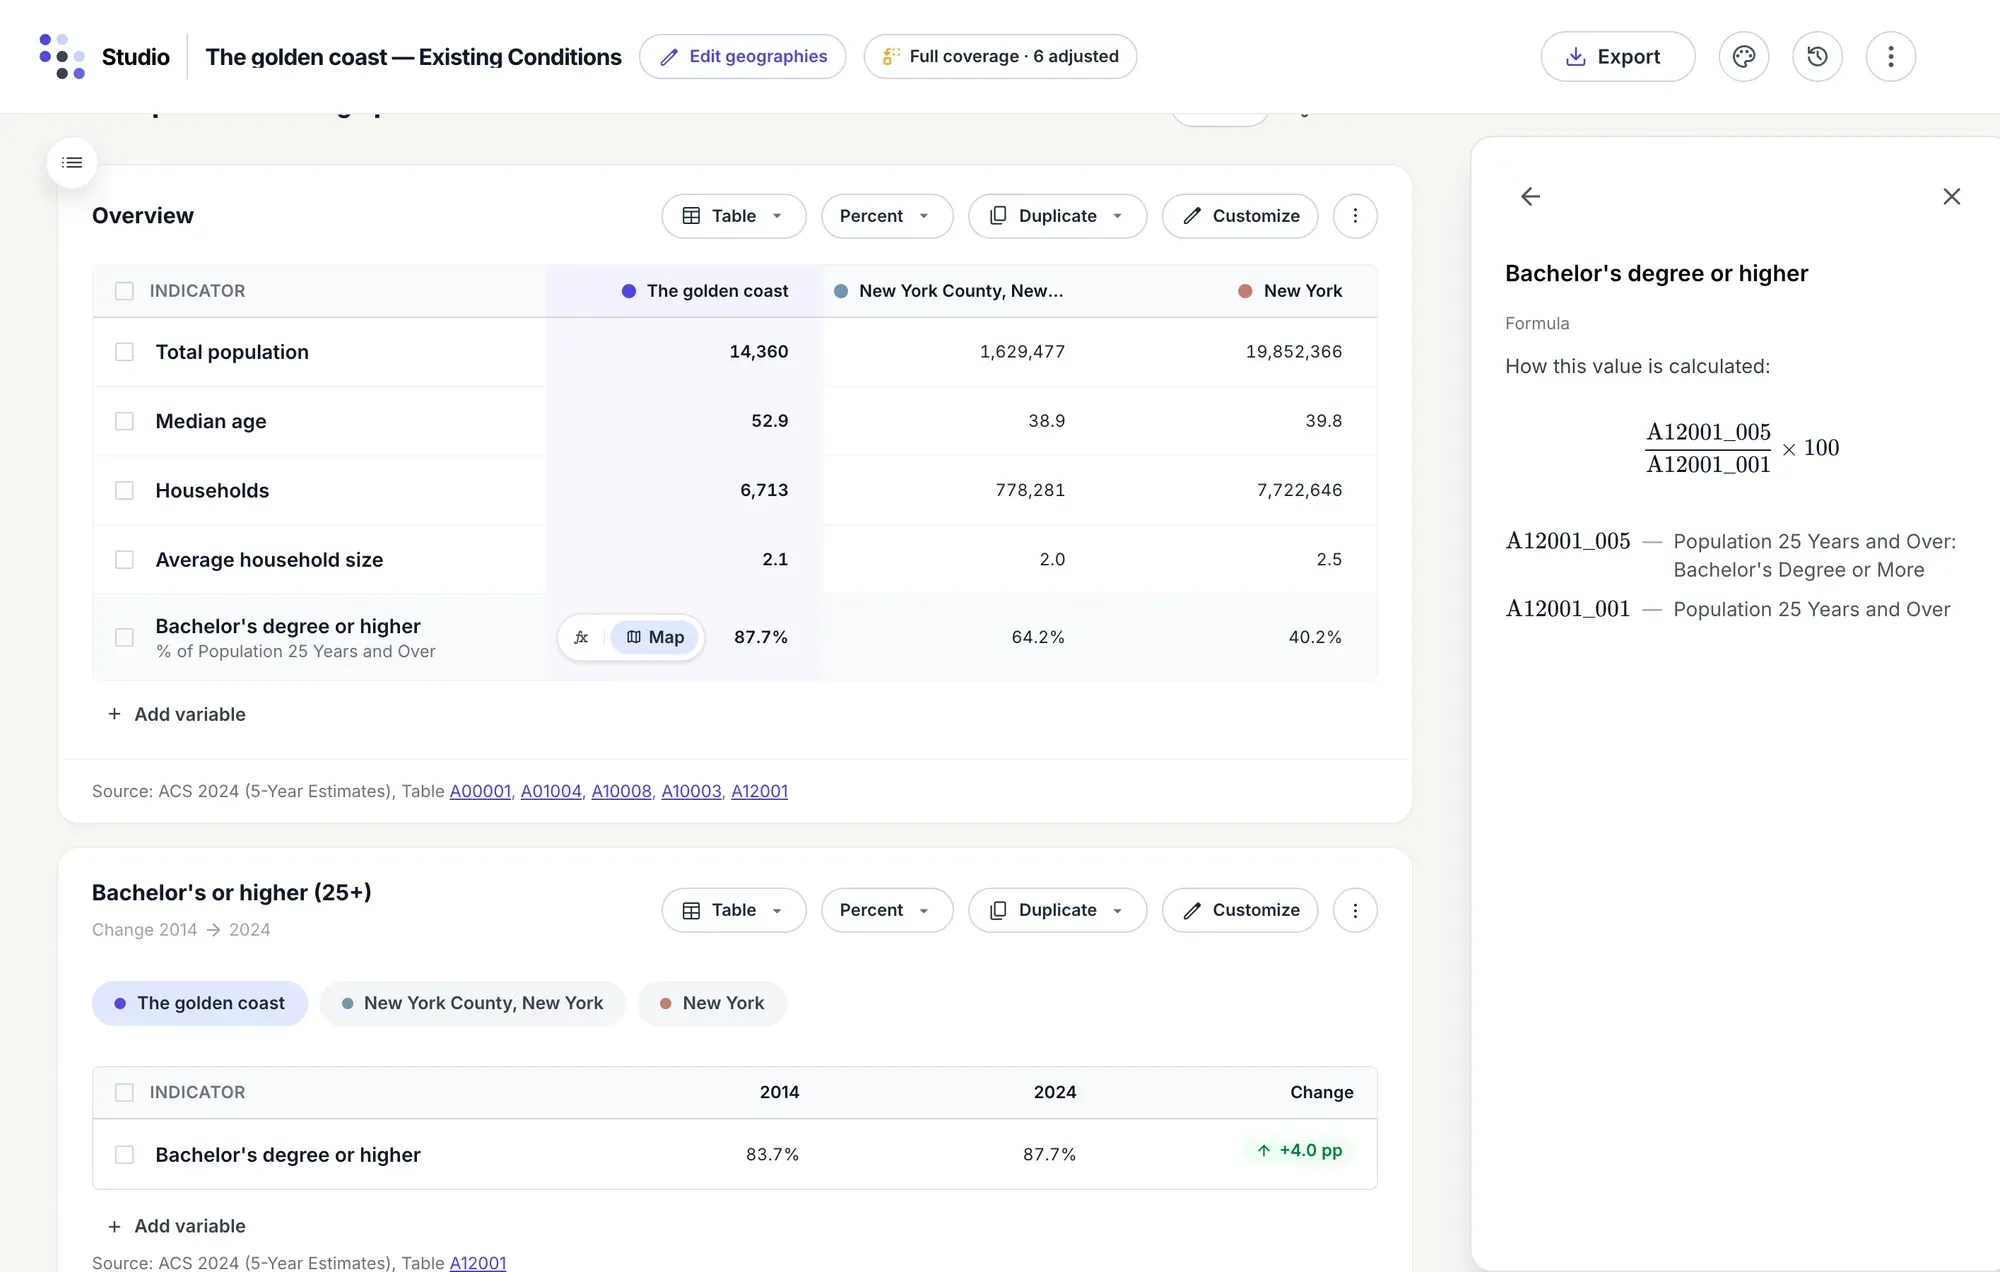
Point at any row to see how its value is calculated: the variables, their codes and the arithmetic. Every block names its source, survey and table.
-
Rename a block, set its width, switch the time view, flip rows and columns, hide or reorder series, or duplicate a table as a chart.
-
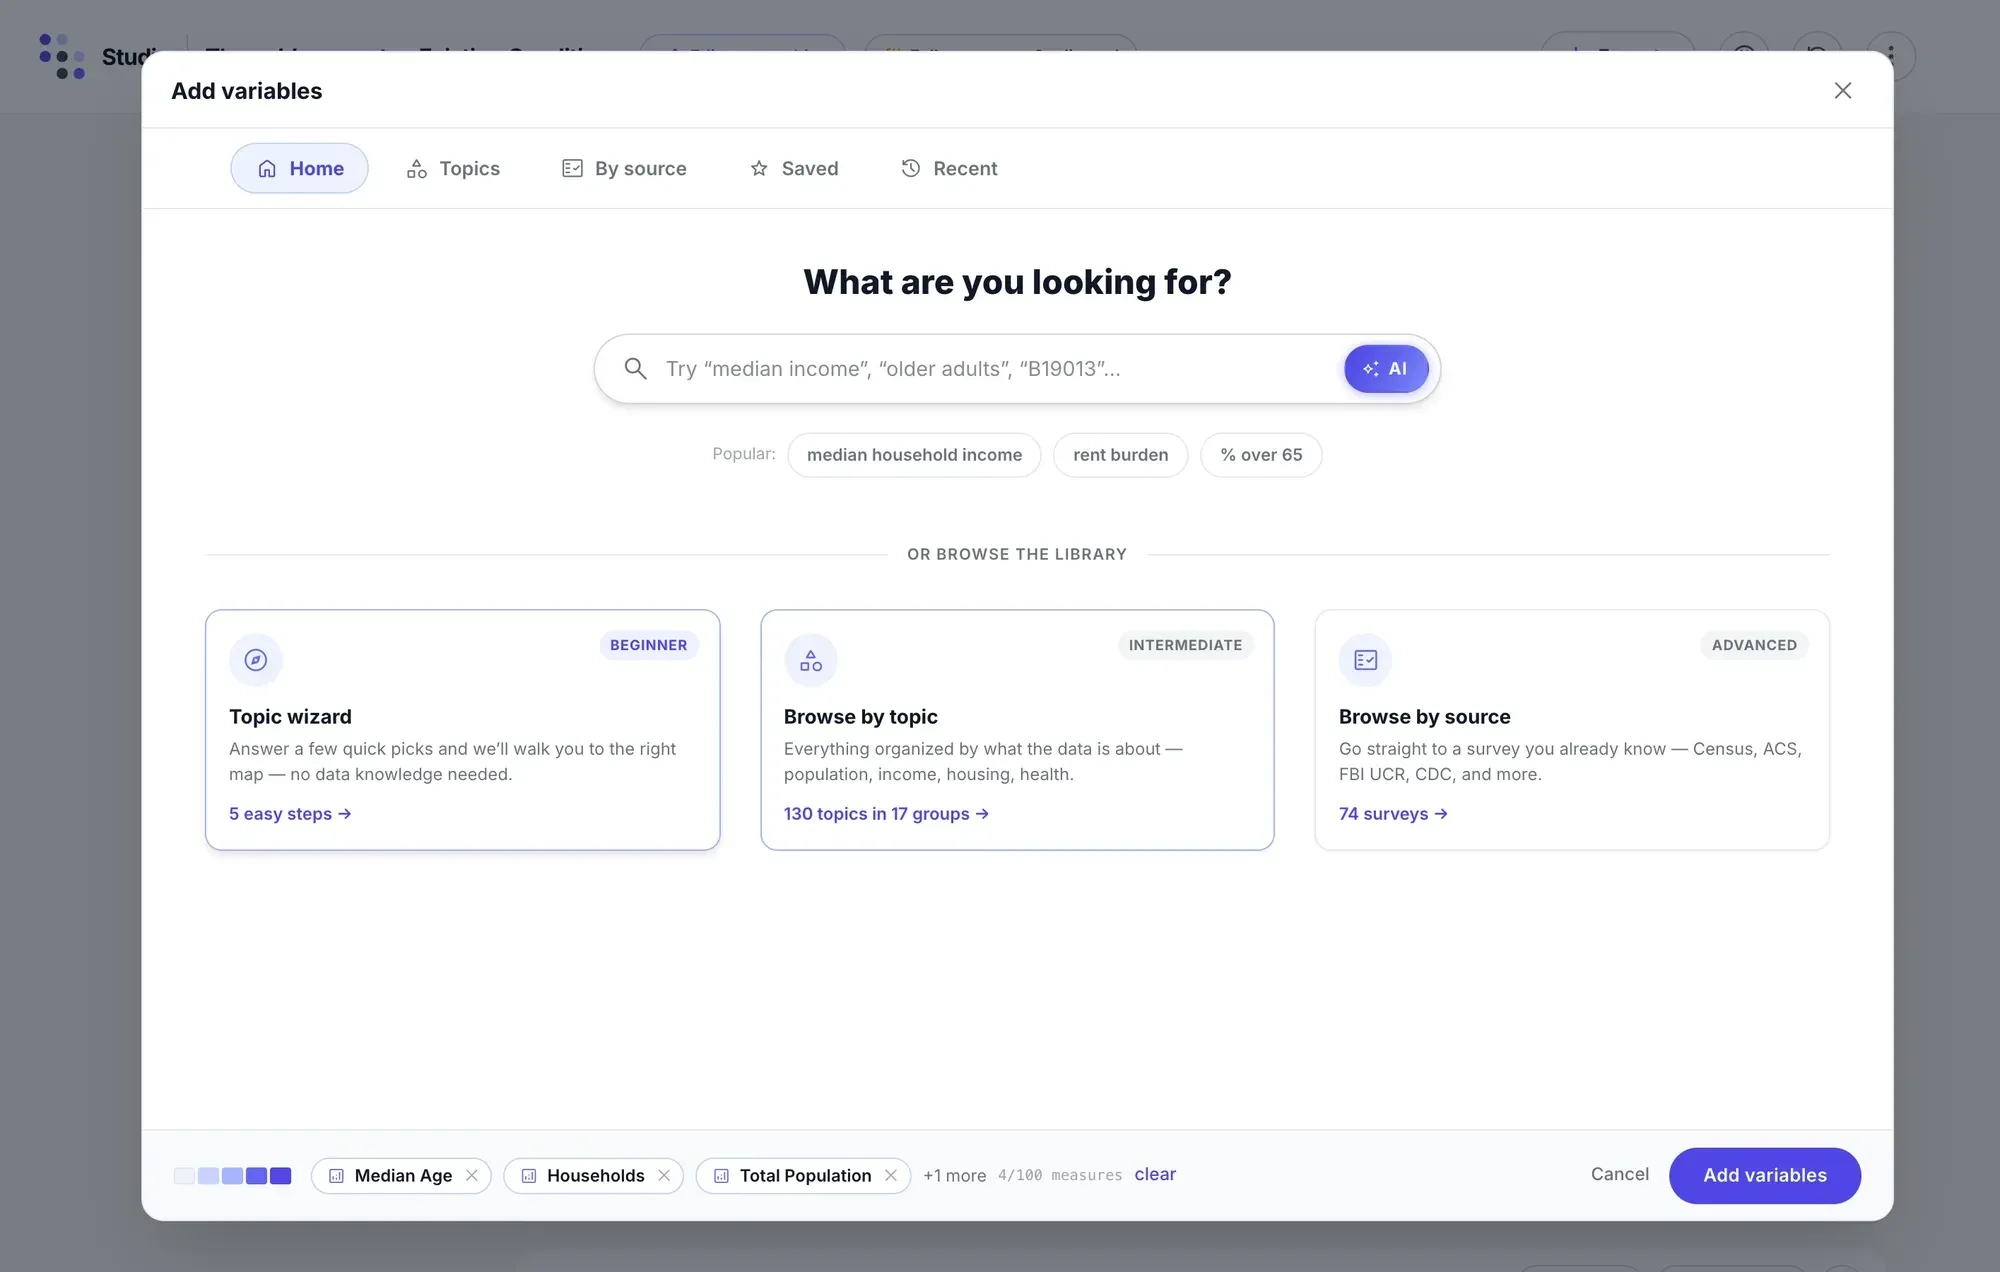
Add any variable from the whole catalog: answer a few questions in the topic wizard, browse by topic, or go straight to a survey and table.
Start a profile
Name a place. Studio does the rest.
A profile takes one page: where you’re working, the places to compare it with, what kind of report, and a check that the data covers every place before anything is built.
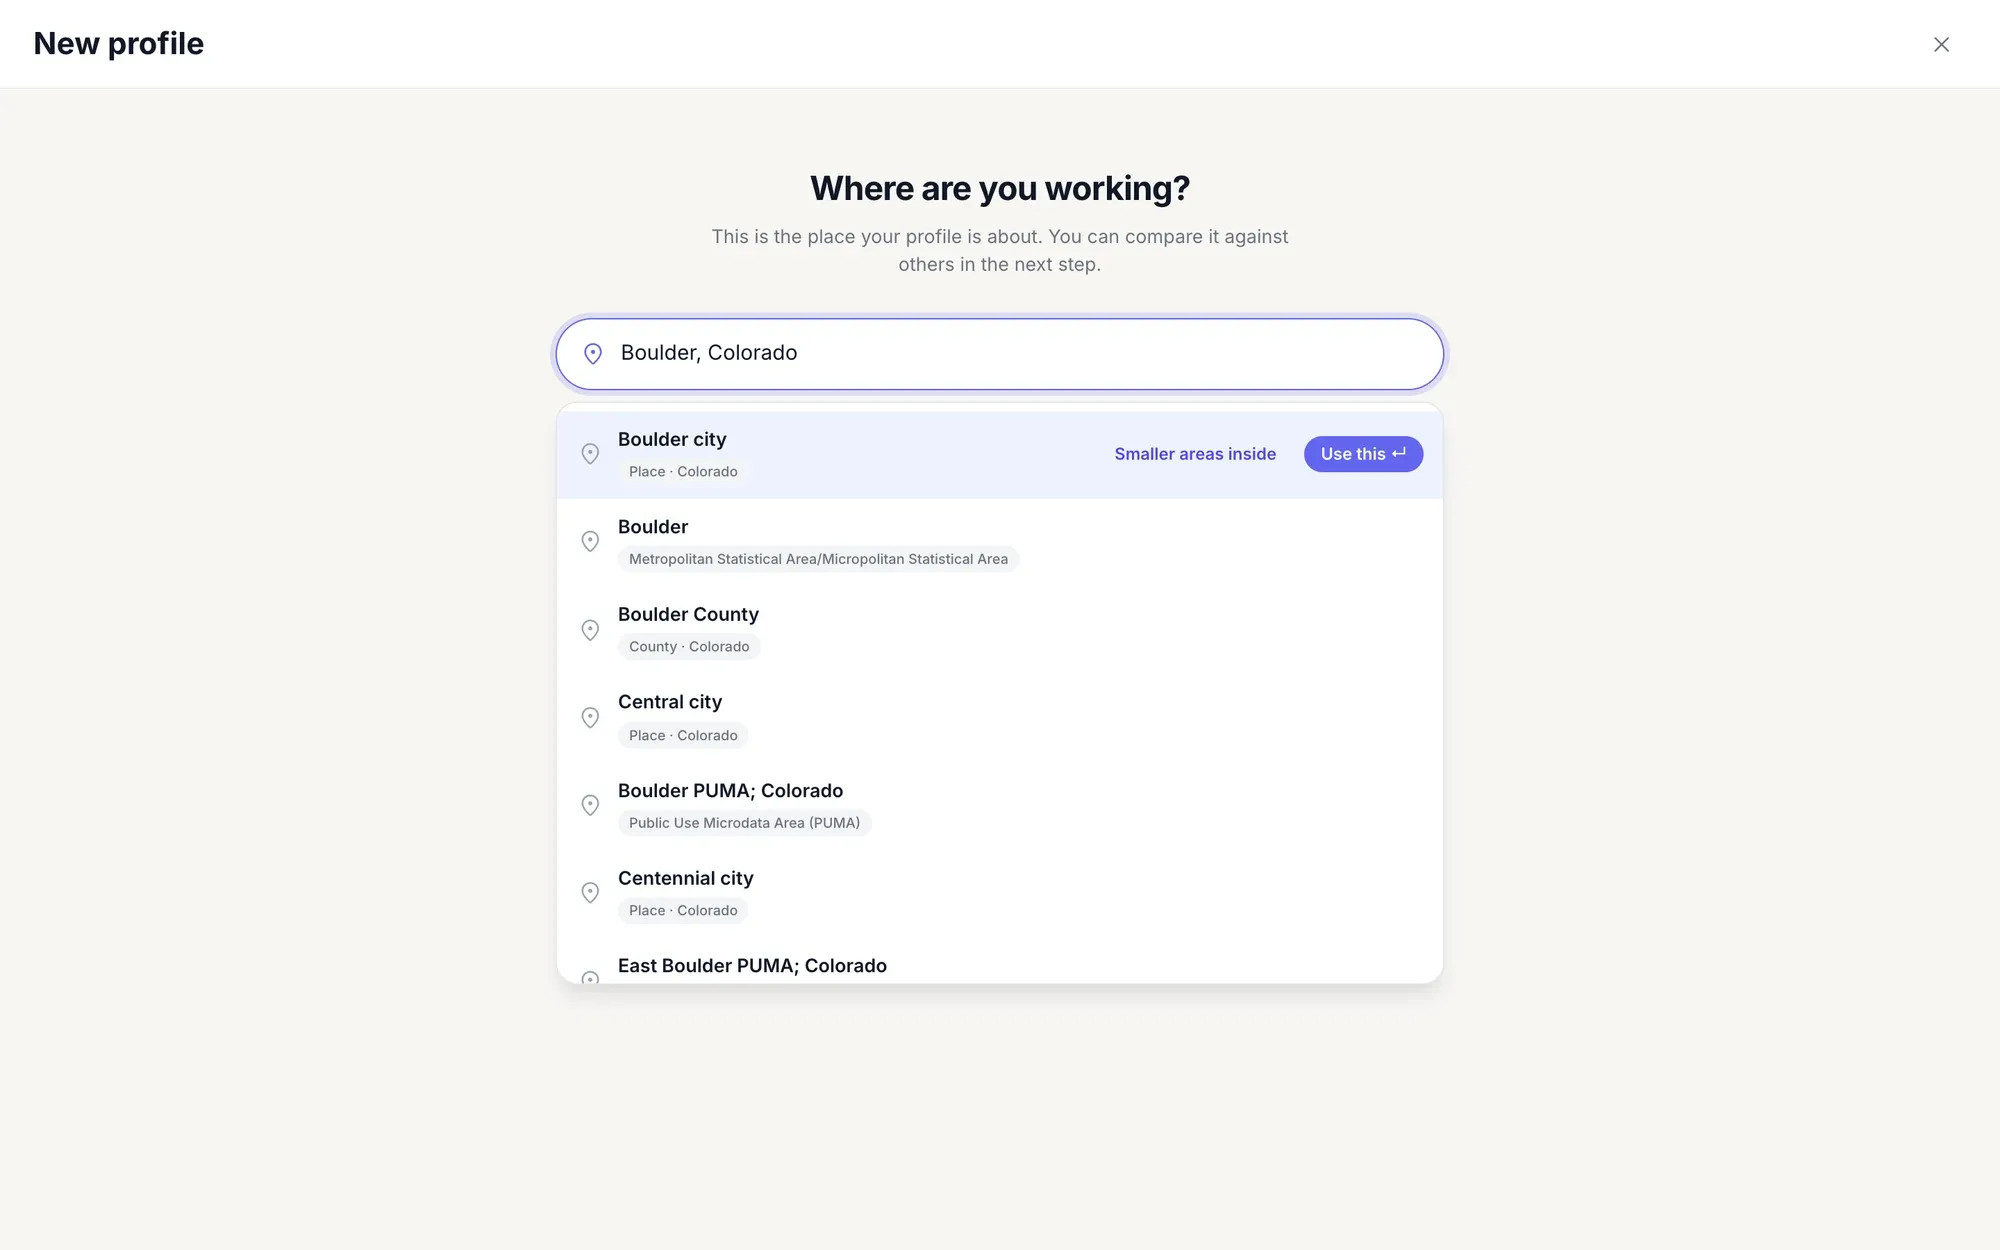
Type “Boulder, Colorado” and the city, the metro area, the county and its PUMAs come up together. Take the city as it is, or open its census tracts and pick the ones you need.
Pick areas on the map: here, a 2-mile radius around 36 Church Street in Burlington, Vermont, selects 33 block groups, added as one comparison area.
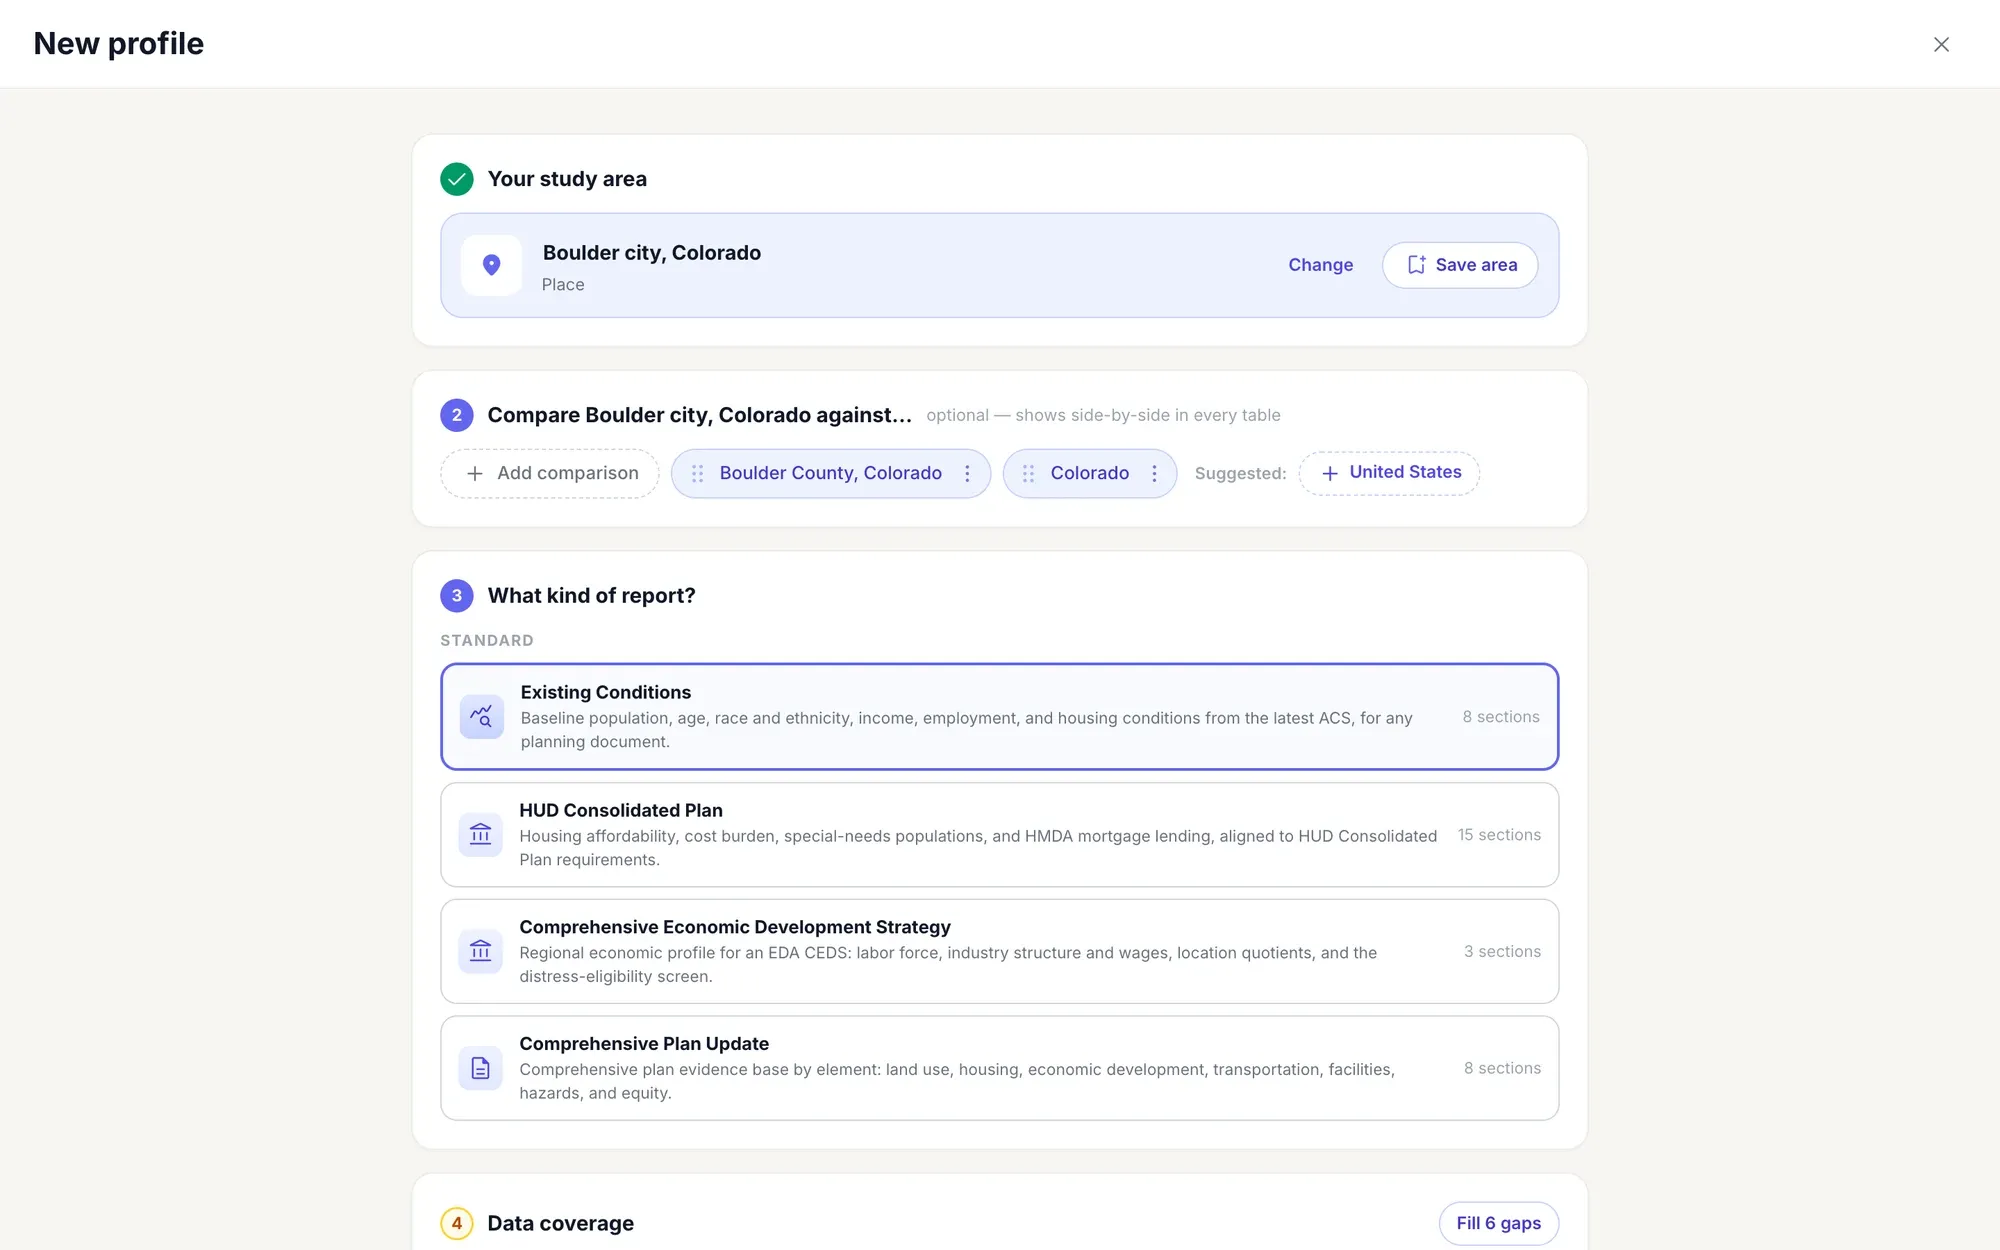
Studio suggests the county, the state and the nation as benchmarks. Add any other place, then choose a report: Existing Conditions, a HUD Consolidated Plan, a CEDS or a Comprehensive Plan Update.
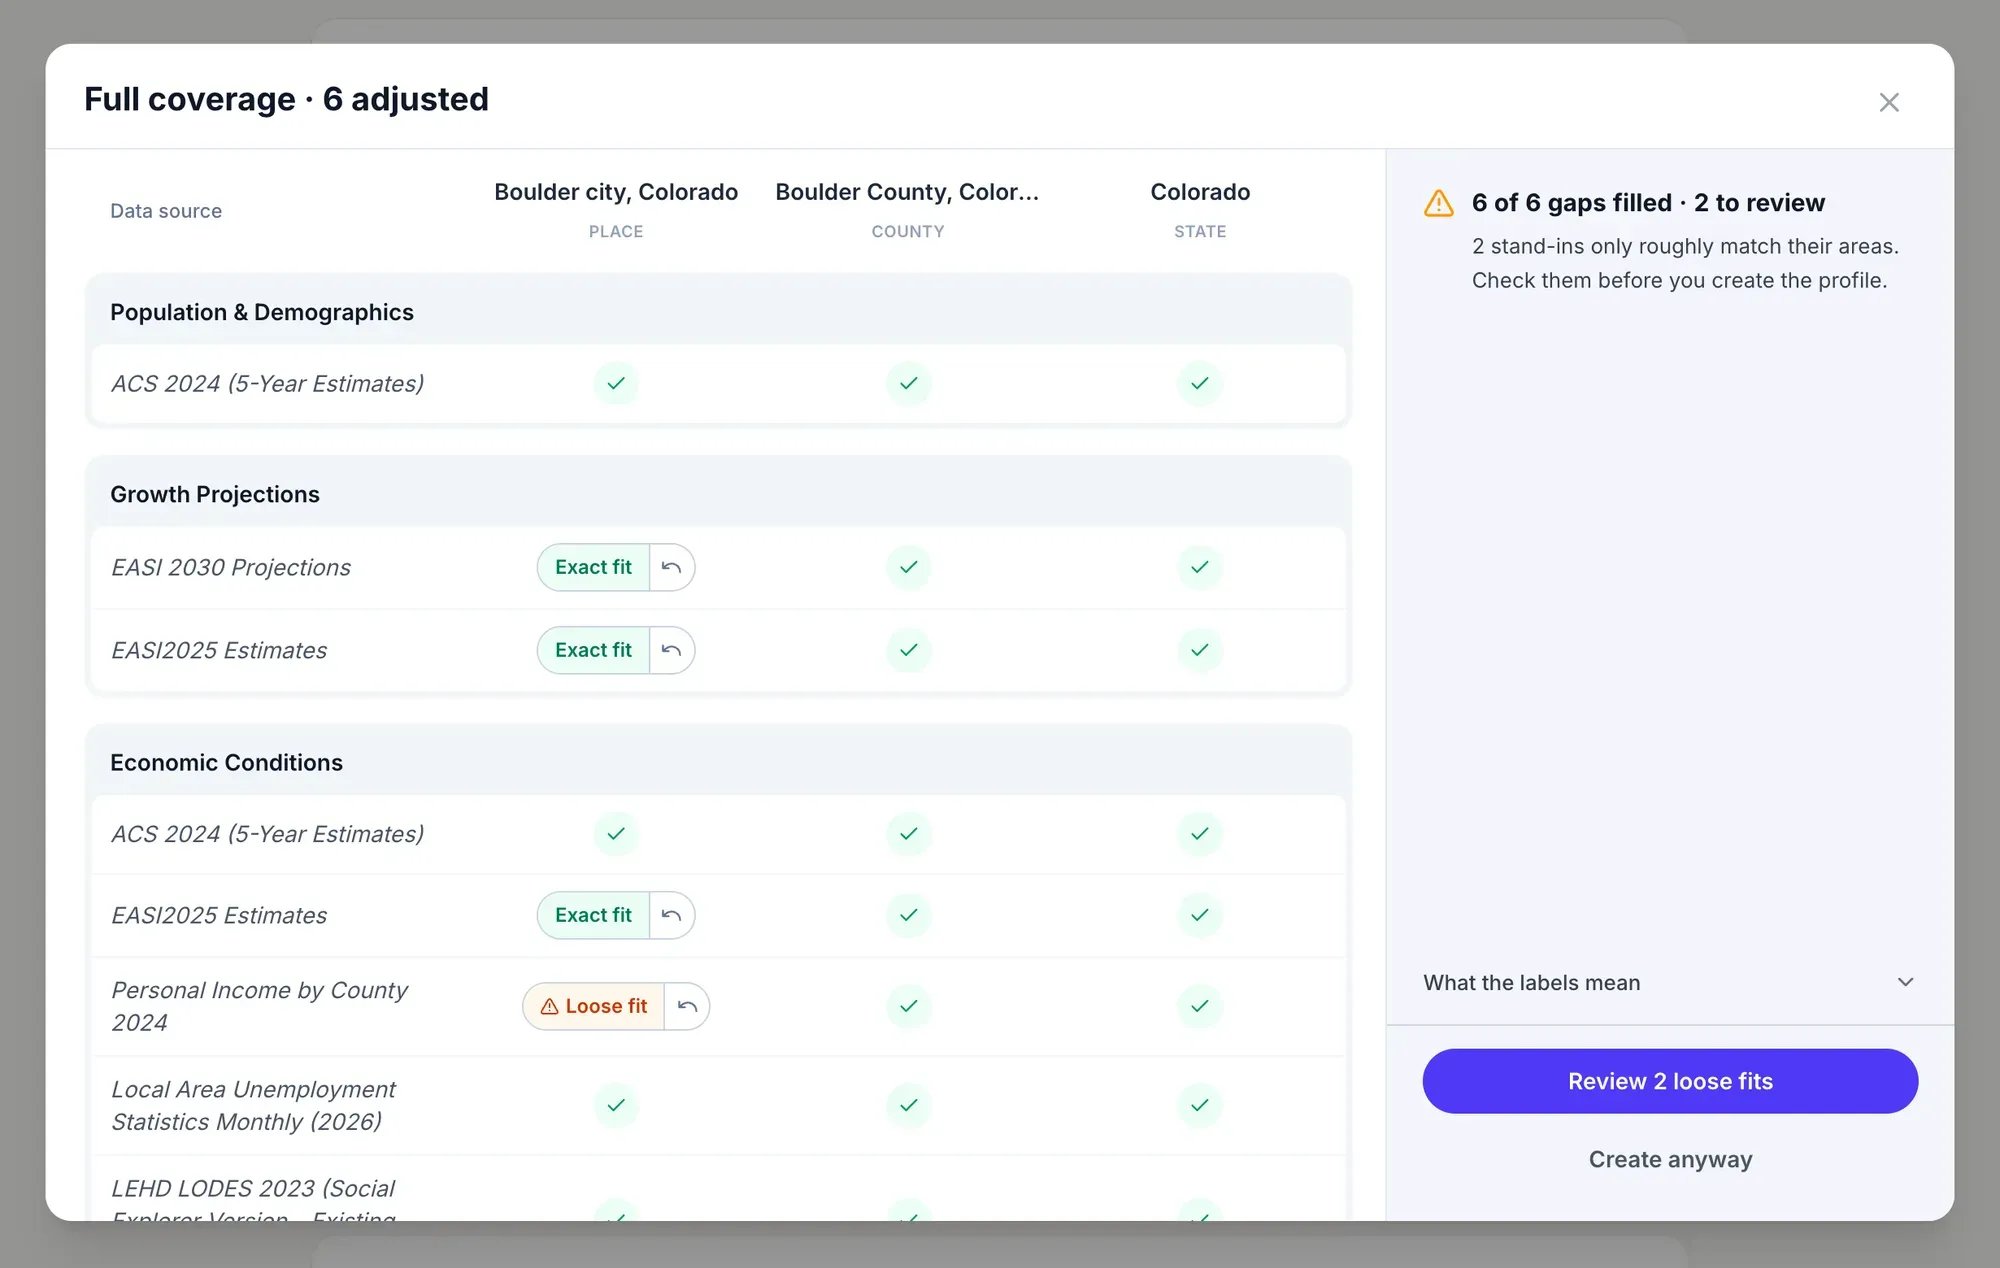
Before a profile is built, Studio checks every data source against every place, and fills each gap with the closest stand-in, labeled Exact fit or Loose fit.
-
Any place, any way
Search for a city, county, ZIP code, tract or street address, browse geography levels, paste FIPS codes, or reuse a saved place.
-
Your own study area
Combine tracts or block groups into an area of your own and name it, like “The golden coast”, four tracts on Manhattan’s Upper East Side.
-
Change your mind later
Edit a profile’s study area or comparisons at any time, and the report refreshes for the new places.
What stands out
The findings, first.
Every profile opens with its signals: the indicators that cross an established benchmark, ranked by how far they diverge from the comparisons and tiered Critical, High or Moderate.
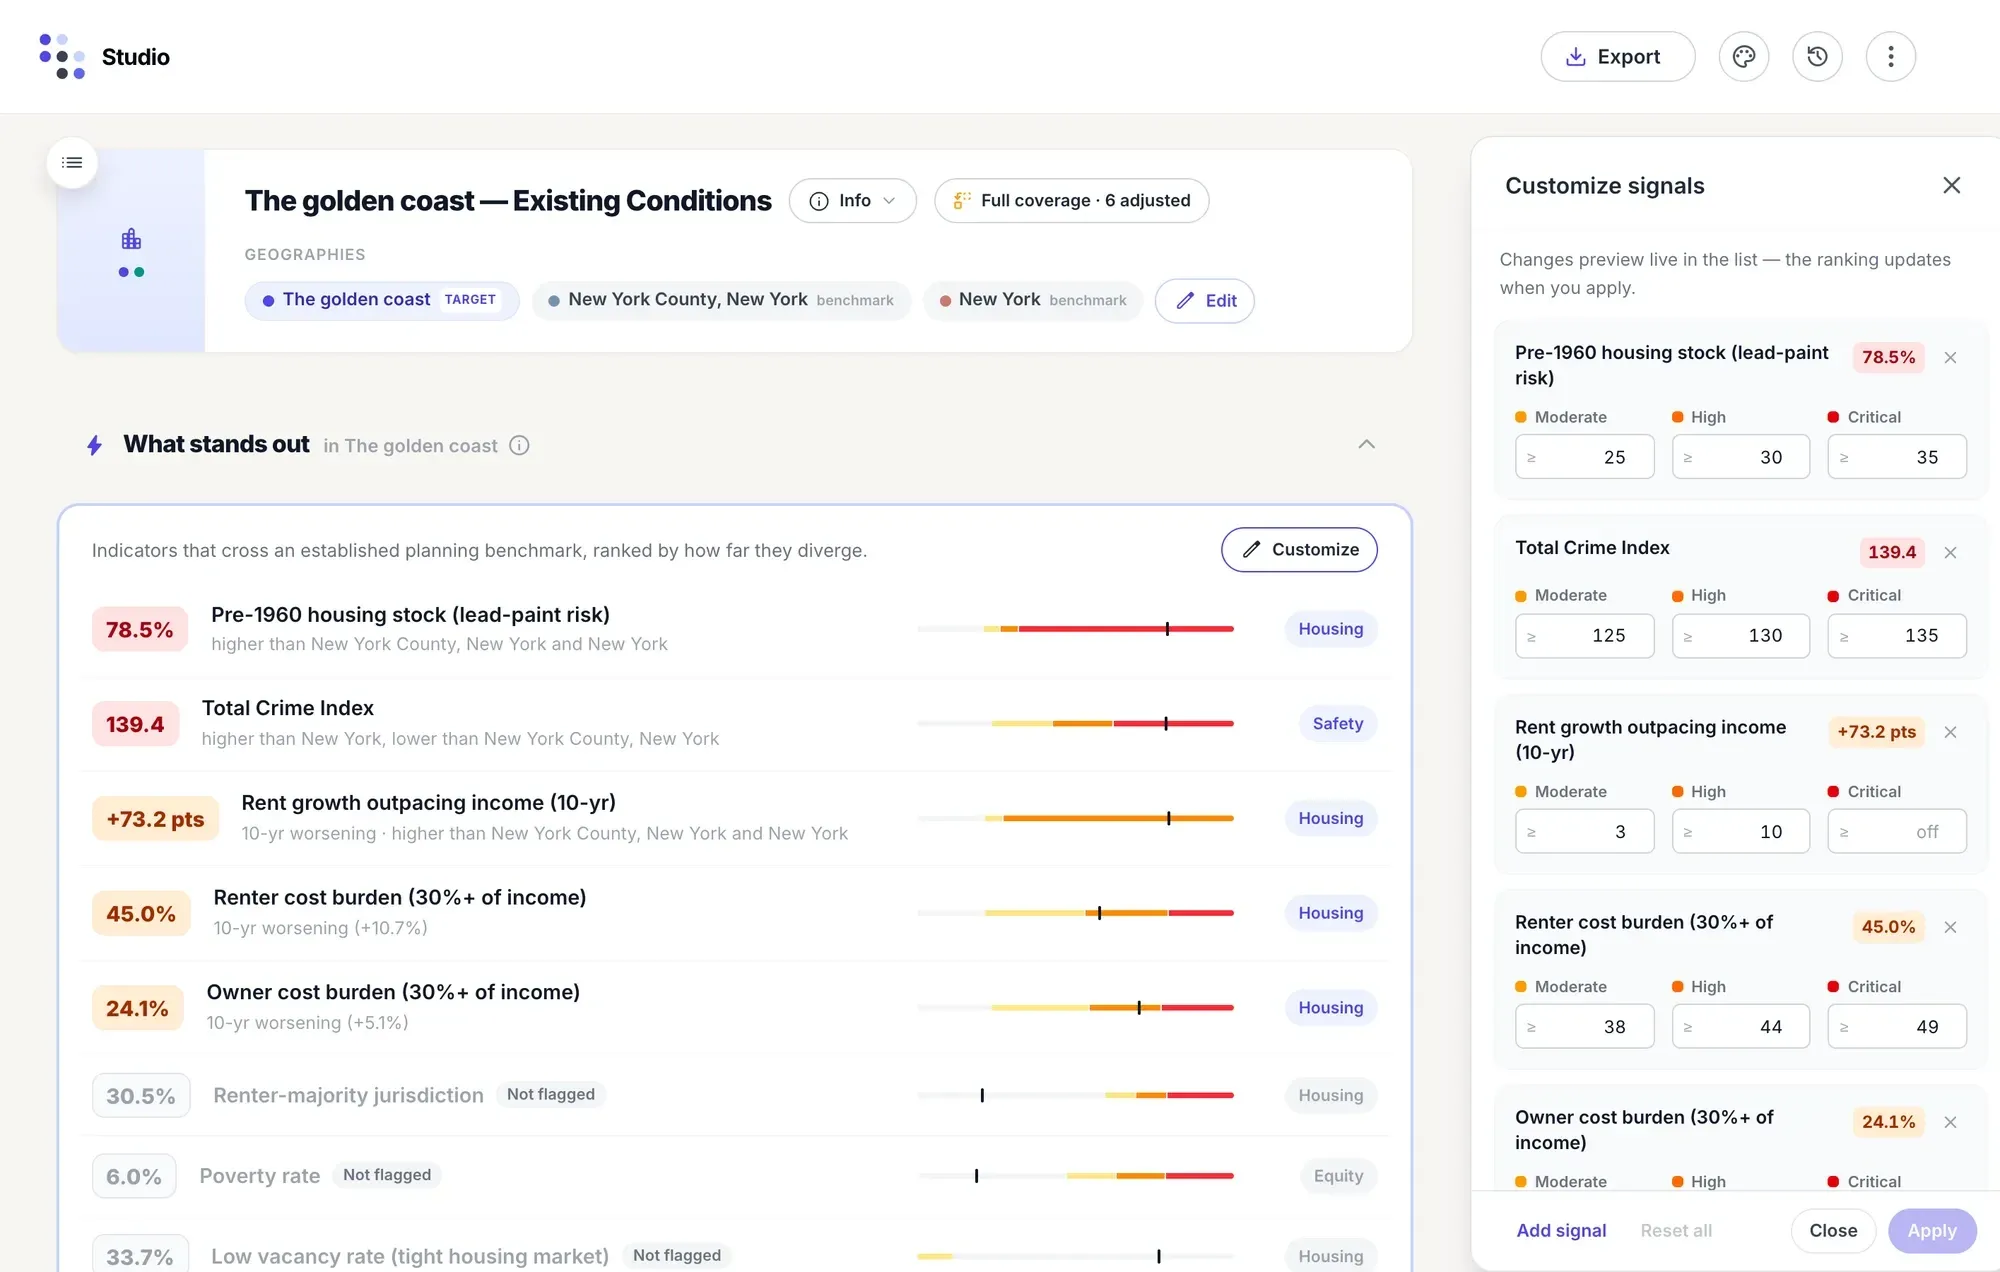
On Manhattan’s “golden coast”, 78.5% of homes were built before 1960 (a lead-paint risk), the crime index runs above the state’s, and rents have outpaced incomes by 73 points over ten years. Each finding says what it was compared against, and the key findings can lead every export.
-
Your thresholds
Set the Moderate, High and Critical cutoffs for each signal, and watch the ranking change before you apply them.
-
Your own signals
Watch any row of the profile: name it, group it (housing, equity, economic, safety), give it a unit and say whether lower is worse.
-
Housing, equity, safety
Cost burden, rent against income, poverty, unemployment, vacancy and crime: the indicators plans and grant programs ask about.
Write it up
Say what the numbers mean.
Add text notes anywhere in a section, and work on a profile together, live. Studio also drafts a summary of each section from its tables, for you to edit.
Studio and its AI section summaries come with Premium and Platinum.
-
AI section summaries
Studio writes a short narrative for each section from its tables. Edit it, copy it or regenerate it; Studio marks a summary as stale when the data under it changes.
-
AI Assistant
Ask the assistant to explain a profile, sum up its key findings, suggest a profile for a place, or build one from a template, without leaving the page.
-
Work together, live
See who else has the profile open, follow their cursors, and watch their edits land as they make them. Activity lists recent edits and exports.
Export and share
From profile to plan document.
Export the whole profile, or just the parts you need, as an editable Word document, a print-ready PDF or an Excel workbook. Word and PDF come with a cover, contents and the key findings, then every table and chart.
-
Your Word template
Word exports use named styles, so attaching your organization’s Word template restyles the whole document to match, with no manual edits.
-
Charts for your slides
Download any table or chart as CSV, Excel, PNG or SVG, ready to drop into a presentation.
-
Templates you can reuse
Save a profile as a template, with a name, a description and a version label, and build the same report for the next place.
Maps in profiles
Put the map in the report.
Add a map of any variable to any section, with the study area outlined and the comparisons dashed. Studio then finds the tracts the average hides, and the ones that qualify for a program.
-
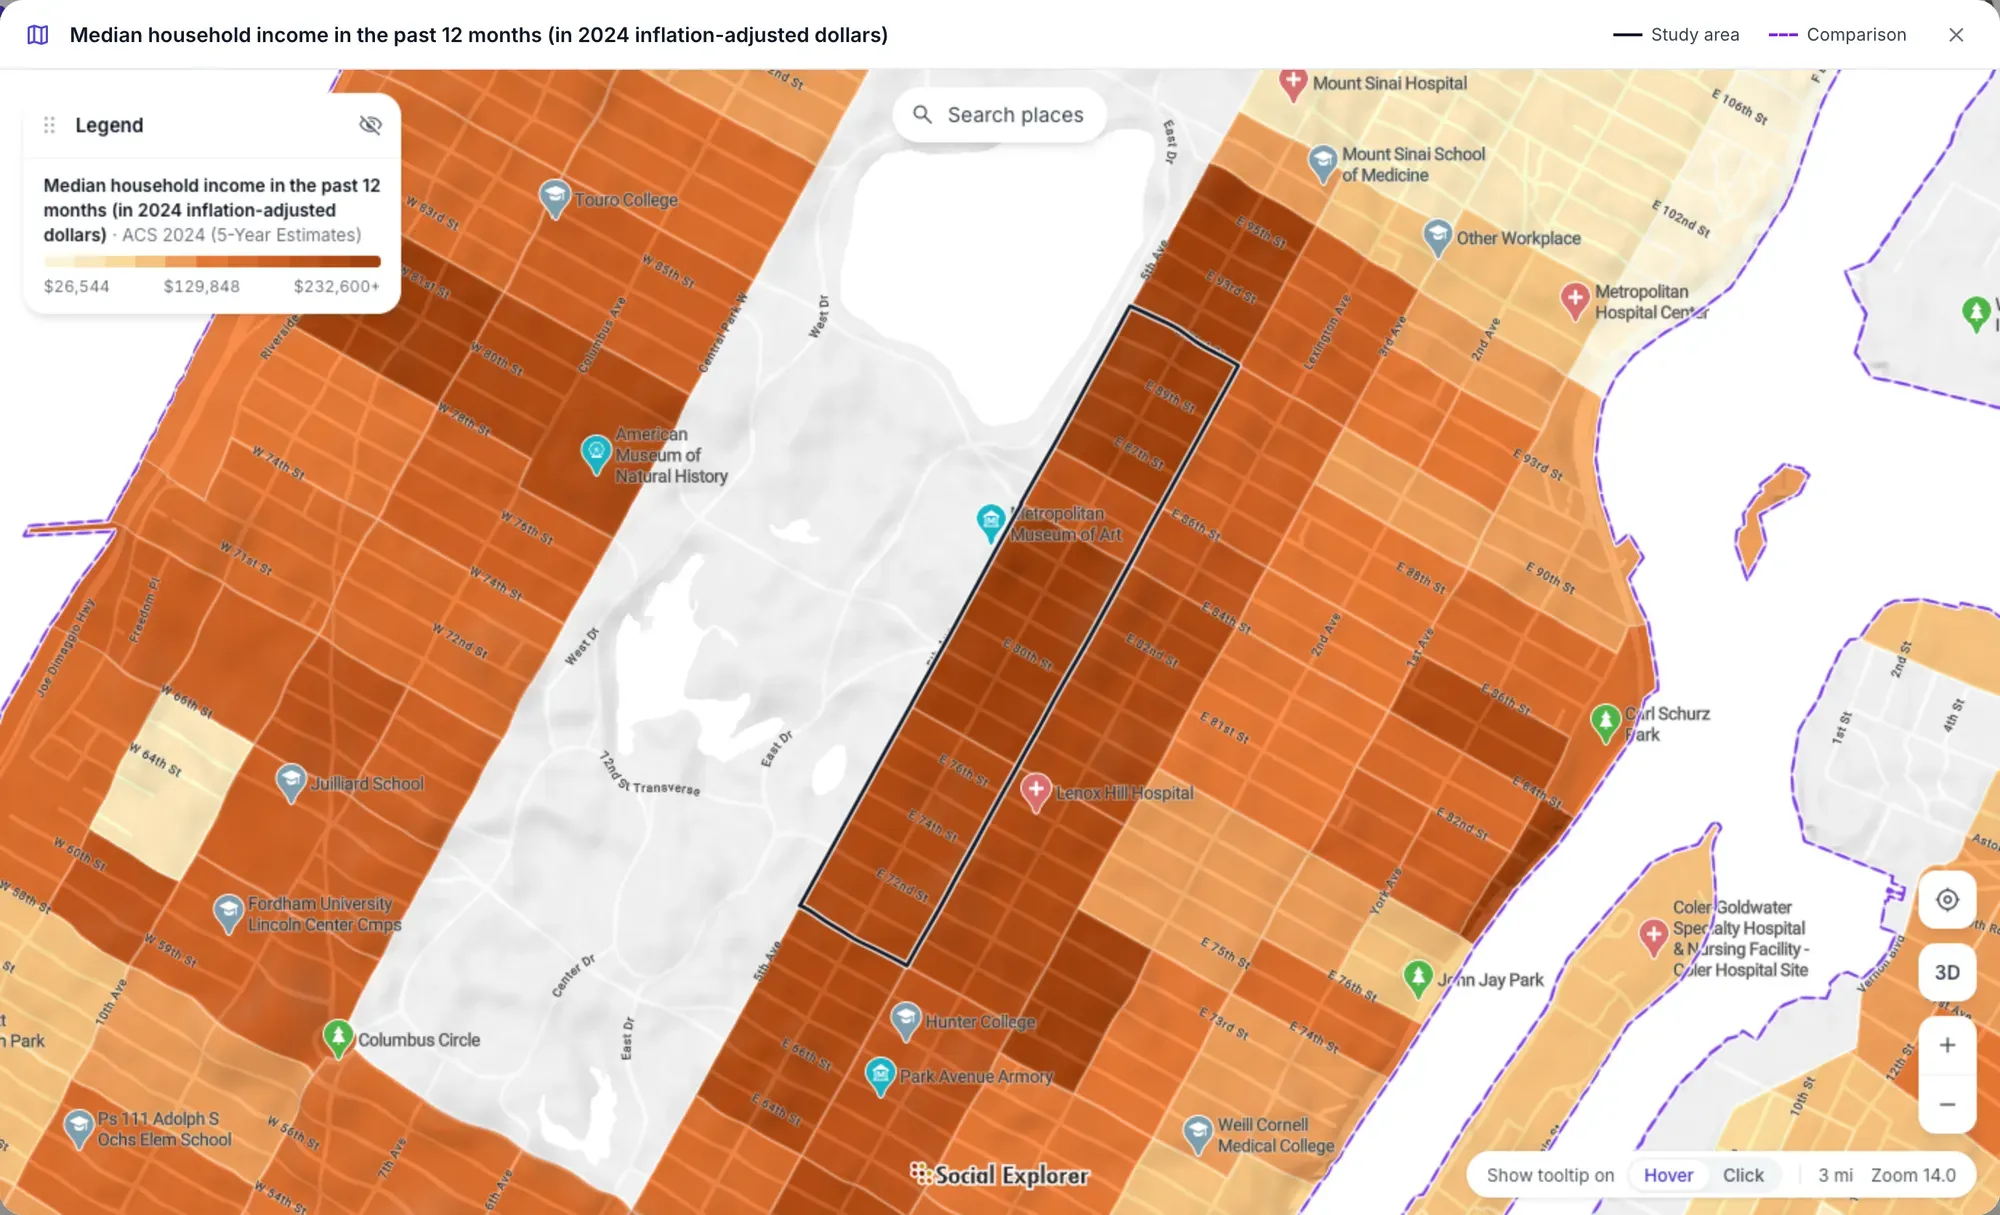
Any variable, mapped. Median household income around the golden coast’s four tracts, outlined in black, with New York County dashed.
-
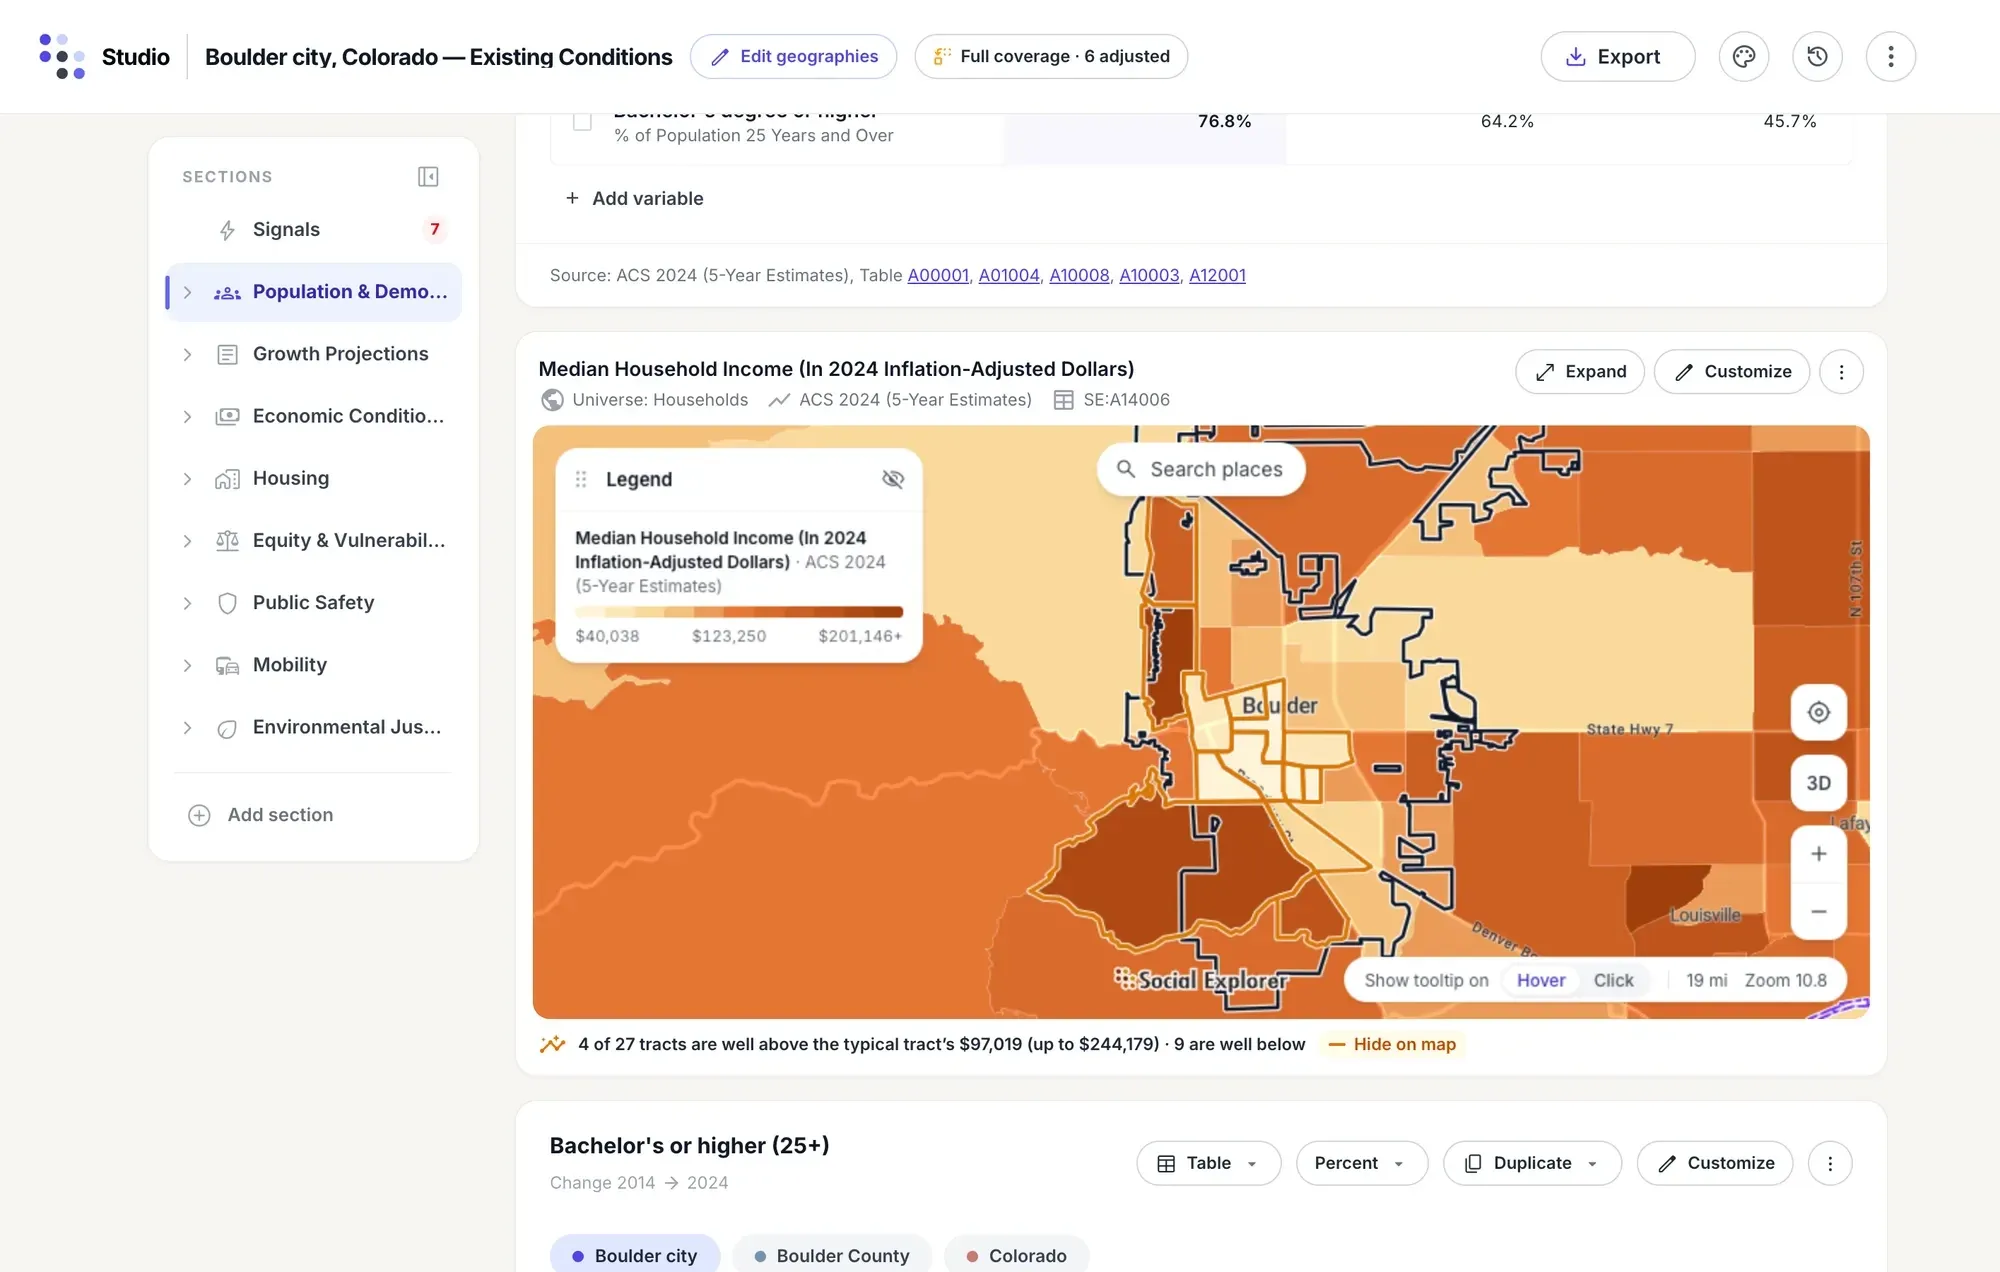
Hidden pockets. Boulder’s typical tract earns $97,019. Under the map, Studio reports that 4 of its 27 tracts are well above that and 9 are well below.
-
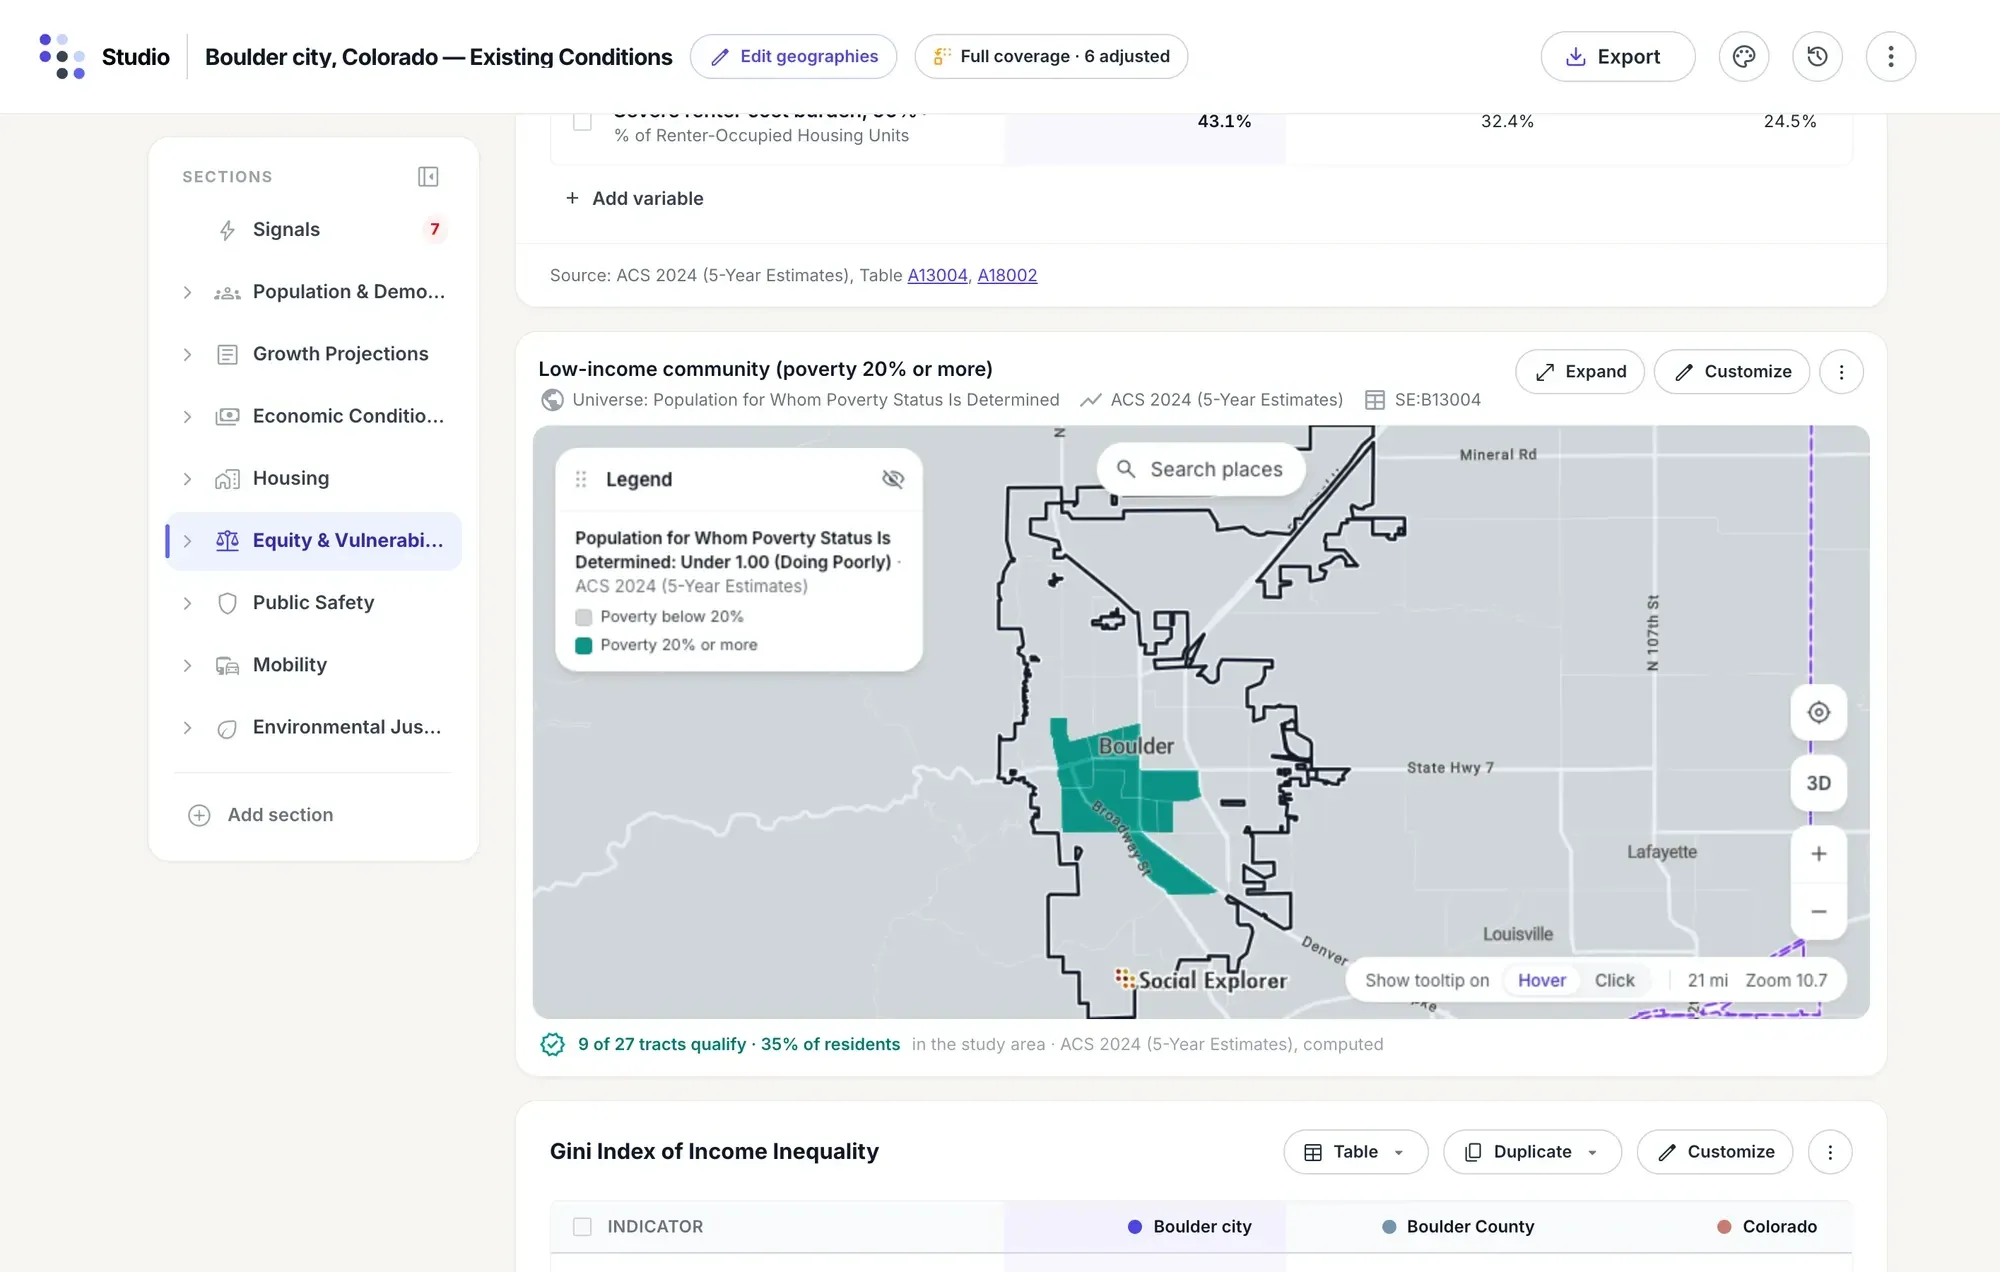
Eligibility maps. Map the tracts that pass a program test: in Boulder, 9 of 27 are low-income communities, home to 35% of the city’s residents.
-
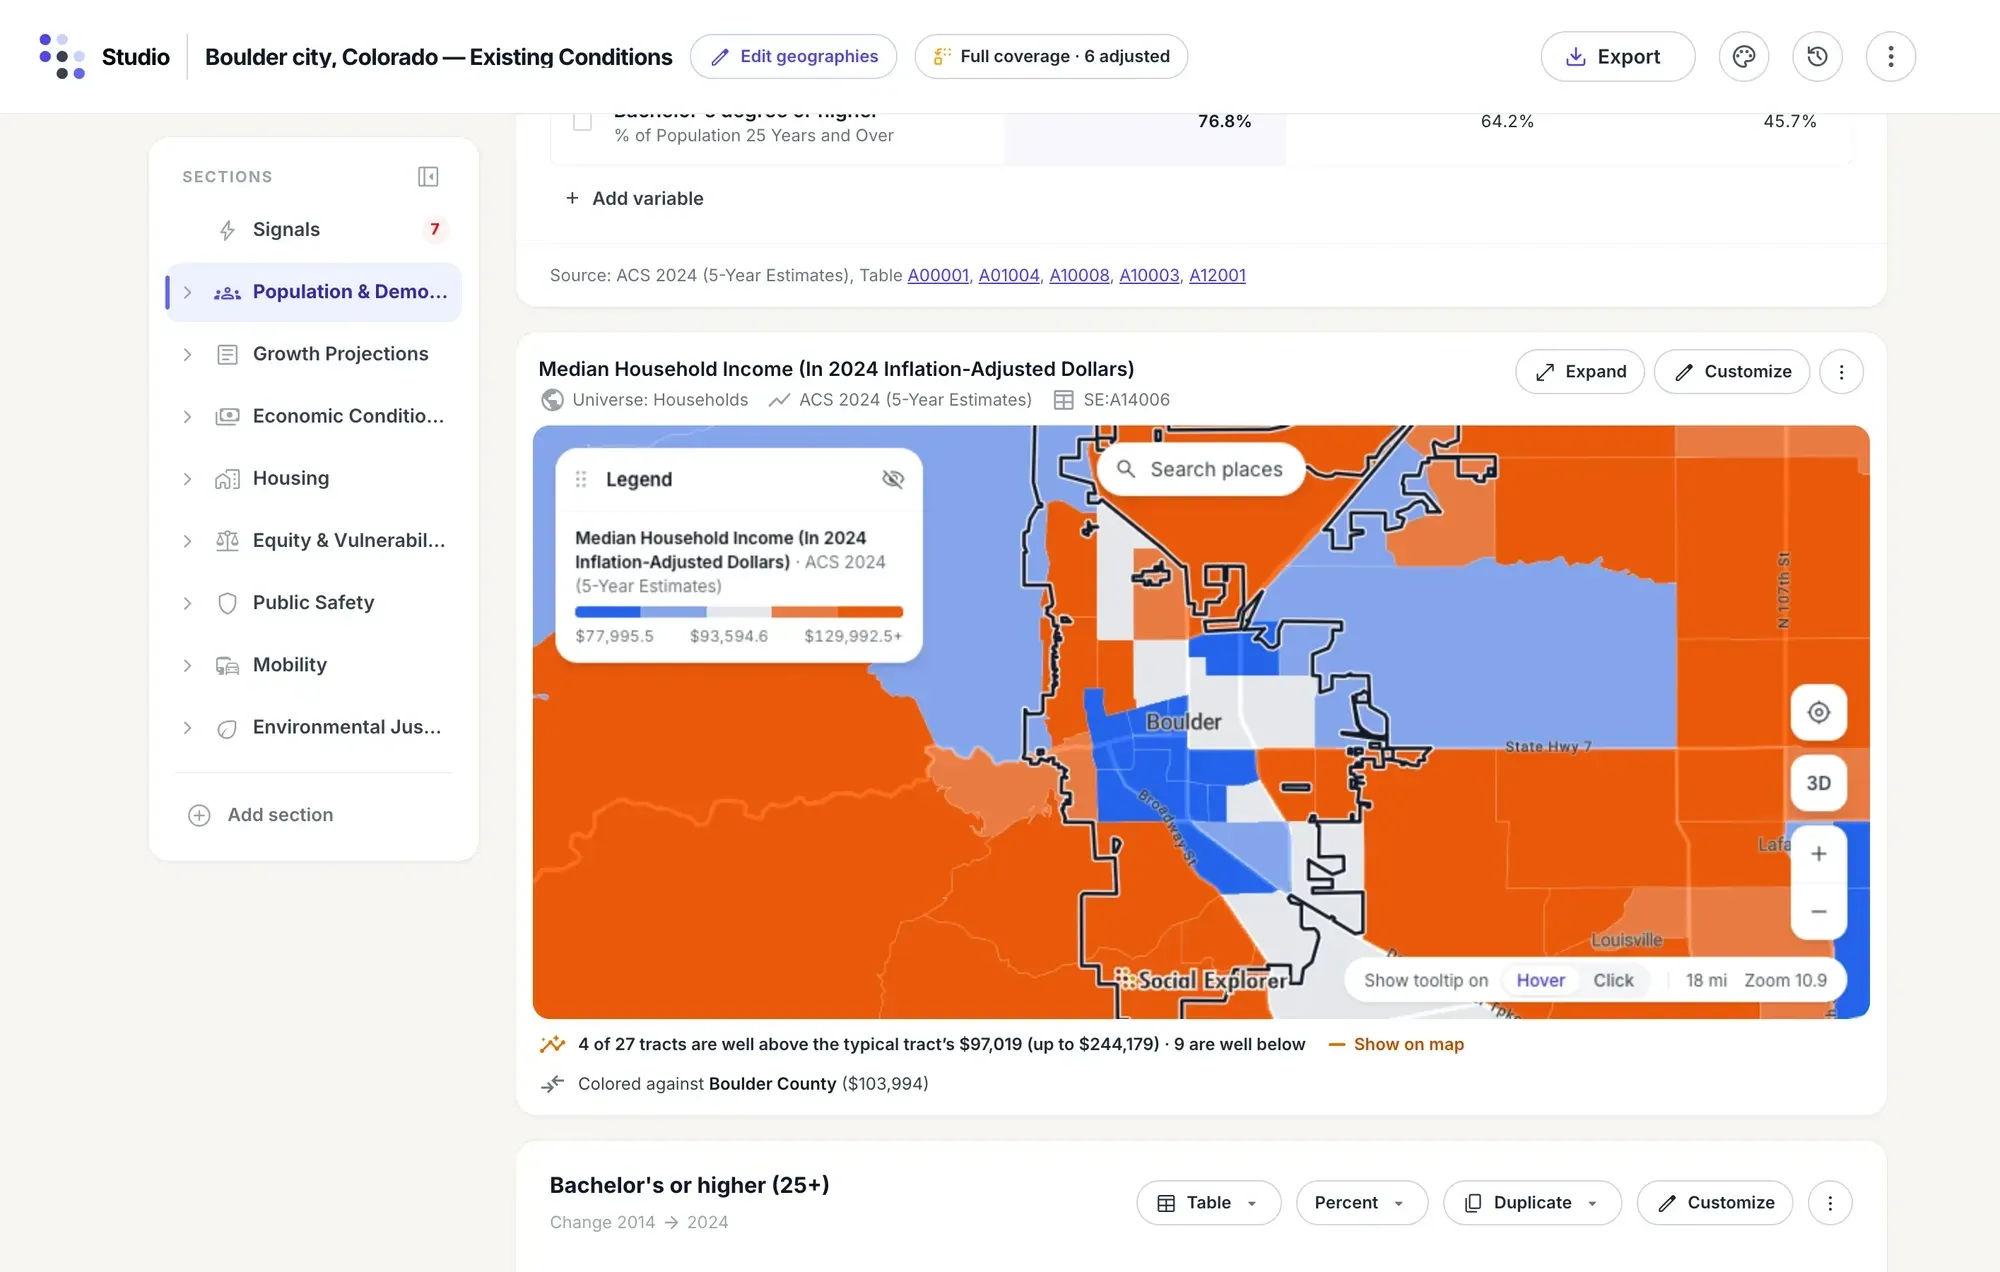
Color against a comparison. Blue where a tract’s income is below Boulder County’s $103,994, orange where it’s above, in bands from 10% to 25% and more.
-
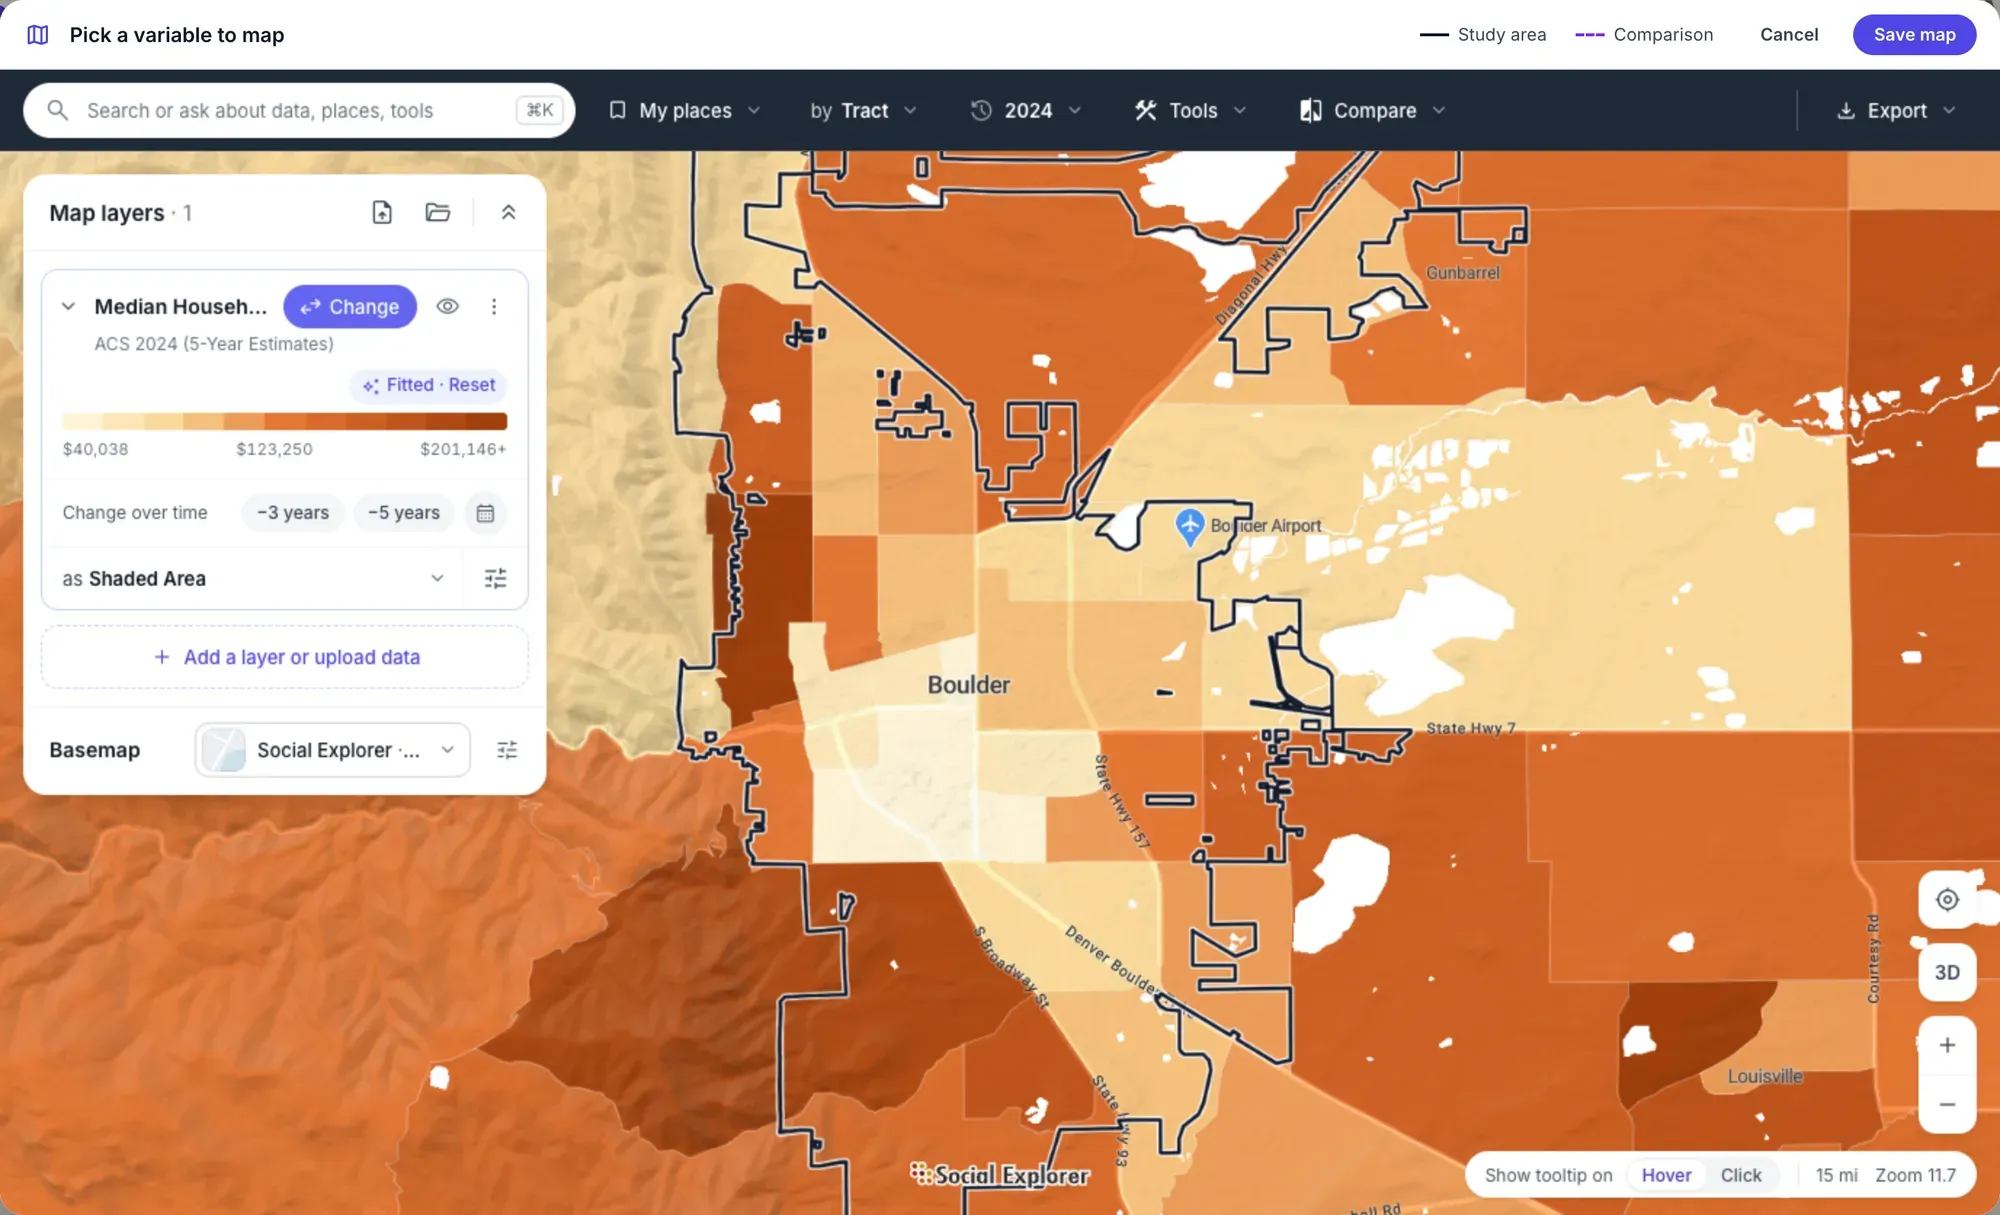
The full map editor. Edit map opens Social Explorer Maps over the profile, and Save map puts the result back in the report.
-
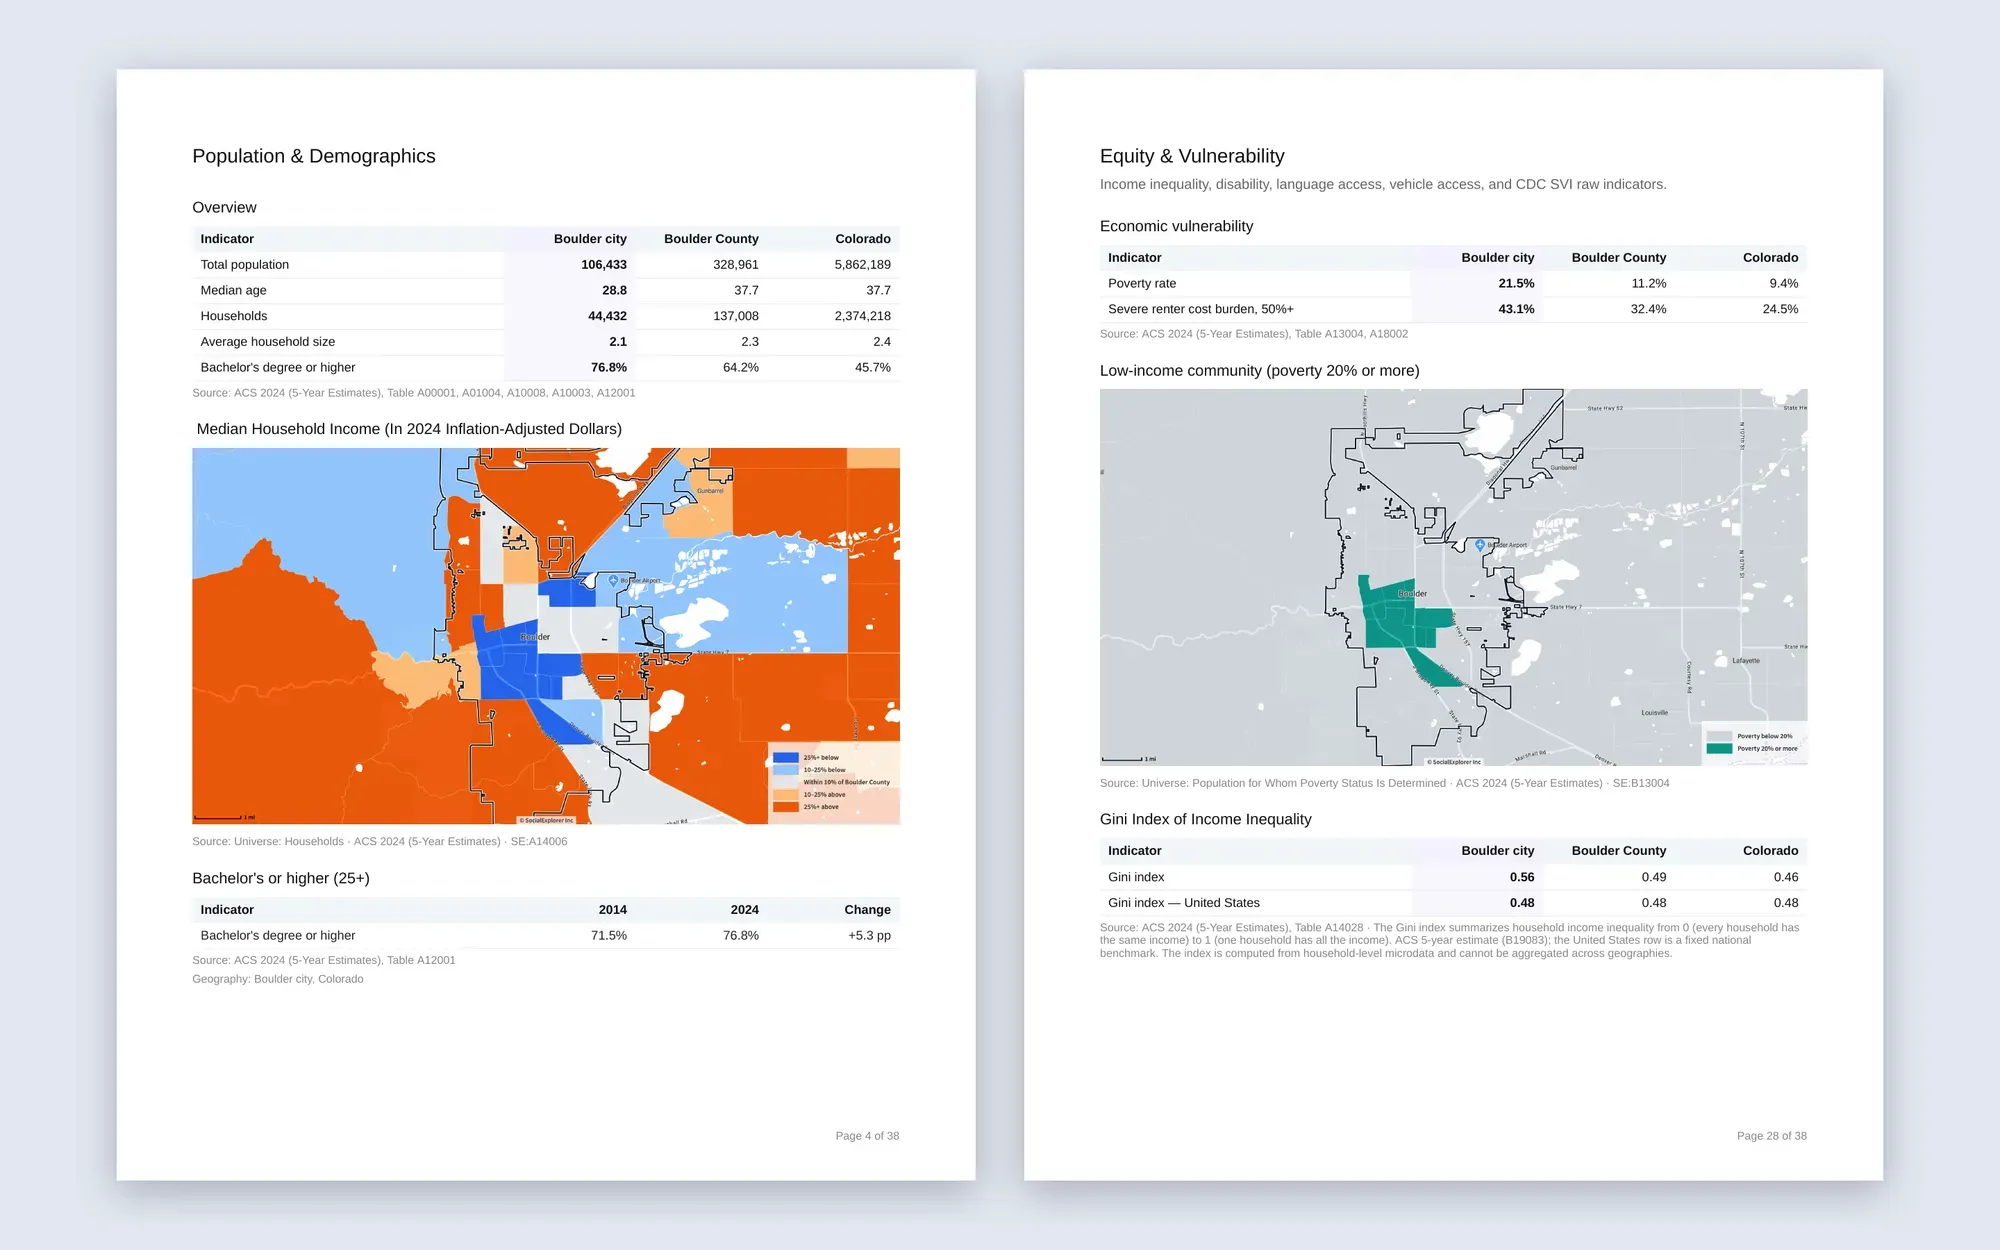
Maps in every export. Word and PDF exports print each map at full resolution, beside its tables and sources.
See the land under the numbers
-
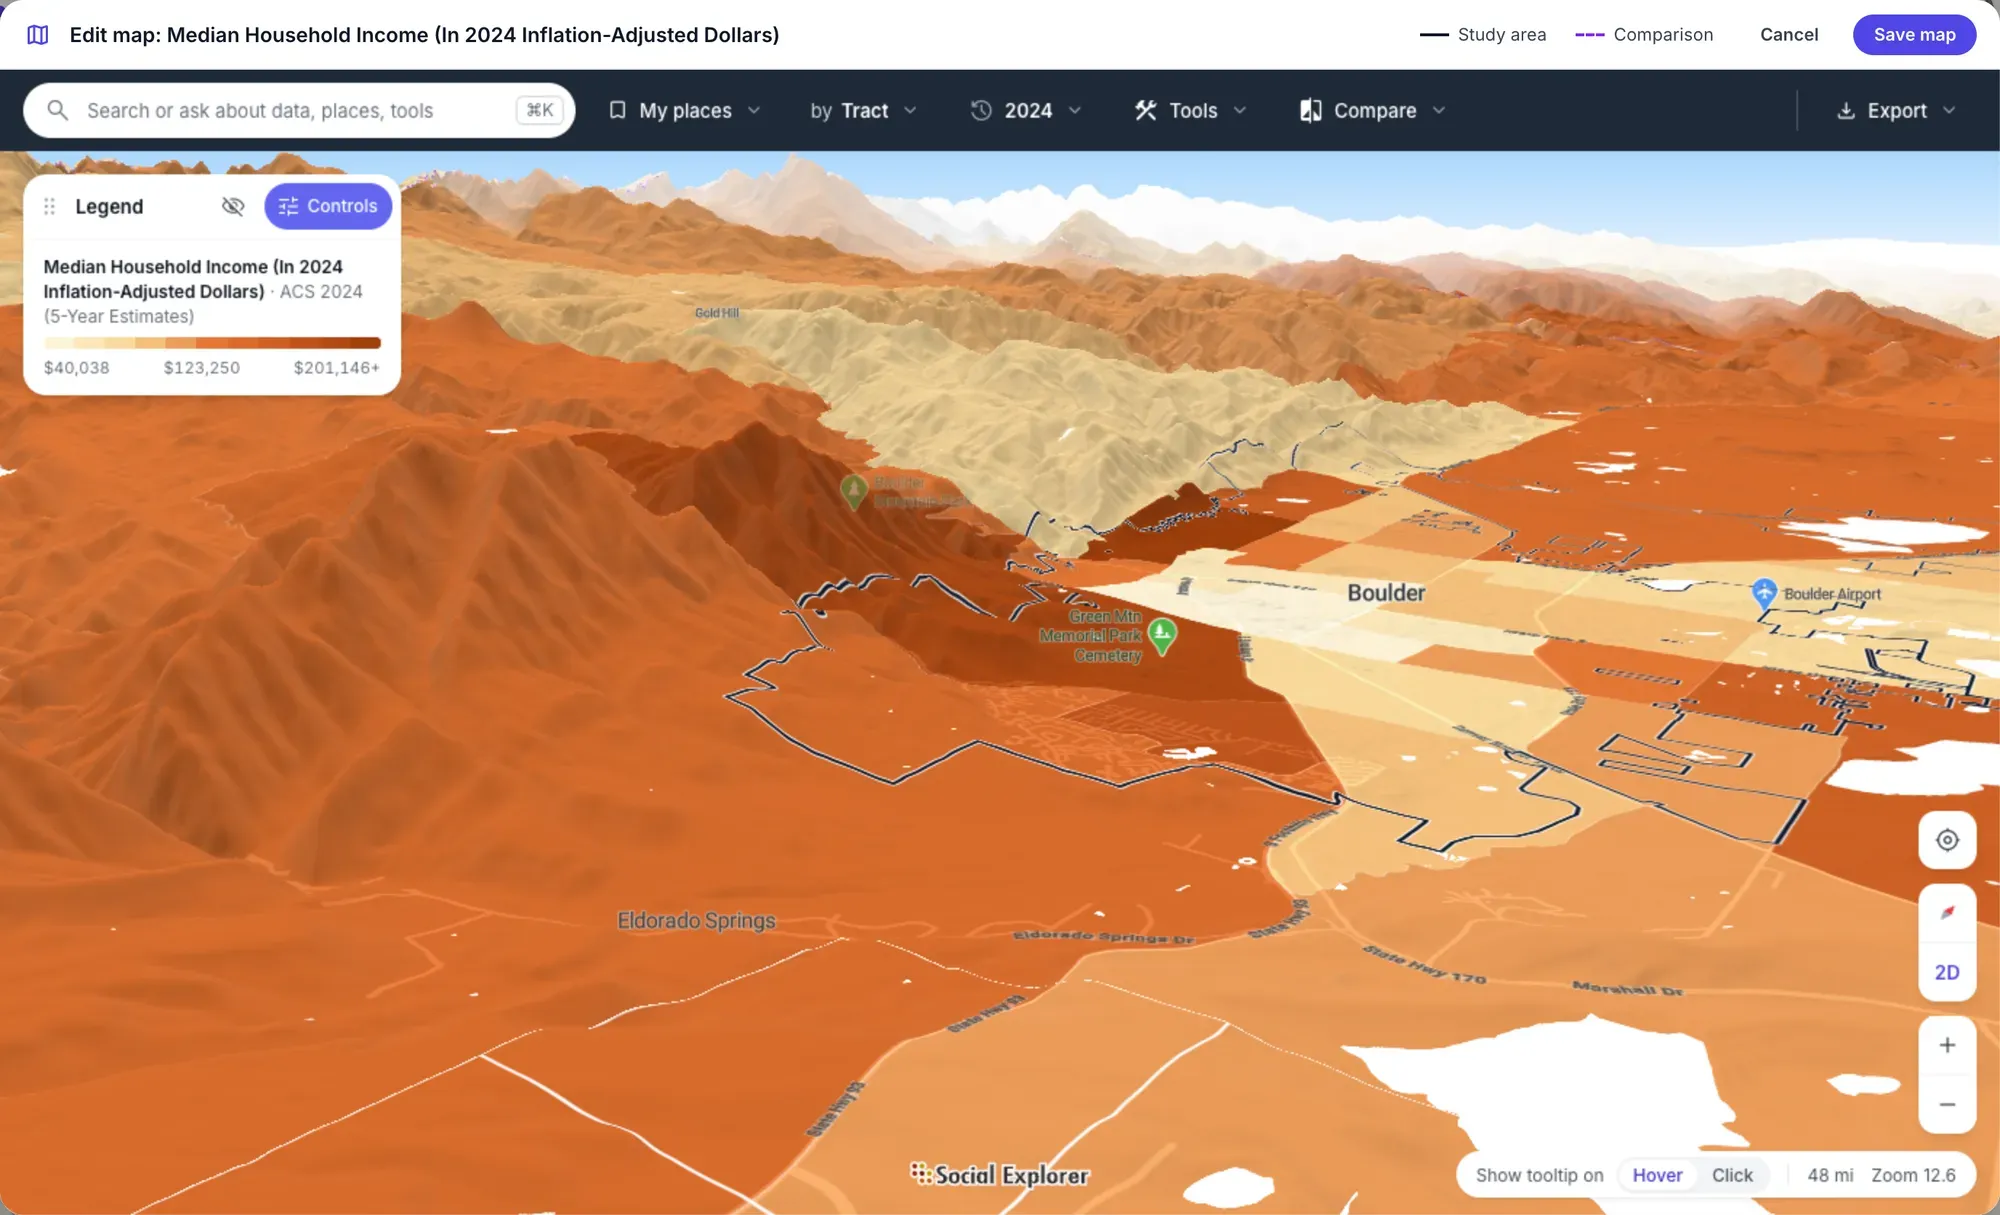
3D terrain. Boulder’s incomes climb the foothills of the Front Range; the plains to the east tell another story.
-
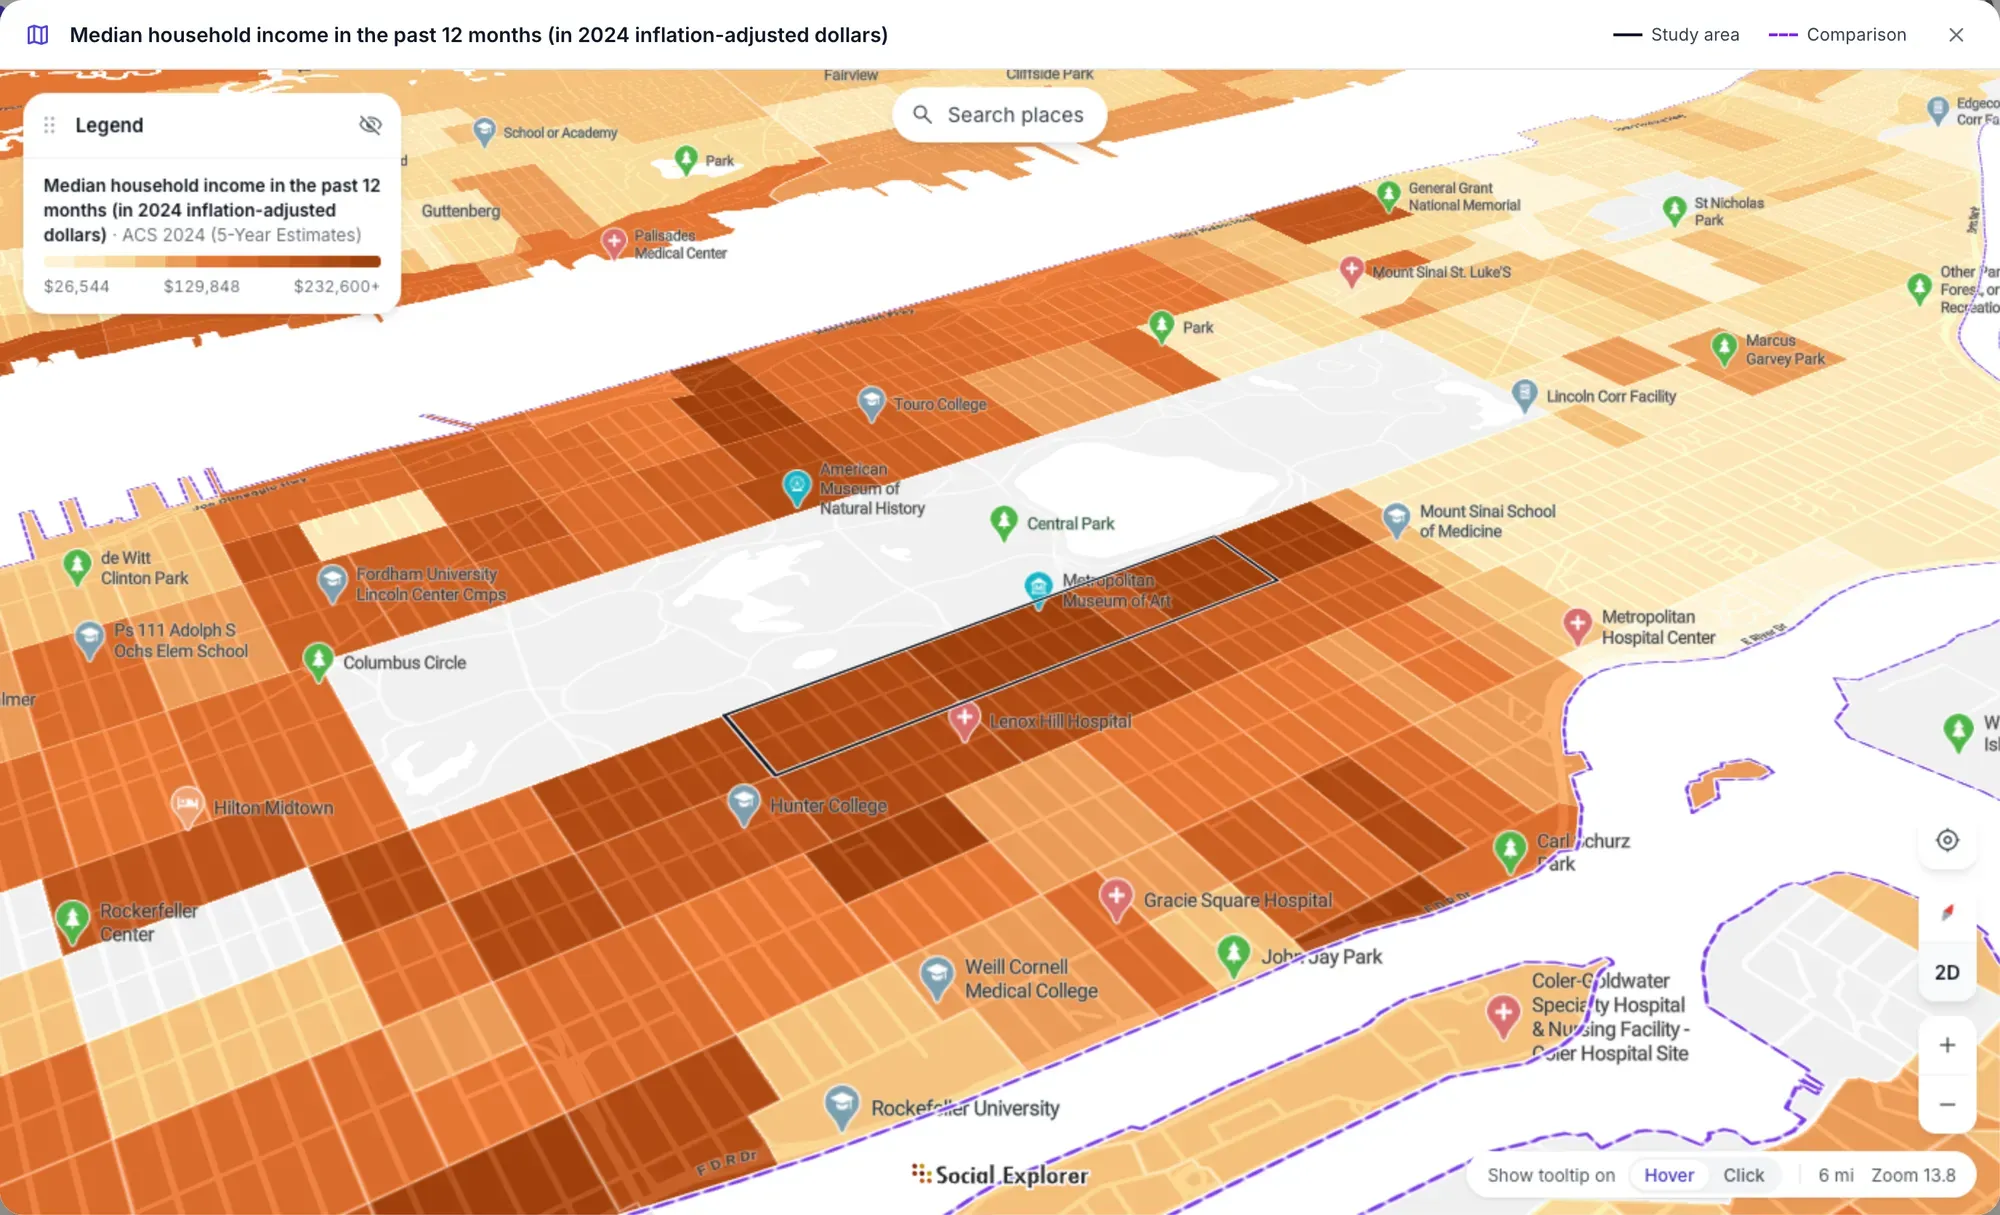
Any profile map, in 3D. Expand any map in a profile and tilt it into 3D, as with the golden coast’s income map.
For planners, researchers and anyone who presents a place.
-
City and county planners
Build the existing-conditions chapter of a comprehensive plan for any neighborhood, with the county and state beside it and the findings up front.
GIS data for urban planning -
Housing and community development
Assemble the needs assessment and market analysis for a HUD Consolidated Plan: cost burden, affordability and special-needs populations.
Community needs -
Economic development
Profile a region’s labor force, industries and wages for a CEDS, with location quotients and the distress-eligibility screen.
Public sector data analytics -
Grant writers and nonprofits
Pull the numbers a grant application asks for, beside the county and state, and cite every one, then map exactly which tracts qualify.
Nonprofits -
Consultants
Turn a client’s study area into an editable report, styled with their Word template, and reuse the setup for the next client.
Business -
Public health and equity teams
Profile vulnerability, environmental burden and access to services for any neighborhood, and see how it compares with its county and state.
Social equity analysis
Questions about Studio
What software do urban planners use?
Planners usually combine GIS for mapping and spatial analysis, design tools for sites and streets, and data tools for the demographic and economic chapters of a plan. Studio is Social Explorer’s urban planning software for that data work: it builds community profiles from census and other public data, with each place beside its county and state.
What reports can Studio build?
Social Explorer Studio has four ready-made planning reports: Existing Conditions, a HUD Consolidated Plan, a Comprehensive Economic Development Strategy (CEDS) and a Comprehensive Plan Update. You can also save your own template. An Existing Conditions profile draws on 14 data sources, and every report opens with the findings that cross a planning benchmark.
Where does Studio’s data come from?
Studio’s data comes from the latest American Community Survey and more than a dozen other sources in Social Explorer’s data library. Before a profile is built, Studio checks every source against every place and fills gaps with the closest stand-in, labeled Exact fit or Loose fit. Each value can show how it was calculated.
Can I edit and export a Studio profile?
Yes. Every section of a Studio profile stays editable: reorder it, change how a table or chart shows, add any variable from the catalog and explain what stands out. Export the whole profile or parts of it as an editable Word document, a print-ready PDF or an Excel workbook, styled with your own Word template if you like.
Does Studio put maps in profiles?
Yes. Add a map of any variable to any section of a Studio profile, with the study area outlined and the comparisons dashed. Studio reports the tracts the average hides and the ones that qualify for a program, and you can tilt any map into 3D terrain. Word and PDF exports print the maps beside their tables.
The rest of the platform.
Videos and screenshots show Social Explorer Studio with American Community Survey 2024 5-year estimates and other public data.