

Arizona: Population, demographics and census data
Home to 7,623,818 people, the 14th largest of the 50 states and DC, anchored by Phoenix and Tucson. It grew 11.7% between 2015 and 2025.
- Population
- 7.62M. Census Bureau estimate · Rank 14 of the 50 states and DC
- Median household income
- $82,940 ±$1,117. US $84,780
- Median age
- 39.5 ±0.2. US 39.5
ACS 2025 1-year estimates, U.S. Census Bureau
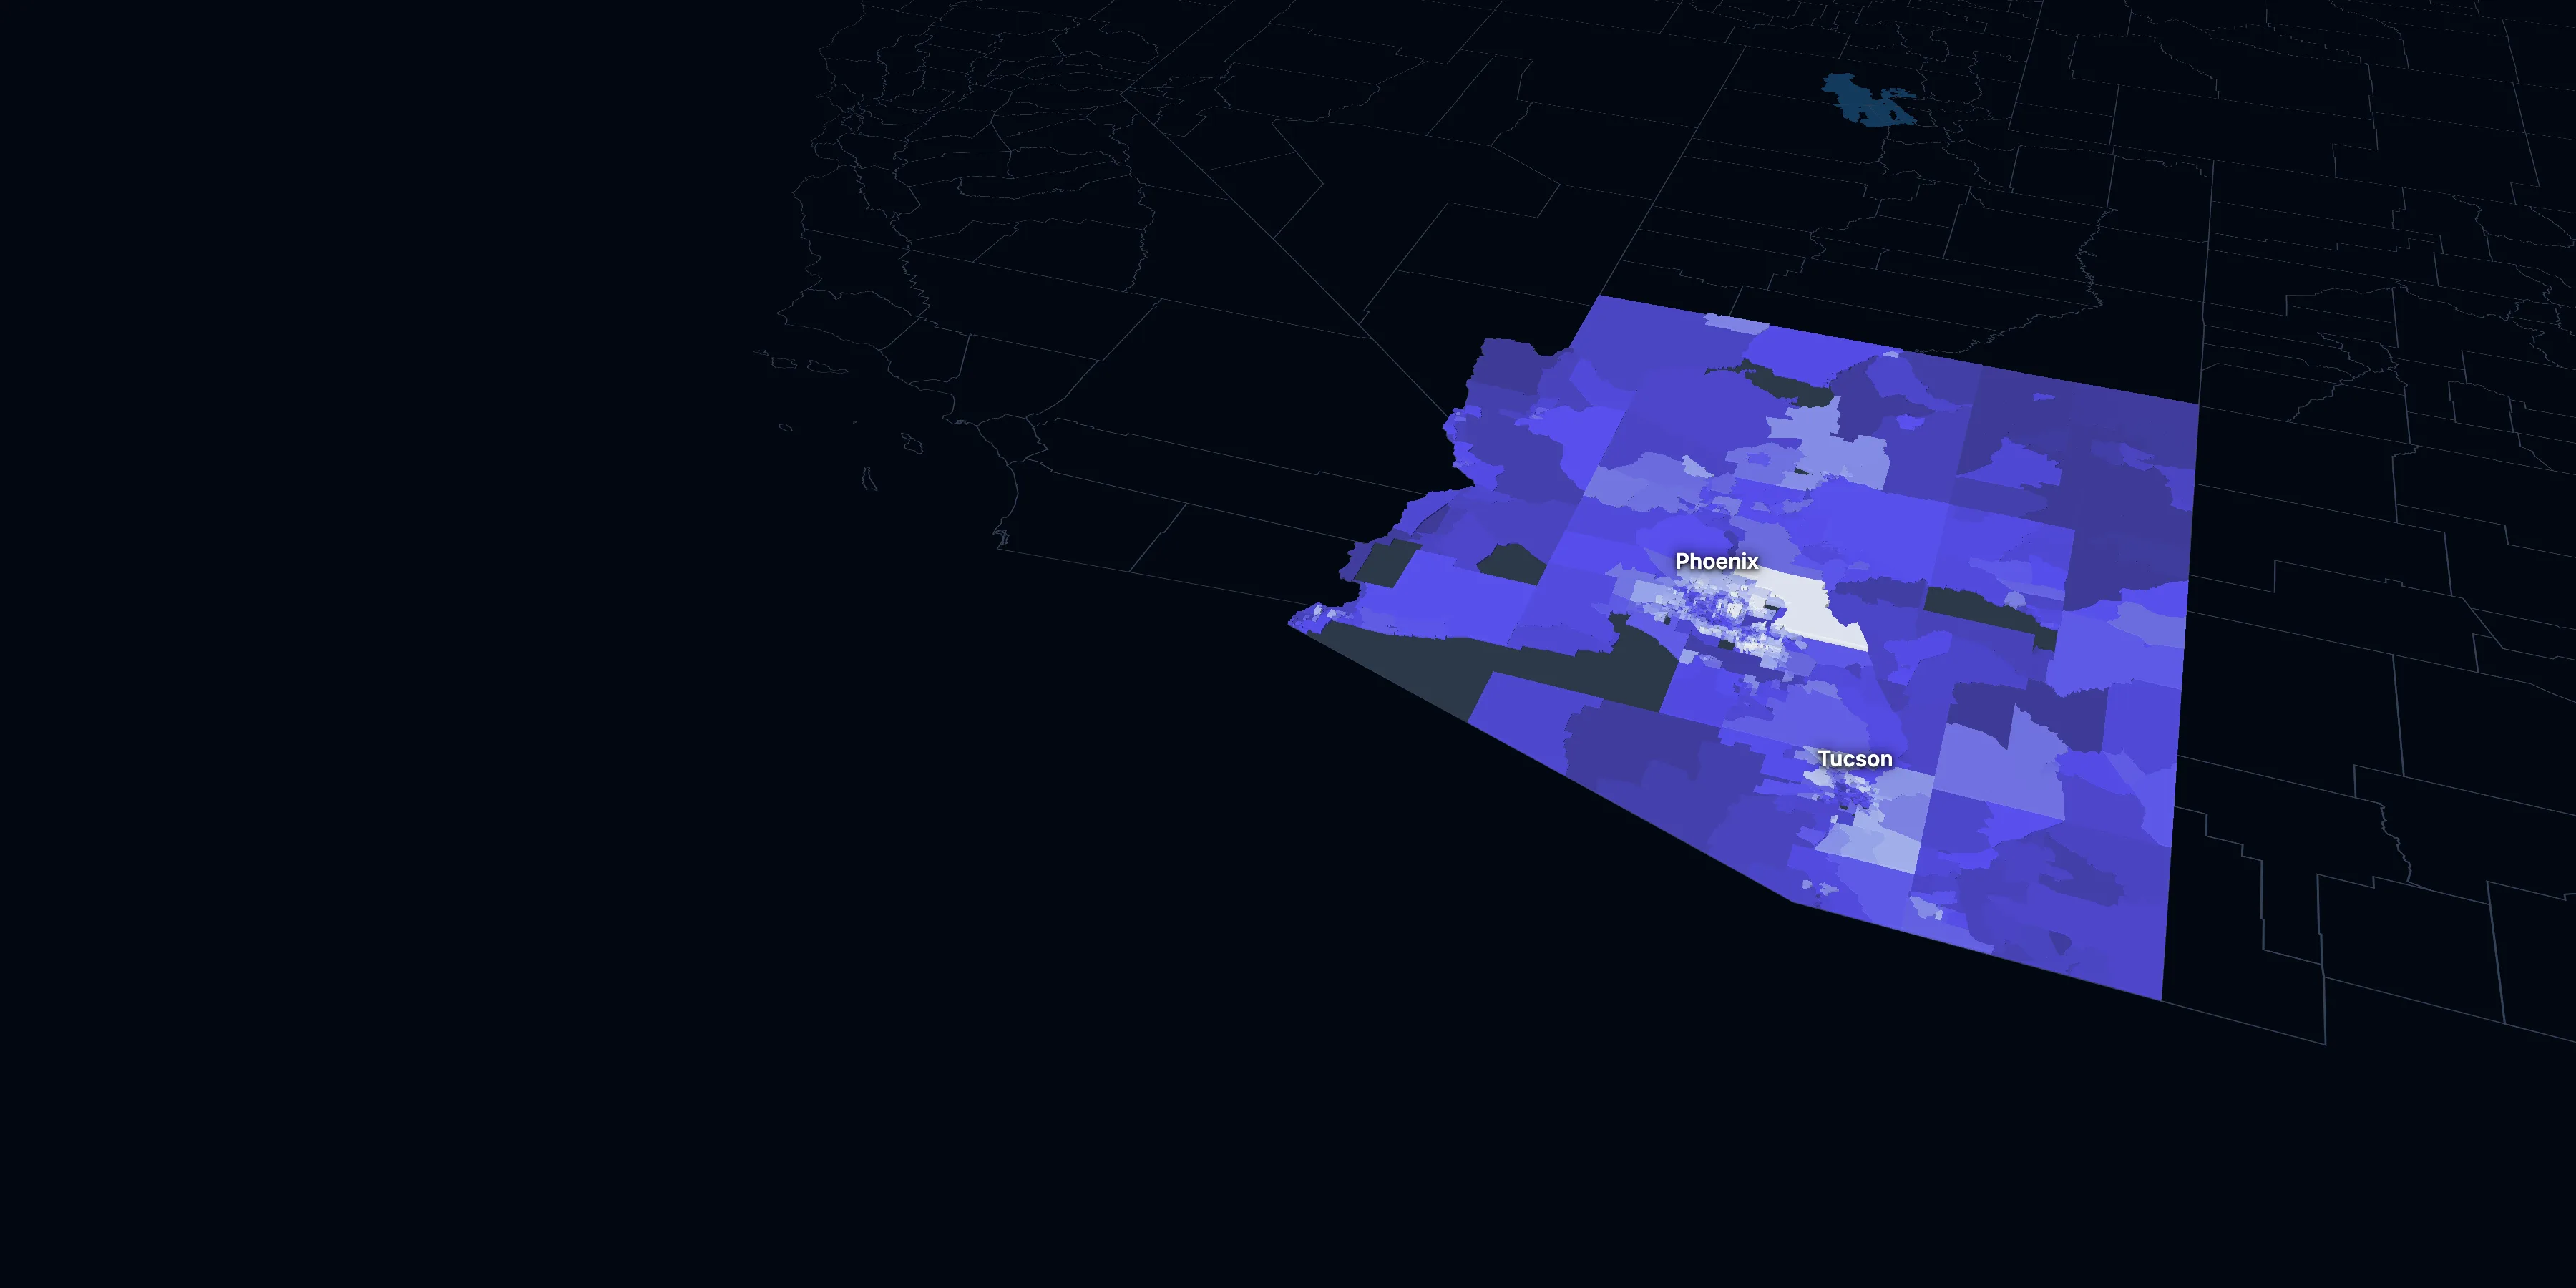
Taller, lighter tracts have higher household incomes
About Arizona
Arizona’s median household income is $82,940 (±$1,117), lower than the US ($84,780), and its median age is 39.5 (±0.2), according to the ACS 2025 1-year estimates. Its largest city is Phoenix.
± is each figure’s margin of error, at 90% confidence, and † marks one too uncertain to lean on. Under each percentage in the tables is the number it counts. How the margins are worked out.
FIPS code 04
Highlights
What stands out in Arizona
The numbers where Arizona sits furthest from the nation, or past a recognized policy benchmark.
Past a policy benchmark
50.5%
Very highRenters paying 30% or more of income
That’s higher than the US (48.3%). HUD counts households paying 30% or more of income on housing as cost-burdened.
+15 points
HighRent growth ahead of income
After inflation, rent grew 33% from 2015 to 2025, and household income 18%. The dots show rent growth.
Furthest from the national picture
11.8%
Higher than the USNo health insurance
That’s higher than the US (8.4%).
7.5%
Higher than the USVeterans (adults)
That’s higher than the US (5.9%).
20.6%
Higher than the US65 and over
That’s higher than the US (19.0%).
16.2%
Higher than the USWork from home
That’s higher than the US (12.9%). It’s the 7th highest of the 50 states and DC.
2015 to 2025
How Arizona changed in ten years
The state added 795,753 people. It got older and better educated, and poverty fell 5.6 points.
Population, change since 2015
+11.7% in the state and +6.3% in the US.
Source: ACS 1-year, 2015 to 2025, table A00001.
Show data
| Arizona | United States | |
|---|---|---|
| 2015 | 0.0% | 0.0% |
| 2016 | +1.5% | +0.5% |
| 2017 | +2.8% | +1.3% |
| 2018 | +5.0% | +1.8% |
| 2019 | +6.6% | +2.1% |
| 2021 | +6.6% | +3.3% |
| 2022 | +7.8% | +3.7% |
| 2023 | +8.8% | +4.2% |
| 2024 | +11.0% | +5.8% |
| 2025 | +11.7% | +6.3% |
Embed
Median household income, in 2025 dollars
+17.6% in the state and +10.9% in the US.
Source: ACS 1-year, 2015 to 2025, table A14006.
Show data
| Arizona | United States | |
|---|---|---|
| 2015 | $70,545 | $76,413 |
| 2016 | $72,441 | $77,931 |
| 2017 | $74,919 | $79,891 |
| 2018 | $76,581 | $80,059 |
| 2019 | $78,784 | $83,427 |
| 2021 | $82,729 | $83,521 |
| 2022 | $82,604 | $82,811 |
| 2023 | $82,254 | $82,683 |
| 2024 | $84,217 | $84,339 |
| 2025 | $82,940 | $84,780 |
Embed
Living in poverty
−5.6 points in the state and −3.0 points in the US.
Source: ACS 1-year, 2015 to 2025, table A13004.
Show data
| Arizona | United States | |
|---|---|---|
| 2015 | 17.4% | 14.7% |
| 2016 | 16.4% | 14.0% |
| 2017 | 14.9% | 13.4% |
| 2018 | 14.0% | 13.1% |
| 2019 | 13.5% | 12.3% |
| 2021 | 12.8% | 12.8% |
| 2022 | 12.5% | 12.6% |
| 2023 | 12.4% | 12.5% |
| 2024 | 11.7% | 12.1% |
| 2025 | 11.8% | 11.8% |
Embed
Bachelor’s degree or more
+6.6 points in the state and +6.7 points in the US.
Source: ACS 1-year, 2015 to 2025, table A12001.
Show data
| Arizona | United States | |
|---|---|---|
| 2015 | 27.7% | 30.6% |
| 2016 | 28.9% | 31.3% |
| 2017 | 29.4% | 32.0% |
| 2018 | 29.7% | 32.6% |
| 2019 | 30.2% | 33.1% |
| 2021 | 32.4% | 35.0% |
| 2022 | 33.0% | 35.7% |
| 2023 | 33.5% | 36.2% |
| 2024 | 34.7% | 36.8% |
| 2025 | 34.3% | 37.4% |
Embed
Median gross rent, in 2025 dollars
+32.9% in the state and +18.5% in the US.
Source: ACS 1-year, 2015 to 2025, table A18009.
Show data
| Arizona | United States | |
|---|---|---|
| 2015 | $1,278 | $1,314 |
| 2016 | $1,320 | $1,327 |
| 2017 | $1,351 | $1,340 |
| 2018 | $1,339 | $1,368 |
| 2019 | $1,398 | $1,393 |
| 2021 | $1,501 | $1,427 |
| 2022 | $1,606 | $1,440 |
| 2023 | $1,711 | $1,496 |
| 2024 | $1,728 | $1,537 |
| 2025 | $1,698 | $1,557 |
Embed
Median home value, in 2025 dollars
+60.6% in the state and +39.3% in the US.
Source: ACS 1-year, 2015 to 2025, table A10036.
Show data
| Arizona | United States | |
|---|---|---|
| 2015 | $266,195 | $266,469 |
| 2016 | $278,495 | $277,278 |
| 2017 | $295,804 | $288,124 |
| 2018 | $311,644 | $296,908 |
| 2019 | $324,888 | $305,336 |
| 2021 | $402,886 | $337,116 |
| 2022 | $446,207 | $355,481 |
| 2023 | $437,466 | $361,931 |
| 2024 | $440,277 | $372,685 |
| 2025 | $427,600 | $371,100 |
Embed
ACS 1-year estimates. The dotted stretch of each line spans 2020, when the Census Bureau released no standard 1-year estimates. Dollar values are in 2025 dollars.
| Indicator | 2015 | 2025 | Change |
|---|---|---|---|
| Population | 6,828,065 | 7,623,818 | +11.7% |
| Median age | 37.4 | 39.5 | +2.1 years |
| 65 and over | 16.4% | 20.6% | +4.2 points |
| Born outside the US | 13.4% | 13.2% | −0.2 points |
| Hispanic or Latino | 30.7% | 32.5% | +1.8 points |
| Median household income | $70,545 | $82,940 | +17.6% |
| Living in poverty | 17.4% | 11.8% | −5.6 points |
| Bachelor’s degree or more | 27.7% | 34.3% | +6.6 points |
| Households that rent | 38.1% | 33.3% | −4.8 points |
| Median gross rent | $1,278 | $1,698 | +32.9% |
| Median home value | $266,195 | $427,600 | +60.6% |
1765 census tracts
Arizona, tract by tract
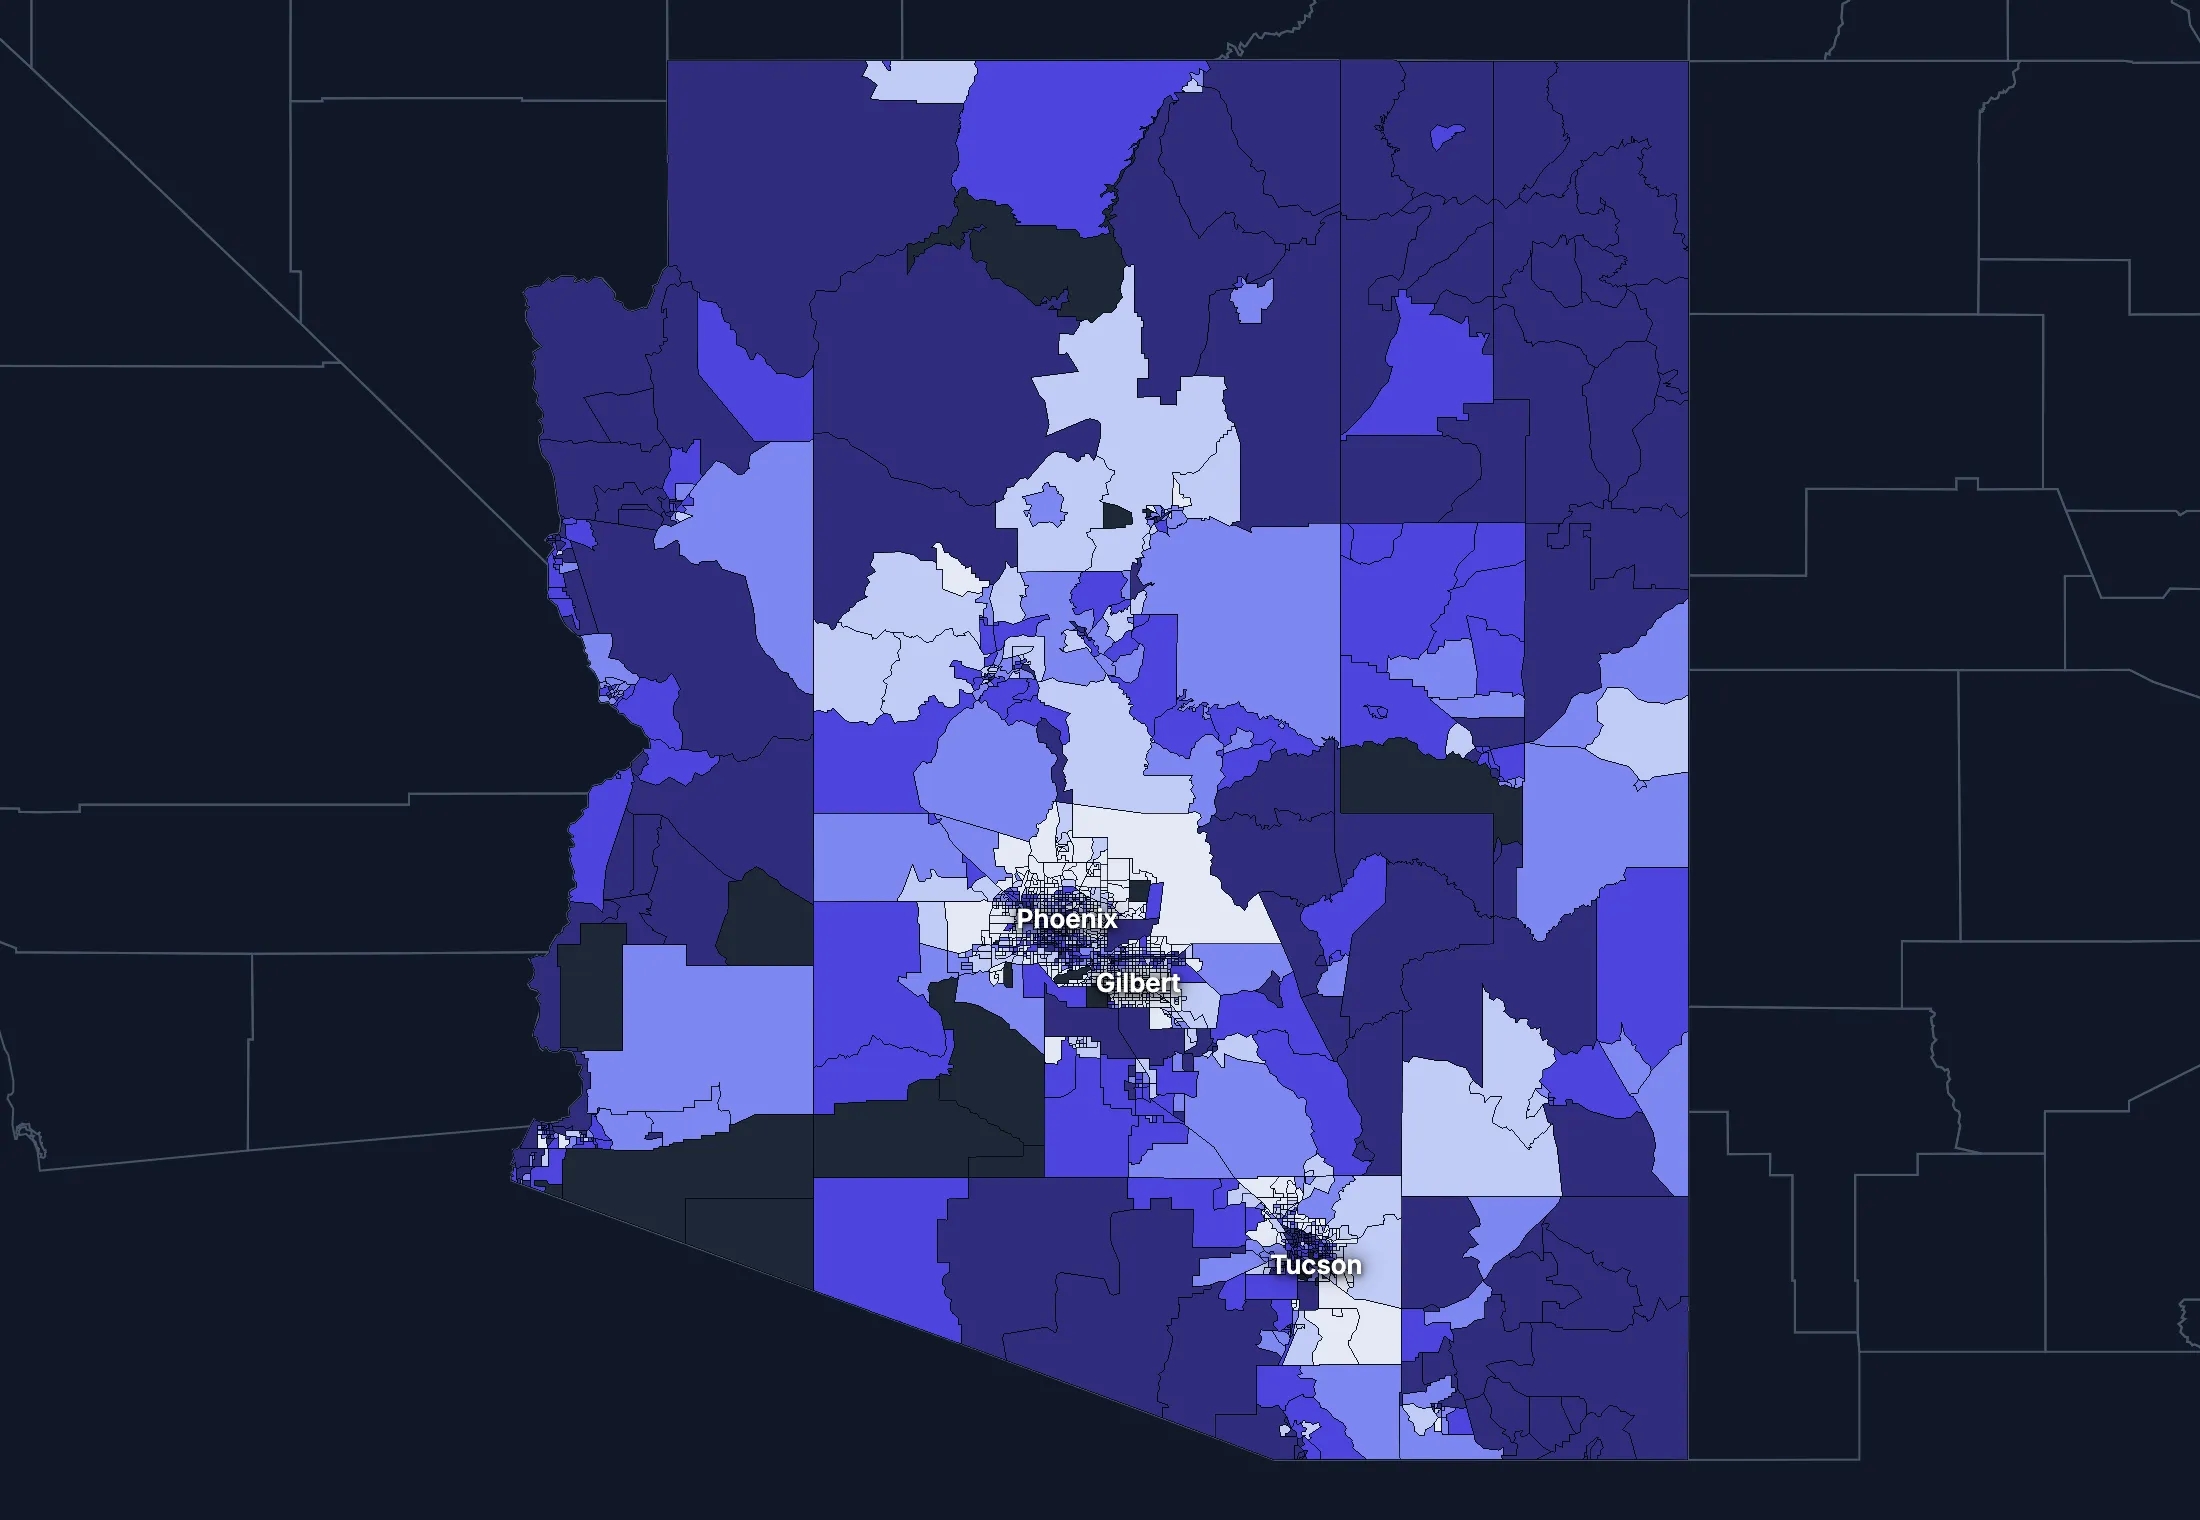
State averages hide a lot. These census tracts are the closest the census comes to neighborhoods.
Where the state’s average misleads
Each tick is one census tract, and the dark line marks the state. Hover over a tick or tap it to see the tract.
Poverty
402 of 1732 tracts are at least 1.5 times the state’s overall 12.5%, and 626 are at two-thirds of it or less.
Highest: Tract 206.02, 63.6%. Lowest: Tract 14.02, 0.0%.
Renters paying 30% or more of income
88 of 1653 tracts are at least 1.5 times the state’s overall 48.0%, and 412 are at two-thirds of it or less.
Highest: Tract 21, 100.0%. Lowest: Tract 9702.02, 0.0%.
Adults with a bachelor’s degree
337 of 1741 tracts are at least 1.5 times the state’s overall 33.3%, and 618 are at two-thirds of it or less.
Highest: Tract 3190.01, 87.7%. Lowest: Tract 201.02, 0.0%.
Median household income
309 of 1726 tracts are at least 1.5 times the typical tract’s $76,762, and 278 are at two-thirds of it or less.
Highest: Tract 1050.03, $250,000 or more. Lowest: Tract 9400.10, $18,409.
American Community Survey 2020–2024 5-year estimates, by census tract. Income is capped at $250,000+ by the Census Bureau.
People
Who lives in Arizona
Its median age of 39.5 is about the same as the US (39.5). 13.2% of residents were born outside the US, and 25.3% speak a language other than English at home.
Age
Source: ACS 2025 1-year, table A01001.
Show data
| Arizona | United States | |
|---|---|---|
| Under 18 | 20.9% ±0.2% , number 1,591,221 ±18,640 | 21.0% ±<0.1% , number 71,689,151 ±111,800 |
| 18 to 24 | 9.7% ±0.2% , number 738,254 ±14,770 | 9.3% ±<0.1% , number 31,716,680 ±98,660 |
| 25 to 34 | 13.7% ±0.1% , number 1,042,120 ±5,714 | 13.6% ±<0.1% , number 46,357,354 ±55,690 |
| 35 to 44 | 12.6% ±0.2% , number 959,466 ±17,560 | 13.4% ±<0.1% , number 45,746,189 ±105,700 |
| 45 to 54 | 11.1% ±0.1% , number 847,777 ±5,091 | 11.8% ±<0.1% , number 40,257,563 ±53,540 |
| 55 to 64 | 11.5% ±0.2% , number 873,046 ±15,110 | 12.1% ±<0.1% , number 41,242,904 ±104,700 |
| 65 to 74 | 11.2% ±0.2% , number 854,714 ±14,150 | 10.8% ±<0.1% , number 36,895,650 ±91,520 |
| 75 and over | 9.4% ±0.2% , number 717,220 ±12,700 | 8.2% ±<0.1% , number 27,879,368 ±78,140 |
Embed
Race and ethnicity
Source: ACS 2025 1-year, table A04001.
Show data
| Arizona | United States | |
|---|---|---|
| White, not Hispanic | 50.2% ±0.1% , number 3,823,656 ±9,189 | 55.0% ±<0.1% , number 187,959,031 ±58,340 |
| Hispanic or Latino | 32.5% , number 2,479,646 | 20.5% ±<0.1% , number 69,975,516 ±13,270 |
| Black, not Hispanic | 4.5% ±0.1% , number 345,936 ±10,710 | 11.7% ±<0.1% , number 40,096,453 ±106,200 |
| Asian, not Hispanic | 4.0% ±0.1% , number 305,474 ±7,731 | 6.5% ±<0.1% , number 22,096,709 ±58,340 |
| Other or multiracial | 8.8% ±0.2% , number 669,106 ±18,480 | 6.3% ±<0.1% , number 21,657,150 ±150,100 |
Embed
Language spoken at home
Source: ACS 2025 1-year, table C16001.
Show data
| Arizona | United States | |
|---|---|---|
| English only | 74.7% ±0.4% , number 5,400,488 ±31,140 | 77.1% ±0.1% , number 249,390,588 ±275,300 |
| Spanish | 18.9% ±0.4% , number 1,368,034 ±26,220 | 13.9% ±0.1% , number 44,921,985 ±177,800 |
| Other Indo-European | 1.7% ±0.2% , number 123,741 ±11,170 | 4.0% ±<0.1% , number 12,862,980 ±113,500 |
| Asian and Pacific Island | 2.6% ±0.2% , number 184,937 ±13,950 | 3.8% ±<0.1% , number 12,288,841 ±99,740 |
| Arabic and other | 2.1% ±0.2% , number 154,388 ±11,270 | 1.3% ±<0.1% , number 4,116,949 ±71,480 |
Embed
Marital status
Source: ACS 2025 1-year, table A11001.
Show data
| Arizona | United States | |
|---|---|---|
| Now married | 47.5% ±0.5% , number 3,003,113 ±28,800 | 47.9% ±0.1% , number 135,567,564 ±223,300 |
| Never married | 34.7% ±0.4% , number 2,198,539 ±22,230 | 34.8% ±0.1% , number 98,647,238 ±152,600 |
| Divorced | 11.2% ±0.3% , number 706,147 ±17,760 | 10.2% ±<0.1% , number 28,879,967 ±112,900 |
| Widowed | 5.4% ±0.2% , number 340,450 ±10,550 | 5.5% ±<0.1% , number 15,599,094 ±69,430 |
| Separated | 1.3% ±0.1% , number 80,707 ±6,397 | 1.6% ±<0.1% , number 4,441,399 ±49,160 |
Embed
Where people lived a year ago
Source: ACS 2025 1-year, table A08001.
Show data
| Arizona | United States | |
|---|---|---|
| Same home | 86.3% ±0.4% , number 6,518,556 ±30,580 | 88.4% ±0.1% , number 298,889,697 ±214,800 |
| Same county | 8.3% ±0.3% , number 624,656 ±25,700 | 6.0% ±<0.1% , number 20,202,671 ±166,300 |
| Another county in the state | 1.6% ±0.2% , number 123,384 ±11,330 | 3.0% ±<0.1% , number 10,168,097 ±89,190 |
| Another state | 3.1% ±0.3% , number 236,744 ±19,890 | 2.1% ±<0.1% , number 7,025,589 ±81,660 |
| Another country | 0.6% ±0.1% , number 47,096 ±8,292 | 0.6% ±<0.1% , number 1,984,943 ±47,210 |
Embed
Top countries of birth, among those born abroad
Source: ACS 2025 1-year, table A07001.
Show data
| Arizona | |
|---|---|
| Mexico | 47.9% , number 483,175 |
| India | 5.6% , number 56,126 |
| Canada | 4.3% , number 43,251 |
| Philippines | 3.7% , number 37,673 |
| Vietnam | 2.5% , number 24,749 |
| Cuba | 2.3% , number 23,516 |
Embed
All the numbers
| Indicator | Arizona | US | Rank among states* | Table |
|---|---|---|---|---|
| Population | 7,623,818 | 341,784,859 | 14th | A00001 |
| People per square mile | 67 | 97 | 33rd | A00002 |
| Land area (square miles) | 113,655 | – | – | A00002 |
| Median age | 39.5 ±0.2 | 39.5 ±0.1 | 27th | A01004 |
| Under 18 | 20.9% ±0.2% , number 1,591,221 ±18,640 | 21.0% ±<0.1% , number 71,689,151 ±111,800 | 31st | B02002 |
| 65 and over | 20.6% ±0.2% , number 1,571,934 ±19,020 | 19.0% ±<0.1% , number 64,775,018 ±120,300 | 12th | B02002 |
| Born outside the US | 13.2% ±0.3% , number 1,008,584 ±23,230 | 14.7% ±0.1% , number 50,409,320 ±204,800 | 16th | A06001 |
| Speak a language other than English at home | 25.3% ±0.4% , number 1,831,100 ±33,670 | 22.9% ±0.1% , number 74,190,755 ±244,000 | 8th | C16001 |
| Veterans (adults) | 7.5% ±0.2% , number 449,601 ±12,190 | 5.9% ±<0.1% , number 15,746,228 ±85,320 | 13th | A16002 |
| Living with a disability | 14.5% ±0.3% , number 1,092,703 ±21,330 | 13.7% ±<0.1% , number 46,271,455 ±126,000 | 24th | B18101 |
| Women 15–50 who had a baby in the past year | 4.6% ±0.4% , number 79,761 ±6,387 | 5.0% ±0.1% , number 4,016,759 ±44,040 | 27th | B13002 |
| Lived in the same home a year ago | 86.3% ±0.4% , number 6,518,556 ±30,580 | 88.4% ±0.1% , number 298,889,697 ±214,800 | 43rd | A08001 |
| White, not Hispanic | 50.2% ±0.1% , number 3,823,656 ±9,189 | 55.0% ±<0.1% , number 187,959,031 ±58,340 | 41st | A04001 |
| Hispanic or Latino | 32.5% , number 2,479,646 | 20.5% ±<0.1% , number 69,975,516 ±13,270 | 4th | A04001 |
| Black, not Hispanic | 4.5% ±0.1% , number 345,936 ±10,710 | 11.7% ±<0.1% , number 40,096,453 ±106,200 | 34th | A04001 |
| Asian, not Hispanic | 4.0% ±0.1% , number 305,474 ±7,731 | 6.5% ±<0.1% , number 22,096,709 ±58,340 | 20th | A04001 |
*1 is the highest. Population is ranked among all states, and the rest among those of 1,000 people or more, whose figures can be ranked. Ranks use 5-year estimates, the only ones covering every state, so they can differ slightly from the figures here.
Income and work
Incomes close to the US
The median household income is $82,940, lower than the US ($84,780). 11.8% of people live in poverty, and 11.8% have no health insurance, higher than the US (8.4%).
Household income
Source: ACS 2025 1-year, table A14001.
Show data
| Arizona | United States | |
|---|---|---|
| Under $25,000 | 13.3% ±0.5% , number 405,412 ±14,760 | 14.0% ±0.1% , number 18,727,548 ±88,990 |
| $25,000 to $49,999 | 15.3% ±0.5% , number 464,473 ±15,710 | 15.4% ±0.1% , number 20,665,585 ±101,400 |
| $50,000 to $74,999 | 16.6% ±0.5% , number 506,004 ±15,950 | 15.3% ±0.1% , number 20,513,565 ±88,500 |
| $75,000 to $99,999 | 13.5% ±0.4% , number 410,696 ±13,570 | 12.5% ±0.1% , number 16,814,245 ±87,520 |
| $100,000 to $149,999 | 19.0% ±0.5% , number 576,298 ±14,310 | 17.9% ±0.1% , number 24,018,984 ±99,670 |
| $150,000 to $199,999 | 9.7% ±0.3% , number 296,049 ±9,684 | 10.1% ±0.1% , number 13,521,827 ±70,660 |
| $200,000 or more | 12.6% ±0.4% , number 382,003 ±11,620 | 14.8% ±0.1% , number 19,801,668 ±84,120 |
Embed
What residents do for work
Source: ACS 2025 1-year, table A17004.
Show data
| Arizona | United States | |
|---|---|---|
| Education and health care | 23.1% ±0.6% , number 820,723 ±21,590 | 24.4% ±0.1% , number 40,862,193 ±140,800 |
| Professional and business services | 12.1% ±0.4% , number 431,398 ±15,620 | 12.8% ±0.1% , number 21,375,231 ±87,110 |
| Retail trade | 11.8% ±0.4% , number 419,993 ±15,850 | 10.6% ±0.1% , number 17,781,181 ±96,660 |
| Arts, food and lodging | 10.1% ±0.3% , number 359,958 ±11,240 | 8.9% ±0.1% , number 14,811,502 ±87,840 |
| Finance, insurance and real estate | 8.2% ±0.3% , number 292,453 ±12,100 | 6.6% ±<0.1% , number 11,025,569 ±68,570 |
| Manufacturing | 7.8% ±0.3% , number 278,580 ±11,550 | 9.6% ±0.1% , number 16,064,394 ±91,270 |
| Construction | 7.8% ±0.4% , number 276,436 ±12,610 | 6.7% ±<0.1% , number 11,254,981 ±79,620 |
| Transportation and warehousing | 5.5% ±0.3% , number 194,987 ±9,765 | 5.9% ±<0.1% , number 9,832,211 ±73,020 |
Embed
Where workers come from and go
Arizona has 3,140,901 jobs and 3,177,910 employed residents. 52,431 people commute in to work and 89,440 commute out, while 3,088,470 both live and work here. The most commuters come from California.
Most commuters come from
- California: 21,163
- New Mexico: 6,868
- Nevada: 4,691
Most residents commute to
- California: 36,543
- Nevada: 15,922
- New Mexico: 6,422
Show data
| Arizona | |
|---|---|
| Live and work here | 3,088,470 |
| Work here, live elsewhere | 52,431 |
| Live here, work elsewhere | 89,440 |
Embed
All the numbers
| Indicator | Arizona | US | Rank among states* | Table |
|---|---|---|---|---|
| Median household income | $82,940 ±$1,117 | $84,780 ±$215 | 21st | A14006 |
| Income per person | $44,729 ±$555 | $47,171 ±$115 | 26th | A14024 |
| Income inequality (Gini index) | 0.465 ±0.004 | 0.482 ±0.001 | 30th | A14028 |
| Living in poverty | 11.8% ±0.5% , number 880,096 ±35,620 | 11.8% ±0.1% , number 39,264,183 ±277,400 | 20th | A13004 |
| Unemployment rate | 5.1% ±0.2% , number 189,925 ±9,352 | 4.9% ±<0.1% , number 8,574,594 ±64,350 | 21st | A17005 |
| No health insurance | 11.8% ±0.3% , number 884,077 ±24,180 | 8.4% ±<0.1% , number 28,323,306 ±152,000 | 9th | A20001 |
*1 is the highest. Population is ranked among all states, and the rest among those of 1,000 people or more, whose figures can be ranked. Ranks use 5-year estimates, the only ones covering every state, so they can differ slightly from the figures here.
Education
Fewer college degrees than the US
34.3% of adults 25 and over have a bachelor’s degree or more, lower than the US (37.4%).
Highest level of education
Source: ACS 2025 1-year, table A12001.
Show data
| Arizona | United States | |
|---|---|---|
| Less than high school | 9.5% ±0.3% , number 503,086 ±17,240 | 9.4% ±0.1% , number 22,321,002 ±120,500 |
| High school only | 24.3% ±0.4% , number 1,287,597 ±23,800 | 25.6% ±0.1% , number 61,096,726 ±203,400 |
| Some college | 31.9% ±0.5% , number 1,689,101 ±27,550 | 27.7% ±0.1% , number 65,920,977 ±173,500 |
| Bachelor’s degree | 20.9% ±0.3% , number 1,104,661 ±18,350 | 22.3% ±0.1% , number 53,224,312 ±196,700 |
| Graduate degree | 13.4% ±0.3% , number 709,898 ±16,620 | 15.0% ±0.1% , number 35,816,011 ±159,400 |
Embed
All the numbers
| Indicator | Arizona | US | Rank among states* | Table |
|---|---|---|---|---|
| Bachelor’s degree or more | 34.3% ±0.5% , number 1,814,559 ±24,750 | 37.4% ±0.1% , number 89,040,323 ±253,200 | 30th | A12001 |
| High school graduate or more | 90.5% ±0.8% , number 4,791,257 ±44,030 | 90.6% ±0.2% , number 216,058,026 ±368,200 | 39th | A12001 |
*1 is the highest. Population is ranked among all states, and the rest among those of 1,000 people or more, whose figures can be ranked. Ranks use 5-year estimates, the only ones covering every state, so they can differ slightly from the figures here.
Housing
Home values outran incomes
33.3% of households rent, lower than the US (34.7%). The median home is worth $427,600 and the median rent is $1,698. After inflation, home values rose 61% from 2015 to 2025, while household income rose 18%.
Housing costs and income, 2015 to 2025, after inflation
Source: ACS 1-year, table A10036, A18009, A14006.
Show data
| Arizona | United States | |
|---|---|---|
| Median home value | +60.6% | +39.3% |
| Median rent | +32.9% | +18.5% |
| Median household income | +17.6% | +10.9% |
Embed
Types of homes
Source: ACS 2025 1-year, table A10032.
Show data
| Arizona | United States | |
|---|---|---|
| Single-family, detached | 64.1% ±0.5% , number 2,163,794 ±16,180 | 60.9% ±0.1% , number 90,335,844 ±173,300 |
| Single-family, attached | 5.4% ±0.3% , number 183,156 ±8,683 | 6.4% ±<0.1% , number 9,527,703 ±51,230 |
| 2 to 4 units | 4.7% ±0.3% , number 157,263 ±9,207 | 7.5% ±0.1% , number 11,109,005 ±75,790 |
| 5 to 19 units | 7.5% ±0.3% , number 254,660 ±11,330 | 8.7% ±0.1% , number 12,829,882 ±97,590 |
| 20 or more units | 9.2% ±0.4% , number 311,270 ±13,750 | 11.1% ±0.1% , number 16,381,450 ±92,310 |
| Mobile homes and other | 9.0% ±0.3% , number 303,128 ±9,637 | 5.4% ±<0.1% , number 8,045,083 ±53,680 |
Embed
When homes were built
Source: ACS 2025 1-year, table A10055.
Show data
| Arizona | United States | |
|---|---|---|
| 2010 or later | 20.0% ±0.6% , number 607,772 ±18,050 | 15.1% ±0.1% , number 20,257,912 ±101,300 |
| 2000 to 2009 | 21.8% ±0.5% , number 663,785 ±16,230 | 13.8% ±0.1% , number 18,535,840 ±92,260 |
| 1980 to 1999 | 31.4% ±0.7% , number 954,282 ±20,330 | 24.1% ±0.1% , number 32,332,570 ±118,900 |
| 1960 to 1979 | 19.9% ±0.5% , number 603,778 ±15,730 | 22.9% ±0.1% , number 30,726,302 ±110,000 |
| Before 1960 | 6.9% ±0.3% , number 211,318 ±9,709 | 24.0% ±0.1% , number 32,210,798 ±121,500 |
Embed
All the numbers
| Indicator | Arizona | US | Rank among states* | Table |
|---|---|---|---|---|
| Housing units | 3,373,271 | – | – | A10001 |
| Households | 3,040,935 ±13,100 | – | – | A10008 |
| People per household | 2.45 ±0.01 | 2.49 ±0.01 | 11th | A10003 |
| Households that rent | 33.3% ±0.6% , number 1,012,686 ±18,270 | 34.7% ±0.1% , number 46,551,688 ±193,200 | 26th | A10060 |
| Vacant homes | 9.9% ±0.4% , number 332,336 ±13,230 | 9.6% ±0.1% , number 14,165,545 ±137,100 | 23rd | A10047, A10060 |
| Median gross rent | $1,698 ±$17 | $1,557 ±$4 | 13th | A18009 |
| Median home value | $427,600 ±$2,683 | $371,100 ±$646 | 16th | A10036 |
| Renters paying 30% or more of income | 50.5% ±1.5% , number 511,761 ±17,410 | 48.3% ±0.2% , number 22,486,693 ±122,100 | 14th | A18002 |
| Owners paying 30% or more of income | 24.3% ±0.7% , number 492,378 ±15,030 | 24.2% ±0.1% , number 21,201,943 ±93,050 | 22nd | A10040 |
| Homes built before 1960 | 6.9% ±0.3% , number 211,318 ±9,709 | 24.0% ±0.1% , number 32,210,798 ±121,500 | 49th | A10055 |
*1 is the highest. Population is ranked among all states, and the rest among those of 1,000 people or more, whose figures can be ranked. Ranks use 5-year estimates, the only ones covering every state, so they can differ slightly from the figures here.
Getting around
How people get around
68.4% of workers drive alone and 16.2% work from home. 38.6% of those who travel to work spend 30 minutes or more getting there, and 5.9% of households have no vehicle.
How people get to work
Source: ACS 2025 1-year, table A09005.
Show data
| Arizona | United States | |
|---|---|---|
| Drive alone | 68.4% ±0.6% , number 2,403,937 ±26,830 | 69.8% ±0.1% , number 115,297,377 ±192,900 |
| Carpool | 10.4% ±0.4% , number 365,084 ±14,560 | 8.9% ±0.1% , number 14,712,170 ±97,240 |
| Public transit | 1.4% ±0.1% , number 50,459 ±4,993 | 4.3% ±<0.1% , number 7,100,386 ±63,330 |
| Walk | 1.6% ±0.2% , number 55,257 ±5,657 | 2.4% ±<0.1% , number 4,016,469 ±41,070 |
| Work from home | 16.2% ±0.5% , number 569,867 ±18,100 | 12.9% ±0.1% , number 21,288,393 ±105,700 |
| Other | 2.0% ±0.2% , number 71,504 ±6,256 | 1.7% ±<0.1% , number 2,799,658 ±41,510 |
Embed
Time spent getting to work
Source: ACS 2025 1-year, table B09001.
Show data
| Arizona | United States | |
|---|---|---|
| Under 10 minutes | 11.4% ±0.5% , number 334,680 ±14,620 | 12.0% ±0.1% , number 17,199,225 ±93,440 |
| 10 to 19 minutes | 28.0% ±0.7% , number 825,815 ±21,200 | 27.8% ±0.1% , number 40,059,540 ±137,700 |
| 20 to 29 minutes | 22.0% ±0.7% , number 647,445 ±20,380 | 21.0% ±0.1% , number 30,221,743 ±111,100 |
| 30 to 39 minutes | 18.8% ±0.6% , number 552,928 ±18,410 | 17.1% ±0.1% , number 24,659,138 ±103,800 |
| 40 to 59 minutes | 12.7% ±0.5% , number 372,929 ±14,820 | 12.6% ±0.1% , number 18,104,709 ±97,070 |
| 60 minutes or more | 7.2% ±0.4% , number 212,444 ±11,410 | 9.5% ±0.1% , number 13,681,705 ±84,440 |
Embed
Vehicles per household
Source: ACS 2025 1-year, table A10030.
Show data
| Arizona | United States | |
|---|---|---|
| None | 5.9% ±0.3% , number 179,549 ±10,030 | 8.8% ±0.1% , number 11,781,997 ±77,240 |
| One | 34.2% ±0.6% , number 1,040,068 ±19,940 | 33.1% ±0.1% , number 44,424,682 ±160,700 |
| Two | 37.4% ±0.7% , number 1,136,985 ±20,430 | 36.0% ±0.1% , number 48,200,889 ±176,800 |
| Three or more | 22.5% ±0.6% , number 684,333 ±17,780 | 22.1% ±0.1% , number 29,655,854 ±113,300 |
Embed
All the numbers
| Indicator | Arizona | US | Rank among states* | Table |
|---|---|---|---|---|
| Drive to work alone | 68.4% ±0.6% , number 2,403,937 ±26,830 | 69.8% ±0.1% , number 115,297,377 ±192,900 | 39th | A09005 |
| Take public transit | 1.4% ±0.1% , number 50,459 ±4,993 | 4.3% ±<0.1% , number 7,100,386 ±63,330 | 23rd | A09005 |
| Work from home | 16.2% ±0.5% , number 569,867 ±18,100 | 12.9% ±0.1% , number 21,288,393 ±105,700 | 7th | A09005 |
| Commute 30 minutes or more | 38.6% ±0.8% , number 1,138,301 ±26,250 | 39.2% ±0.1% , number 56,445,552 ±165,300 | 17th | B09001 |
| Households with no vehicle | 5.9% ±0.3% , number 179,549 ±10,500 | 8.8% ±<0.1% , number 11,781,997 ±64,240 | 41st | A10030 |
*1 is the highest. Population is ranked among all states, and the rest among those of 1,000 people or more, whose figures can be ranked. Ranks use 5-year estimates, the only ones covering every state, so they can differ slightly from the figures here.
Places
The largest cities in Arizona
Population, from the latest estimates available. Figures cover the whole of each place.
Largest places
Every county and place in Arizona
Find any county, city, town, metro area, ZIP code, school district or district in Arizona.
Counties
Each of the 15 counties with its population, from ACS 2020–2024 5-year estimates.
- Apache County65,341
- Cochise County125,566
- Coconino County144,508
- Gila County53,795
- Graham County39,232
- Greenlee County9,409
- La Paz County16,664
- Maricopa County4.56M
- Mohave County220,517
- Navajo County108,415
- Pima County1.06M
- Pinal County469,006
- Santa Cruz County48,926
- Yavapai County245,480
- Yuma County211,741
Cities, towns and other places
Each of the 441 with its population, from ACS 2020–2024 5-year estimates. Census-designated places are communities without a local government of their own, drawn by the Census Bureau so they can be counted.
- Aguila284
- Ajo3,107
- Ak Chin22
- Ak-Chin Village1,132
- Ali Chuk18
- Ali Chukson77
- Ali Molina171
- Alpine55
- Amado53
- Anegam92
- Antares110
- Anthem22,584
- Apache Junction41,058
- Arivaca268
- Arivaca Junction642
- Arizona City9,543
- Arizona Village713
- Arlington37
- Ash Fork458
- Avenue B and C4,001
- Avondale92,477
- Avra Valley6,277
- Bagdad2,814
- Beaver Dam1,624
- Beaver Valley74
- Bellemont1,701
- Benson5,417
- Beyerville61
- Bisbee4,977
- Bitter Springs504
- Black Canyon City2,181
- Blackwater1,958
- Blue Ridge992
- Bluewater897
- Bouse1,203
- Bowie384
- Brenda780
- Bryce379
- Buckeye104,923
- Buckshot45
- Bullhead City42,496
- Burnside434
- Bylas1,551
- Cactus Flats1,508
- Cactus Forest640
- Cameron782
- Camp Verde12,521
- Cane Beds637
- Canyon Day1,182
- Carefree3,683
- Carrizo249
- Casa Blanca1,697
- Casa Grande60,905
- Casas Adobes72,059
- Catalina6,489
- Catalina Foothills52,593
- Cave Creek5,091
- Cedar Creek398
- Centennial Park1,839
- Central657
- Central Heights-Midland City2,909
- Chandler280,136
- Charco7
- Chiawuli Tak146
- Chilchinbito728
- Chinle4,147
- Chino Valley13,602
- Chloride75
- Christopher Creek88
- Chuichu278
- Cibecue2,228
- Cibola245
- Cienega Springs1,958
- Circle City1,089
- Citrus Park5,115
- Clacks Canyon59
- Clarkdale4,758
- Clay Springs338
- Claypool1,259
- Clifton3,822
- Colorado City2,702
- Congress1,491
- Coolidge16,636
- Copper Hill163
- Cordes Lakes3,808
- Cornfields320
- Cornville3,618
- Corona de Tucson9,566
- Cottonwood CDP149
- Cottonwood city12,580
- Cowlic25
- Crozier5
- Crystal Beach299
- Cutter103
- Dateland206
- Deer Creek242
- Del Muerto439
- Dennehotso574
- Desert Hills2,944
- Dewey-Humboldt4,501
- Dilkon1,270
- Dolan Springs1,341
- Doney Park6,253
- Donovan Estates507
- Douglas15,981
- Dragoon85
- Drexel Heights27,675
- Dripping Springs186
- Drysdale66
- Dudleyville684
- Duncan969
- Eagar4,416
- East Fork945
- East Globe224
- East Verde Estates275
- Ehrenberg697
- El Capitan28
- El Mirage36,088
- El Prado Estates258
- Elephant Head481
- Elfrida194
- Elgin349
- Eloy17,433
- First Mesa1,459
- Flagstaff76,445
- Florence25,570
- Flowing Springs38
- Flowing Wells16,559
- Forest Lakes204
- Fort Apache130
- Fort Defiance3,351
- Fort Mohave15,715
- Fort Thomas313
- Fort Valley1,761
- Fortuna Foothills28,896
- Fountain Hills23,789
- Franklin103
- Fredonia1,061
- Freedom Acres48
- Gadsden493
- Ganado637
- Geronimo Estates68
- Gila Bend1,363
- Gila Crossing830
- Gilbert280,262
- Gisela587
- Glendale252,833
- Globe7,195
- Gold Canyon13,107
- Golden Shores1,555
- Golden Valley8,567
- Goodyear107,645
- Goodyear Village590
- Grand Canyon Village1,599
- Greasewood335
- Green Valley22,114
- Greenehaven325
- Gu Oidak192
- Guadalupe5,272
- Hackberry338
- Haivana Nakya96
- Hard Rock106
- Hayden331
- Heber-Overgaard3,621
- Holbrook4,858
- Hondah697
- Hotevilla-Bacavi645
- Houck707
- Huachuca City1,614
- Hunter Creek45
- Icehouse Canyon528
- Indian Wells318
- J-Six Ranchettes419
- Jakes Corner111
- Jeddito311
- Jerome231
- Joseph City2,153
- Kachina Village3,212
- Kaibab105
- Kaibab Estates West1,403
- Kaibito1,661
- Katherine159
- Kayenta4,927
- Keams Canyon379
- Kearny2,109
- Kingman34,375
- Kino Springs173
- Klagetoh158
- Kleindale52
- Ko Vaya53
- Kohls Ranch161
- Komatke809
- Kykotsmovi Village545
- La Paz Valley579
- Lake Havasu City58,359
- Lake Montezuma4,929
- Lake of the Woods3,250
- Lazy Y U481
- LeChee1,307
- Leupp882
- Linden2,502
- Litchfield Park6,916
- Littlefield70
- Low Mountain697
- Lower Santan Village289
- Lukachukai1,969
- Lupton4
- Maish Vaya38
- Mammoth1,191
- Many Farms876
- Marana56,938
- Maricopa67,163
- Maricopa Colony836
- Martinez Lake89
- Mayer791
- McNary919
- McNeal246
- Mead Ranch218
- Meadview1,517
- Mesa511,764
- Mesa del Caballo944
- Mescal1,760
- Mesquite Creek548
- Miami1,405
- Miracle Valley716
- Moenkopi879
- Mohave Valley2,555
- Mojave Ranch Estates46
- Morenci1,673
- Mormon Lake153
- Morristown138
- Mountain View Ranches1,984
- Mountainaire1,103
- Munds Park608
- Naco1,060
- Nazlini527
- Nelson519
- New Kingman-Butler13,993
- New River18,240
- Nogales19,841
- North Fork1,463
- Nutrioso427
- Oak Creek Canyon356
- Oak Springs47
- Oatman74
- Oljato-Monument Valley85
- Oracle3,146
- Orange Grove Mobile Manor211
- Oro Valley48,162
- Oxbow Estates44
- Page7,345
- Palominas253
- Paradise Valley12,611
- Parker3,388
- Parker Strip861
- Parks1,706
- Patagonia946
- Paulden4,795
- Payson16,622
- Peach Springs1,234
- Peeples Valley746
- Peoria196,906
- Peridot999
- Phoenix1.64M
- Picacho297
- Picture Rocks9,448
- Pima2,995
- Pinal460
- Pine1,740
- Pine Lake98
- Pinedale594
- Pinetop Country Club2,054
- Pinetop-Lakeside4,101
- Pinion Pines221
- Pinon1,159
- Pirtleville1,939
- Pisinemo311
- Poston105
- Prescott47,400
- Prescott Valley49,179
- Quartzsite1,877
- Queen Creek71,867
- Queen Valley1,118
- Rainbow City807
- Rancho Mesa Verde759
- Red Lake1,676
- Red Mesa430
- Red Rock (Apache County)83
- Red Rock (Pinal County)3,277
- Rincon Valley6,512
- Rio Rico22,017
- Rio Verde2,261
- Rock House8
- Rock Point345
- Roosevelt Estates593
- Rough Rock465
- Round Rock623
- Round Valley631
- Rye17
- Sacate Village283
- Sacaton3,429
- Sacaton Flats Village604
- Saddlebrooke13,085
- Safford10,239
- Sahuarita35,862
- Salome730
- San Carlos4,973
- San Jose496
- San Luis37,337
- San Manuel3,491
- San Miguel237
- San Simon244
- San Tan Valley109,189
- Sanders684
- Santa Rosa615
- Sawmill636
- Scenic1,379
- Scottsdale243,821
- Seba Dalkai141
- Second Mesa832
- Sedona9,777
- Sehili229
- Seligman549
- Sells1,935
- Seven Mile636
- Shongopovi1,084
- Shonto274
- Show Low12,102
- Shumway169
- Sierra Vista45,155
- Sierra Vista Southeast14,330
- Six Shooter Canyon811
- Snowflake6,444
- So-Hi648
- Solomon321
- Somerton14,574
- Sonoita663
- South Komelik178
- South Tucson4,550
- Spring Valley1,673
- Springerville2,008
- St. David1,098
- St. Johns CDP631
- St. Johns city3,395
- St. Michaels1,142
- Stanfield646
- Star Valley2,525
- Steamboat372
- Stotonic Village78
- Strawberry1,094
- Summit4,896
- Sun City37,486
- Sun City West27,425
- Sun Lakes13,924
- Sun Valley74
- Sunizona191
- Sunsites611
- Sunwest45
- Superior2,535
- Surprise154,948
- Sweet Water Village106
- Swift Trail Junction2,859
- Tacna353
- Tanque Verde15,866
- Taylor4,183
- Teec Nos Pos712
- Tees Toh382
- Tempe188,065
- Thatcher5,439
- Theba7
- Three Points5,254
- Timberline-Fernwood1,973
- Tolani Lake439
- Tolleson7,668
- Tombstone1,026
- Tonalea205
- Tonto Basin1,750
- Tonto Village123
- Top-of-the-World142
- Topawa166
- Truxton134
- Tsaile1,696
- Tuba City7,960
- Tubac1,294
- Tucson547,073
- Tucson Estates12,136
- Tucson Mountains11,353
- Tumacacori-Carmen207
- Turkey Creek351
- Tusayan368
- Upper Santan Village234
- Vail16,315
- Vaiva Vo184
- Valencia West14,728
- Valentine25
- Valle436
- Valle Vista2,369
- Ventana92
- Verde Village11,930
- Vernon247
- Vicksburg555
- Village of Oak Creek (Big Park)6,356
- Wagon Wheel1,716
- Wahak Hotrontk125
- Wall Lane374
- Walnut Creek556
- Washington Park10
- Wellton2,527
- Wellton Hills49
- Wenden405
- Wet Camp Village397
- Wheatfields329
- Whetstone2,971
- Whispering Pines151
- White Hills286
- White Mountain Lake2,910
- Whitecone805
- Whiteriver4,545
- Why52
- Wickenburg8,059
- Wide Ruins29
- Wikieup92
- Wilhoit1,101
- Willcox3,222
- Williams3,369
- Williamson6,310
- Willow Valley981
- Window Rock2,477
- Winkelman191
- Winslow8,773
- Winslow West335
- Wintersburg152
- Wittmann631
- Woodruff8
- Yarnell638
- York399
- Young236
- Youngtown7,015
- Yucca75
- Yuma100,139
- Yuma Proving Ground468
Metro and micro areas
Each of the 11 that reach into Arizona, with its whole population, from ACS 2020–2024 5-year estimates. Metro and micro areas are counties tied together by commuting, drawn by the Office of Management and Budget.
- Flagstaff, AZ Metro Area144,508
- Lake Havasu City-Kingman, AZ Metro Area220,517
- Nogales, AZ Micro Area48,926
- Payson, AZ Micro Area53,795
- Phoenix-Mesa-Chandler, AZ Metro Area5.03M
- Prescott Valley-Prescott, AZ Metro Area245,480
- Safford, AZ Micro Area39,232
- Show Low, AZ Micro Area108,415
- Sierra Vista-Douglas, AZ Metro Area125,566
- Tucson, AZ Metro Area1.06M
- Yuma, AZ Metro Area211,741
ZIP codes
Each of the 406 with people in it, by the town it's centered in, from ACS 2020–2024 5-year estimates. These are the Census Bureau's ZIP Code Tabulation Areas, which follow the Postal Service's ZIP codes as closely as census blocks allow.
- 85003Phoenix10,875
- 85004Phoenix12,408
- 85006Phoenix21,905
- 85007Phoenix13,575
- 85008Phoenix59,716
- 85009Phoenix52,064
- 85012Phoenix8,704
- 85013Phoenix22,490
- 85014Phoenix25,911
- 85015Phoenix41,490
- 85016Phoenix37,074
- 85017Phoenix46,129
- 85018Phoenix37,297
- 85019Phoenix27,429
- 85020Phoenix34,916
- 85021Phoenix39,828
- 85022Phoenix53,811
- 85023Phoenix35,034
- 85024Phoenix26,199
- 85027Phoenix39,487
- 85028Phoenix18,752
- 85029Phoenix49,683
- 85031Phoenix31,191
- 85032Phoenix70,839
- 85033Phoenix57,591
- 85034Phoenix4,854
- 85035Phoenix53,424
- 85037Phoenix54,608
- 85040Phoenix34,117
- 85041Phoenix63,862
- 85042Phoenix45,903
- 85043Phoenix41,331
- 85044Phoenix39,347
- 85045Phoenix7,600
- 85048Phoenix34,664
- 85050Phoenix33,118
- 85051Phoenix45,768
- 85053Phoenix29,773
- 85054Phoenix10,346
- 85083Phoenix21,022
- 85085Phoenix31,458
- 85086New River43,270
- 85087New River10,157
- 85118Gold Canyon14,932
- 85119Apache Junction25,420
- 85120Apache Junction31,191
- 85121Wet Camp Village2,800
- 85122Casa Grande61,624
- 85123Eloy10,003
- 85128Coolidge19,487
- 85131Eloy18,794
- 85132Cactus Forest38,671
- 85135Hayden331
- 85137Kearny2,406
- 85138Maricopa55,260
- 8513920,784
- 85140San Tan Valley51,260
- 85141Picacho364
- 85142Queen Creek93,700
- 85143San Tan Valley44,444
- 85145Red Rock3,277
- 85147Upper Santan Village4,911
- 85172Stanfield1,688
- 85173Superior2,600
- 85191Coolidge32
- 85192Winkelman1,849
- 85193Chuichu4,118
- 85194Casa Grande8,077
- 85201Mesa51,400
- 85202Mesa38,750
- 85203Mesa38,035
- 85204Mesa65,155
- 85205Mesa45,116
- 85206Mesa37,235
- 85207Mesa51,178
- 85208Mesa37,225
- 85209Mesa43,150
- 85210Mesa39,015
- 85212Mesa55,283
- 85213Mesa36,836
- 85215Apache Junction16,888
- 85224Chandler47,963
- 85225Chandler72,297
- 85226Chandler42,294
- 85233Gilbert39,077
- 85234Gilbert51,283
- 85248Sun Lakes37,095
- 85249Chandler48,746
- 85250Paradise Valley15,394
- 85251Scottsdale40,780
- 85253Paradise Valley17,904
- 85254Phoenix45,558
- 85255Scottsdale45,346
- 85256Paradise Valley3,504
- 85257Scottsdale29,812
- 85258Scottsdale25,545
- 85259Scottsdale21,670
- 85260Scottsdale39,896
- 85262Carefree14,329
- 852633,472
- 852641,261
- 85266Scottsdale12,516
- 85268Fountain Hills23,849
- 85281Tempe72,762
- 85282Tempe53,624
- 85283Tempe47,459
- 85284Tempe19,492
- 85286Chandler50,621
- 85295Gilbert56,744
- 85296Gilbert53,076
- 85297Gilbert37,475
- 85298Gilbert44,114
- 85301Glendale68,178
- 85302Glendale40,612
- 85303Glendale33,663
- 85304Glendale29,861
- 85305Glendale18,043
- 85306Glendale24,911
- 85307Litchfield Park14,223
- 85308Glendale65,095
- 85309Glendale960
- 85310Phoenix19,964
- 85320Aguila458
- 85321Charco3,555
- 85322476
- 85323Avondale47,043
- 85324Black Canyon City2,181
- 85325Bouse1,203
- 85326Buckeye75,359
- 85328Cibola245
- 85329Avondale2,252
- 85331Cave Creek31,968
- 85332Congress1,577
- 85333442
- 85334Ehrenberg697
- 85335El Mirage36,088
- 85336San Luis6,514
- 85337Gila Bend2,041
- 85338Goodyear67,451
- 85339Gila Crossing54,641
- 85340Glendale40,919
- 8534137
- 853421,823
- 85343Arlington18
- 85344Parker9,433
- 85345Peoria60,918
- 85346Quartzsite2,458
- 85347575
- 85348Salome2,112
- 85349San Luis31,316
- 85350Somerton19,011
- 85351Sun City27,592
- 85352Tacna278
- 85353Phoenix49,120
- 853548,531
- 85355Citrus Park14,460
- 85356Wellton3,840
- 85357405
- 85360130
- 85361Circle City7,991
- 85362Peeples Valley638
- 85363Youngtown7,015
- 85364Yuma72,960
- 8536554,775
- 85367Fortuna Foothills22,074
- 85371Poston111
- 85373Sun City West20,254
- 85374Surprise41,420
- 85375Sun City West27,680
- 85377Carefree3,437
- 85378Sun City West9,765
- 85379Surprise51,035
- 85381Peoria27,650
- 85382Peoria43,729
- 85383Peoria74,390
- 85387Surprise22,442
- 85388Surprise35,369
- 85390Wickenburg10,298
- 85392Avondale39,079
- 85395Goodyear40,414
- 85396Buckeye42,181
- 85501Wheatfields12,395
- 85530Bylas1,967
- 85531Central657
- 85532Claypool331
- 855332,607
- 85534Duncan2,672
- 85535Fort Thomas42
- 85536Bylas355
- 85539Top-of-the-World3,386
- 85540Morenci3,992
- 85541Payson23,382
- 85542Peridot2,885
- 85543Bryce4,868
- 85544Pine2,834
- 85545Roosevelt Estates604
- 85546Swift Trail Junction20,809
- 855505,696
- 85551San Jose361
- 85552Thatcher6,861
- 85553Tonto Basin1,755
- 85554309
- 85601Arivaca268
- 8560210,019
- 85603Bisbee6,699
- 85605Bowie683
- 85606Dragoon1,066
- 8560717,191
- 85608Douglas2,804
- 85609Dragoon426
- 85610Elfrida576
- 85611Elgin1,454
- 85613Sierra Vista4,983
- 85614Elephant Head25,381
- 85615Sierra Vista Southeast10,175
- 85616Whetstone4,941
- 85617McNeal1,094
- 85618Dudleyville1,550
- 85620Naco988
- 85621Nogales21,593
- 85622Arivaca Junction6,518
- 85623Oracle5,558
- 85624Patagonia1,546
- 85625Sunizona1,917
- 85626Pirtleville1,332
- 85627Benson430
- 85629Sahuarita31,668
- 85630St. David1,939
- 85631San Manuel3,508
- 85632861
- 8563348
- 85634Gu Oidak5,038
- 85635Sierra Vista Southeast34,193
- 85637Sonoita1,105
- 85638Tombstone1,418
- 85639South Komelik166
- 85640Tumacacori-Carmen207
- 85641Vail34,752
- 856438,476
- 85645Amado1,249
- 85646Tubac1,345
- 85648Rio Rico22,118
- 85650Sierra Vista Southeast14,876
- 85653Avra Valley23,574
- 85658Marana16,051
- 85701Tucson5,498
- 85704Casas Adobes35,210
- 85705Tucson54,700
- 85706Tucson54,236
- 85707Tucson581
- 85708Tucson4,312
- 85710Tucson56,125
- 85711Tucson42,558
- 85712Tucson31,571
- 85713Tucson46,439
- 85714Tucson14,498
- 85715Tucson19,198
- 85716Tucson32,976
- 85718Catalina Foothills28,125
- 85719Tucson51,833
- 85723Tucson244
- 85730Tanque Verde39,399
- 85734Tucson4,797
- 85735Three Points10,718
- 857364,219
- 85737Oro Valley22,785
- 85739Saddlebrooke18,478
- 85741Casas Adobes33,679
- 85742Casas Adobes31,613
- 85743Picture Rocks31,300
- 85745Tucson Mountains36,999
- 85746Valencia West42,835
- 85747Tucson27,753
- 85748Tanque Verde20,103
- 85749Tanque Verde18,843
- 85750Catalina Foothills24,886
- 85755Oro Valley18,560
- 85756Tucson37,700
- 85757Valencia West21,259
- 85901Show Low19,533
- 85902Linden2
- 85911Cibecue2,273
- 85912White Mountain Lake170
- 85920Alpine613
- 85922141
- 85923Clay Springs442
- 859242,269
- 85925Eagar4,401
- 85926Fort Apache710
- 85927315
- 85928Heber-Overgaard424
- 85929Pinetop-Lakeside7,451
- 85930McNary1,374
- 85931Forest Lakes210
- 85932Nutrioso894
- 85933Heber-Overgaard4,388
- 85934Pinedale661
- 85935Pinetop-Lakeside4,534
- 85936St. Johns city3,909
- 85937Snowflake9,760
- 85938Springerville2,236
- 85939Taylor3,849
- 85940Vernon1,185
- 85941Rainbow City10,459
- 86001Fort Valley37,312
- 86003104
- 8600436,394
- 86005Mountainaire17,961
- 86011Flagstaff4,019
- 86015Bellemont1,701
- 8601644
- 86017Munds Park608
- 86018Parks1,181
- 860201,890
- 86021Colorado City4,842
- 860221,712
- 86023Grand Canyon Village1,970
- 86024Blue Ridge1,015
- 86025Holbrook5,226
- 8602847
- 86029Sun Valley74
- 86030Kykotsmovi Village658
- 86031Indian Wells1,818
- 86032Joseph City2,209
- 86033Kayenta7,392
- 86034Jeddito1,983
- 86035Leupp1,612
- 86036277
- 86038Mormon Lake184
- 86039Hotevilla-Bacavi1,177
- 8604010,595
- 86042First Mesa2,019
- 86043Shongopovi1,916
- 860442,921
- 86045Moenkopi10,319
- 86046Red Lake6,574
- 8604713,899
- 86052161
- 860532,170
- 86054Shonto1,467
- 86301Prescott27,076
- 86303Prescott19,446
- 8630519,790
- 86313Prescott149
- 86314Prescott Valley40,317
- 86315Prescott Valley10,684
- 863202,351
- 86321Bagdad3,065
- 86322Camp Verde13,020
- 86323Chino Valley19,666
- 86324Jerome4,776
- 86325Cornville5,363
- 86326Verde Village24,852
- 86327Dewey-Humboldt12,154
- 86329Dewey-Humboldt1,328
- 86331Jerome231
- 86332Wilhoit2,316
- 86333Cordes Lakes6,781
- 86334Paulden4,159
- 86335Lake Montezuma4,965
- 86336Sedona11,381
- 863371,669
- 86338542
- 86343194
- 86351Village of Oak Creek6,721
- 86401Pine Lake30,124
- 86403Lake Havasu City18,295
- 86404Crystal Beach19,234
- 86406Parker Strip25,067
- 8640930,365
- 86411Antares579
- 86413Golden Valley13,143
- 86426Fort Mohave15,467
- 86429Katherine8,619
- 86431Chloride86
- 864323,073
- 86433Oatman74
- 864341,667
- 86436Golden Shores1,555
- 86437Crozier55
- 86438784
- 86440Mohave Valley8,853
- 86441Dolan Springs1,462
- 86442Bullhead City34,735
- 86444Meadview1,528
- 86445White Hills286
- 86502836
- 86503Chinle9,911
- 86504Sawmill5,760
- 86505Cornfields6,779
- 86506Houck1,218
- 86507Lukachukai2,207
- 86508Lupton516
- 865104,074
- 865113,583
- 86512Sanders2,557
- 86514Red Mesa2,519
- 86515Window Rock3,433
- 86520Cottonwood CDP2,293
- 86535Dennehotso1,183
- 86538Many Farms1,714
- 86540Nazlini1,220
- 86544Red Rock1,472
- 86545Rock Point780
- 86547Round Rock896
- 86556Sehili2,795
School districts
Each of the 215 with people in it, from ACS 2020–2024 5-year estimates. Elementary districts teach the lower grades and secondary districts the upper ones, under them; the rest are unified, teaching every grade.
- Agua Fria Union High School Districtsecondary178,657
- Aguila Elementary Districtelementary458
- Ajo Unified District3,107
- Alhambra Elementary Districtelementary96,358
- Alpine Elementary Districtelementary613
- Altar Valley Elementary Districtelementary6,732
- Amphitheater Unified District145,912
- Antelope Union High School Districtsecondary4,938
- Apache Elementary Districtelementary91
- Apache Junction Unified District66,012
- Arlington Elementary Districtelementary1,747
- Ash Creek Elementary Districtelementary594
- Ash Fork Joint Unified District2,351
- Avondale Elementary Districtelementary59,128
- Bagdad Unified School District3,041
- Balsz Elementary Districtelementary35,572
- Beaver Creek Elementary Districtelementary4,965
- Benson Unified School District8,289
- Bicentennial Union High School Districtsecondary7,120
- Bisbee Unified District6,266
- Blue Elementary Districtelementary118
- Blue Ridge Unified District13,753
- Bonita Elementary Districtelementary809
- Bouse Elementary Districtelementary1,203
- Bowie Unified District688
- Buckeye Elementary Districtelementary54,451
- Buckeye Union High School Districtsecondary104,332
- Bullhead City School Districtelementary43,354
- Camp Verde Unified District13,020
- Canon Elementary Districtelementary2,181
- Cartwright Elementary Districtelementary121,321
- Casa Grande Elementary Districtelementary72,804
- Casa Grande Union High School Districtsecondary101,906
- Catalina Foothills Unified District31,531
- Cave Creek Unified District66,114
- Cedar Unified District7,155
- Chandler Unified District280,287
- Chevelon Butte School Districtelementary937
- Chinle Unified District18,931
- Chino Valley Unified District25,119
- Clarkdale-Jerome Elementary Districtelementary4,190
- Cochise Elementary Districtelementary198
- Colorado City Unified District4,541
- Colorado River Union High School Districtsecondary70,161
- Concho Elementary Districtelementary2,189
- Congress Elementary Districtelementary1,904
- Continental Elementary Districtelementary30,827
- Coolidge Unified District22,922
- Cottonwood-Oak Creek Elementary Districtelementary31,104
- Crane Elementary Districtelementary42,978
- Creighton Elementary Districtelementary64,506
- Crown King Elementary Districtelementary194
- Deer Valley Unified District274,873
- Double Adobe Elementary Districtelementary389
- Douglas Unified District20,935
- Duncan Unified District2,858
- Dysart Unified District212,490
- Eagle Elementary Districtelementary48
- Elfrida Elementary Districtelementary456
- Eloy Elementary Districtelementary6,362
- Empire Elementary Districtelementary564
- Flagstaff Unified District100,949
- Florence Unified School District112,260
- Flowing Wells Unified District30,514
- Fort Huachuca Accommodation District4,983
- Fort Thomas Unified District2,411
- Fountain Hills Unified District24,255
- Fowler Elementary Districtelementary39,089
- Fredonia-Moccasin Unified District2,760
- Gadsden Elementary Districtelementary29,367
- Ganado Unified District6,686
- Gila Bend Unified District1,796
- Gilbert Unified District217,969
- Glendale Elementary Districtelementary108,039
- Glendale Union High School Districtsecondary356,781
- Globe Unified District9,516
- Grand Canyon Unified District1,970
- Hackberry School Districtelementary1,804
- Hayden-Winkelman Unified District839
- Heber-Overgaard Unified District4,812
- Higley Unified District93,968
- Hillside Elementary Districtelementary53
- Holbrook Unified District9,291
- Humboldt Unified District63,346
- Hyder Elementary Districtelementary398
- Indian Oasis-Baboquivari Unified District5,526
- Isaac Elementary Districtelementary46,712
- J. O. Combs Unified School District49,548
- Joseph City Unified District2,428
- Kayenta Unified District9,319
- Kingman Unified School District75,018
- Kirkland Elementary Districtelementary1,356
- Klondyke Elementary Districtelementary74
- Kyrene Elementary Districtelementary164,484
- Lake Havasu Unified District62,208
- Laveen Elementary Districtelementary58,508
- Liberty Elementary Districtelementary45,398
- Litchfield Elementary Districtelementary119,529
- Littlefield Unified District3,073
- Littleton Elementary Districtelementary59,477
- Madison Elementary Districtelementary61,894
- Maine Consolidated School Districtelementary1,799
- Mammoth-San Manuel Unified District5,058
- Marana Unified District109,560
- Maricopa Unified School District71,536
- Mayer Unified District6,781
- McNary Elementary Districtelementary765
- McNeal Elementary Districtelementary552
- Mesa Unified District496,570
- Miami Unified District7,028
- Mingus Union High School Districtsecondary35,294
- Mobile Elementary Districtelementary132
- Mohave Valley Elementary Districtelementary24,789
- Mohawk Valley Elementary Districtelementary1,279
- Morenci Unified District6,385
- Morristown Elementary Districtelementary2,130
- Murphy Elementary Districtelementary15,497
- Naco Elementary Districtelementary1,656
- Nadaburg Unified School District12,110
- Nogales Unified District20,722
- Oracle Elementary Districtelementary16,422
- Osborn Elementary Districtelementary42,935
- Owens-Whitney Elementary Districtelementary542
- Page Unified District13,003
- Palo Verde Elementary Districtelementary2,736
- Paloma School Districtelementary203
- Palominas Elementary Districtelementary11,444
- Paradise Valley Unified District274,199
- Parker Unified School District9,544
- Patagonia Elementary Districtelementary1,603
- Patagonia Union High School Districtsecondary3,762
- Payson Unified District23,249
- Peach Springs Unified District1,365
- Pearce Elementary Districtelementary1,952
- Pendergast Elementary Districtelementary84,433
- Peoria Unified School District259,533
- Phoenix Elementary Districtelementary59,432
- Phoenix Union High School Districtsecondary734,490
- Picacho Elementary Districtelementary5,905
- Pima Unified District4,821
- Pine Strawberry Elementary Districtelementary2,834
- Pinon Unified District6,004
- Pomerene Elementary Districtelementary1,032
- Prescott Unified District65,337
- Quartzsite Elementary Districtelementary3,400
- Queen Creek Unified District80,516
- Ray Unified District3,775
- Red Mesa Unified District6,977
- Red Rock Elementary Districtelementary4,313
- Redington Elementary Districtelementary49
- Riverside Elementary Districtelementary8,130
- Roosevelt Elementary Districtelementary119,988
- Round Valley Unified District8,322
- Sacaton Elementary Districtelementary7,649
- Saddle Mountain Unified School District17,927
- Safford Unified District17,974
- Sahuarita Unified District32,648
- Salome Consolidated Elementary Districtelementary2,065
- San Carlos Unified District8,583
- San Fernando Elementary Districtelementary48
- San Simon Unified District770
- Sanders Unified District5,126
- Santa Cruz Elementary Districtelementary3,170
- Santa Cruz Valley Unified District21,272
- Santa Cruz Valley Union High School Districtsecondary16,580
- Scottsdale Unified District236,589
- Sedona-Oak Creek Joint Unified District18,030
- Seligman Unified District1,746
- Sentinel Elementary Districtelementary89
- Show Low Unified District18,279
- Sierra Vista Unified District48,110
- Skull Valley Elementary Districtelementary466
- Snowflake Unified District13,870
- Solomon Elementary Districtelementary2,863
- Somerton Elementary Districtelementary26,737
- Sonoita Elementary Districtelementary2,159
- St. David Unified District3,020
- St. Johns Unified District3,437
- Stanfield Elementary Districtelementary5,250
- Sunnyside Unified District89,072
- Superior Unified School District2,987
- Tanque Verde Unified District12,020
- Tempe School Districtelementary164,720
- Tempe Union High School Districtsecondary329,204
- Thatcher Unified District7,854
- Tolleson Elementary Districtelementary17,555
- Tolleson Union High School Districtsecondary220,634
- Toltec Elementary Districtelementary16,203
- Tombstone Unified District6,414
- Tonto Basin Elementary Districtelementary1,755
- Topock Elementary Districtelementary2,018
- Tuba City Unified District13,748
- Tucson Unified District486,881
- Union Elementary Districtelementary20,080
- Vail Unified District75,270
- Valentine Elementary Districtelementary282
- Valley Union High School Districtsecondary3,002
- Vernon Elementary Districtelementary1,460
- Walnut Grove Elementary Districtelementary273
- Washington Elementary Districtelementary248,742
- Wellton Elementary Districtelementary3,261
- Wenden Elementary Districtelementary452
- Whiteriver Unified District14,352
- Wickenburg Unified District20,080
- Willcox Unified District7,671
- Williams Unified District5,969
- Williamson Valley Elementary School Districtelementary1,019
- Wilson Elementary Districtelementary3,637
- Window Rock Unified District10,835
- Winslow Unified District10,432
- Yarnell Elementary Districtelementary1,425
- Young Elementary School Districtelementary442
- Yucca Elementary Districtelementary594
- Yuma Elementary Districtelementary107,721
- Yuma Union High School Districtsecondary206,803
Congressional districts
As drawn for the 119th Congress (2025–2027).
- Congressional District 1804,578
- Congressional District 2826,257
- Congressional District 3815,927
- Congressional District 4804,739
- Congressional District 5840,221
- Congressional District 6812,709
- Congressional District 7808,224
- Congressional District 8802,956
- Congressional District 9863,227
State senate districts
The upper chamber’s districts, as drawn in 2024.
- State Senate District 1246,671
- State Senate District 2253,802
- State Senate District 3240,816
- State Senate District 4246,417
- State Senate District 5241,537
- State Senate District 6221,081
- State Senate District 7253,467
- State Senate District 8250,737
- State Senate District 9236,406
- State Senate District 10239,291
- State Senate District 11239,419
- State Senate District 12243,790
- State Senate District 13237,864
- State Senate District 14253,967
- State Senate District 15266,581
- State Senate District 16261,084
- State Senate District 17249,296
- State Senate District 18244,209
- State Senate District 19233,949
- State Senate District 20241,065
- State Senate District 21246,628
- State Senate District 22257,571
- State Senate District 23241,104
- State Senate District 24236,250
- State Senate District 25275,769
- State Senate District 26241,317
- State Senate District 27243,762
- State Senate District 28232,401
- State Senate District 29256,972
- State Senate District 30245,615
State house districts
The lower chamber’s districts, as drawn in 2024.
- State House District 1246,671
- State House District 2253,802
- State House District 3240,816
- State House District 4246,417
- State House District 5241,537
- State House District 6221,081
- State House District 7253,467
- State House District 8250,737
- State House District 9236,406
- State House District 10239,291
- State House District 11239,419
- State House District 12243,790
- State House District 13237,864
- State House District 14253,967
- State House District 15266,581
- State House District 16261,084
- State House District 17249,296
- State House District 18244,209
- State House District 19233,949
- State House District 20241,065
- State House District 21246,628
- State House District 22257,571
- State House District 23241,104
- State House District 24236,250
- State House District 25275,769
- State House District 26241,317
- State House District 27243,762
- State House District 28232,401
- State House District 29256,972
- State House District 30245,615
PUMAs
Public Use Microdata Areas: areas of 100,000 people or more that the state draws from census tracts, for the Census Bureau’s microdata.
- Cochise & Santa Cruz Counties–Sierra Vista City PUMA174,492
- Coconino County PUMA144,508
- Gila, Graham, Greenlee Counties PUMA102,436
- La Paz & Yuma Counties–Parker, Quartzsite, Wellton Somerton & San Luis Cities PUMA111,627
- Maricopa County (Northeast)–Scottsdale City (Southeast) & Fountain Hills Town PUMA111,940
- Maricopa County (West) & Gila River Indian Community (Northwest) PUMA189,905
- Maricopa County–Avondale (Central) & Litchfield Park (Central) Cities PUMA130,127
- Maricopa County–Chandler City (Northeast) PUMA121,992
- Maricopa County–Chandler City (South) PUMA128,643
- Maricopa County–El Mirage & Sun City PUMA124,206
- Maricopa County–Gilbert (South) & Queen Creek Towns PUMA183,218
- Maricopa County–Gilbert Town (North) PUMA171,427
- Maricopa County–Glendale City (North) PUMA130,534
- Maricopa County–Glendale City (South) PUMA118,837
- Maricopa County–Goodyear, Glendale (West) & Litchfield Park (Northwest) Cities PUMA169,440
- Maricopa County–Mesa City (East) PUMA193,887
- Maricopa County–Mesa City (North Central) PUMA144,771
- Maricopa County–Mesa City (South Central) PUMA108,866
- Maricopa County–Mesa City (West) PUMA119,415
- Maricopa County–Peoria City (South & Central) PUMA122,503
- Maricopa County–Scottsdale (North), Phoenix (Far Northeast) Cities & Cave Creek PUMA137,045
- Maricopa County–Scottsdale City (Southwest) & Paradise Valley Town PUMA128,476
- Maricopa County–Surprise City (Central) PUMA129,684
- Maricopa County–Tempe (South) & Chandler (Northwest) Cities PUMA112,473
- Maricopa County–Tempe City (North) PUMA113,311
- Mohave County North–City of Kingman & Bullhead City PUMA115,770
- Mohave County South–Lake Havasu City PUMA104,747
- Navajo & Apache Counties PUMA173,756
- Phoenix (Far North) & Peoria (Northwest) Cities PUMA145,819
- Phoenix (Southwest) & Tolleson Cities PUMA180,332
- Phoenix City (East) PUMA109,021
- Phoenix City (North) PUMA110,587
- Phoenix City (Northeast Central) PUMA112,449
- Phoenix City (Northeast) PUMA104,690
- Phoenix City (Northwest Central) PUMA113,990
- Phoenix City (South) PUMA116,465
- Phoenix City (Uptown) PUMA111,627
- Phoenix City (West) PUMA114,544
- Phoenix City–Ahwatukee & South Mountain PUMA108,666
- Phoenix City–Downtown & Sky Harbor International Airport PUMA117,221
- Phoenix City–Maryvale (East) PUMA104,118
- Phoenix City–Maryvale (West) PUMA119,519
- Pima County (North Central)–Oro Valley Town PUMA117,897
- Pima County (Northeast) PUMA109,464
- Pima County (Southeast)–Tucson City (Far Southeast) & Sahuarita Town PUMA116,229
- Pima County (West) PUMA108,892
- Pinal County (Central)–Florence Town, Eloy (Northeast) & Coolidge Cities PUMA132,934
- Pinal County (North)–Apache Junction City PUMA162,153
- Pinal County (West)–Maricopa, Casa Grande & Eloy (Southeast) Cities PUMA163,125
- Tucson City (Northeast) PUMA113,784
- Tucson City (Northwest) PUMA121,460
- Tucson City (South) PUMA113,425
- Tucson City (Southeast) PUMA126,602
- Tucson City (West) & Marana Town PUMA143,531
- Yavapai Rural PUMA104,541
- Yavapai Urban PUMA140,939
- Yuma County–Yuma City PUMA116,778
Urban areas
Each that reaches into Arizona, with its whole population. Urban areas are the densely settled land the Census Bureau draws after each census, whatever the city lines.
- Arizona City, AZ9,342
- Benson, AZ4,143
- Bisbee, AZ4,614
- Blythe, CA–AZ10,701
- Buckeye North, AZ8,895
- Buckeye, AZ23,476
- Bullhead City, AZ–NV54,753
- Camp Verde, AZ5,956
- Casa Grande, AZ55,452
- Chino Valley, AZ13,784
- Cienega Springs, AZ2,402
- Coolidge, AZ13,488
- Corona de Tucson, AZ8,052
- Cottonwood (Yavapai County)–Verde Village, AZ29,764
- Douglas, AZ15,873
- Flagstaff, AZ80,060
- Florence East, AZ10,073
- Florence West, AZ14,024
- Globe, AZ12,997
- Gold Canyon, AZ10,989
- Goodyear South, AZ17,565
- Green Valley, AZ37,623
- Heber-Overgaard, AZ4,423
- Kingman, AZ48,768
- Lake Havasu City, AZ60,088
- Marana, AZ11,786
- Maricopa, AZ65,960
- Mesquite, NV–AZ20,601
- Munds Park, AZ313
- Needles, CA–AZ8,172
- Nogales, AZ18,546
- Page, AZ6,355
- Parker, AZ–CA5,725
- Payson, AZ17,278
- Peoria, AZ20,737
- Phoenix West–Goodyear–Avondale, AZ450,397
- Phoenix–Mesa–Scottsdale, AZ4.05M
- Pinetop-Lakeside, AZ10,009
- Prescott Valley East, AZ8,328
- Prescott–Prescott Valley, AZ95,428
- Quartzsite, AZ1,773
- Rio Verde, AZ3,211
- Safford, AZ18,934
- Sahuarita, AZ18,384
- San Luis, AZ28,350
- Sedona, AZ9,450
- Show Low, AZ12,108
- Sierra Vista, AZ52,916
- Snowflake, AZ5,857
- Somerton, AZ13,992
- Tuba City, AZ8,292
- Tucson, AZ881,415
- Vail, AZ16,196
- Village of Oak Creek (Big Park), AZ6,356
- Wickenburg, AZ4,309
- Winslow, AZ7,240
- Yuma, AZ–CA138,480
Tribal areas
Each that reaches into Arizona, with its whole population.
- Cocopah Reservation, AZ912
- Colorado River Indian Reservation, AZ–CA8,234
- Fort Apache Reservation, AZ15,117
- Fort McDowell Yavapai Nation Reservation, AZ1,003
- Fort Mojave Reservation and Off-Reservation Trust Land, AZ–CA–NV1,648
- Fort Yuma Indian Reservation, CA–AZ1,070
- Gila River Indian Reservation, AZ13,900
- Hopi Reservation and Off-Reservation Trust Land, AZ6,812
- Hualapai Indian Reservation and Off-Reservation Trust Land, AZ1,432
- Kaibab Indian Reservation, AZ292
- Maricopa (Ak Chin) Indian Reservation and Off-Reservation Trust Land, AZ1,339
- Navajo Nation Reservation and Off-Reservation Trust Land, AZ–NM–UT161,008
- Pascua Pueblo Yaqui Reservation and Off-Reservation Trust Land, AZ3,243
- Salt River Reservation, AZ5,111
- San Carlos Reservation, AZ10,551
- Tohono O'odham Nation Reservation and Off-Reservation Trust Land, AZ8,975
- Tonto Apache Reservation and Off-Reservation Trust Land, AZ112
- Yavapai-Apache Nation Reservation, AZ912
- Yavapai-Prescott Reservation, AZ557
- Zuni Reservation and Off-Reservation Trust Land, NM–AZ7,144
Turn Arizona into your planning report.
Social Explorer Studio builds an editable profile of any place, with tables and charts beside the county and state, and exports to Word, PDF and Excel.
Questions about Arizona
What is the population of Arizona?
7,623,818 people, according to the ACS 2025 1-year estimates, which the Census Bureau adjusts to match its own population estimate. That’s the 14th largest of the 50 states and DC.
What is the FIPS code for Arizona?
04. Every county’s and place’s FIPS code in Arizona starts with it. The Census Bureau’s full geographic identifier (GEOID) is 0400000US04.
What is the largest city in Arizona?
Phoenix, with 1,665,442 people. Other large places here include Tucson, Mesa and Gilbert.
What is the median household income in Arizona?
$82,940 (±$1,117), according to the ACS 2025 1-year estimates, lower than the US ($84,780).
What is the median age in Arizona?
39.5 years (±0.2), according to the ACS 2025 1-year estimates, about the same as the US (39.5).
How much does housing cost in Arizona?
Arizona’s median home value is $427,600 (±$2,683) and its median gross rent is $1,698 (±$17) a month, according to the ACS 2025 1-year estimates. 50.5% (±1.5%) of its renters pay 30% or more of their income on rent.
Is Arizona growing?
Arizona’s population grew 11.7%, from 6,828,065 in 2015 to 7,623,818 in 2025, according to the ACS 1-year estimates.
Where do people who work in Arizona live?
3,088,470 of its 3,140,901 jobs are held by people who live here. Of those who commute in, the most come from California, New Mexico, Nevada.
Where does this census data come from?
The U.S. Census Bureau’s American Community Survey, through Social Explorer’s tables: the latest 1-year estimates where they exist, for the most recent numbers, and 5-year estimates otherwise. Each table lists its code, so you can find it again.
Is this data free to use?
Yes. You can read it, cite it, download the CSV and embed the charts, with no account. To map other variables, compare your own areas or build a report, see Social Explorer’s plans in a live demo.
Sources and how to cite
American Community Survey 2025 1-year estimates, or 2020–2024 5-year estimates where noted, U.S. Census Bureau, from Social Explorer’s tables A00001, A00002, A01004, A04001, A06001, A08001, A09005, A10001, A10003, A10008, A10030, A10036, A10040, A10047, A10055, A10060, A12001, A13004, A14006, A14024, A14028, A16002, A17005, A18002, A18009, A20001, B02002, B09001, B13002, B18101, C16001. Maps by census tract use 2020–2024 5-year estimates, since the 1-year survey doesn’t cover tracts. Commuting: LEHD LODES 2023. These are estimates from a sample, each with its margin of error. Data retrieved November 14, 2026. How these profiles are made.
U.S. Census Bureau, American Community Survey 2025 1-year estimates, or 2020–2024 5-year estimates where noted, via Social Explorer. “Arizona.” https://www.socialexplorer.com/places/arizona. Accessed November 14, 2026.