

Washington: Population, demographics and census data
Home to 8,001,020 people, the 13th largest of the 50 states and DC, anchored by Seattle. It grew 11.6% between 2015 and 2025.
- Population
- 8.00M. Census Bureau estimate · Rank 13 of the 50 states and DC
- Median household income
- $101,946 ±$719. US $84,780
- Median age
- 38.9 ±0.1. US 39.5
ACS 2025 1-year estimates, U.S. Census Bureau
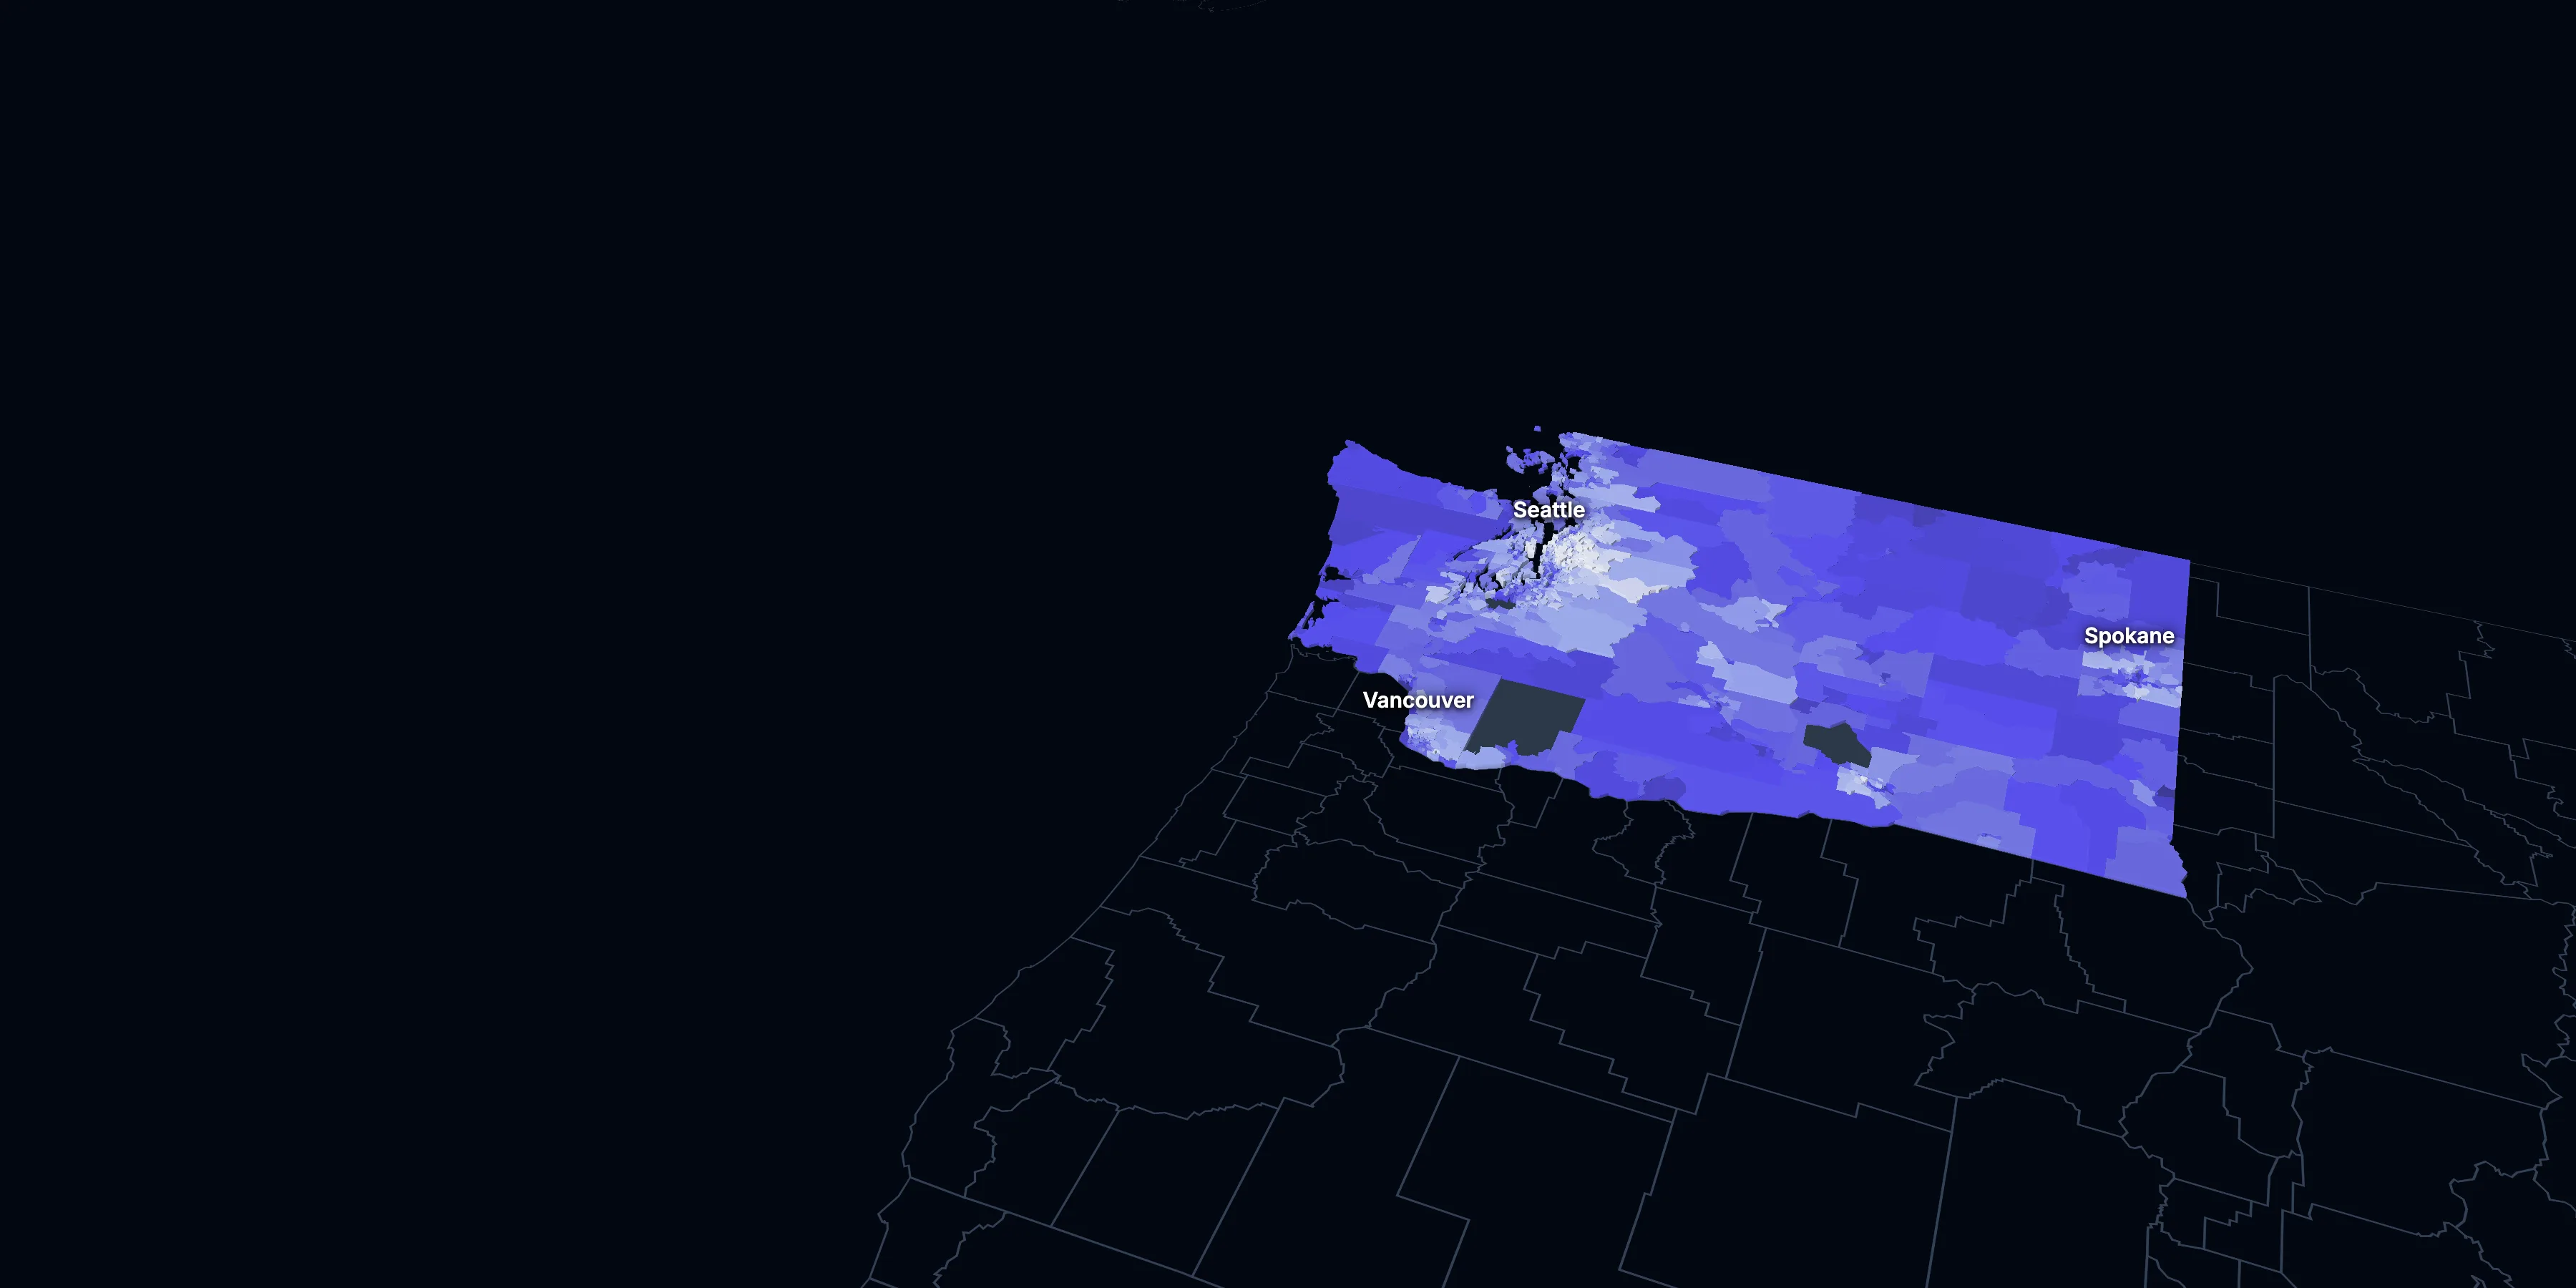
Taller, lighter tracts have higher household incomes
About Washington
Washington’s median household income is $101,946 (±$719), higher than the US ($84,780), and its median age is 38.9 (±0.1), according to the ACS 2025 1-year estimates. Its largest city is Seattle.
± is each figure’s margin of error, at 90% confidence, and † marks one too uncertain to lean on. Under each percentage in the tables is the number it counts. How the margins are worked out.
FIPS code 53
Highlights
What stands out in Washington
The numbers where Washington sits furthest from the nation, or past a recognized policy benchmark.
Past a policy benchmark
26.1%
Very highOwners paying 30% or more of income
That’s higher than the US (24.2%). HUD’s 30% standard, applied to homeowners.
+11 points
HighRent growth ahead of income
After inflation, rent grew 27% from 2015 to 2025, and household income 16%. The dots show rent growth.
5.5%
ElevatedUnemployment rate
That’s higher than the US (4.9%). The Department of Labor uses 6% as its floor for a labor surplus area.
Furthest from the national picture
$605,600
1.5× the USMedian home value
That’s higher than the US ($371,100). It’s the 4th highest of the 50 states and DC.
$101,946
Higher than the USMedian household income
That’s higher than the US ($84,780).
$1,873
Higher than the USMedian gross rent
That’s higher than the US ($1,557). It’s the 6th highest of the 50 states and DC.
2015 to 2025
How Washington changed in ten years
The state added 830,669 people. It got older, more foreign-born and better educated, and poverty fell 1.9 points.
Population, change since 2015
+11.6% in the state and +6.3% in the US.
Source: ACS 1-year, 2015 to 2025, table A00001.
Show data
| Washington | United States | |
|---|---|---|
| 2015 | 0.0% | 0.0% |
| 2016 | +1.6% | +0.5% |
| 2017 | +3.3% | +1.3% |
| 2018 | +5.1% | +1.8% |
| 2019 | +6.2% | +2.1% |
| 2021 | +7.9% | +3.3% |
| 2022 | +8.6% | +3.7% |
| 2023 | +9.0% | +4.2% |
| 2024 | +11.0% | +5.8% |
| 2025 | +11.6% | +6.3% |
Embed
Median household income, in 2025 dollars
+16.0% in the state and +10.9% in the US.
Source: ACS 1-year, 2015 to 2025, table A14006.
Show data
| Washington | United States | |
|---|---|---|
| 2015 | $87,858 | $76,413 |
| 2016 | $90,766 | $77,931 |
| 2017 | $93,983 | $79,891 |
| 2018 | $95,746 | $80,059 |
| 2019 | $99,900 | $83,427 |
| 2021 | $100,927 | $83,521 |
| 2022 | $101,145 | $82,811 |
| 2023 | $100,648 | $82,683 |
| 2024 | $102,720 | $84,339 |
| 2025 | $101,946 | $84,780 |
Embed
Living in poverty
−1.9 points in the state and −3.0 points in the US.
Source: ACS 1-year, 2015 to 2025, table A13004.
Show data
| Washington | United States | |
|---|---|---|
| 2015 | 12.2% | 14.7% |
| 2016 | 11.3% | 14.0% |
| 2017 | 11.0% | 13.4% |
| 2018 | 10.3% | 13.1% |
| 2019 | 9.8% | 12.3% |
| 2021 | 9.9% | 12.8% |
| 2022 | 10.0% | 12.6% |
| 2023 | 10.3% | 12.5% |
| 2024 | 9.9% | 12.1% |
| 2025 | 10.3% | 11.8% |
Embed
Bachelor’s degree or more
+7.3 points in the state and +6.7 points in the US.
Source: ACS 1-year, 2015 to 2025, table A12001.
Show data
| Washington | United States | |
|---|---|---|
| 2015 | 34.2% | 30.6% |
| 2016 | 35.1% | 31.3% |
| 2017 | 35.5% | 32.0% |
| 2018 | 36.7% | 32.6% |
| 2019 | 37.0% | 33.1% |
| 2021 | 39.0% | 35.0% |
| 2022 | 39.5% | 35.7% |
| 2023 | 40.5% | 36.2% |
| 2024 | 41.0% | 36.8% |
| 2025 | 41.4% | 37.4% |
Embed
Median gross rent, in 2025 dollars
+26.6% in the state and +18.5% in the US.
Source: ACS 1-year, 2015 to 2025, table A18009.
Show data
| Washington | United States | |
|---|---|---|
| 2015 | $1,480 | $1,314 |
| 2016 | $1,535 | $1,327 |
| 2017 | $1,610 | $1,340 |
| 2018 | $1,701 | $1,368 |
| 2019 | $1,725 | $1,393 |
| 2021 | $1,778 | $1,427 |
| 2022 | $1,806 | $1,440 |
| 2023 | $1,842 | $1,496 |
| 2024 | $1,885 | $1,537 |
| 2025 | $1,873 | $1,557 |
Embed
Median home value, in 2025 dollars
+55.6% in the state and +39.3% in the US.
Source: ACS 1-year, 2015 to 2025, table A10036.
Show data
| Washington | United States | |
|---|---|---|
| 2015 | $389,086 | $266,469 |
| 2016 | $414,429 | $277,278 |
| 2017 | $448,870 | $288,124 |
| 2018 | $482,266 | $296,908 |
| 2019 | $492,092 | $305,336 |
| 2021 | $581,866 | $337,116 |
| 2022 | $630,871 | $355,481 |
| 2023 | $612,793 | $361,931 |
| 2024 | $622,382 | $372,685 |
| 2025 | $605,600 | $371,100 |
Embed
ACS 1-year estimates. The dotted stretch of each line spans 2020, when the Census Bureau released no standard 1-year estimates. Dollar values are in 2025 dollars.
| Indicator | 2015 | 2025 | Change |
|---|---|---|---|
| Population | 7,170,351 | 8,001,020 | +11.6% |
| Median age | 37.5 | 38.9 | +1.4 years |
| 65 and over | 14.5% | 18.3% | +3.8 points |
| Born outside the US | 13.7% | 16.6% | +2.9 points |
| Hispanic or Latino | 12.4% | 15.5% | +3.1 points |
| Median household income | $87,858 | $101,946 | +16.0% |
| Living in poverty | 12.2% | 10.3% | −1.9 points |
| Bachelor’s degree or more | 34.2% | 41.4% | +7.3 points |
| Households that rent | 37.6% | 37.2% | −0.4 points |
| Median gross rent | $1,480 | $1,873 | +26.6% |
| Median home value | $389,086 | $605,600 | +55.6% |
1784 census tracts
Washington, tract by tract
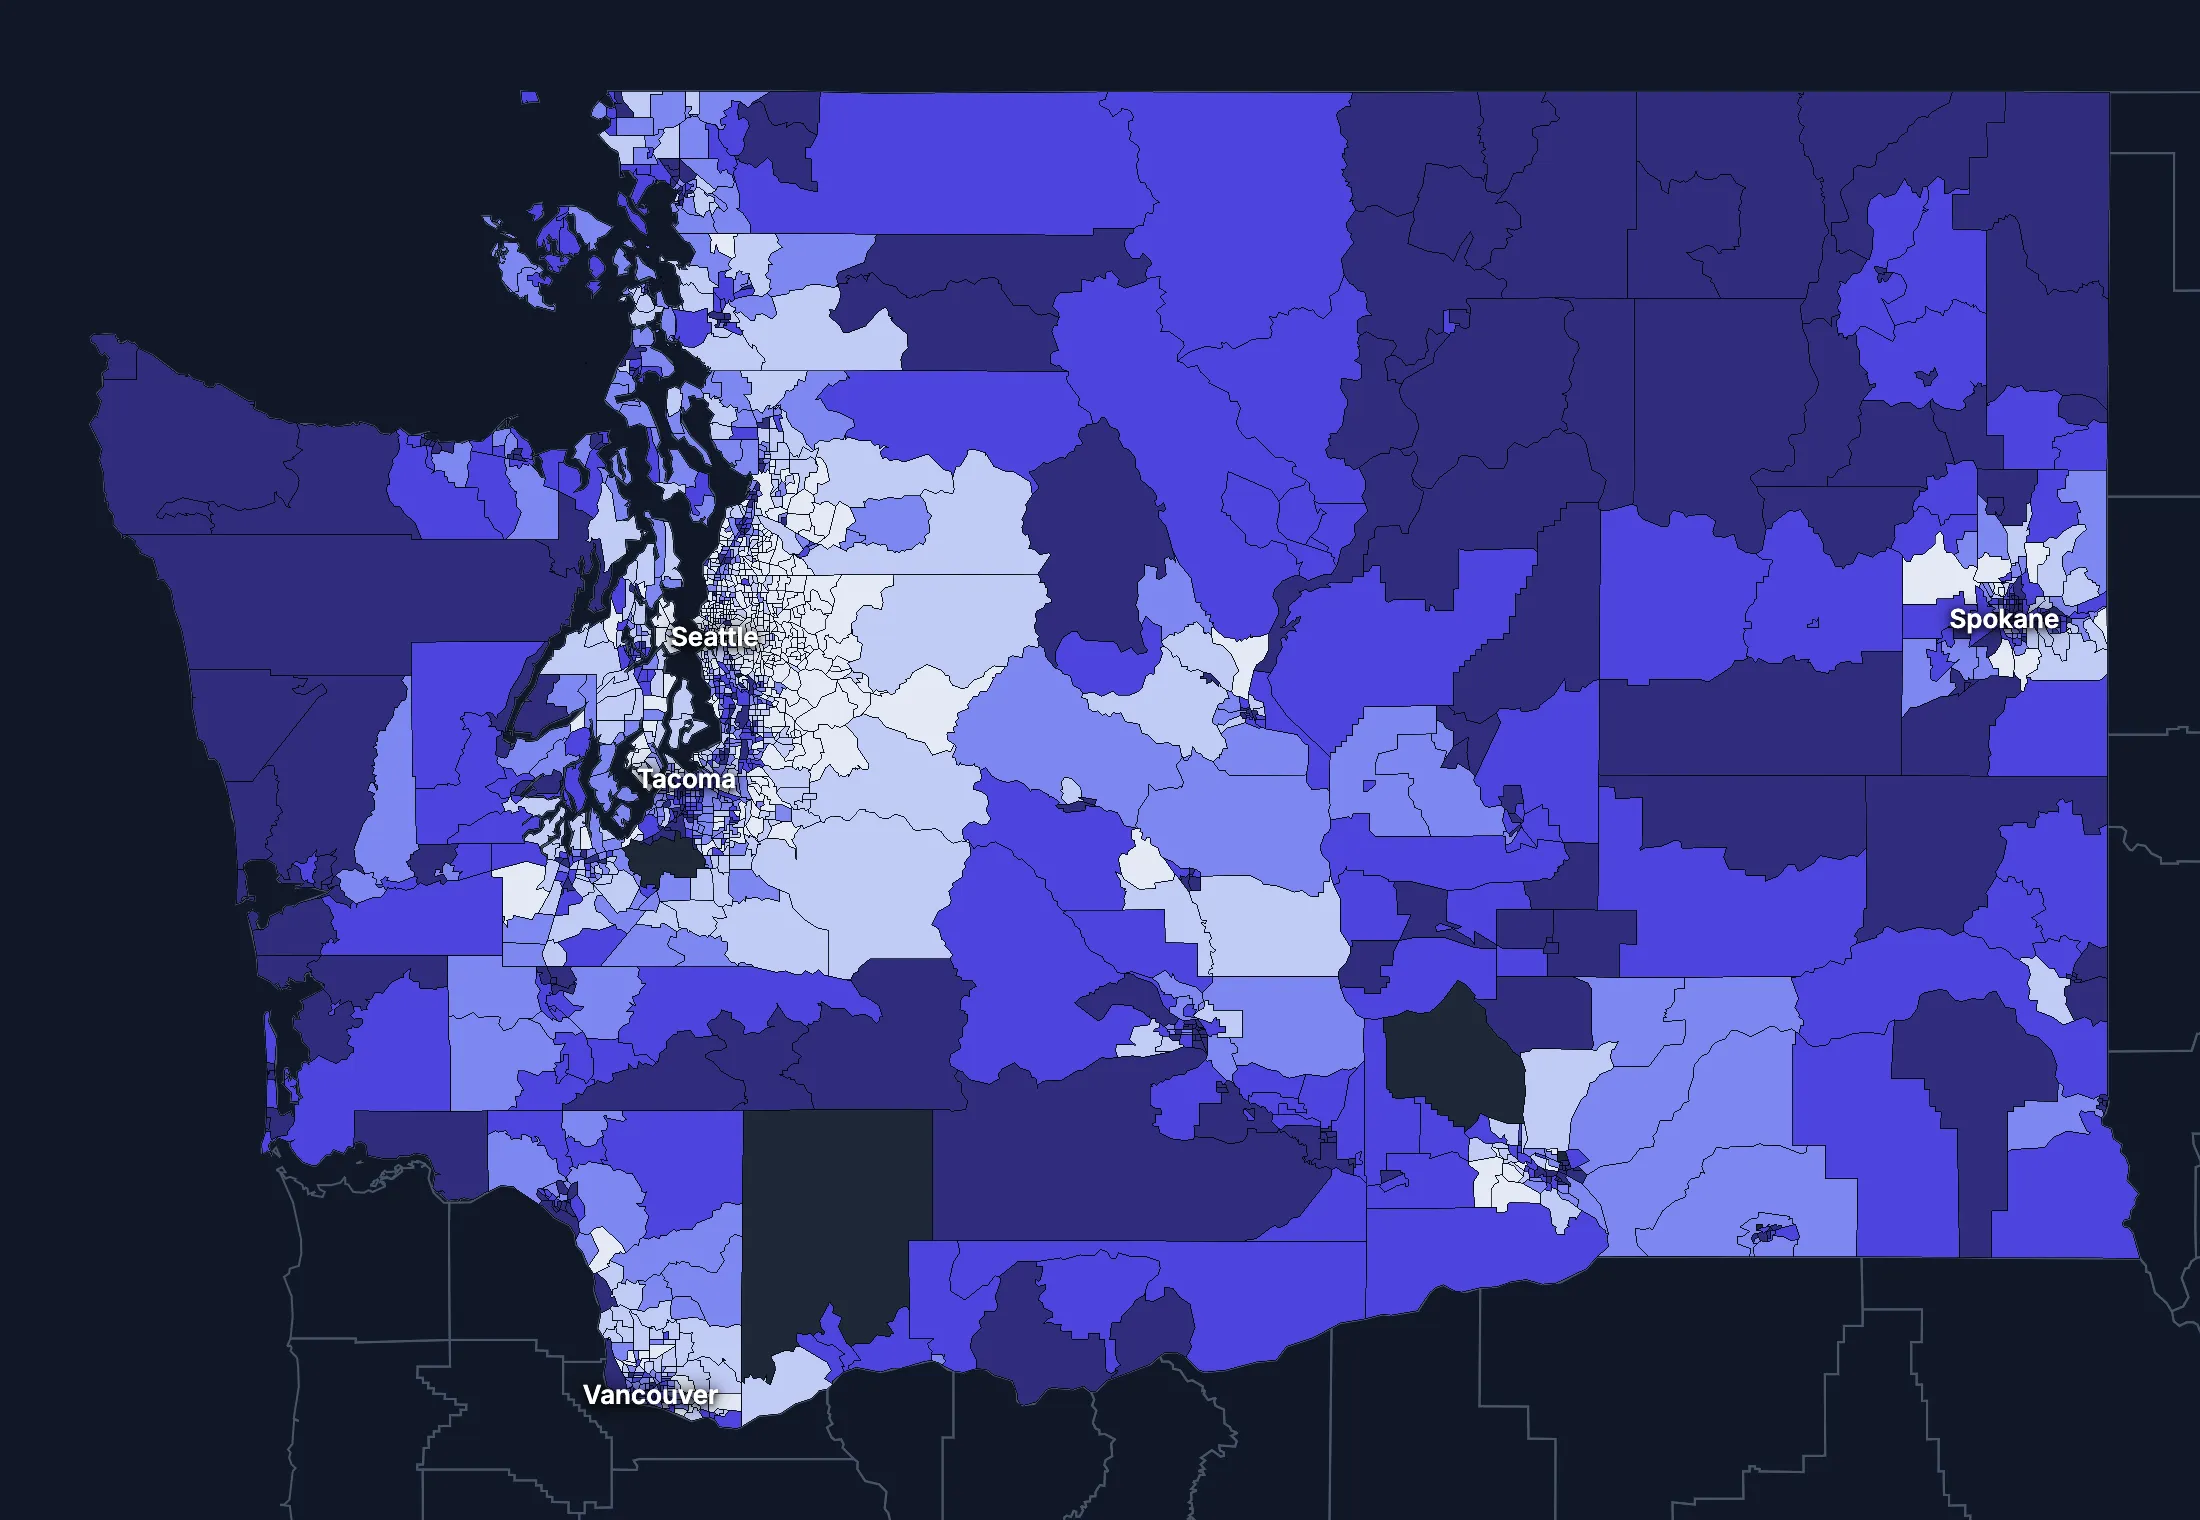
State averages hide a lot. These census tracts are the closest the census comes to neighborhoods.
Where the state’s average misleads
Each tick is one census tract, and the dark line marks the state. Hover over a tick or tap it to see the tract.
Poverty
363 of 1768 tracts are at least 1.5 times the state’s overall 9.9%, and 416 are at two-thirds of it or less.
Highest: Tract 53.05, 60.7%. Lowest: Tract 117.22, 0.2%.
Renters paying 30% or more of income
79 of 1740 tracts are at least 1.5 times the state’s overall 47.5%, and 395 are at two-thirds of it or less.
Highest: Tract 9507.01, 100.0%. Lowest: Tract 107.07, 0.0%.
Adults with a bachelor’s degree
314 of 1769 tracts are at least 1.5 times the state’s overall 39.6%, and 578 are at two-thirds of it or less.
Highest: Tract 41.01, 92.5%. Lowest: Tract 201.03, 1.3%.
Median household income
253 of 1766 tracts are at least 1.5 times the typical tract’s $96,960, and 279 are at two-thirds of it or less.
Highest: Tract 41.01, $250,000 or more. Lowest: Tract 53.04, $17,500.
American Community Survey 2020–2024 5-year estimates, by census tract. Income is capped at $250,000+ by the Census Bureau.
People
Who lives in Washington
Its median age of 38.9 is lower than the US (39.5). 16.6% of residents were born outside the US, and 22.5% speak a language other than English at home.
Age
Source: ACS 2025 1-year, table A01001.
Show data
| Washington | United States | |
|---|---|---|
| Under 18 | 20.3% ±0.2% , number 1,626,299 ±16,050 | 21.0% ±<0.1% , number 71,689,151 ±111,800 |
| 18 to 24 | 8.5% ±0.2% , number 682,121 ±14,320 | 9.3% ±<0.1% , number 31,716,680 ±98,660 |
| 25 to 34 | 15.1% ±0.1% , number 1,211,915 ±7,802 | 13.6% ±<0.1% , number 46,357,354 ±55,690 |
| 35 to 44 | 14.8% ±0.2% , number 1,180,849 ±16,680 | 13.4% ±<0.1% , number 45,746,189 ±105,700 |
| 45 to 54 | 11.7% ±0.1% , number 935,887 ±6,510 | 11.8% ±<0.1% , number 40,257,563 ±53,540 |
| 55 to 64 | 11.3% ±0.2% , number 902,598 ±13,890 | 12.1% ±<0.1% , number 41,242,904 ±104,700 |
| 65 to 74 | 10.4% ±0.2% , number 833,369 ±12,300 | 10.8% ±<0.1% , number 36,895,650 ±91,520 |
| 75 and over | 7.8% ±0.2% , number 627,982 ±12,430 | 8.2% ±<0.1% , number 27,879,368 ±78,140 |
Embed
Race and ethnicity
Source: ACS 2025 1-year, table A04001.
Show data
| Washington | United States | |
|---|---|---|
| White, not Hispanic | 59.3% ±0.1% , number 4,746,285 ±9,858 | 55.0% ±<0.1% , number 187,959,031 ±58,340 |
| Hispanic or Latino | 15.5% , number 1,240,205 | 20.5% ±<0.1% , number 69,975,516 ±13,270 |
| Black, not Hispanic | 4.0% ±0.1% , number 319,953 ±8,788 | 11.7% ±<0.1% , number 40,096,453 ±106,200 |
| Asian, not Hispanic | 11.0% ±0.1% , number 881,496 ±11,130 | 6.5% ±<0.1% , number 22,096,709 ±58,340 |
| Other or multiracial | 10.2% ±0.2% , number 813,081 ±19,330 | 6.3% ±<0.1% , number 21,657,150 ±150,100 |
Embed
Language spoken at home
Source: ACS 2025 1-year, table C16001.
Show data
| Washington | United States | |
|---|---|---|
| English only | 77.5% ±0.4% , number 5,875,480 ±31,080 | 77.1% ±0.1% , number 249,390,588 ±275,300 |
| Spanish | 9.3% ±0.2% , number 707,949 ±17,400 | 13.9% ±0.1% , number 44,921,985 ±177,800 |
| Other Indo-European | 4.8% ±0.3% , number 367,160 ±20,210 | 4.0% ±<0.1% , number 12,862,980 ±113,500 |
| Asian and Pacific Island | 6.9% ±0.3% , number 520,466 ±19,820 | 3.8% ±<0.1% , number 12,288,841 ±99,740 |
| Arabic and other | 1.5% ±0.2% , number 113,256 ±11,850 | 1.3% ±<0.1% , number 4,116,949 ±71,480 |
Embed
Marital status
Source: ACS 2025 1-year, table A11001.
Show data
| Washington | United States | |
|---|---|---|
| Now married | 49.7% ±0.4% , number 3,309,123 ±29,200 | 47.9% ±0.1% , number 135,567,564 ±223,300 |
| Never married | 33.4% ±0.3% , number 2,224,893 ±22,270 | 34.8% ±0.1% , number 98,647,238 ±152,600 |
| Divorced | 11.0% ±0.2% , number 734,195 ±16,160 | 10.2% ±<0.1% , number 28,879,967 ±112,900 |
| Widowed | 4.6% ±0.2% , number 305,246 ±10,050 | 5.5% ±<0.1% , number 15,599,094 ±69,430 |
| Separated | 1.3% ±0.1% , number 89,534 ±7,512 | 1.6% ±<0.1% , number 4,441,399 ±49,160 |
Embed
Where people lived a year ago
Source: ACS 2025 1-year, table A08001.
Show data
| Washington | United States | |
|---|---|---|
| Same home | 86.2% ±0.4% , number 6,825,959 ±31,570 | 88.4% ±0.1% , number 298,889,697 ±214,800 |
| Same county | 7.8% ±0.3% , number 617,465 ±23,050 | 6.0% ±<0.1% , number 20,202,671 ±166,300 |
| Another county in the state | 2.6% ±0.2% , number 209,753 ±15,420 | 3.0% ±<0.1% , number 10,168,097 ±89,190 |
| Another state | 2.5% ±0.2% , number 199,582 ±12,620 | 2.1% ±<0.1% , number 7,025,589 ±81,660 |
| Another country | 0.8% ±0.1% , number 63,637 ±7,784 | 0.6% ±<0.1% , number 1,984,943 ±47,210 |
Embed
Top countries of birth, among those born abroad
Source: ACS 2025 1-year, table A07001.
Show data
| Washington | |
|---|---|
| Mexico | 19.3% , number 256,981 |
| India | 10.5% , number 139,309 |
| China, Excluding Hong Kong and Taiwan | 8.0% , number 105,715 |
| Philippines | 7.2% , number 95,273 |
| Vietnam | 4.8% , number 63,639 |
| Canada | 3.5% , number 46,555 |
Embed
All the numbers
| Indicator | Washington | US | Rank among states* | Table |
|---|---|---|---|---|
| Population | 8,001,020 | 341,784,859 | 13th | A00001 |
| People per square mile | 120 | 97 | 23rd | A00002 |
| Land area (square miles) | 66,457 | – | – | A00002 |
| Median age | 38.9 ±0.1 | 39.5 ±0.1 | 36th | A01004 |
| Under 18 | 20.3% ±0.2% , number 1,626,299 ±16,050 | 21.0% ±<0.1% , number 71,689,151 ±111,800 | 33rd | B02002 |
| 65 and over | 18.3% ±0.2% , number 1,461,351 ±17,490 | 19.0% ±<0.1% , number 64,775,018 ±120,300 | 42nd | B02002 |
| Born outside the US | 16.6% ±0.3% , number 1,329,131 ±21,750 | 14.7% ±0.1% , number 50,409,320 ±204,800 | 11th | A06001 |
| Speak a language other than English at home | 22.5% ±0.4% , number 1,708,831 ±35,270 | 22.9% ±0.1% , number 74,190,755 ±244,000 | 14th | C16001 |
| Veterans (adults) | 6.9% ±0.2% , number 434,198 ±12,550 | 5.9% ±<0.1% , number 15,746,228 ±85,320 | 14th | A16002 |
| Living with a disability | 13.9% ±0.2% , number 1,098,714 ±18,810 | 13.7% ±<0.1% , number 46,271,455 ±126,000 | 29th | B18101 |
| Women 15–50 who had a baby in the past year | 4.9% ±0.3% , number 93,576 ±5,702 | 5.0% ±0.1% , number 4,016,759 ±44,040 | 31st | B13002 |
| Lived in the same home a year ago | 86.2% ±0.4% , number 6,825,959 ±31,570 | 88.4% ±0.1% , number 298,889,697 ±214,800 | 45th | A08001 |
| White, not Hispanic | 59.3% ±0.1% , number 4,746,285 ±9,858 | 55.0% ±<0.1% , number 187,959,031 ±58,340 | 29th | A04001 |
| Hispanic or Latino | 15.5% , number 1,240,205 | 20.5% ±<0.1% , number 69,975,516 ±13,270 | 15th | A04001 |
| Black, not Hispanic | 4.0% ±0.1% , number 319,953 ±8,788 | 11.7% ±<0.1% , number 40,096,453 ±106,200 | 35th | A04001 |
| Asian, not Hispanic | 11.0% ±0.1% , number 881,496 ±11,130 | 6.5% ±<0.1% , number 22,096,709 ±58,340 | 4th | A04001 |
*1 is the highest. Population is ranked among all states, and the rest among those of 1,000 people or more, whose figures can be ranked. Ranks use 5-year estimates, the only ones covering every state, so they can differ slightly from the figures here.
Income and work
Higher incomes than the US
The median household income is $101,946, higher than the US ($84,780). 10.3% of people live in poverty, and 7.0% have no health insurance, lower than the US (8.4%).
Household income
Source: ACS 2025 1-year, table A14001.
Show data
| Washington | United States | |
|---|---|---|
| Under $25,000 | 10.9% ±0.4% , number 347,147 ±12,720 | 14.0% ±0.1% , number 18,727,548 ±88,990 |
| $25,000 to $49,999 | 12.2% ±0.4% , number 387,819 ±13,240 | 15.4% ±0.1% , number 20,665,585 ±101,400 |
| $50,000 to $74,999 | 13.7% ±0.4% , number 436,582 ±12,610 | 15.3% ±0.1% , number 20,513,565 ±88,500 |
| $75,000 to $99,999 | 12.0% ±0.4% , number 380,835 ±11,250 | 12.5% ±0.1% , number 16,814,245 ±87,520 |
| $100,000 to $149,999 | 19.0% ±0.5% , number 605,313 ±15,150 | 17.9% ±0.1% , number 24,018,984 ±99,670 |
| $150,000 to $199,999 | 11.7% ±0.4% , number 373,432 ±11,950 | 10.1% ±0.1% , number 13,521,827 ±70,660 |
| $200,000 or more | 20.4% ±0.4% , number 649,001 ±13,160 | 14.8% ±0.1% , number 19,801,668 ±84,120 |
Embed
What residents do for work
Source: ACS 2025 1-year, table A17004.
Show data
| Washington | United States | |
|---|---|---|
| Education and health care | 22.7% ±0.5% , number 894,917 ±18,990 | 24.4% ±0.1% , number 40,862,193 ±140,800 |
| Professional and business services | 14.4% ±0.4% , number 569,825 ±14,930 | 12.8% ±0.1% , number 21,375,231 ±87,110 |
| Retail trade | 11.6% ±0.4% , number 458,065 ±16,150 | 10.6% ±0.1% , number 17,781,181 ±96,660 |
| Manufacturing | 8.9% ±0.3% , number 351,498 ±10,820 | 9.6% ±0.1% , number 16,064,394 ±91,270 |
| Arts, food and lodging | 8.7% ±0.3% , number 344,812 ±11,960 | 8.9% ±0.1% , number 14,811,502 ±87,840 |
| Construction | 6.2% ±0.3% , number 245,419 ±12,610 | 6.7% ±<0.1% , number 11,254,981 ±79,620 |
| Transportation and warehousing | 5.6% ±0.3% , number 221,212 ±10,910 | 5.9% ±<0.1% , number 9,832,211 ±73,020 |
| Public administration | 5.2% ±0.3% , number 206,256 ±10,450 | 4.7% ±<0.1% , number 7,944,601 ±69,540 |
Embed
Where workers come from and go
Washington has 3,519,988 jobs and 3,558,507 employed residents. 112,467 people commute in to work and 150,986 commute out, while 3,407,521 both live and work here. The most commuters come from Oregon.
Most commuters come from
- Oregon: 47,296
- Idaho: 29,561
- California: 10,248
Most residents commute to
- Oregon: 100,677
- Idaho: 20,377
- California: 9,006
Show data
| Washington | |
|---|---|
| Live and work here | 3,407,521 |
| Work here, live elsewhere | 112,467 |
| Live here, work elsewhere | 150,986 |
Embed
All the numbers
| Indicator | Washington | US | Rank among states* | Table |
|---|---|---|---|---|
| Median household income | $101,946 ±$719 | $84,780 ±$215 | 8th | A14006 |
| Income per person | $56,777 ±$592 | $47,171 ±$115 | 5th | A14024 |
| Income inequality (Gini index) | 0.472 ±0.004 | 0.482 ±0.001 | 23rd | A14028 |
| Living in poverty | 10.3% ±0.4% , number 810,880 ±29,350 | 11.8% ±0.1% , number 39,264,183 ±277,400 | 44th | A13004 |
| Unemployment rate | 5.5% ±0.2% , number 230,092 ±10,500 | 4.9% ±<0.1% , number 8,574,594 ±64,350 | 22nd | A17005 |
| No health insurance | 7.0% ±0.2% , number 549,620 ±17,320 | 8.4% ±<0.1% , number 28,323,306 ±152,000 | 32nd | A20001 |
*1 is the highest. Population is ranked among all states, and the rest among those of 1,000 people or more, whose figures can be ranked. Ranks use 5-year estimates, the only ones covering every state, so they can differ slightly from the figures here.
Education
More college degrees than the US
41.4% of adults 25 and over have a bachelor’s degree or more, higher than the US (37.4%).
Highest level of education
Source: ACS 2025 1-year, table A12001.
Show data
| Washington | United States | |
|---|---|---|
| Less than high school | 7.3% ±0.3% , number 417,838 ±15,470 | 9.4% ±0.1% , number 22,321,002 ±120,500 |
| High school only | 21.9% ±0.4% , number 1,245,563 ±24,910 | 25.6% ±0.1% , number 61,096,726 ±203,400 |
| Some college | 29.3% ±0.5% , number 1,670,381 ±26,990 | 27.7% ±0.1% , number 65,920,977 ±173,500 |
| Bachelor’s degree | 24.7% ±0.4% , number 1,405,445 ±21,400 | 22.3% ±0.1% , number 53,224,312 ±196,700 |
| Graduate degree | 16.7% ±0.3% , number 953,373 ±18,950 | 15.0% ±0.1% , number 35,816,011 ±159,400 |
Embed
All the numbers
| Indicator | Washington | US | Rank among states* | Table |
|---|---|---|---|---|
| Bachelor’s degree or more | 41.4% ±0.5% , number 2,358,818 ±28,590 | 37.4% ±0.1% , number 89,040,323 ±253,200 | 11th | A12001 |
| High school graduate or more | 92.7% ±0.8% , number 5,274,762 ±46,540 | 90.6% ±0.2% , number 216,058,026 ±368,200 | 16th | A12001 |
*1 is the highest. Population is ranked among all states, and the rest among those of 1,000 people or more, whose figures can be ranked. Ranks use 5-year estimates, the only ones covering every state, so they can differ slightly from the figures here.
Housing
Home values outran incomes
37.2% of households rent, higher than the US (34.7%). The median home is worth $605,600 and the median rent is $1,873. After inflation, home values rose 56% from 2015 to 2025, while household income rose 16%.
Housing costs and income, 2015 to 2025, after inflation
Source: ACS 1-year, table A10036, A18009, A14006.
Show data
| Washington | United States | |
|---|---|---|
| Median home value | +55.6% | +39.3% |
| Median rent | +26.6% | +18.5% |
| Median household income | +16.0% | +10.9% |
Embed
Types of homes
Source: ACS 2025 1-year, table A10032.
Show data
| Washington | United States | |
|---|---|---|
| Single-family, detached | 60.8% ±0.5% , number 2,090,952 ±15,580 | 60.9% ±0.1% , number 90,335,844 ±173,300 |
| Single-family, attached | 4.8% ±0.2% , number 164,126 ±8,037 | 6.4% ±<0.1% , number 9,527,703 ±51,230 |
| 2 to 4 units | 5.9% ±0.3% , number 202,749 ±9,442 | 7.5% ±0.1% , number 11,109,005 ±75,790 |
| 5 to 19 units | 8.8% ±0.3% , number 302,833 ±11,870 | 8.7% ±0.1% , number 12,829,882 ±97,590 |
| 20 or more units | 14.2% ±0.4% , number 488,005 ±13,780 | 11.1% ±0.1% , number 16,381,450 ±92,310 |
| Mobile homes and other | 5.5% ±0.2% , number 188,144 ±6,325 | 5.4% ±<0.1% , number 8,045,083 ±53,680 |
Embed
When homes were built
Source: ACS 2025 1-year, table A10055.
Show data
| Washington | United States | |
|---|---|---|
| 2010 or later | 18.0% ±0.5% , number 571,414 ±15,360 | 15.1% ±0.1% , number 20,257,912 ±101,300 |
| 2000 to 2009 | 15.4% ±0.4% , number 490,141 ±12,840 | 13.8% ±0.1% , number 18,535,840 ±92,260 |
| 1980 to 1999 | 25.9% ±0.5% , number 823,552 ±17,530 | 24.1% ±0.1% , number 32,332,570 ±118,900 |
| 1960 to 1979 | 21.8% ±0.5% , number 693,415 ±16,680 | 22.9% ±0.1% , number 30,726,302 ±110,000 |
| Before 1960 | 18.9% ±0.5% , number 601,607 ±14,650 | 24.0% ±0.1% , number 32,210,798 ±121,500 |
Embed
All the numbers
| Indicator | Washington | US | Rank among states* | Table |
|---|---|---|---|---|
| Housing units | 3,436,809 | – | – | A10001 |
| Households | 3,180,129 ±10,710 | – | – | A10008 |
| People per household | 2.47 ±0.01 | 2.49 ±0.01 | 14th | A10003 |
| Households that rent | 37.2% ±0.5% , number 1,182,426 ±16,490 | 34.7% ±0.1% , number 46,551,688 ±193,200 | 11th | A10060 |
| Vacant homes | 7.5% ±0.3% , number 256,680 ±10,950 | 9.6% ±0.1% , number 14,165,545 ±137,100 | 50th | A10047, A10060 |
| Median gross rent | $1,873 ±$16 | $1,557 ±$4 | 6th | A18009 |
| Median home value | $605,600 ±$4,205 | $371,100 ±$646 | 4th | A10036 |
| Renters paying 30% or more of income | 48.2% ±1.3% , number 570,011 ±16,890 | 48.3% ±0.2% , number 22,486,693 ±122,100 | 16th | A18002 |
| Owners paying 30% or more of income | 26.1% ±0.6% , number 522,271 ±13,610 | 24.2% ±0.1% , number 21,201,943 ±93,050 | 14th | A10040 |
| Homes built before 1960 | 18.9% ±0.5% , number 601,607 ±14,650 | 24.0% ±0.1% , number 32,210,798 ±121,500 | 31st | A10055 |
*1 is the highest. Population is ranked among all states, and the rest among those of 1,000 people or more, whose figures can be ranked. Ranks use 5-year estimates, the only ones covering every state, so they can differ slightly from the figures here.
Getting around
How people get around
65.1% of workers drive alone and 15.7% work from home. 38.8% of those who travel to work spend 30 minutes or more getting there, and 7.7% of households have no vehicle.
How people get to work
Source: ACS 2025 1-year, table A09005.
Show data
| Washington | United States | |
|---|---|---|
| Drive alone | 65.1% ±0.5% , number 2,546,482 ±23,140 | 69.8% ±0.1% , number 115,297,377 ±192,900 |
| Carpool | 9.3% ±0.4% , number 365,727 ±14,080 | 8.9% ±0.1% , number 14,712,170 ±97,240 |
| Public transit | 5.2% ±0.3% , number 203,308 ±10,960 | 4.3% ±<0.1% , number 7,100,386 ±63,330 |
| Walk | 2.9% ±0.2% , number 112,669 ±6,777 | 2.4% ±<0.1% , number 4,016,469 ±41,070 |
| Work from home | 15.7% ±0.3% , number 614,198 ±13,670 | 12.9% ±0.1% , number 21,288,393 ±105,700 |
| Other | 1.8% ±0.2% , number 69,674 ±5,886 | 1.7% ±<0.1% , number 2,799,658 ±41,510 |
Embed
Time spent getting to work
Source: ACS 2025 1-year, table B09001.
Show data
| Washington | United States | |
|---|---|---|
| Under 10 minutes | 11.9% ±0.4% , number 393,072 ±13,560 | 12.0% ±0.1% , number 17,199,225 ±93,440 |
| 10 to 19 minutes | 28.6% ±0.7% , number 942,579 ±23,140 | 27.8% ±0.1% , number 40,059,540 ±137,700 |
| 20 to 29 minutes | 20.7% ±0.5% , number 682,209 ±16,330 | 21.0% ±0.1% , number 30,221,743 ±111,100 |
| 30 to 39 minutes | 16.6% ±0.5% , number 547,368 ±15,510 | 17.1% ±0.1% , number 24,659,138 ±103,800 |
| 40 to 59 minutes | 12.8% ±0.4% , number 423,378 ±14,380 | 12.6% ±0.1% , number 18,104,709 ±97,070 |
| 60 minutes or more | 9.4% ±0.3% , number 309,254 ±11,590 | 9.5% ±0.1% , number 13,681,705 ±84,440 |
Embed
Vehicles per household
Source: ACS 2025 1-year, table A10030.
Show data
| Washington | United States | |
|---|---|---|
| None | 7.7% ±0.3% , number 244,502 ±10,110 | 8.8% ±0.1% , number 11,781,997 ±77,240 |
| One | 30.8% ±0.6% , number 978,281 ±18,970 | 33.1% ±0.1% , number 44,424,682 ±160,700 |
| Two | 35.8% ±0.6% , number 1,137,661 ±18,630 | 36.0% ±0.1% , number 48,200,889 ±176,800 |
| Three or more | 25.8% ±0.5% , number 819,685 ±17,070 | 22.1% ±0.1% , number 29,655,854 ±113,300 |
Embed
All the numbers
| Indicator | Washington | US | Rank among states* | Table |
|---|---|---|---|---|
| Drive to work alone | 65.1% ±0.5% , number 2,546,482 ±23,140 | 69.8% ±0.1% , number 115,297,377 ±192,900 | 47th | A09005 |
| Take public transit | 5.2% ±0.3% , number 203,308 ±10,960 | 4.3% ±<0.1% , number 7,100,386 ±63,330 | 10th | A09005 |
| Work from home | 15.7% ±0.3% , number 614,198 ±13,670 | 12.9% ±0.1% , number 21,288,393 ±105,700 | 3rd | A09005 |
| Commute 30 minutes or more | 38.8% ±0.7% , number 1,280,000 ±24,110 | 39.2% ±0.1% , number 56,445,552 ±165,300 | 13th | B09001 |
| Households with no vehicle | 7.7% ±0.3% , number 244,502 ±10,260 | 8.8% ±<0.1% , number 11,781,997 ±64,240 | 17th | A10030 |
*1 is the highest. Population is ranked among all states, and the rest among those of 1,000 people or more, whose figures can be ranked. Ranks use 5-year estimates, the only ones covering every state, so they can differ slightly from the figures here.
Places
The largest cities in Washington
Population, from the latest estimates available. Figures cover the whole of each place.
Largest cities
States like this one
- Illinois: 12,694,798
- Virginia: 8,705,170
- Maryland: 6,206,011
- Connecticut: 3,624,508
States at least a third this size, with the closest income, education, age, housing and origins.
Every county and place in Washington
Find any county, city, town, metro area, ZIP code, school district or district in Washington.
Counties
Each of the 39 counties with its population, from ACS 2020–2024 5-year estimates.
- Adams County20,800
- Asotin County22,467
- Benton County212,905
- Chelan County80,172
- Clallam County77,813
- Clark County516,959
- Columbia County4,014
- Cowlitz County112,360
- Douglas County44,366
- Ferry County7,387
- Franklin County98,902
- Garfield County2,353
- Grant County101,799
- Grays Harbor County77,053
- Island County86,836
- Jefferson County33,577
- King County2.29M
- Kitsap County277,881
- Kittitas County47,172
- Klickitat County23,411
- Lewis County85,154
- Lincoln County11,489
- Mason County67,982
- Okanogan County43,425
- Pacific County23,994
- Pend Oreille County14,050
- Pierce County930,319
- San Juan County18,478
- Skagit County131,328
- Skamania County12,402
- Snohomish County844,430
- Spokane County549,056
- Stevens County48,067
- Thurston County299,067
- Wahkiakum County4,658
- Walla Walla County62,161
- Whatcom County230,503
- Whitman County47,003
- Yakima County257,152
Cities, towns and other places
Each of the 628 with its population, from ACS 2020–2024 5-year estimates. Census-designated places are communities without a local government of their own, drawn by the Census Bureau so they can be counted.
- Aberdeen17,088
- Aberdeen Gardens309
- Acme223
- Addy117
- Ahtanum3,777
- Airway Heights11,245
- Albion495
- Alder96
- Alderton2,706
- Alderwood Manor10,266
- Alger687
- Algona3,247
- Allyn2,404
- Almira360
- Altoona43
- Amanda Park86
- Amboy1,692
- Ames Lake1,245
- Anacortes17,966
- Anderson Island1,448
- Arlington21,095
- Arlington Heights2,727
- Artondale14,073
- Ashford319
- Asotin1,021
- Auburn85,676
- Bainbridge Island24,631
- Bangor Base6,112
- Banks Lake South348
- Barberton8,668
- Baring177
- Barney's Junction63
- Barstow246
- Basin City1,176
- Battle Ground21,886
- Bay Center206
- Bay View572
- Beacon Hill1,804
- Beaux Arts Village233
- Belfair4,557
- Bell Hill1,041
- Bellevue151,847
- Bellingham93,438
- Benton City3,695
- Bethel4,394
- Beverly356
- Bickleton72
- Big Lake2,326
- Bingen652
- Birch Bay10,837
- Black Diamond5,961
- Blaine6,100
- Blyn134
- Bonney Lake22,090
- Bothell49,610
- Bothell East14,578
- Bothell West22,029
- Boulevard Park4,575
- Bow585
- Brady832
- Bremerton44,830
- Brewster1,653
- Bridgeport1,792
- Brier6,545
- Brinnon758
- Browns Point979
- Brush Prairie2,526
- Bryant2,648
- Bryn Mawr-Skyway17,638
- Buckley5,371
- Bucoda494
- Buena791
- Bunk Foss3,627
- Burbank3,589
- Burien51,513
- Burley2,443
- Burlington10,003
- Camano17,303
- Camas27,007
- Canterwood2,971
- Canyon Creek3,910
- Carbonado704
- Carlsborg1,231
- Carnation2,366
- Carson2,318
- Cascade Valley4,609
- Cashmere3,304
- Castle Rock2,217
- Cathcart2,064
- Cathlamet616
- Cavalero1,591
- Centerville75
- Central Park3,206
- Centralia18,830
- Chain Lake4,950
- Chehalis7,587
- Chelan4,350
- Chelan Falls233
- Cheney12,804
- Cherry Grove779
- Chewelah2,606
- Chico3,336
- Chinook541
- Clallam Bay602
- Clarkston7,191
- Clarkston Heights-Vineland7,884
- Clayton139
- Cle Elum1,905
- Clear Lake (Pierce County)1,271
- Clear Lake (Skagit County)1,093
- Clearview3,254
- Cliffdell157
- Clinton1,419
- Clover Creek7,345
- Clyde Hill3,119
- Cohassett Beach455
- Colfax2,708
- College Place9,854
- Colton323
- Colville4,998
- Conconully182
- Concrete833
- Connell5,054
- Conway46
- Copalis Beach671
- Cosmopolis2,202
- Cottage Lake22,518
- Cougar151
- Coulee City439
- Coulee Dam1,595
- Country Homes6,198
- Coupeville1,980
- Covington21,233
- Cowiche364
- Crescent Bar271
- Creston235
- Crocker1,254
- Curlew126
- Curlew Lake533
- Cusick133
- Custer477
- Dallesport1,603
- Danville9
- Darrington1,412
- Dash Point889
- Davenport1,774
- Dayton2,774
- Deep River147
- Deer Park4,791
- Deming568
- Des Moines32,823
- Desert Aire2,788
- Disautel34
- Dixie133
- Dollars Corner638
- Donald110
- Duluth1,656
- DuPont9,931
- Duvall8,526
- East Cathlamet934
- East Port Orchard4,725
- East Renton Highlands12,582
- East Wenatchee14,199
- Eastmont23,721
- Easton647
- Eatonville2,850
- Edgewood13,032
- Edison249
- Edmonds42,735
- Electric City820
- Elk Plain14,276
- Ellensburg20,874
- Elma3,483
- Elmer City332
- Endicott425
- Enetai2,387
- Entiat1,284
- Enumclaw12,798
- Ephrata8,560
- Erlands Point854
- Eschbach181
- Esperance4,189
- Everett111,845
- Everson3,040
- Fairchild AFB2,931
- Fairfield621
- Fairwood (King County)17,856
- Fairwood (Spokane County)10,674
- Fall City1,618
- Farmington140
- Federal Way99,493
- Felida10,841
- Fern Prairie2,053
- Ferndale15,999
- Fife10,949
- Fife Heights1,446
- Finley5,634
- Fircrest7,069
- Five Corners21,194
- Fobes Hill2,569
- Fords Prairie1,823
- Forks3,400
- Fort Lewis15,167
- Four Lakes322
- Fox Island3,414
- Frederickson25,383
- Freeland1,548
- Friday Harbor2,728
- Garfield475
- Garrett1,697
- Geneva2,073
- George669
- Gig Harbor12,424
- Glacier339
- Gleed2,844
- Glenwood190
- Gold Bar2,390
- Goldendale3,483
- Gorst550
- Graham35,079
- Grand Coulee913
- Grand Mound3,287
- Grandview11,187
- Granger3,705
- Granite Falls4,659
- Grapeview1,088
- Grayland708
- Grays River195
- Green Bluff323
- Greenwater59
- Hamilton252
- Hansville3,384
- Harrah662
- Harrington468
- Hartline182
- Hatton429
- Hazel Dell23,237
- Herron Island119
- High Bridge3,196
- Hobart6,552
- Hockinson6,150
- Hogans Corner8
- Home1,665
- Hoodsport216
- Hoquiam8,800
- Humptulips140
- Hunts Point289
- Ilwaco1,365
- Inchelium455
- Index173
- Indianola3,468
- Ione409
- Issaquah39,591
- Jamestown390
- Kahlotus124
- Kalama3,050
- Kapowsin466
- Kayak Point1,883
- Keller212
- Kelso12,684
- Kendall657
- Kenmore23,741
- Kennewick85,295
- Kent135,603
- Kettle Falls1,575
- Key Center3,544
- Keyport221
- Kingston2,496
- Kirkland92,621
- Kitsap Lake2,186
- Kittitas1,221
- Klickitat501
- Krupp33
- La Center3,883
- La Conner873
- La Grande288
- Lacey57,737
- LaCrosse357
- Lake Bosworth907
- Lake Cassidy3,292
- Lake Cavanaugh304
- Lake Forest Park13,335
- Lake Goodwin5,536
- Lake Holm3,555
- Lake Ketchum1,235
- Lake Marcel-Stillwater1,549
- Lake McMurray569
- Lake Morton-Berrydale11,183
- Lake Roesiger815
- Lake Shore6,978
- Lake Stevens40,253
- Lake Stickney15,890
- Lake Tapps12,798
- Lakeland North15,950
- Lakeland South13,100
- Lakeview1,584
- Lakewood62,937
- Lamont170
- Langley1,044
- Larch Way4,424
- Latah235
- Leavenworth2,569
- Lebam436
- Lewisville2,465
- Lexington4,413
- Liberty Lake12,737
- Lind565
- Lochsloy3,029
- Lofall1,800
- Long Beach1,792
- Longbranch4,638
- Longview38,069
- Longview Heights4,357
- Loomis135
- Loon Lake906
- Lower Elochoman271
- Lyle218
- Lyman437
- Lynden16,234
- Lynnwood40,110
- Mabton2,536
- Machias1,276
- Malden100
- Malo35
- Malone518
- Malott447
- Maltby10,910
- Manchester5,956
- Mansfield298
- Manson1,462
- Maple Falls209
- Maple Heights-Lake Desire4,113
- Maple Valley28,287
- Maplewood5,803
- Marblemount291
- Marcus242
- Marietta-Alderwood3,754
- Marine View471
- Markham166
- Marrowstone1,164
- Martha Lake22,634
- Maryhill23
- Marysville73,002
- Mattawa3,616
- May Creek791
- McChord AFB2,999
- McCleary2,094
- McKenna669
- McMillin1,348
- Mead6,893
- Meadow Glade2,281
- Meadowdale3,009
- Medical Lake4,950
- Medina2,928
- Mercer Island25,307
- Mesa502
- Metaline150
- Metaline Falls361
- Methow58
- Midland9,050
- Mill Creek20,956
- Mill Creek East25,453
- Millwood1,890
- Milton8,894
- Mineral7
- Minnehaha11,482
- Mirrormont4,019
- Moclips82
- Monroe19,755
- Monroe North1,456
- Montesano4,183
- Morton1,206
- Moses Lake26,083
- Moses Lake North4,517
- Mossyrock875
- Mount Vernon35,377
- Mount Vista10,764
- Mountlake Terrace23,104
- Moxee4,625
- Mukilteo21,323
- Naches1,059
- Napavine2,158
- Naselle528
- Navy Yard City2,672
- Neah Bay955
- Neilton299
- Nespelem151
- Nespelem Community358
- Newcastle12,989
- Newport2,181
- Nile349
- Nisqually Indian Community628
- Nooksack1,794
- Normandy Park6,659
- North Bend7,953
- North Bonneville1,112
- North Fort Lewis6,337
- North Lynnwood23,339
- North Omak416
- North Puyallup1,653
- North Sultan355
- North Yelm2,522
- Northport164
- Northwest Stanwood72
- Oak Harbor24,362
- Oakesdale396
- Oakville878
- Ocean City187
- Ocean Park2,122
- Ocean Shores7,302
- Ocosta235
- Odessa783
- Okanogan2,470
- Olympia55,951
- Omak5,036
- Onalaska848
- Orchards29,438
- Orient87
- Oroville1,605
- Orting8,978
- Oso245
- Othello8,795
- Otis Orchards-East Farms5,454
- Outlook594
- Oyehut111
- Pacific7,066
- Packwood99
- Palouse1,147
- Parker116
- Parkland38,742
- Parkwood6,873
- Pasco79,575
- Pataha71
- Pateros583
- Pe Ell538
- Peaceful Valley2,858
- Picnic Point10,261
- Point Roberts1,288
- Pomeroy1,354
- Port Angeles20,118
- Port Angeles East3,137
- Port Gamble Tribal Community624
- Port Hadlock-Irondale3,884
- Port Ludlow2,891
- Port Orchard17,149
- Port Townsend10,438
- Porter155
- Poulsbo12,165
- Prairie Heights4,998
- Prairie Ridge12,074
- Prescott389
- Prosser6,305
- Puget Island1,008
- Pullman32,229
- Purdy1,344
- Puyallup42,746
- Queets55
- Qui-nai-elt Village134
- Quilcene362
- Quincy7,998
- Raft Island333
- Rainier2,455
- Ravensdale198
- Raymond3,210
- Reardan726
- Redmond77,353
- Renton105,317
- Republic984
- Richland62,753
- Ridgefield13,408
- Ritzville1,855
- River Road756
- Riverbend1,748
- Riverpoint831
- Riverside471
- Roche Harbor778
- Rochester5,834
- Rock Island1,251
- Rockford493
- Rockport95
- Rocky Point1,716
- Ronald119
- Roosevelt200
- Rosalia513
- Rosburg528
- Rosedale4,208
- Roslyn1,076
- Roy735
- Royal City1,683
- Ruston1,245
- Ryderwood401
- Salmon Creek20,017
- Sammamish66,463
- Santiago96
- Satsop780
- Schwana387
- Seabeck787
- SeaTac32,414
- Seattle754,195
- Sedro-Woolley12,831
- Selah8,437
- Sequim8,161
- Shadow Lake2,465
- Shelton10,612
- Shoreline61,431
- Silver Firs22,306
- Silverdale20,685
- Sisco Heights3,015
- Skamokawa Valley352
- Skokomish560
- Skykomish92
- Snohomish10,239
- Snoqualmie13,798
- Snoqualmie Pass428
- Soap Lake1,508
- South Bend1,869
- South Cle Elum579
- South Creek2,191
- South Hill68,025
- South Prairie309
- South Wenatchee1,226
- Southworth2,286
- Spanaway34,019
- Spangle322
- Spokane230,293
- Spokane Valley106,365
- Sprague583
- Springdale451
- St. John607
- Stansberry Lake1,807
- Stanwood8,373
- Starbuck93
- Startup555
- Steilacoom6,686
- Steptoe162
- Stevenson1,603
- Sudden Valley6,084
- Sultan6,116
- Sumas1,512
- Summit8,791
- Summit View8,480
- Summitview2,321
- Sumner10,733
- Suncrest5,345
- Sunday Lake1,375
- Sunland Estates91
- Sunnyside16,277
- Sunnyslope3,706
- Suquamish4,084
- Swede Heaven746
- Tacoma222,758
- Taholah833
- Tampico604
- Tanglewilde6,314
- Tehaleh9,561
- Tekoa690
- Tenino2,025
- Terrace Heights10,041
- Thorp230
- Three Lakes4,055
- Tieton1,597
- Tokeland122
- Toledo542
- Tonasket993
- Toppenish8,723
- Torboy53
- Touchet558
- Town and Country4,890
- Tracyton6,137
- Trout Lake720
- Tukwila21,451
- Tumwater26,956
- Twin Lakes115
- Twisp1,179
- Union457
- Union Gap6,584
- Union Hill-Novelty Hill23,047
- Uniontown400
- University Place34,911
- Upper Elochoman49
- Vader745
- Valley135
- Vancouver195,300
- Vashon9,934
- Vaughn753
- Venersborg4,262
- Verlot224
- Waitsburg1,083
- Walla Walla33,925
- Walla Walla East2,099
- Waller7,683
- Wallula145
- Wapato4,538
- Warden2,581
- Warm Beach3,442
- Washougal17,490
- Washtucna292
- Waterville1,250
- Wauna4,805
- Waverly166
- Wenatchee35,484
- West Clarkston-Highland5,444
- West Pasco1,122
- West Richland17,586
- Westport2,217
- Wheeler230
- Whidbey Island Station2,027
- White Center14,886
- White Salmon2,548
- White Swan588
- Wilbur842
- Wilderness Rim1,560
- Wilkeson552
- Willapa172
- Wilson Creek206
- Winlock2,140
- Winthrop423
- Wishram411
- Wollochet6,689
- Woodinville13,438
- Woodland6,487
- Woods Creek6,943
- Woodway1,251
- Yacolt1,684
- Yakima96,961
- Yarrow Point1,198
- Yelm11,102
- Zillah3,140
Metro and micro areas
Each of the 23 that reach into Washington, with its whole population, from ACS 2020–2024 5-year estimates. Metro and micro areas are counties tied together by commuting, drawn by the Office of Management and Budget.
- Aberdeen, WA Micro Area77,053
- Bellingham, WA Metro Area230,503
- Bremerton-Silverdale-Port Orchard, WA Metro Area277,881
- Centralia, WA Micro Area85,154
- Ellensburg, WA Micro Area47,172
- Kennewick-Richland, WA Metro Area311,807
- Lewiston, ID-WA Metro Area65,164
- Longview-Kelso, WA Metro Area112,360
- Moses Lake, WA Micro Area101,799
- Mount Vernon-Anacortes, WA Metro Area131,328
- Oak Harbor, WA Micro Area86,836
- Olympia-Lacey-Tumwater, WA Metro Area299,067
- Othello, WA Micro Area20,800
- Port Angeles, WA Micro Area77,813
- Port Townsend, WA Micro Area33,577
- Portland-Vancouver-Hillsboro, OR-WA Metro Area2.52M
- Pullman, WA Micro Area47,003
- Seattle-Tacoma-Bellevue, WA Metro Area4.06M
- Shelton, WA Micro Area67,982
- Spokane-Spokane Valley, WA Metro Area597,123
- Walla Walla, WA Metro Area62,161
- Wenatchee-East Wenatchee, WA Metro Area124,538
- Yakima, WA Metro Area257,152
ZIP codes
Each of the 597 with people in it, by the town it's centered in, from ACS 2020–2024 5-year estimates. These are the Census Bureau's ZIP Code Tabulation Areas, which follow the Postal Service's ZIP codes as closely as census blocks allow.
- 98001Auburn37,460
- 98002Auburn37,509
- 98003Federal Way51,619
- 98004Bellevue39,897
- 98005Bellevue21,846
- 98006Bellevue40,009
- 98007Bellevue27,692
- 98008Bellevue27,242
- 98010Black Diamond6,857
- 98011Bothell28,963
- 98012Mill Creek East77,041
- 98014Lake Marcel-Stillwater8,264
- 98019Duvall12,242
- 98020Edmonds19,551
- 98021Bothell35,631
- 98022Greenwater22,418
- 98023Federal Way50,448
- 98024Fall City3,908
- 98025Mirrormont52
- 98026Edmonds38,976
- 98027Mirrormont28,955
- 98028Kenmore23,741
- 98029Issaquah30,586
- 98030Kent38,523
- 98031Kent40,094
- 98032Kent40,862
- 98033Kirkland40,982
- 98034Kirkland52,531
- 98036Alderwood Manor42,370
- 98037Lynnwood29,723
- 98038Hobart37,324
- 98039Medina2,928
- 98040Mercer Island25,307
- 98042Covington50,216
- 98043Mountlake Terrace23,101
- 98045Riverpoint15,289
- 98047Pacific6,817
- 98050Fall City108
- 98051Ravensdale3,442
- 98052Redmond80,717
- 98053Union Hill-Novelty Hill22,765
- 98055Renton24,660
- 98056Renton35,849
- 98057Renton12,705
- 98058Fairwood42,980
- 98059East Renton Highlands42,406
- 98065Snoqualmie15,944
- 98068Snoqualmie Pass482
- 98070Vashon9,934
- 98072Woodinville24,446
- 98074Sammamish30,761
- 98075Sammamish25,498
- 98077Cottage Lake14,109
- 98087North Lynnwood41,796
- 98092Lake Holm50,224
- 98101Seattle17,153
- 98102Seattle27,333
- 98103Seattle52,671
- 98104Seattle16,542
- 98105Seattle49,767
- 98106Seattle28,690
- 98107Seattle28,776
- 98108Seattle25,529
- 98109Seattle34,328
- 98110Bainbridge Island24,631
- 98112Seattle23,921
- 98115Seattle54,349
- 98116Seattle28,711
- 98117Seattle35,711
- 98118Seattle50,500
- 98119Seattle26,879
- 98121Seattle21,166
- 98122Seattle43,234
- 98125Seattle44,520
- 98126Seattle22,975
- 98133Shoreline53,249
- 98134Seattle645
- 98136Seattle17,252
- 98144Seattle33,787
- 98146Burien28,573
- 98148Burien9,715
- 98155Lake Forest Park36,511
- 98164Seattle292
- 98166Normandy Park22,082
- 98168Burien35,528
- 98177Shoreline21,090
- 98178Bryn Mawr-Skyway26,748
- 98188SeaTac27,311
- 98195Seattle2,757
- 98198Des Moines40,463
- 98199Seattle22,468
- 98201Everett31,895
- 98203Everett35,517
- 98204Everett45,130
- 98207Everett843
- 98208Eastmont60,915
- 98220Acme541
- 98221Anacortes23,562
- 98222121
- 98223Oso46,497
- 98224Baring190
- 98225Bellingham50,216
- 98226Bellingham46,782
- 98229Geneva33,298
- 98230Birch Bay18,744
- 98232Bow4,054
- 98233Burlington17,850
- 98235Clear Lake531
- 98236Clinton7,199
- 98237Concrete4,956
- 98238Conway46
- 98239Coupeville7,656
- 98240Custer3,593
- 982412,339
- 98243Friday Harbor327
- 98244Glacier2,994
- 982454,265
- 98247Everson9,115
- 98248Ferndale28,498
- 98249Freeland4,198
- 98250Friday Harbor9,254
- 98251May Creek4,907
- 98252Verlot10,361
- 98253Freeland2,311
- 98255Hamilton198
- 98256Baring368
- 98257La Conner4,277
- 98258Lake Cassidy52,752
- 98260Langley5,320
- 98261Friday Harbor2,984
- 98262Marietta-Alderwood957
- 98263Lyman200
- 98264Lynden23,123
- 98266Maple Falls4,245
- 98267314
- 98270Marysville55,049
- 98271Lake Goodwin30,838
- 98272Woods Creek31,436
- 98273Mount Vernon30,001
- 98274Lake McMurray18,860
- 98275Mukilteo21,323
- 98276Nooksack1,794
- 98277Oak Harbor40,917
- 98278Whidbey Island Station1,932
- 98279680
- 98280Friday Harbor442
- 98281Point Roberts1,288
- 98282Camano17,303
- 98283442
- 98284Lyman27,835
- 98286Friday Harbor155
- 98288Skykomish169
- 98290Three Lakes39,826
- 98292Sunday Lake27,389
- 98294Startup7,963
- 98295Peaceful Valley3,279
- 98296Cathcart27,896
- 98297Roche Harbor47
- 98303Anderson Island1,448
- 98304770
- 98305Forks419
- 98310Enetai22,643
- 98311Tracyton28,168
- 98312Bremerton36,307
- 98314Bremerton1,186
- 98315Bangor Base6,112
- 98320Brinnon1,219
- 98321South Prairie18,150
- 98323Carbonado767
- 98325Port Ludlow1,775
- 983261,207
- 98327DuPont9,931
- 98328Eatonville9,891
- 98329Key Center11,552
- 98330Mineral61
- 983315,826
- 98332Canterwood20,072
- 98333Fox Island3,414
- 98335Artondale27,773
- 98336981
- 98337Bremerton7,370
- 98338Graham32,687
- 98339Port Hadlock-Irondale3,658
- 98340Hansville2,721
- 98342Indianola1,338
- 98345Keyport221
- 98346Port Gamble Tribal Community9,920
- 98349Home4,931
- 98350344
- 98351Longbranch1,891
- 98354Milton8,597
- 98355Ashford702
- 98356Morton2,172
- 98357Neah Bay1,519
- 98358Marrowstone1,164
- 98359Purdy4,581
- 98360Crocker15,045
- 98361Packwood457
- 98362Port Angeles East24,313
- 9836314,237
- 98365Port Ludlow5,168
- 98366Parkwood36,965
- 98367Bethel31,756
- 98368Port Hadlock-Irondale17,304
- 98370Poulsbo33,655
- 98371Puyallup24,682
- 98372Edgewood26,012
- 98373South Hill28,883
- 98374South Hill49,007
- 98375Frederickson31,187
- 98376Quilcene1,982
- 983772,527
- 98380Seabeck5,471
- 98381Neah Bay203
- 98382Bell Hill31,052
- 98383Silverdale21,604
- 98385South Prairie457
- 98387Elk Plain50,774
- 98388Fox Island7,043
- 98390Sumner11,546
- 98391Bonney Lake59,240
- 98392Suquamish2,984
- 98394Key Center892
- 98396Wilkeson844
- 98402Tacoma8,080
- 98403Tacoma9,097
- 98404Tacoma35,961
- 98405Tacoma25,939
- 98406Tacoma24,202
- 98407Tacoma21,718
- 98408Tacoma21,009
- 98409Tacoma27,843
- 98416Tacoma934
- 98418Tacoma10,264
- 98421Tacoma424
- 98422Tacoma21,644
- 98424Fife11,816
- 98430North Fort Lewis582
- 98433Fort Lewis22,493
- 98438McChord AFB613
- 98439McChord AFB5,671
- 98443Waller5,558
- 98444Parkland35,754
- 98445Clover Creek33,684
- 98446Clover Creek14,634
- 98447Parkland921
- 98465Tacoma7,178
- 98466University Place30,327
- 98467University Place15,387
- 98498Lakewood29,209
- 98499Lakewood32,464
- 98501Tumwater48,067
- 98502Olympia35,398
- 98503Lacey41,656
- 98505Olympia881
- 98506Olympia18,497
- 98512Tumwater31,864
- 98513Nisqually Indian Community38,017
- 98516Tanglewilde29,177
- 98520Aberdeen24,888
- 98524Allyn4,300
- 98526Amanda Park180
- 98527Bay Center273
- 98528Belfair11,940
- 98530Bucoda619
- 98531Centralia27,337
- 98532Chehalis27,135
- 98533Morton890
- 98535Ocean City726
- 98536Moclips49
- 985372,820
- 98538Ryderwood460
- 98539Pe Ell139
- 98541Elma10,810
- 98542Onalaska625
- 98546Grapeview2,430
- 98547Grayland1,080
- 985482,177
- 98550Aberdeen Gardens12,316
- 98552Humptulips140
- 98555324
- 98556Oakville350
- 98557McCleary4,079
- 98558McKenna61
- 98560114
- 98562Moclips34
- 985637,604
- 98564Mossyrock3,382
- 98565Napavine568
- 98566Neilton299
- 98568Oakville3,050
- 98569Ocean Shores7,489
- 98570Onalaska5,319
- 98571Moclips48
- 98572Pe Ell834
- 98575Neilton113
- 98576Rainier4,985
- 98577Willapa7,503
- 98579Rochester14,048
- 98580Roy11,410
- 98581Ryderwood419
- 98582Onalaska438
- 98583Satsop79
- 98584Shelton40,606
- 98585Mossyrock465
- 98586Bay Center1,801
- 98587Santiago1,072
- 98588Hoodsport2,114
- 98589Tenino7,010
- 98590Tokeland509
- 98591Toledo3,965
- 98592Union2,059
- 98593Vader1,541
- 98595Westport2,698
- 98596Winlock6,950
- 98597McKenna26,669
- 98601Amboy2,585
- 98602Klickitat320
- 98603Cougar1,267
- 98604Lewisville38,839
- 98605Carson1,117
- 98606Hockinson10,233
- 98607Fern Prairie35,867
- 98610Stevenson2,832
- 98611Castle Rock9,302
- 98612Upper Elochoman3,366
- 98613Centerville458
- 98614Chinook571
- 98616Cougar192
- 98617Dallesport1,380
- 98619Glenwood527
- 98620Goldendale7,936
- 98621Grays River195
- 98623White Salmon55
- 98624Ilwaco1,555
- 986257,655
- 98626Kelso26,892
- 98628Klickitat577
- 98629La Center9,076
- 98631Long Beach3,759
- 98632Longview Heights50,635
- 98635Klickitat1,721
- 98638Naselle1,443
- 98639North Bonneville1,112
- 98640Bay Center5,386
- 98641Ocean Park313
- 98642Ridgefield26,816
- 98643Rosburg571
- 98644Ilwaco505
- 98645Castle Rock2,216
- 98647Skamokawa Valley352
- 98648Stevenson3,477
- 98649929
- 98650Trout Lake1,188
- 98651White Salmon910
- 98660Lake Shore13,212
- 98661Vancouver50,743
- 98662Five Corners37,723
- 98663Vancouver16,202
- 98664Vancouver23,845
- 98665Hazel Dell28,910
- 98670Klickitat68
- 98671Washougal24,871
- 98672White Salmon7,390
- 98673Wishram411
- 98674Woodland17,525
- 98675Yacolt7,305
- 98682Orchards68,305
- 98683Vancouver32,107
- 98684Vancouver37,298
- 98685Felida30,607
- 98686Barberton21,243
- 98801Wenatchee45,426
- 98802East Wenatchee33,539
- 98811Entiat6
- 98812Brewster4,834
- 98813Bridgeport2,826
- 98814473
- 98815Cashmere7,830
- 988167,752
- 98817Chelan Falls233
- 98819Conconully182
- 98821Cashmere1,019
- 988222,394
- 98823Ephrata12,188
- 98824George147
- 988267,605
- 98827Loomis289
- 98828Rock Island1,898
- 98829Malott361
- 98830Mansfield557
- 98831Manson3,953
- 98832Krupp87
- 98833245
- 98834Methow178
- 98836Cashmere429
- 98837Cascade Valley49,455
- 98840Okanogan4,892
- 98841Disautel9,737
- 98843Chelan Falls2,510
- 98844Oroville4,873
- 98845115
- 98846Pateros1,376
- 988471,641
- 98848Quincy12,854
- 98849Riverside1,096
- 98850Rock Island2,032
- 98851Soap Lake4,437
- 9885244
- 98853Wilson Creek6
- 98855Tonasket5,857
- 98856Twisp2,920
- 98857Warden4,062
- 98858Waterville1,783
- 98859435
- 98860Wilson Creek277
- 98862Winthrop2,995
- 98901Terrace Heights31,366
- 98902Yakima46,492
- 98903Tampico19,445
- 98908Cowiche38,060
- 98921Buena124
- 98922Cle Elum7,688
- 98923Cowiche994
- 98925Easton850
- 98926Kittitas34,353
- 98930Grandview15,730
- 98932Granger5,742
- 98933Harrah1,230
- 98934Kittitas775
- 98935Mabton4,289
- 989368,744
- 989374,833
- 98938Outlook1,591
- 98939Parker116
- 98940Roslyn858
- 98941Roslyn1,076
- 98942Naches18,871
- 98943South Cle Elum579
- 9894422,817
- 98946Thorp398
- 98947Tieton3,255
- 9894812,638
- 98950Schwana61
- 98951Harrah12,581
- 98952White Swan2,015
- 98953Zillah7,166
- 99001Airway Heights9,440
- 99003Green Bluff4,810
- 99004Cheney22,871
- 99005Green Bluff10,815
- 99006Deer Park16,177
- 99008317
- 990094,506
- 99011Fairchild AFB2,931
- 99012Fairfield1,167
- 990131,620
- 99014Four Lakes17
- 99016Liberty Lake21,615
- 99017Lamont230
- 99018Latah272
- 99019Liberty Lake12,447
- 99020Four Lakes16
- 99021Green Bluff8,942
- 99022Medical Lake8,767
- 99023Liberty Lake800
- 99025Otis Orchards-East Farms5,668
- 99026Suncrest9,320
- 99027Otis Orchards-East Farms5,992
- 99029Reardan2,116
- 99030Rockford919
- 99031Spangle1,251
- 99032Sprague1,018
- 99033Tekoa832
- 99034Suncrest198
- 99036Spangle1,581
- 99037Spokane Valley16,522
- 99039Waverly166
- 99040536
- 99101Addy1,690
- 99102Albion495
- 99103Almira556
- 9910541
- 99109Chewelah4,981
- 99110Clayton1,505
- 99111Colfax4,038
- 99113Colton560
- 9911413,383
- 99115Banks Lake South1,369
- 99116Elmer City1,786
- 99117Creston556
- 99118Curlew899
- 991191,549
- 99121Danville262
- 99122Davenport4,046
- 99123Electric City977
- 99124Elmer City326
- 99125Endicott611
- 99126Marcus899
- 99128Farmington259
- 99129725
- 99130Garfield693
- 99131Inchelium127
- 99133Grand Coulee1,115
- 99134Harrington595
- 99135Hartline395
- 99136LaCrosse14
- 99137495
- 99138Twin Lakes1,223
- 99139Ione1,091
- 99140Keller486
- 99141Barstow5,626
- 99143LaCrosse585
- 991447
- 99146Orient28
- 99147Creston214
- 99148Loon Lake2,794
- 99149Malden100
- 99150Malo351
- 99151Marcus242
- 99152Metaline157
- 99153467
- 99154Harrington14
- 991551,009
- 99156Newport9,195
- 99157Northport605
- 99158Oakesdale561
- 99159Odessa1,323
- 99160Orient87
- 99161Palouse1,435
- 99163Pullman34,022
- 99166Republic2,953
- 99167Inchelium871
- 99169Ritzville2,587
- 99170Rosalia926
- 99171St. John895
- 99173Springdale1,623
- 99174Steptoe69
- 99176Steptoe163
- 99179Uniontown645
- 99180Cusick465
- 99181Valley1,995
- 99185Wilbur1,501
- 99201Spokane15,829
- 99202Spokane19,921
- 99203Spokane21,468
- 99204Spokane7,643
- 99205Spokane43,169
- 99206Spokane Valley41,089
- 99207Spokane32,770
- 99208Fairwood58,669
- 99212Spokane Valley21,707
- 99216Spokane Valley28,578
- 99217Millwood21,441
- 99218Fairwood16,897
- 99223Spokane Valley36,094
- 99224Airway Heights24,919
- 99251Country Homes964
- 99258Spokane471
- 9930187,044
- 99320Benton City9,879
- 99321Beverly1,047
- 99322Bickleton412
- 99323Burbank4,082
- 99324College Place10,137
- 99326Connell6,336
- 99328Dayton3,646
- 99329Dixie127
- 99330Mesa1,210
- 99333Washtucna151
- 99335Kahlotus229
- 99336Kennewick50,735
- 99337Finley33,287
- 99338Kennewick20,633
- 99341Lind765
- 99343Basin City3,215
- 99344Othello19,534
- 99345162
- 99346198
- 99347Pomeroy2,512
- 99348Prescott1,633
- 993498,143
- 99350Prosser14,837
- 99352Richland37,430
- 99353West Richland19,251
- 99354Richland25,559
- 99356Roosevelt378
- 99357Royal City3,843
- 99359Starbuck94
- 99360Touchet1,350
- 99361Waitsburg1,992
- 99362Walla Walla42,853
- 99363Wallula145
- 99371Washtucna394
- 99401163
- 994021,557
- 9940320,760
School districts
Each of the 295 with people in it, from ACS 2020–2024 5-year estimates.
- Aberdeen School District21,333
- Adna School District4,597
- Almira School District556
- Anacortes School District23,359
- Arlington School District33,737
- Asotin-Anatone School District2,895
- Auburn School District100,743
- Bainbridge Island School District24,631
- Battle Ground School District85,430
- Bellevue School District148,644
- Bellingham School District113,192
- Benge School District43
- Bethel School District125,965
- Bickleton School District505
- Blaine School District19,084
- Boistfort School District1,241
- Bremerton School District50,669
- Brewster School District4,211
- Bridgeport School District3,344
- Brinnon School District1,219
- Burlington-Edison School District24,582
- Camas School District36,230
- Cape Flattery School District2,929
- Carbonado School District924
- Cascade School District11,225
- Cashmere School District7,453
- Castle Rock School District10,165
- Centerville School District595
- Central Kitsap School District76,715
- Central Valley School District98,492
- Centralia School District25,669
- Chehalis School District15,810
- Cheney School District43,005
- Chewelah School District6,004
- Chimacum School District12,492
- Clarkston School District19,585
- Cle Elum-Roslyn School District9,671
- Clover Park School District90,357
- Colfax School District4,072
- College Place School District14,379
- Colton School District1,135
- Columbia (Stevens) School District1,280
- Columbia (Walla Walla) School District4,179
- Colville School District12,894
- Concrete School District5,621
- Conway School District3,566
- Cosmopolis School District2,536
- Coulee-Hartline School District1,748
- Coupeville School District11,645
- Crescent School District2,970
- Creston School District1,491
- Curlew School District1,546
- Cusick School District2,015
- Damman School District781
- Darrington School District3,308
- Davenport School District2,971
- Dayton School District3,749
- Deer Park School District13,998
- Dieringer School District10,266
- Dixie School District426
- East Valley School District (Spokane)29,937
- East Valley School District (Yakima)20,334
- Eastmont School District35,175
- Easton School District1,398
- Eatonville School District11,624
- Edmonds School District179,177
- Ellensburg School District29,564
- Elma School District8,745
- Endicott School District653
- Entiat School District2,668
- Enumclaw School District28,659
- Ephrata School District12,731
- Evaline School District1,005
- Everett School District150,033
- Evergreen School District (Clark)158,883
- Evergreen School District (Stevens)590
- Federal Way School District150,308
- Ferndale School District36,893
- Fife Public Schools23,938
- Finley School District5,061
- Franklin Pierce School District54,986
- Freeman School District5,113
- Garfield School District697
- Glenwood School District527
- Goldendale School District7,932
- Grand Coulee Dam School District4,187
- Grandview School District15,563
- Granger School District5,995
- Granite Falls School District16,873
- Grapeview School District2,559
- Great Northern School District1,366
- Green Mountain School District1,024
- Griffin School District6,253
- Harrington School District795
- Highland School District5,362
- Highline School District136,437
- Hockinson School District11,231
- Hood Canal School District5,886
- Hoquiam School District11,720
- Inchelium School District1,209
- Index School District512
- Issaquah School District119,723
- Kahlotus School District252
- Kalama School District7,920
- Keller School District498
- Kelso School District30,961
- Kennewick School District100,741
- Kent School District177,175
- Kettle Falls School District5,478
- Kiona-Benton City School District9,270
- Kittitas School District4,179
- Klickitat School District796
- La Center School District9,785
- La Conner School District4,681
- LaCrosse School District712
- Lake Chelan School District8,280
- Lake Quinault School District807
- Lake Stevens School District52,580
- Lake Washington School District218,868
- Lakewood School District17,953
- Lamont School District230
- Liberty School District5,074
- Lind School District1,404
- Longview Public Schools46,818
- Loon Lake School District2,239
- Lopez School District3,187
- Lyle School District3,137
- Lynden School District22,001
- Mabton School District3,753
- Mansfield School District639
- Manson School District3,914
- Mary M. Knight School District2,366
- Mary Walker School District3,075
- Marysville School District76,690
- McCleary School District3,890
- Mead School District63,291
- Medical Lake School District10,932
- Mercer Island School District25,307
- Meridian School District12,513
- Methow Valley School District6,532
- Mill A School District492
- Monroe School District41,292
- Montesano School District7,635
- Morton School District2,771
- Moses Lake School District49,423
- Mossyrock School District4,690
- Mount Adams School District4,084
- Mount Baker School District14,636
- Mount Pleasant School District392
- Mount Vernon School District39,595
- Mukilteo School District108,811
- Naches Valley School District8,765
- Napavine School District5,731
- Naselle-Grays River Valley School District2,241
- Nespelem School District1,030
- Newport School District9,117
- Nine Mile Falls School District10,269
- Nooksack Valley School District12,077
- North Beach School District8,446
- North Franklin School District10,847
- North Kitsap School District49,452
- North Mason School District17,983
- North River School District316
- North Thurston Public Schools114,238
- Northport School District1,647
- Northshore School District154,487
- Oak Harbor School District41,248
- Oakesdale School District811
- Oakville School District2,845
- Ocean Beach School District12,128
- Ocosta School District7,126
- Odessa School District1,380
- Okanogan School District5,159
- Olympia School District71,329
- Omak School District11,062
- Onalaska School District6,684
- Onion Creek School District375
- Orcas Island School District5,882
- Orchard Prairie School District778
- Orient School District1,174
- Orondo School District2,186
- Oroville School District4,803
- Orting School District18,345
- Othello School District16,789
- Palisades School District352
- Palouse School District1,432
- Pasco School District86,652
- Pateros School District1,851
- Paterson School District692
- Pe Ell School District1,899
- Peninsula School District70,304
- Pioneer School District12,558
- Pomeroy School District2,340
- Port Angeles School District32,609
- Port Townsend School District16,496
- Prescott School District1,636
- Prosser School District14,634
- Pullman School District34,390
- Puyallup School District144,070
- Queets-Clearwater School District445
- Quilcene School District2,080
- Quillayute Valley School District6,299
- Quincy School District13,017
- Rainier School District5,158
- Raymond School District4,186
- Reardan-Edwall School District5,320
- Renton School District129,297
- Republic School District3,102
- Richland School District81,955
- Ridgefield School District24,219
- Ritzville School District2,586
- Riverside School District11,706
- Riverview School District22,695
- Rochester School District15,860
- Roosevelt School District340
- Rosalia School District908
- Royal School District7,097
- San Juan Island School District9,254
- Satsop School District749
- Seattle Public Schools754,696
- Sedro-Woolley School District29,706
- Selah School District20,925
- Selkirk School District1,911
- Sequim School District33,851
- Shaw Island School District155
- Shelton School District24,694
- Shoreline School District74,698
- Skamania School District940
- Skykomish School District359
- Snohomish School District59,785
- Snoqualmie Valley School District39,250
- Soap Lake School District3,843
- South Bend School District2,634
- South Kitsap School District75,986
- South Whidbey School District16,640
- Southside School District2,197
- Spokane Public Schools242,455
- Sprague School District832
- St. John School District958
- Stanwood-Camano School District40,290
- Star School District390
- Starbuck School District108
- Stehekin School District44
- Steilacoom Historical School District23,448
- Steptoe School District261
- Stevenson-Carson School District6,710
- Sultan School District15,197
- Summit Valley School District702
- Sumner School District55,782
- Sunnyside School District24,547
- Tacoma Public Schools233,321
- Taholah School District1,084
- Tahoma School District43,830
- Tekoa School District868
- Tenino School District10,230
- Thorp School District1,504
- Toledo School District5,267
- Tonasket School District6,483
- Toppenish School District13,911
- Touchet School District1,267
- Toutle Lake School District4,369
- Trout Lake School District1,188
- Tukwila School District20,666
- Tumwater School District45,467
- Union Gap School District3,682
- University Place School District32,930
- Valley School District1,632
- Vancouver Public Schools168,543
- Vashon Island School District9,934
- Wahkiakum School District3,745
- Wahluke School District8,271
- Waitsburg School District1,613
- Walla Walla Public Schools38,818
- Wapato School District12,640
- Warden School District3,951
- Washougal School District21,590
- Washtucna School District394
- Waterville School District1,911
- Wellpinit School District835
- Wenatchee School District46,883
- West Valley School District (Spokane)21,730
- West Valley School District (Yakima)33,925
- White Pass School District4,068
- White River School District26,380
- White Salmon Valley School District8,980
- Wilbur School District1,509
- Willapa Valley School District2,683
- Wilson Creek School District364
- Winlock School District3,744
- Wishkah Valley School District1,093
- Wishram School District411
- Woodland School District16,975
- Yakima School District78,732
- Yelm Community Schools35,367
- Zillah School District5,444
Congressional districts
As drawn for the 119th Congress (2025–2027).
- Congressional District 1783,828
- Congressional District 2781,265
- Congressional District 3788,069
- Congressional District 4781,735
- Congressional District 5788,007
- Congressional District 6782,007
- Congressional District 7779,308
- Congressional District 8781,768
- Congressional District 9772,812
- Congressional District 10777,317
State senate districts
The upper chamber’s districts, as drawn in 2024.
- Legislative (Senate) District 1161,162
- Legislative (Senate) District 2159,524
- Legislative (Senate) District 3155,130
- Legislative (Senate) District 4162,056
- Legislative (Senate) District 5156,791
- Legislative (Senate) District 6162,864
- Legislative (Senate) District 7162,961
- Legislative (Senate) District 8158,523
- Legislative (Senate) District 9158,812
- Legislative (Senate) District 10160,060
- Legislative (Senate) District 11152,644
- Legislative (Senate) District 12159,840
- Legislative (Senate) District 13162,748
- Legislative (Senate) District 14156,322
- Legislative (Senate) District 15160,928
- Legislative (Senate) District 16163,669
- Legislative (Senate) District 17160,202
- Legislative (Senate) District 18161,259
- Legislative (Senate) District 19162,215
- Legislative (Senate) District 20163,631
- Legislative (Senate) District 21155,780
- Legislative (Senate) District 22159,797
- Legislative (Senate) District 23158,052
- Legislative (Senate) District 24160,152
- Legislative (Senate) District 25158,133
- Legislative (Senate) District 26157,576
- Legislative (Senate) District 27157,972
- Legislative (Senate) District 28156,510
- Legislative (Senate) District 29155,861
- Legislative (Senate) District 30158,317
- Legislative (Senate) District 31160,958
- Legislative (Senate) District 32163,135
- Legislative (Senate) District 33157,458
- Legislative (Senate) District 34158,000
- Legislative (Senate) District 35163,962
- Legislative (Senate) District 36159,952
- Legislative (Senate) District 37164,798
- Legislative (Senate) District 38159,943
- Legislative (Senate) District 39160,718
- Legislative (Senate) District 40158,487
- Legislative (Senate) District 41156,045
- Legislative (Senate) District 42160,832
- Legislative (Senate) District 43157,837
- Legislative (Senate) District 44158,365
- Legislative (Senate) District 45158,714
- Legislative (Senate) District 46160,235
- Legislative (Senate) District 47155,639
- Legislative (Senate) District 48160,654
- Legislative (Senate) District 49160,893
State house districts
The lower chamber’s districts, as drawn in 2024.
- Legislative (House) District 1161,162
- Legislative (House) District 2159,524
- Legislative (House) District 3155,130
- Legislative (House) District 4162,056
- Legislative (House) District 5156,791
- Legislative (House) District 6162,864
- Legislative (House) District 7162,961
- Legislative (House) District 8158,523
- Legislative (House) District 9158,812
- Legislative (House) District 10160,060
- Legislative (House) District 11152,644
- Legislative (House) District 12159,840
- Legislative (House) District 13162,748
- Legislative (House) District 14156,322
- Legislative (House) District 15160,928
- Legislative (House) District 16163,669
- Legislative (House) District 17160,202
- Legislative (House) District 18161,259
- Legislative (House) District 19162,215
- Legislative (House) District 20163,631
- Legislative (House) District 21155,780
- Legislative (House) District 22159,797
- Legislative (House) District 23158,052
- Legislative (House) District 24160,152
- Legislative (House) District 25158,133
- Legislative (House) District 26157,576
- Legislative (House) District 27157,972
- Legislative (House) District 28156,510
- Legislative (House) District 29155,861
- Legislative (House) District 30158,317
- Legislative (House) District 31160,958
- Legislative (House) District 32163,135
- Legislative (House) District 33157,458
- Legislative (House) District 34158,000
- Legislative (House) District 35163,962
- Legislative (House) District 36159,952
- Legislative (House) District 37164,798
- Legislative (House) District 38159,943
- Legislative (House) District 39160,718
- Legislative (House) District 40158,487
- Legislative (House) District 41156,045
- Legislative (House) District 42160,832
- Legislative (House) District 43157,837
- Legislative (House) District 44158,365
- Legislative (House) District 45158,714
- Legislative (House) District 46160,235
- Legislative (House) District 47155,639
- Legislative (House) District 48160,654
- Legislative (House) District 49160,893
PUMAs
Public Use Microdata Areas: areas of 100,000 people or more that the state draws from census tracts, for the Census Bureau’s microdata.
- Benton County (East Central)–Kennewick & Richland (South) Cities PUMA125,844
- Chelan & Douglas Counties PUMA124,538
- Clallam & Jefferson Counties PUMA111,390
- Clark County (North)–Battle Ground City & Orchards PUMA141,615
- Clark County (Southeast)–Vancouver (East), Camas & Washougal Cities PUMA120,986
- Clark County (Southwest)–Vancouver City (West & Central) PUMA124,757
- Clark County (West Central)–Salmon Creek & Hazel Dell PUMA129,601
- Cowlitz, Pacific, & Wahkiakum Counties PUMA141,012
- Franklin & Benton Counties–Pasco, Richland (North) & West Richland Cities PUMA126,797
- Grant & Kittitas Counties PUMA148,971
- Grays Harbor & Mason Counties PUMA145,035
- Island & San Juan Counties PUMA105,314
- King County (Central)–Renton City, Fairwood, Bryn Mawr & Skyway PUMA140,157
- King County (Central)–Sammamish, Issaquah, Mercer Island & Newcastle Cities PUMA156,617
- King County (Far Southwest)–Federal Way, Des Moines Cities & Vashon Island PUMA133,169
- King County (Northeast)–Snoqualmie City, Cottage Lake, Union Hill & Novelty Hill PUMA119,855
- King County (Northwest Central)–Greater Bellevue City PUMA154,391
- King County (Northwest)–Redmond, Kirkland Cities, Ingelwood & Finn Hill PUMA162,415
- King County (Northwest)–Shoreline, Kenmore & Bothell (South) Cities PUMA132,450
- King County (Southeast)–Maple Valley, Covington & Enumclaw Cities PUMA131,525
- King County (Southwest Central)–Kent City PUMA136,206
- King County (Southwest)–Auburn City & Lakeland PUMA127,990
- King County (West Central)–Burien, SeaTac, Tukwila Cities & White Center PUMA138,251
- Kitsap County (North)–Bainbridge Island City & Silverdale PUMA133,993
- Kitsap County (South)–Bremerton & Port Orchard Cities PUMA143,888
- Lewis, Klickitat & Skamania Counties PUMA120,967
- Pierce County (East Central)–Puyallup City & South Hill PUMA141,620
- Pierce County (North Central)–Bonney Lake, Edgewood, Fife & Sumner Cities PUMA102,666
- Pierce County (Northwest)–Peninsula Region & JBLM PUMA114,729
- Pierce County (South Central)–Parkland & Spanaway PUMA106,635
- Pierce County (Southeast)–Graham, Elk Plain & Prairie Ridge PUMA134,166
- Pierce County (West Central)–Lakewood & University Place Cities PUMA110,172
- Seattle City (Central) PUMA108,568
- Seattle City (Lake Union-Downtown) PUMA102,067
- Seattle City (North) PUMA112,931
- Seattle City (Northeast) PUMA112,433
- Seattle City (Northwest) PUMA105,270
- Seattle City (Southeast) PUMA105,083
- Seattle City (West Seattle-Industrial) PUMA107,793
- Skagit County PUMA131,328
- Snohomish County (Central & Southeast)–Lake Stevens & Monroe Cities PUMA150,560
- Snohomish County (Central)–Everett City & Eastmont PUMA156,118
- Snohomish County (North)–Marysville & Arlington Cities PUMA158,638
- Snohomish County (South Central)–Bothell (North), Mill Creek Cities & Silver Firs PUMA145,525
- Snohomish County (Southwest)–Edmonds, Lynnwood & Mountlake Terrace Cities PUMA125,941
- Snohomish County (West Central)–Mukilteo & Martha Lake PUMA107,648
- Spokane County (East Central)–Greater Spokane Valley City PUMA150,989
- Spokane County (North Central)–Spokane City (North) PUMA139,845
- Spokane County (Outer)–Cheney City PUMA119,968
- Spokane County (South Central)–Spokane City (South) PUMA138,254
- Stevens, Okanogan, Pend Oreille & Ferry Counties PUMA112,929
- Tacoma City (North) PUMA118,380
- Tacoma City (South) PUMA101,951
- Thurston County (Central)–Olympia, Lacey, & Tumwater Cities PUMA179,577
- Thurston County (Outer) PUMA119,490
- Walla Walla, Benton (Outer) & Franklin (Outer) Counties PUMA121,327
- Whatcom County (Outer)–Lynden, Ferndale & Blaine Cities PUMA114,378
- Whatcom County (South)–Greater Bellingham City PUMA116,125
- Whitman, Asotin, Adams, Lincoln, Columbia & Garfield Counties PUMA108,126
- Yakima County (Central)–Greater Yakima City PUMA131,346
- Yakima County (Outer)–Sunnyside & Grandview Cities PUMA125,806
Urban areas
Each that reaches into Washington, with its whole population. Urban areas are the densely settled land the Census Bureau draws after each census, whatever the city lines.
- Aberdeen, WA27,245
- Anacortes, WA18,804
- Belfair, WA5,303
- Bellingham, WA131,194
- Birch Bay, WA16,693
- Bremerton, WA226,438
- Centralia, WA42,801
- Chelan, WA6,626
- Cheney, WA12,804
- Cle Elum, WA3,735
- Colville, WA5,083
- Connell, WA5,107
- Duvall, WA8,719
- Ellensburg, WA22,615
- Ephrata, WA8,122
- Freeland, WA7,561
- Friday Harbor, WA3,782
- Grandview, WA11,654
- Granite Falls, WA6,560
- Hood River, OR–WA15,961
- Kennewick–Richland–Pasco, WA258,189
- Lewiston, ID–WA55,607
- Long Beach, WA3,182
- Longview, WA–OR70,885
- Lynden, WA16,447
- Marysville, WA164,264
- Monroe, WA25,138
- Montesano–Elma, WA13,333
- Moses Lake, WA39,779
- Mount Vernon, WA68,689
- North Bend, WA11,947
- Oak Harbor, WA37,636
- Ocean Park, WA5,784
- Ocean Shores, WA7,297
- Olympia–Lacey, WA213,079
- Omak, WA8,169
- Othello, WA10,466
- Point Roberts, WA1,288
- Port Angeles, WA24,519
- Port Hadlock-Irondale, WA5,644
- Port Townsend, WA10,311
- Portland, OR–WA2.11M
- Prosser, WA7,279
- Pullman, WA32,168
- Quincy, WA8,481
- Ridgefield, WA12,954
- Seattle–Tacoma, WA3.58M
- Sequim, WA24,413
- Shelton, WA14,926
- Snoqualmie, WA16,191
- Spokane, WA456,735
- Stanwood, WA8,179
- Sultan, WA6,122
- Sunnyside, WA17,339
- Toppenish, WA9,758
- Walla Walla, WA–OR49,549
- Wapato, WA6,641
- Wenatchee, WA78,739
- Woodland, WA7,115
- Yakima, WA135,260
- Yelm, WA13,674
Tribal areas
Each that reaches into Washington, with its whole population.
- Chehalis Reservation and Off-Reservation Trust Land, WA713
- Colville Reservation and Off-Reservation Trust Land, WA7,588
- Hoh Indian Reservation and Off-Reservation Trust Land, WA54
- Jamestown S'Klallam Reservation and Off-Reservation Trust Land, WA38
- Kalispel Reservation and Off-Reservation Trust Land, WA864
- Lower Elwha Reservation and Off-Reservation Trust Land, WA613
- Lummi Reservation, WA5,034
- Makah Indian Reservation, WA1,514
- Muckleshoot Reservation and Off-Reservation Trust Land, WA3,985
- Nisqually Reservation, WA628
- Nooksack Reservation and Off-Reservation Trust Land, WA714
- Port Gamble Reservation and Off-Reservation Trust Land, WA533
- Port Madison Reservation, WA7,552
- Puyallup Reservation and Off-Reservation Trust Land, WA55,690
- Quileute Reservation, WA344
- Quinault Reservation, WA1,245
- Samish TDSA, WA42,442
- Sauk-Suiattle Reservation, WA55
- Shoalwater Bay Indian Reservation and Off-Reservation Trust Land, WA160
- Skokomish Reservation and Off-Reservation Trust Land, WA691
- Spokane Reservation and Off-Reservation Trust Land, WA1,924
- Squaxin Island Reservation and Off-Reservation Trust Land, WA388
- Stillaguamish Reservation and Off-Reservation Trust Land, WA7
- Swinomish Reservation and Off-Reservation Trust Land, WA3,135
- Tulalip Reservation and Off-Reservation Trust Land, WA10,353
- Umatilla Reservation and Off-Reservation Trust Land, OR–WA2,840
- Upper Skagit Reservation and Off-Reservation Trust Land, WA142
- Yakama Nation Reservation and Off-Reservation Trust Land, WA29,781
Turn Washington into your planning report.
Social Explorer Studio builds an editable profile of any place, with tables and charts beside the county and state, and exports to Word, PDF and Excel.
Questions about Washington
What is the population of Washington?
8,001,020 people, according to the ACS 2025 1-year estimates, which the Census Bureau adjusts to match its own population estimate. That’s the 13th largest of the 50 states and DC.
What is the FIPS code for Washington?
53. Every county’s and place’s FIPS code in Washington starts with it. The Census Bureau’s full geographic identifier (GEOID) is 0400000US53.
What is the largest city in Washington?
Seattle, with 784,757 people. Other large cities here include Spokane, Tacoma and Vancouver.
What is the median household income in Washington?
$101,946 (±$719), according to the ACS 2025 1-year estimates, higher than the US ($84,780).
What is the median age in Washington?
38.9 years (±0.1), according to the ACS 2025 1-year estimates, lower than the US (39.5).
How much does housing cost in Washington?
Washington’s median home value is $605,600 (±$4,205) and its median gross rent is $1,873 (±$16) a month, according to the ACS 2025 1-year estimates. 48.2% (±1.3%) of its renters pay 30% or more of their income on rent.
Is Washington growing?
Washington’s population grew 11.6%, from 7,170,351 in 2015 to 8,001,020 in 2025, according to the ACS 1-year estimates.
Where do people who work in Washington live?
3,407,521 of its 3,519,988 jobs are held by people who live here. Of those who commute in, the most come from Oregon, Idaho, California.
Where does this census data come from?
The U.S. Census Bureau’s American Community Survey, through Social Explorer’s tables: the latest 1-year estimates where they exist, for the most recent numbers, and 5-year estimates otherwise. Each table lists its code, so you can find it again.
Is this data free to use?
Yes. You can read it, cite it, download the CSV and embed the charts, with no account. To map other variables, compare your own areas or build a report, see Social Explorer’s plans in a live demo.
Sources and how to cite
American Community Survey 2025 1-year estimates, or 2020–2024 5-year estimates where noted, U.S. Census Bureau, from Social Explorer’s tables A00001, A00002, A01004, A04001, A06001, A08001, A09005, A10001, A10003, A10008, A10030, A10036, A10040, A10047, A10055, A10060, A12001, A13004, A14006, A14024, A14028, A16002, A17005, A18002, A18009, A20001, B02002, B09001, B13002, B18101, C16001. Maps by census tract use 2020–2024 5-year estimates, since the 1-year survey doesn’t cover tracts. Commuting: LEHD LODES 2023. These are estimates from a sample, each with its margin of error. Data retrieved November 14, 2026. How these profiles are made.
U.S. Census Bureau, American Community Survey 2025 1-year estimates, or 2020–2024 5-year estimates where noted, via Social Explorer. “Washington.” https://www.socialexplorer.com/places/washington. Accessed November 14, 2026.