

New York: Population, demographics and census data
Home to 20,002,427 people, the 4th largest of the 50 states and DC, anchored by New York. It grew 1.0% between 2015 and 2025.
- Population
- 20.00M. Census Bureau estimate · Rank 4 of the 50 states and DC
- Median household income
- $89,210 ±$934. US $84,780
- Median age
- 39.8 ±0.1. US 39.5
ACS 2025 1-year estimates, U.S. Census Bureau
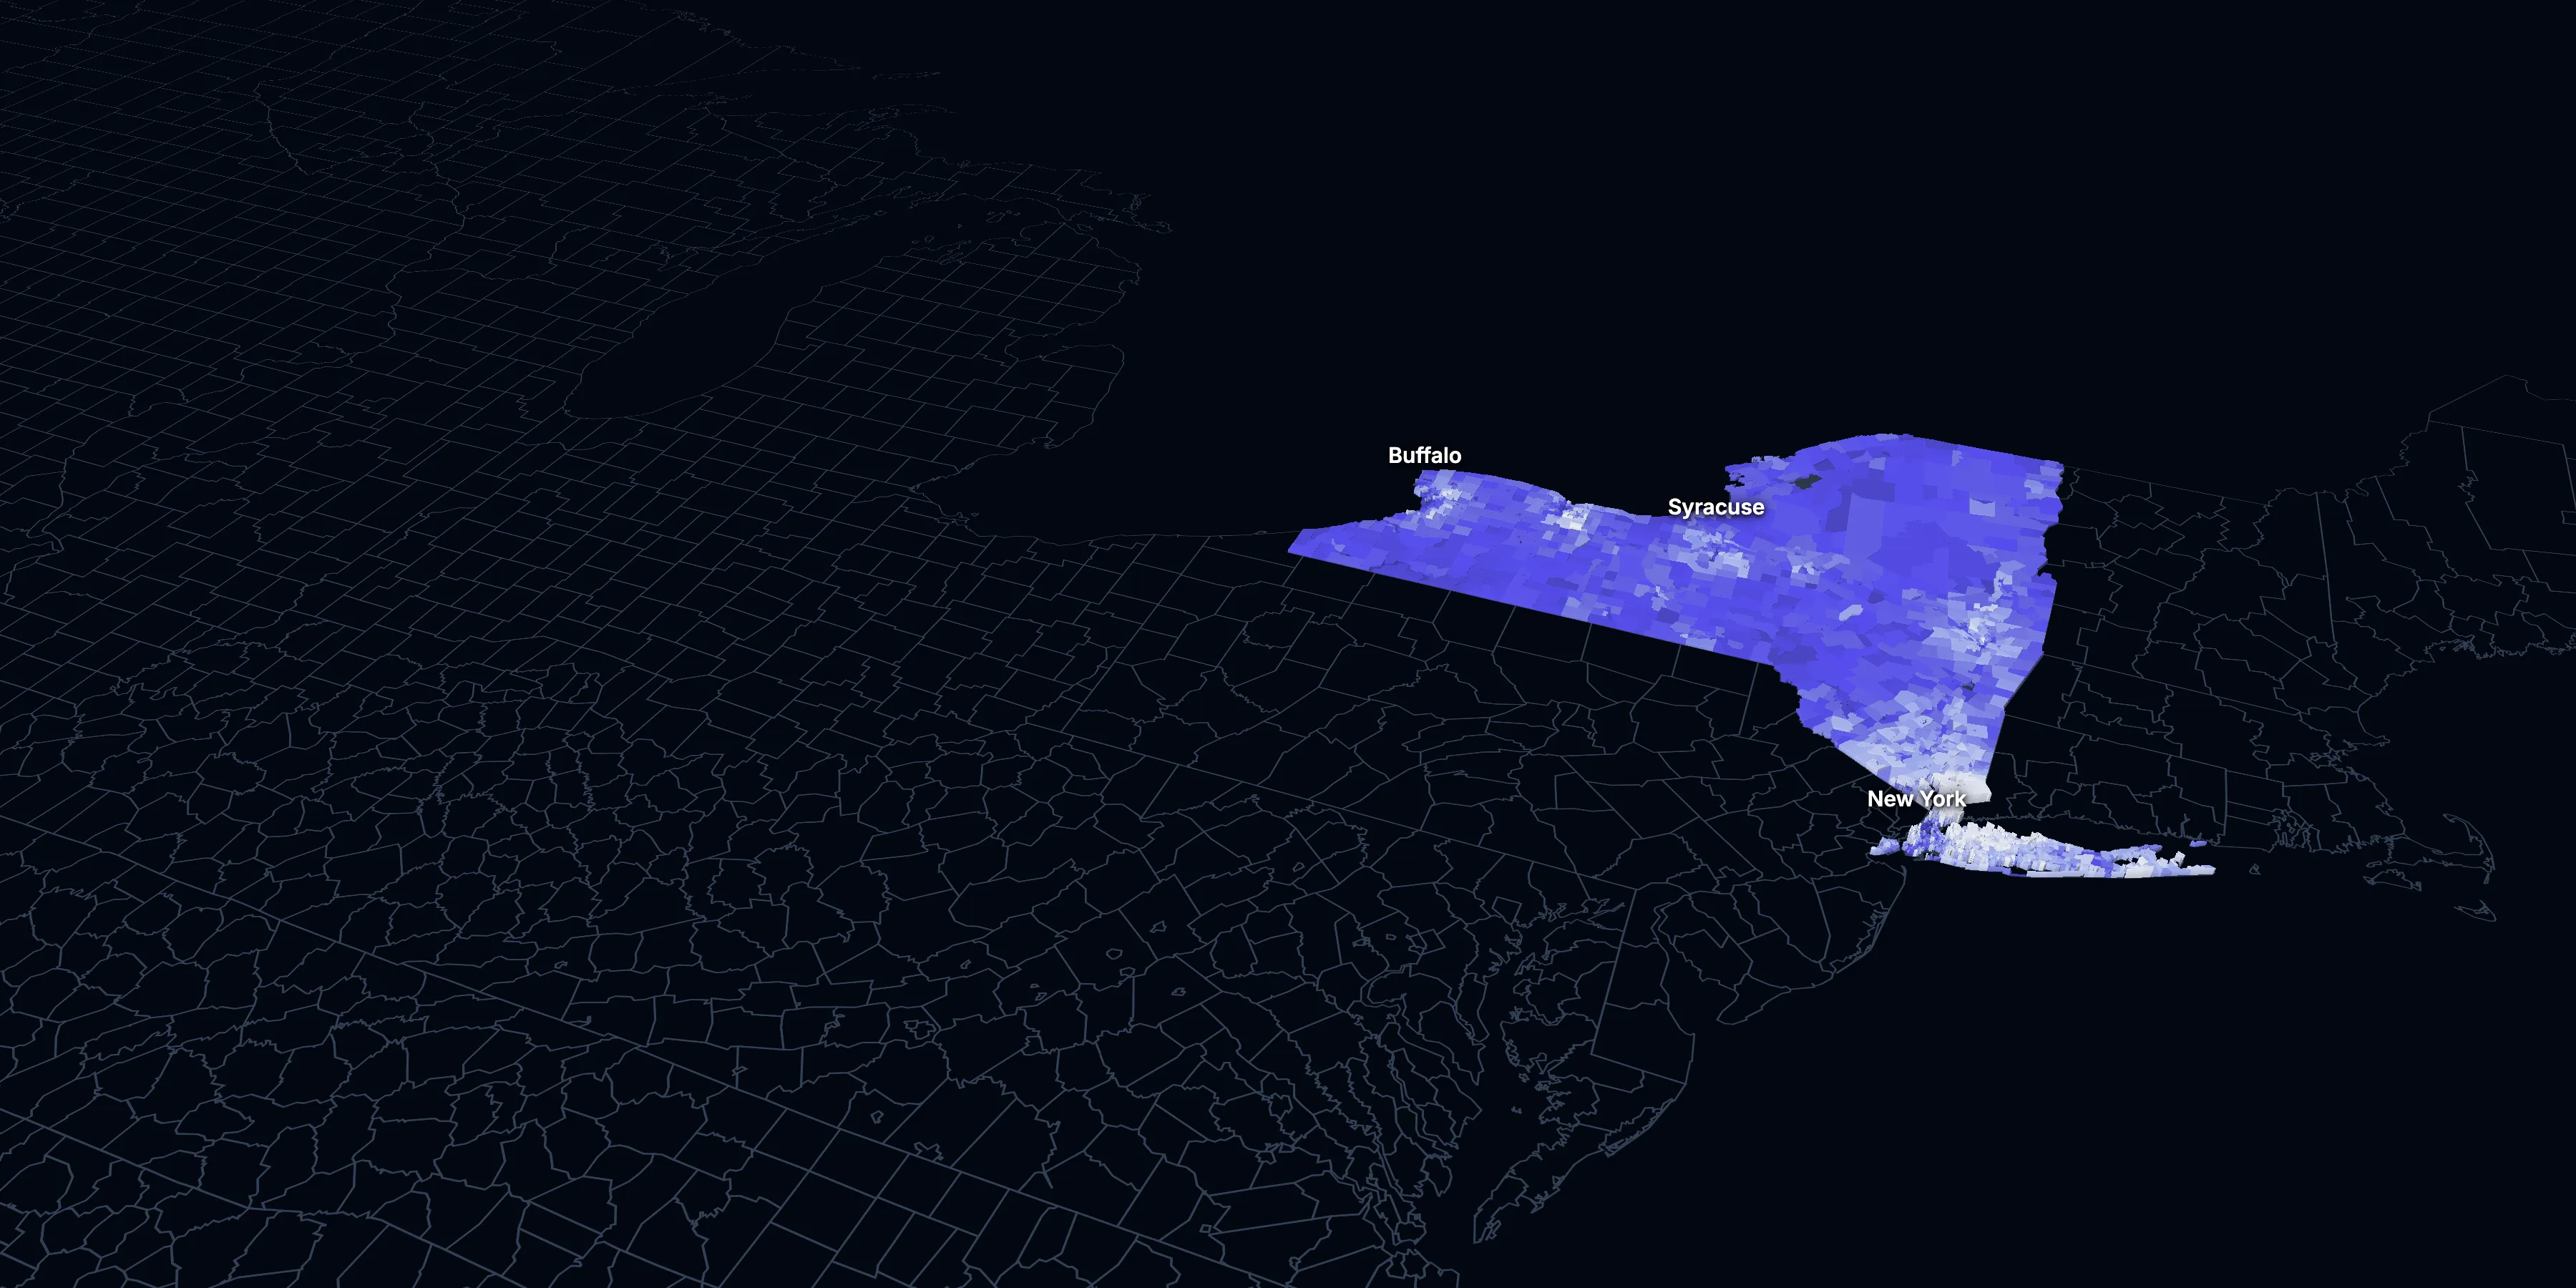
Taller, lighter tracts have higher household incomes
About New York
New York’s median household income is $89,210 (±$934), higher than the US ($84,780), and its median age is 39.8 (±0.1), according to the ACS 2025 1-year estimates. Its largest city is New York.
± is each figure’s margin of error, at 90% confidence, and † marks one too uncertain to lean on. Under each percentage in the tables is the number it counts. How the margins are worked out.
FIPS code 36
Highlights
What stands out in New York
The numbers where New York sits furthest from the nation, or past a recognized policy benchmark.
Past a policy benchmark
49.1%
Very highRenters paying 30% or more of income
That’s higher than the US (48.3%). HUD counts households paying 30% or more of income on housing as cost-burdened.
28.7%
Very highOwners paying 30% or more of income
That’s higher than the US (24.2%). HUD’s 30% standard, applied to homeowners. It’s the 4th highest of the 50 states and DC.
50.5%
Very highHomes built before 1960
That’s higher than the US (24.0%). Older homes carry more lead-paint risk: the EPA found lead paint in 69% of homes built from 1940 to 1959. It’s the 2nd highest of the 50 states and DC.
5.6%
ElevatedUnemployment rate
That’s higher than the US (4.9%). The Department of Labor uses 6% as its floor for a labor surplus area. It’s the 3rd highest of the 50 states and DC.
Furthest from the national picture
26.3%
Highest among statesTake public transit
That’s higher than the US (4.3%). It’s the highest of the 50 states and DC.
30.9%
2nd among statesHouseholds with no vehicle
That’s higher than the US (8.8%). It’s the 2nd highest of the 50 states and DC.
2015 to 2025
How New York changed in ten years
The state added 206,636 people. It got older and better educated, and poverty fell 1.6 points.
Population, change since 2015
+1.0% in the state and +6.3% in the US.
Source: ACS 1-year, 2015 to 2025, table A00001.
Show data
| New York | United States | |
|---|---|---|
| 2015 | 0.0% | 0.0% |
| 2016 | −0.3% | +0.5% |
| 2017 | +0.3% | +1.3% |
| 2018 | −1.3% | +1.8% |
| 2019 | −1.7% | +2.1% |
| 2021 | +0.2% | +3.3% |
| 2022 | −0.6% | +3.7% |
| 2023 | −1.1% | +4.2% |
| 2024 | +0.4% | +5.8% |
| 2025 | +1.0% | +6.3% |
Embed
Median household income, in 2025 dollars
+7.0% in the state and +10.9% in the US.
Source: ACS 1-year, 2015 to 2025, table A14006.
Show data
| New York | United States | |
|---|---|---|
| 2015 | $83,366 | $76,413 |
| 2016 | $85,089 | $77,931 |
| 2017 | $85,926 | $79,891 |
| 2018 | $87,695 | $80,059 |
| 2019 | $91,547 | $83,427 |
| 2021 | $89,028 | $83,521 |
| 2022 | $88,130 | $82,811 |
| 2023 | $87,339 | $82,683 |
| 2024 | $88,696 | $84,339 |
| 2025 | $89,210 | $84,780 |
Embed
Living in poverty
−1.6 points in the state and −3.0 points in the US.
Source: ACS 1-year, 2015 to 2025, table A13004.
Show data
| New York | United States | |
|---|---|---|
| 2015 | 15.4% | 14.7% |
| 2016 | 14.7% | 14.0% |
| 2017 | 14.1% | 13.4% |
| 2018 | 13.6% | 13.1% |
| 2019 | 13.0% | 12.3% |
| 2021 | 13.9% | 12.8% |
| 2022 | 14.3% | 12.6% |
| 2023 | 14.2% | 12.5% |
| 2024 | 14.0% | 12.1% |
| 2025 | 13.8% | 11.8% |
Embed
Bachelor’s degree or more
+7.0 points in the state and +6.7 points in the US.
Source: ACS 1-year, 2015 to 2025, table A12001.
Show data
| New York | United States | |
|---|---|---|
| 2015 | 35.0% | 30.6% |
| 2016 | 35.7% | 31.3% |
| 2017 | 36.0% | 32.0% |
| 2018 | 37.2% | 32.6% |
| 2019 | 37.8% | 33.1% |
| 2021 | 39.9% | 35.0% |
| 2022 | 40.0% | 35.7% |
| 2023 | 40.6% | 36.2% |
| 2024 | 41.2% | 36.8% |
| 2025 | 42.0% | 37.4% |
Embed
Median gross rent, in 2025 dollars
+6.0% in the state and +18.5% in the US.
Source: ACS 1-year, 2015 to 2025, table A18009.
Show data
| New York | United States | |
|---|---|---|
| 2015 | $1,607 | $1,314 |
| 2016 | $1,615 | $1,327 |
| 2017 | $1,623 | $1,340 |
| 2018 | $1,647 | $1,368 |
| 2019 | $1,662 | $1,393 |
| 2021 | $1,688 | $1,427 |
| 2022 | $1,661 | $1,440 |
| 2023 | $1,661 | $1,496 |
| 2024 | $1,689 | $1,537 |
| 2025 | $1,704 | $1,557 |
Embed
Median home value, in 2025 dollars
+17.1% in the state and +39.3% in the US.
Source: ACS 1-year, 2015 to 2025, table A10036.
Show data
| New York | United States | |
|---|---|---|
| 2015 | $402,101 | $266,469 |
| 2016 | $409,019 | $277,278 |
| 2017 | $416,429 | $288,124 |
| 2018 | $420,738 | $296,908 |
| 2019 | $430,010 | $305,336 |
| 2021 | $441,821 | $337,116 |
| 2022 | $443,549 | $355,481 |
| 2023 | $447,041 | $361,931 |
| 2024 | $464,874 | $372,685 |
| 2025 | $470,900 | $371,100 |
Embed
ACS 1-year estimates. The dotted stretch of each line spans 2020, when the Census Bureau released no standard 1-year estimates. Dollar values are in 2025 dollars.
| Indicator | 2015 | 2025 | Change |
|---|---|---|---|
| Population | 19,795,791 | 20,002,427 | +1.0% |
| Median age | 38.3 | 39.8 | +1.5 years |
| 65 and over | 15.0% | 19.3% | +4.4 points |
| Born outside the US | 22.9% | 23.4% | +0.5 points |
| Hispanic or Latino | 18.8% | 21.0% | +2.2 points |
| Median household income | $83,366 | $89,210 | +7.0% |
| Living in poverty | 15.4% | 13.8% | −1.6 points |
| Bachelor’s degree or more | 35.0% | 42.0% | +7.0 points |
| Households that rent | 46.9% | 46.0% | −0.9 points |
| Median gross rent | $1,607 | $1,704 | +6.0% |
| Median home value | $402,101 | $470,900 | +17.1% |
5411 census tracts
New York, tract by tract
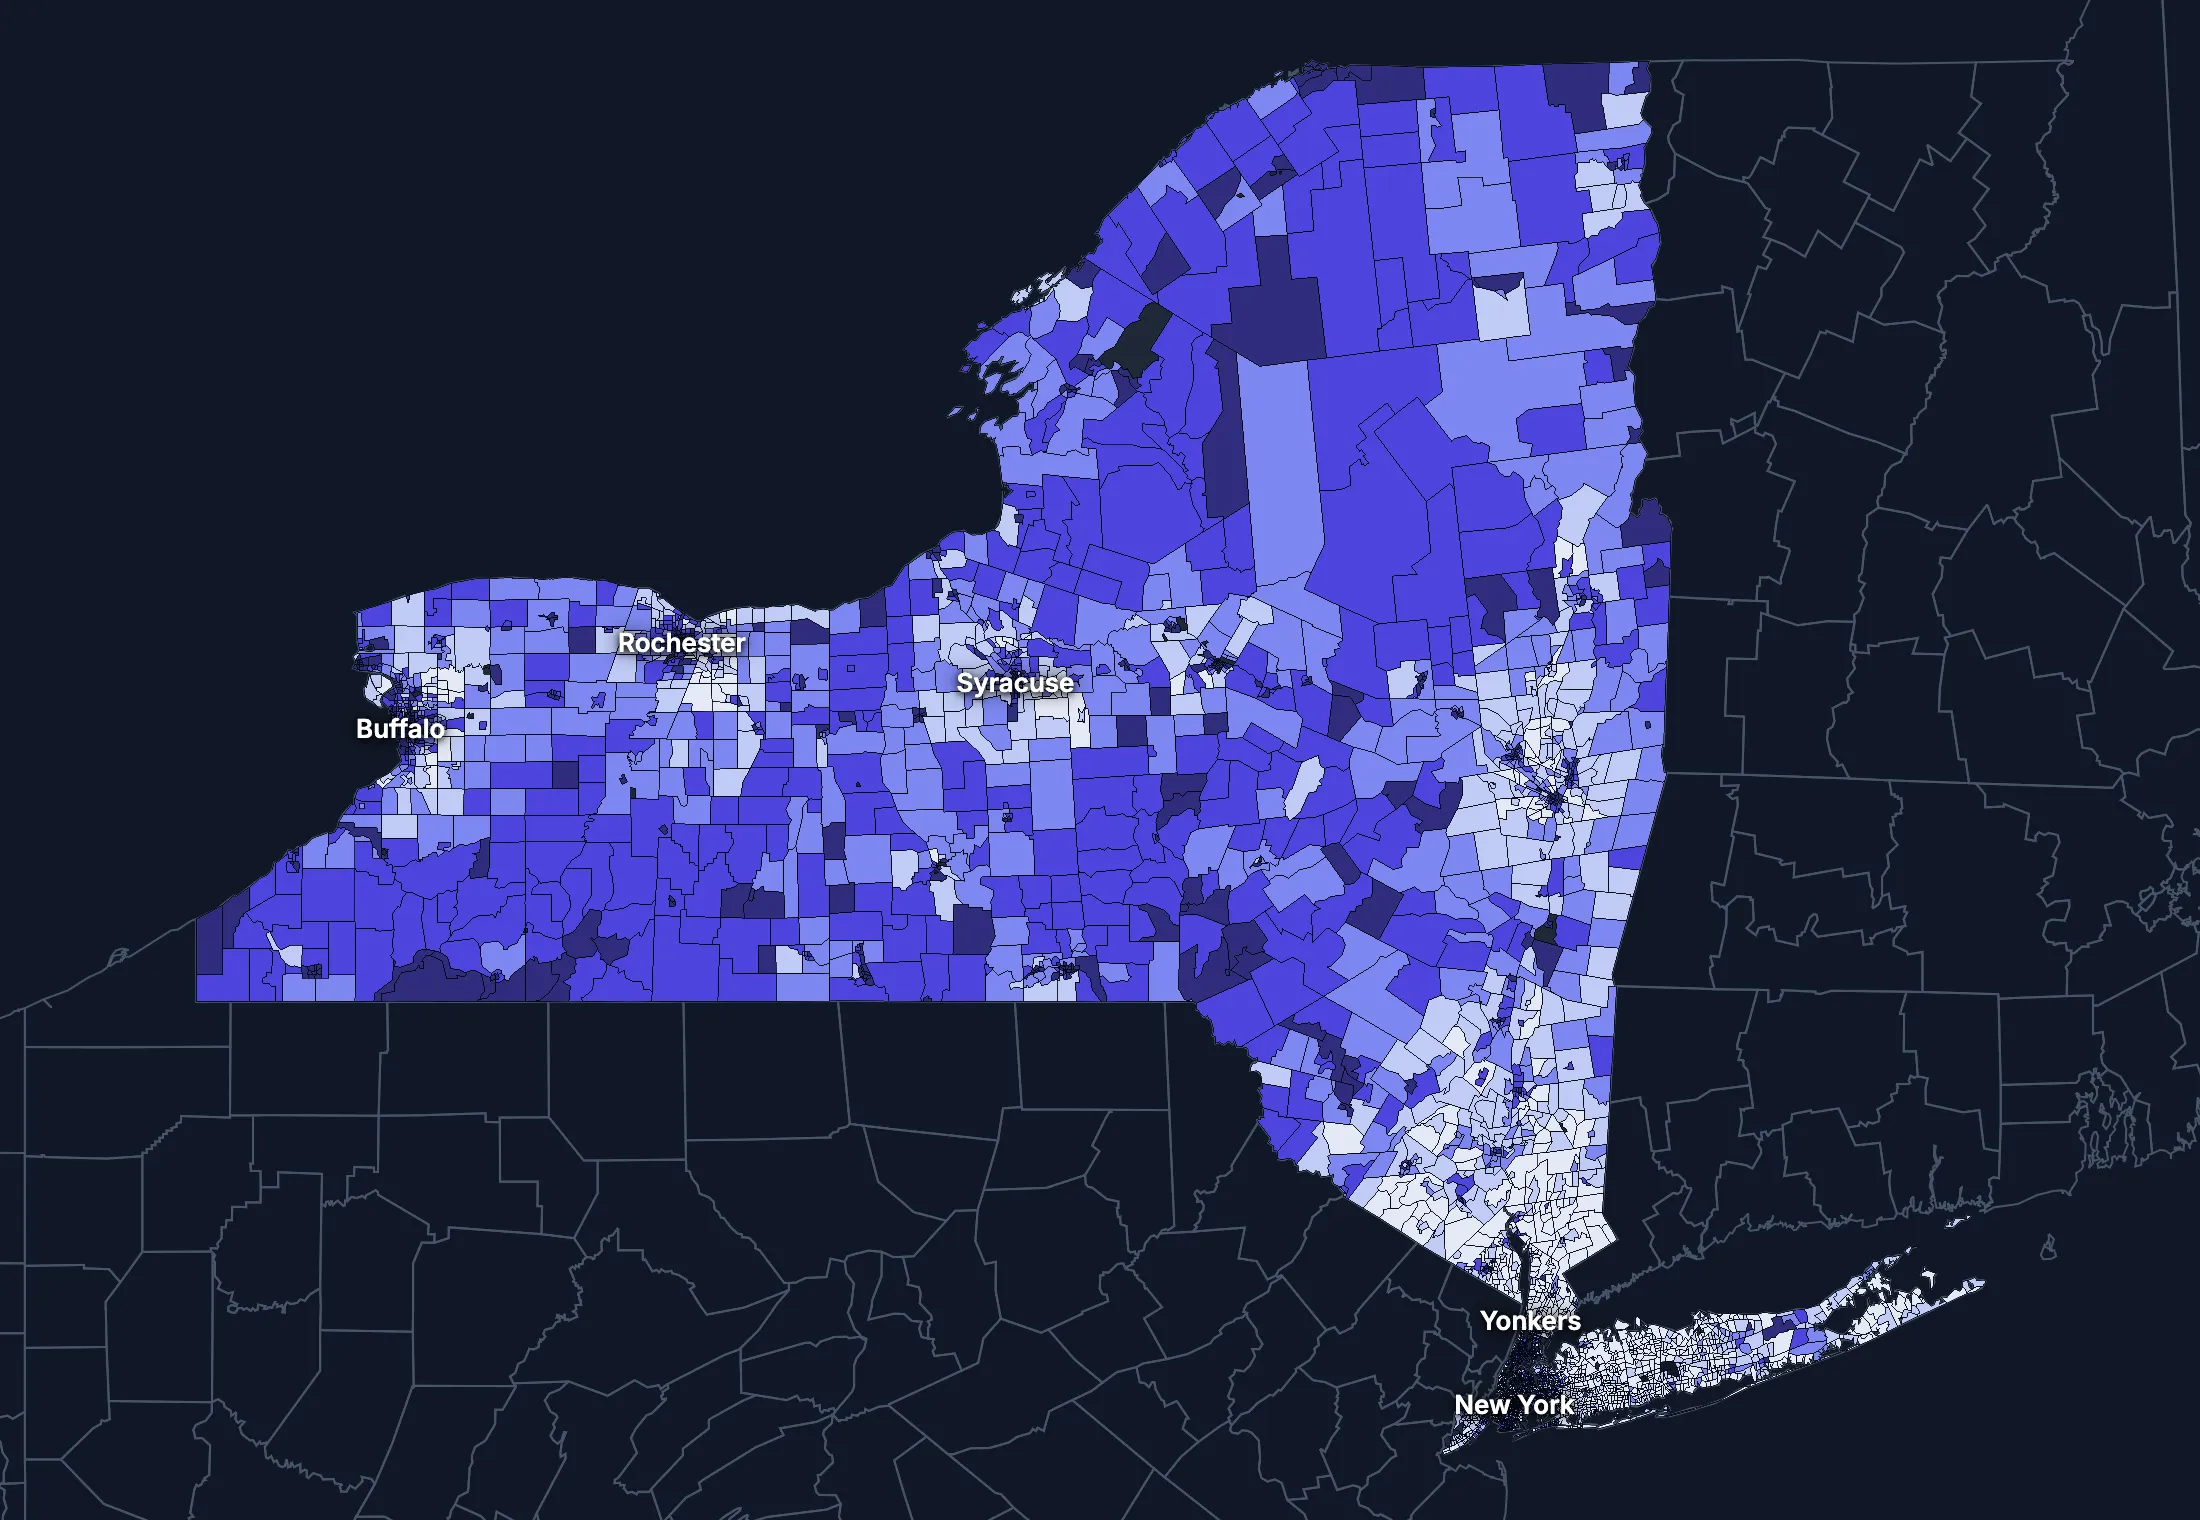
State averages hide a lot. These census tracts are the closest the census comes to neighborhoods.
Where the state’s average misleads
Each tick is one census tract, and the dark line marks the state. Hover over a tick or tap it to see the tract.
Poverty
1124 of 5242 tracts are at least 1.5 times the state’s overall 14.0%, and 2180 are at two-thirds of it or less.
Highest: Tract 259, 100.0%. Lowest: Tract 4.04, 0.0%.
Renters paying 30% or more of income
271 of 4988 tracts are at least 1.5 times the state’s overall 49.2%, and 857 are at two-thirds of it or less.
Highest: Tract 1408.01, 100.0%. Lowest: Tract 91.13, 0.0%.
Adults with a bachelor’s degree
753 of 5265 tracts are at least 1.5 times the state’s overall 40.3%, and 1737 are at two-thirds of it or less.
Highest: Tract 53.02, 100.0%. Lowest: Tract 24, 0.0%.
Median household income
988 of 5191 tracts are at least 1.5 times the typical tract’s $85,485, and 952 are at two-thirds of it or less.
Highest: Tract 21, $250,000 or more. Lowest: Tract 9810, under $2,500.
American Community Survey 2020–2024 5-year estimates, by census tract. Income is capped at $250,000+ by the Census Bureau.
People
Who lives in New York
Its median age of 39.8 is higher than the US (39.5). 23.4% of residents were born outside the US, and 32.1% speak a language other than English at home.
Age
Source: ACS 2025 1-year, table A01001.
Show data
| New York | United States | |
|---|---|---|
| Under 18 | 19.5% ±0.1% , number 3,891,733 ±25,110 | 21.0% ±<0.1% , number 71,689,151 ±111,800 |
| 18 to 24 | 9.2% ±0.1% , number 1,834,477 ±21,400 | 9.3% ±<0.1% , number 31,716,680 ±98,660 |
| 25 to 34 | 14.7% ±<0.1% , number 2,930,704 ±7,236 | 13.6% ±<0.1% , number 46,357,354 ±55,690 |
| 35 to 44 | 13.3% ±0.1% , number 2,653,891 ±25,100 | 13.4% ±<0.1% , number 45,746,189 ±105,700 |
| 45 to 54 | 11.6% ±<0.1% , number 2,312,598 ±7,259 | 11.8% ±<0.1% , number 40,257,563 ±53,540 |
| 55 to 64 | 12.6% ±0.1% , number 2,513,276 ±26,130 | 12.1% ±<0.1% , number 41,242,904 ±104,700 |
| 65 to 74 | 10.8% ±0.1% , number 2,163,489 ±22,580 | 10.8% ±<0.1% , number 36,895,650 ±91,520 |
| 75 and over | 8.5% ±0.1% , number 1,702,259 ±18,870 | 8.2% ±<0.1% , number 27,879,368 ±78,140 |
Embed
Race and ethnicity
Source: ACS 2025 1-year, table A04001.
Show data
| New York | United States | |
|---|---|---|
| White, not Hispanic | 50.3% ±0.1% , number 10,069,725 ±18,470 | 55.0% ±<0.1% , number 187,959,031 ±58,340 |
| Hispanic or Latino | 21.0% ±<0.1% , number 4,196,823 ±482 | 20.5% ±<0.1% , number 69,975,516 ±13,270 |
| Black, not Hispanic | 13.0% ±0.1% , number 2,603,740 ±23,720 | 11.7% ±<0.1% , number 40,096,453 ±106,200 |
| Asian, not Hispanic | 10.3% ±0.1% , number 2,052,812 ±13,530 | 6.5% ±<0.1% , number 22,096,709 ±58,340 |
| Other or multiracial | 5.4% ±0.2% , number 1,079,327 ±32,620 | 6.3% ±<0.1% , number 21,657,150 ±150,100 |
Embed
Language spoken at home
Source: ACS 2025 1-year, table C16001.
Show data
| New York | United States | |
|---|---|---|
| English only | 67.9% ±0.3% , number 12,883,894 ±50,740 | 77.1% ±0.1% , number 249,390,588 ±275,300 |
| Spanish | 15.1% ±0.2% , number 2,867,192 ±31,130 | 13.9% ±0.1% , number 44,921,985 ±177,800 |
| Other Indo-European | 9.1% ±0.2% , number 1,726,582 ±40,840 | 4.0% ±<0.1% , number 12,862,980 ±113,500 |
| Asian and Pacific Island | 5.8% ±0.1% , number 1,092,415 ±27,520 | 3.8% ±<0.1% , number 12,288,841 ±99,740 |
| Arabic and other | 2.1% ±0.1% , number 397,520 ±25,090 | 1.3% ±<0.1% , number 4,116,949 ±71,480 |
Embed
Marital status
Source: ACS 2025 1-year, table A11001.
Show data
| New York | United States | |
|---|---|---|
| Now married | 44.1% ±0.3% , number 7,413,514 ±48,790 | 47.9% ±0.1% , number 135,567,564 ±223,300 |
| Never married | 39.8% ±0.2% , number 6,689,202 ±36,910 | 34.8% ±0.1% , number 98,647,238 ±152,600 |
| Divorced | 8.5% ±0.1% , number 1,435,673 ±23,080 | 10.2% ±<0.1% , number 28,879,967 ±112,900 |
| Widowed | 5.5% ±0.1% , number 918,650 ±17,190 | 5.5% ±<0.1% , number 15,599,094 ±69,430 |
| Separated | 2.1% ±0.1% , number 349,693 ±14,530 | 1.6% ±<0.1% , number 4,441,399 ±49,160 |
Embed
Where people lived a year ago
Source: ACS 2025 1-year, table A08001.
Show data
| New York | United States | |
|---|---|---|
| Same home | 90.8% ±0.2% , number 17,983,680 ±35,210 | 88.4% ±0.1% , number 298,889,697 ±214,800 |
| Same county | 4.8% ±0.1% , number 948,439 ±25,710 | 6.0% ±<0.1% , number 20,202,671 ±166,300 |
| Another county in the state | 2.3% ±0.1% , number 461,317 ±19,470 | 3.0% ±<0.1% , number 10,168,097 ±89,190 |
| Another state | 1.4% ±0.1% , number 275,712 ±15,170 | 2.1% ±<0.1% , number 7,025,589 ±81,660 |
| Another country | 0.7% ±0.1% , number 135,939 ±10,150 | 0.6% ±<0.1% , number 1,984,943 ±47,210 |
Embed
Top countries of birth, among those born abroad
Source: ACS 2025 1-year, table A07001.
Show data
| New York | |
|---|---|
| Dominican Republic | 10.8% , number 505,308 |
| China, Excluding Hong Kong and Taiwan | 10.0% , number 466,068 |
| Ecuador | 4.8% , number 224,132 |
| Jamaica | 4.7% , number 220,118 |
| Mexico | 3.9% , number 184,345 |
| India | 3.7% , number 171,463 |
Embed
All the numbers
| Indicator | New York | US | Rank among states* | Table |
|---|---|---|---|---|
| Population | 20,002,427 | 341,784,859 | 4th | A00001 |
| People per square mile | 424 | 97 | 8th | A00002 |
| Land area (square miles) | 47,124 | – | – | A00002 |
| Median age | 39.8 ±0.1 | 39.5 ±0.1 | 18th | A01004 |
| Under 18 | 19.5% ±0.1% , number 3,891,733 ±25,110 | 21.0% ±<0.1% , number 71,689,151 ±111,800 | 40th | B02002 |
| 65 and over | 19.3% ±0.1% , number 3,865,748 ±29,420 | 19.0% ±<0.1% , number 64,775,018 ±120,300 | 22nd | B02002 |
| Born outside the US | 23.4% ±0.3% , number 4,673,727 ±50,880 | 14.7% ±0.1% , number 50,409,320 ±204,800 | 3rd | A06001 |
| Speak a language other than English at home | 32.1% ±0.3% , number 6,083,709 ±63,430 | 22.9% ±0.1% , number 74,190,755 ±244,000 | 5th | C16001 |
| Veterans (adults) | 3.3% ±0.1% , number 524,170 ±10,700 | 5.9% ±<0.1% , number 15,746,228 ±85,320 | 50th | A16002 |
| Living with a disability | 13.2% ±0.2% , number 2,609,456 ±29,910 | 13.7% ±<0.1% , number 46,271,455 ±126,000 | 35th | B18101 |
| Women 15–50 who had a baby in the past year | 4.8% ±0.2% , number 231,990 ±10,510 | 5.0% ±0.1% , number 4,016,759 ±44,040 | 40th | B13002 |
| Lived in the same home a year ago | 90.8% ±0.2% , number 17,983,680 ±35,210 | 88.4% ±0.1% , number 298,889,697 ±214,800 | 2nd | A08001 |
| White, not Hispanic | 50.3% ±0.1% , number 10,069,725 ±18,470 | 55.0% ±<0.1% , number 187,959,031 ±58,340 | 40th | A04001 |
| Hispanic or Latino | 21.0% ±<0.1% , number 4,196,823 ±482 | 20.5% ±<0.1% , number 69,975,516 ±13,270 | 9th | A04001 |
| Black, not Hispanic | 13.0% ±0.1% , number 2,603,740 ±23,720 | 11.7% ±<0.1% , number 40,096,453 ±106,200 | 14th | A04001 |
| Asian, not Hispanic | 10.3% ±0.1% , number 2,052,812 ±13,530 | 6.5% ±<0.1% , number 22,096,709 ±58,340 | 5th | A04001 |
*1 is the highest. Population is ranked among all states, and the rest among those of 1,000 people or more, whose figures can be ranked. Ranks use 5-year estimates, the only ones covering every state, so they can differ slightly from the figures here.
Income and work
Higher incomes than the US
The median household income is $89,210, higher than the US ($84,780). 13.8% of people live in poverty, and 4.7% have no health insurance, lower than the US (8.4%).
Household income
Source: ACS 2025 1-year, table A14001.
Show data
| New York | United States | |
|---|---|---|
| Under $25,000 | 15.7% ±0.3% , number 1,236,543 ±24,160 | 14.0% ±0.1% , number 18,727,548 ±88,990 |
| $25,000 to $49,999 | 14.3% ±0.3% , number 1,123,860 ±22,370 | 15.4% ±0.1% , number 20,665,585 ±101,400 |
| $50,000 to $74,999 | 13.4% ±0.3% , number 1,055,510 ±20,550 | 15.3% ±0.1% , number 20,513,565 ±88,500 |
| $75,000 to $99,999 | 11.0% ±0.2% , number 869,227 ±16,010 | 12.5% ±0.1% , number 16,814,245 ±87,520 |
| $100,000 to $149,999 | 16.6% ±0.3% , number 1,307,399 ±21,790 | 17.9% ±0.1% , number 24,018,984 ±99,670 |
| $150,000 to $199,999 | 10.3% ±0.2% , number 811,261 ±17,750 | 10.1% ±0.1% , number 13,521,827 ±70,660 |
| $200,000 or more | 18.6% ±0.3% , number 1,463,812 ±21,470 | 14.8% ±0.1% , number 19,801,668 ±84,120 |
Embed
What residents do for work
Source: ACS 2025 1-year, table A17004.
Show data
| New York | United States | |
|---|---|---|
| Education and health care | 30.0% ±0.4% , number 2,950,847 ±36,930 | 24.4% ±0.1% , number 40,862,193 ±140,800 |
| Professional and business services | 14.2% ±0.2% , number 1,393,261 ±21,620 | 12.8% ±0.1% , number 21,375,231 ±87,110 |
| Retail trade | 9.3% ±0.3% , number 915,633 ±25,090 | 10.6% ±0.1% , number 17,781,181 ±96,660 |
| Arts, food and lodging | 8.3% ±0.2% , number 815,156 ±21,350 | 8.9% ±0.1% , number 14,811,502 ±87,840 |
| Finance, insurance and real estate | 7.8% ±0.2% , number 766,383 ±15,660 | 6.6% ±<0.1% , number 11,025,569 ±68,570 |
| Transportation and warehousing | 5.6% ±0.2% , number 552,516 ±17,510 | 5.9% ±<0.1% , number 9,832,211 ±73,020 |
| Manufacturing | 5.5% ±0.2% , number 535,808 ±15,430 | 9.6% ±0.1% , number 16,064,394 ±91,270 |
| Construction | 5.4% ±0.1% , number 527,975 ±14,800 | 6.7% ±<0.1% , number 11,254,981 ±79,620 |
Embed
Where workers come from and go
New York has 9,411,356 jobs and 8,984,025 employed residents. 832,893 people commute in to work and 405,562 commute out, while 8,578,463 both live and work here. The most commuters come from New Jersey.
Most commuters come from
- New Jersey: 530,382
- Connecticut: 106,891
- Pennsylvania: 75,583
Most residents commute to
- New Jersey: 195,365
- Connecticut: 64,401
- Pennsylvania: 39,865
Show data
| New York | |
|---|---|
| Live and work here | 8,578,463 |
| Work here, live elsewhere | 832,893 |
| Live here, work elsewhere | 405,562 |
Embed
All the numbers
| Indicator | New York | US | Rank among states* | Table |
|---|---|---|---|---|
| Median household income | $89,210 ±$934 | $84,780 ±$215 | 16th | A14006 |
| Income per person | $53,067 ±$471 | $47,171 ±$115 | 9th | A14024 |
| Income inequality (Gini index) | 0.519 ±0.003 | 0.482 ±0.001 | 2nd | A14028 |
| Living in poverty | 13.8% ±0.3% , number 2,686,029 ±58,220 | 11.8% ±0.1% , number 39,264,183 ±277,400 | 11th | A13004 |
| Unemployment rate | 5.6% ±0.2% , number 579,302 ±17,690 | 4.9% ±<0.1% , number 8,574,594 ±64,350 | 3rd | A17005 |
| No health insurance | 4.7% ±0.1% , number 924,364 ±25,070 | 8.4% ±<0.1% , number 28,323,306 ±152,000 | 43rd | A20001 |
*1 is the highest. Population is ranked among all states, and the rest among those of 1,000 people or more, whose figures can be ranked. Ranks use 5-year estimates, the only ones covering every state, so they can differ slightly from the figures here.
Education
More college degrees than the US
42.0% of adults 25 and over have a bachelor’s degree or more, higher than the US (37.4%).
Highest level of education
Source: ACS 2025 1-year, table A12001.
Show data
| New York | United States | |
|---|---|---|
| Less than high school | 11.2% ±0.2% , number 1,597,291 ±31,470 | 9.4% ±0.1% , number 22,321,002 ±120,500 |
| High school only | 23.8% ±0.3% , number 3,402,385 ±37,430 | 25.6% ±0.1% , number 61,096,726 ±203,400 |
| Some college | 23.0% ±0.2% , number 3,278,961 ±35,010 | 27.7% ±0.1% , number 65,920,977 ±173,500 |
| Bachelor’s degree | 23.3% ±0.3% , number 3,325,432 ±36,220 | 22.3% ±0.1% , number 53,224,312 ±196,700 |
| Graduate degree | 18.7% ±0.2% , number 2,672,148 ±31,020 | 15.0% ±0.1% , number 35,816,011 ±159,400 |
Embed
All the numbers
| Indicator | New York | US | Rank among states* | Table |
|---|---|---|---|---|
| Bachelor’s degree or more | 42.0% ±0.3% , number 5,997,580 ±47,690 | 37.4% ±0.1% , number 89,040,323 ±253,200 | 10th | A12001 |
| High school graduate or more | 88.8% ±0.5% , number 12,678,926 ±70,000 | 90.6% ±0.2% , number 216,058,026 ±368,200 | 46th | A12001 |
*1 is the highest. Population is ranked among all states, and the rest among those of 1,000 people or more, whose figures can be ranked. Ranks use 5-year estimates, the only ones covering every state, so they can differ slightly from the figures here.
Housing
Home values outran incomes
46.0% of households rent, higher than the US (34.7%). The median home is worth $470,900 and the median rent is $1,704. After inflation, home values rose 17% from 2015 to 2025, while household income rose 7%.
Housing costs and income, 2015 to 2025, after inflation
Source: ACS 1-year, table A10036, A18009, A14006.
Show data
| New York | United States | |
|---|---|---|
| Median home value | +17.1% | +39.3% |
| Median rent | +6.0% | +18.5% |
| Median household income | +7.0% | +10.9% |
Embed
Types of homes
Source: ACS 2025 1-year, table A10032.
Show data
| New York | United States | |
|---|---|---|
| Single-family, detached | 40.7% ±0.2% , number 3,555,013 ±21,420 | 60.9% ±0.1% , number 90,335,844 ±173,300 |
| Single-family, attached | 5.1% ±0.1% , number 448,777 ±12,630 | 6.4% ±<0.1% , number 9,527,703 ±51,230 |
| 2 to 4 units | 16.4% ±0.3% , number 1,431,578 ±23,210 | 7.5% ±0.1% , number 11,109,005 ±75,790 |
| 5 to 19 units | 9.6% ±0.2% , number 842,534 ±19,610 | 8.7% ±0.1% , number 12,829,882 ±97,590 |
| 20 or more units | 26.0% ±0.3% , number 2,275,660 ±28,410 | 11.1% ±0.1% , number 16,381,450 ±92,310 |
| Mobile homes and other | 2.1% ±0.1% , number 184,640 ±7,892 | 5.4% ±<0.1% , number 8,045,083 ±53,680 |
Embed
When homes were built
Source: ACS 2025 1-year, table A10055.
Show data
| New York | United States | |
|---|---|---|
| 2010 or later | 7.8% ±0.2% , number 613,334 ±16,390 | 15.1% ±0.1% , number 20,257,912 ±101,300 |
| 2000 to 2009 | 6.7% ±0.2% , number 528,139 ±14,440 | 13.8% ±0.1% , number 18,535,840 ±92,260 |
| 1980 to 1999 | 13.1% ±0.2% , number 1,028,740 ±18,480 | 24.1% ±0.1% , number 32,332,570 ±118,900 |
| 1960 to 1979 | 21.9% ±0.3% , number 1,724,427 ±26,280 | 22.9% ±0.1% , number 30,726,302 ±110,000 |
| Before 1960 | 50.5% ±0.5% , number 3,972,972 ±37,780 | 24.0% ±0.1% , number 32,210,798 ±121,500 |
Embed
All the numbers
| Indicator | New York | US | Rank among states* | Table |
|---|---|---|---|---|
| Housing units | 8,738,202 | – | – | A10001 |
| Households | 7,867,612 ±17,340 | – | – | A10008 |
| People per household | 2.46 ±0.01 | 2.49 ±0.01 | 16th | A10003 |
| Households that rent | 46.0% ±0.3% , number 3,620,018 ±26,630 | 34.7% ±0.1% , number 46,551,688 ±193,200 | 2nd | A10060 |
| Vacant homes | 10.0% ±0.2% , number 870,590 ±17,400 | 9.6% ±0.1% , number 14,165,545 ±137,100 | 30th | A10047, A10060 |
| Median gross rent | $1,704 ±$14 | $1,557 ±$4 | 10th | A18009 |
| Median home value | $470,900 ±$5,866 | $371,100 ±$646 | 11th | A10036 |
| Renters paying 30% or more of income | 49.1% ±0.7% , number 1,776,717 ±28,310 | 48.3% ±0.2% , number 22,486,693 ±122,100 | 8th | A18002 |
| Owners paying 30% or more of income | 28.7% ±0.5% , number 1,219,611 ±22,980 | 24.2% ±0.1% , number 21,201,943 ±93,050 | 4th | A10040 |
| Homes built before 1960 | 50.5% ±0.5% , number 3,972,972 ±37,780 | 24.0% ±0.1% , number 32,210,798 ±121,500 | 2nd | A10055 |
*1 is the highest. Population is ranked among all states, and the rest among those of 1,000 people or more, whose figures can be ranked. Ranks use 5-year estimates, the only ones covering every state, so they can differ slightly from the figures here.
Getting around
A state that rides transit
48.3% of workers drive alone and 11.5% work from home. 51.2% of those who travel to work spend 30 minutes or more getting there, and 30.9% of households have no vehicle.
How people get to work
Source: ACS 2025 1-year, table A09005.
Show data
| New York | United States | |
|---|---|---|
| Drive alone | 48.3% ±0.3% , number 4,662,789 ±37,780 | 69.8% ±0.1% , number 115,297,377 ±192,900 |
| Carpool | 6.1% ±0.2% , number 593,590 ±17,660 | 8.9% ±0.1% , number 14,712,170 ±97,240 |
| Public transit | 26.3% ±0.3% , number 2,536,130 ±33,820 | 4.3% ±<0.1% , number 7,100,386 ±63,330 |
| Walk | 5.8% ±0.2% , number 561,003 ±18,200 | 2.4% ±<0.1% , number 4,016,469 ±41,070 |
| Work from home | 11.5% ±0.2% , number 1,106,756 ±23,220 | 12.9% ±0.1% , number 21,288,393 ±105,700 |
| Other | 2.0% ±0.1% , number 193,818 ±11,520 | 1.7% ±<0.1% , number 2,799,658 ±41,510 |
Embed
Time spent getting to work
Source: ACS 2025 1-year, table B09001.
Show data
| New York | United States | |
|---|---|---|
| Under 10 minutes | 9.5% ±0.2% , number 808,469 ±19,200 | 12.0% ±0.1% , number 17,199,225 ±93,440 |
| 10 to 19 minutes | 21.5% ±0.3% , number 1,839,645 ±28,700 | 27.8% ±0.1% , number 40,059,540 ±137,700 |
| 20 to 29 minutes | 17.9% ±0.3% , number 1,527,139 ±30,050 | 21.0% ±0.1% , number 30,221,743 ±111,100 |
| 30 to 39 minutes | 17.2% ±0.3% , number 1,466,417 ±25,720 | 17.1% ±0.1% , number 24,659,138 ±103,800 |
| 40 to 59 minutes | 16.1% ±0.3% , number 1,375,074 ±25,130 | 12.6% ±0.1% , number 18,104,709 ±97,070 |
| 60 minutes or more | 17.9% ±0.3% , number 1,530,586 ±27,880 | 9.5% ±0.1% , number 13,681,705 ±84,440 |
Embed
Vehicles per household
Source: ACS 2025 1-year, table A10030.
Show data
| New York | United States | |
|---|---|---|
| None | 30.9% ±0.3% , number 2,431,019 ±26,600 | 8.8% ±0.1% , number 11,781,997 ±77,240 |
| One | 32.8% ±0.4% , number 2,581,235 ±31,230 | 33.1% ±0.1% , number 44,424,682 ±160,700 |
| Two | 24.7% ±0.3% , number 1,941,739 ±27,010 | 36.0% ±0.1% , number 48,200,889 ±176,800 |
| Three or more | 11.6% ±0.2% , number 913,619 ±17,420 | 22.1% ±0.1% , number 29,655,854 ±113,300 |
Embed
All the numbers
| Indicator | New York | US | Rank among states* | Table |
|---|---|---|---|---|
| Drive to work alone | 48.3% ±0.3% , number 4,662,789 ±37,780 | 69.8% ±0.1% , number 115,297,377 ±192,900 | 50th | A09005 |
| Take public transit | 26.3% ±0.3% , number 2,536,130 ±33,820 | 4.3% ±<0.1% , number 7,100,386 ±63,330 | 1st | A09005 |
| Work from home | 11.5% ±0.2% , number 1,106,756 ±23,220 | 12.9% ±0.1% , number 21,288,393 ±105,700 | 23rd | A09005 |
| Commute 30 minutes or more | 51.2% ±0.5% , number 4,372,077 ±45,500 | 39.2% ±0.1% , number 56,445,552 ±165,300 | 2nd | B09001 |
| Households with no vehicle | 30.9% ±0.3% , number 2,431,019 ±23,460 | 8.8% ±<0.1% , number 11,781,997 ±64,240 | 2nd | A10030 |
*1 is the highest. Population is ranked among all states, and the rest among those of 1,000 people or more, whose figures can be ranked. Ranks use 5-year estimates, the only ones covering every state, so they can differ slightly from the figures here.
Places
The largest cities in New York
Population, from the latest estimates available. Figures cover the whole of each place.
Largest places
- New York: 8,584,629
- Buffalo: 274,638
- Yonkers: 212,590
- Rochester: 206,104
- Syracuse: 144,922
- Albany: 101,701
- New Rochelle: 85,862
- Cheektowaga: 73,888
States like this one
- California: 39,287,377
- New Jersey: 9,343,809
- Washington: 7,816,116
- Massachusetts: 7,044,056
States at least a third this size, with the closest income, education, age, housing and origins.
Every county and place in New York
Find any county, city, town, metro area, ZIP code, school district or district in New York.
Counties
Each of the 62 counties with its population, from ACS 2020–2024 5-year estimates.
- Albany County317,018
- Allegany County47,159
- Bronx County1.40M
- Broome County197,378
- Cattaraugus County76,145
- Cayuga County75,102
- Chautauqua County125,544
- Chemung County82,147
- Chenango County46,321
- Clinton County78,493
- Columbia County61,100
- Cortland County46,246
- Delaware County44,487
- Dutchess County298,220
- Erie County950,622
- Essex County36,973
- Franklin County46,696
- Fulton County52,487
- Genesee County57,787
- Greene County47,409
- Hamilton County5,089
- Herkimer County59,757
- Jefferson County115,040
- Kings County2.63M
- Lewis County26,607
- Livingston County61,498
- Madison County67,328
- Monroe County753,753
- Montgomery County49,528
- Nassau County1.39M
- New York County1.63M
- Niagara County210,721
- Oneida County229,124
- Onondaga County471,129
- Ontario County112,625
- Orange County406,616
- Orleans County39,608
- Oswego County117,953
- Otsego County60,108
- Putnam County98,107
- Queens County2.32M
- Rensselaer County160,332
- Richmond County494,956
- Rockland County341,883
- Saratoga County238,284
- Schenectady County160,369
- Schoharie County30,049
- Schuyler County17,562
- Seneca County32,920
- St. Lawrence County107,226
- Steuben County92,588
- Suffolk County1.53M
- Sullivan County79,721
- Tioga County47,864
- Tompkins County104,537
- Ulster County182,601
- Warren County65,517
- Washington County60,522
- Wayne County90,929
- Westchester County999,677
- Wyoming County39,753
- Yates County24,526
Cities, towns and other places
Each of the 1,289 with its population, from ACS 2020–2024 5-year estimates. Census-designated places are communities without a local government of their own, drawn by the Census Bureau so they can be counted.
- Accord638
- Adams1,531
- Adams Center1,075
- Addison1,688
- Afton1,225
- Airmont10,205
- Akron2,897
- Akwesasne4,089
- Albany100,492
- Albertson4,891
- Albion5,506
- Alden2,633
- Alexander404
- Alexandria Bay1,212
- Alfred4,819
- Allegany1,740
- Almond368
- Altamont1,855
- Altmar243
- Altona544
- Amagansett821
- Amenia977
- Ames87
- Amityville9,588
- Amsterdam18,166
- Andes151
- Andover915
- Angelica605
- Angola2,411
- Angola on the Lake1,707
- Antwerp683
- Apalachin2,553
- Aquebogue1,869
- Arcade1,915
- Ardsley4,998
- Argyle355
- Arkport897
- Arlington2,806
- Armonk4,429
- Asharoken805
- Athens1,943
- Atlantic Beach1,422
- Attica2,028
- Au Sable Forks369
- Auburn26,285
- Aurora651
- Averill Park1,615
- Avoca1,023
- Avon3,417
- Babylon12,185
- Bainbridge1,181
- Baiting Hollow2,614
- Baldwin34,994
- Baldwinsville7,715
- Ballston Spa5,027
- Balmville3,399
- Bard College1,130
- Bardonia3,717
- Barker590
- Barneveld240
- Barnum Island2,302
- Barrytown135
- Barryville461
- Batavia15,097
- Bath5,560
- Baxter Estates1,058
- Bay Park1,510
- Bay Shore31,683
- Bayport8,921
- Bayville6,744
- Baywood8,176
- Beacon14,834
- Beaver Dam Lake3,627
- Bedford1,874
- Bedford Hills2,488
- Belfast633
- Belle Terre740
- Bellerose1,136
- Bellerose Terrace2,006
- Belleville220
- Bellmore15,954
- Bellport1,948
- Belmont955
- Bemus Point191
- Bergen1,360
- Bethpage17,123
- Big Flats5,651
- Billington Heights1,610
- Binghamton47,151
- Binghamton University7,449
- Black River1,651
- Blasdell2,549
- Blauvelt5,406
- Bliss447
- Blodgett Mills212
- Bloomfield1,310
- Bloomingburg680
- Bloomville289
- Blue Point4,735
- Bohemia9,181
- Bolivar1,124
- Bolton Landing216
- Boonville1,880
- Brasher Falls776
- Breesport628
- Brewerton4,330
- Brewster2,512
- Brewster Heights1,196
- Brewster Hill2,149
- Briarcliff Manor7,519
- Bridgehampton1,531
- Bridgeport1,391
- Bridgeville65
- Bridgewater543
- Brighton36,834
- Brightwaters3,179
- Brinckerhoff2,813
- Broadalbin1,819
- Brockport7,277
- Brocton1,404
- Bronxville6,510
- Brookhaven2,858
- Brooktondale327
- Brookville2,941
- Brownville700
- Brushton504
- Buchanan2,397
- Buffalo276,854
- Burdett536
- Burke165
- Burlington Flats150
- Busti282
- Byersville44
- Cadyville479
- Cairo1,660
- Calcium2,935
- Caledonia2,120
- Callicoon350
- Calverton5,618
- Cambridge2,262
- Camden2,695
- Camillus1,424
- Campbell800
- Canajoharie1,839
- Canandaigua10,514
- Canaseraga422
- Canastota4,487
- Candor984
- Canisteo2,085
- Canton7,167
- Cape Vincent658
- Captree282
- Carle Place5,188
- Carmel7,306
- Caroga Lake448
- Carthage3,510
- Cassadaga608
- Castile805
- Castleton-on-Hudson1,591
- Castorland481
- Cato515
- Catskill3,779
- Cattaraugus1,034
- Cayuga575
- Cayuga Heights4,000
- Cazenovia2,753
- Cedarhurst7,320
- Celoron1,397
- Cementon216
- Center Moriches9,127
- Centereach31,839
- Centerport6,072
- Central Bridge456
- Central Islip38,373
- Central Square2,163
- Centre Island264
- Chadwicks791
- Champlain1,270
- Chappaqua3,046
- Chateaugay724
- Chatham1,669
- Chaumont650
- Chautauqua294
- Chazy240
- Cheektowaga76,056
- Chelsea Cove1,050
- Chenango Bridge3,116
- Cherry Creek327
- Cherry Valley482
- Chester4,033
- Chestertown499
- Chestnut Ridge10,557
- Chittenango4,831
- Churchville2,312
- Clarence2,673
- Clarence Center2,432
- Clark Mills1,591
- Clarkson4,836
- Claverack-Red Mills925
- Clayton1,661
- Clayville254
- Cleveland785
- Clifton Gardens2,420
- Clifton Knolls-Mill Creek3,349
- Clifton Springs2,273
- Clinton1,813
- Clintondale1,784
- Clyde2,001
- Cobleskill4,682
- Cohocton946
- Cohoes18,159
- Cold Brook164
- Cold Spring1,863
- Cold Spring Harbor3,220
- Colonie7,702
- Colton260
- Commack36,558
- Conesus122
- Conesus Lake2,424
- Congers8,275
- Constableville332
- Constantia1,371
- Coopers Plains480
- Cooperstown2,220
- Copake222
- Copake Falls11
- Copake Lake784
- Copenhagen635
- Copiague23,424
- Coram39,539
- Corfu695
- Corinth2,592
- Corning10,643
- Cornwall-on-Hudson3,037
- Cortland17,450
- Cortland West1,020
- Country Knolls5,445
- Cove Neck231
- Coxsackie2,737
- Cragsmoor481
- Cranberry Lake219
- Crest View Heights1,852
- Croghan642
- Crompond2,418
- Croton-on-Hudson8,202
- Crown Heights2,718
- Crugers1,634
- Crystal Beach531
- Cuba1,807
- Cumberland Head1,535
- Cumminsville132
- Cutchogue2,835
- Cuylerville293
- Dalton397
- Danby540
- Dannemora2,684
- Dansville4,653
- Davenport Center414
- Deer Park27,990
- Deferiet366
- DeKalb Junction511
- Delanson263
- Delevan1,275
- Delhi3,136
- Depauville310
- Depew15,000
- Deposit1,424
- DeRuyter349
- DeWitt11,060
- Dexter754
- Dix Hills24,773
- Dobbs Ferry11,443
- Dolgeville1,874
- Dover Plains912
- Downsville163
- Dresden272
- Dryden1,671
- Duane Lake236
- Duanesburg63
- Dundee2,001
- Dunkirk12,549
- Durhamville749
- Eagle Bay90
- Earlville654
- East Atlantic Beach1,825
- East Aurora5,993
- East Avon611
- East Durham495
- East Farmingdale5,666
- East Frankfort571
- East Glenville11,914
- East Greenbush6,581
- East Hampton1,297
- East Hampton North6,006
- East Herkimer659
- East Hills7,257
- East Islip13,573
- East Ithaca1,918
- East Kingston227
- East Marion1,331
- East Massapequa20,377
- East Meadow36,821
- East Moriches6,260
- East Nassau613
- East Northport19,700
- East Norwich2,697
- East Patchogue21,673
- East Quogue5,406
- East Randolph499
- East Rochester6,218
- East Rockaway10,077
- East Setauket10,149
- East Shoreham7,321
- East Syracuse3,039
- East Williston2,611
- East Worcester270
- Eastchester20,491
- Eastport2,414
- Eatons Neck1,173
- Eden3,113
- Edmeston515
- Edwards490
- Eggertsville14,894
- Elba485
- Elbridge1,224
- Eldred136
- Elizabethtown721
- Ellenville4,211
- Ellicottville348
- Ellisburg150
- Elma Center2,814
- Elmira26,257
- Elmira Heights4,110
- Elmont36,518
- Elmsford5,186
- Elwood11,762
- Endicott13,387
- Endwell11,546
- Erin473
- Esperance248
- Evans Mills653
- Fabius350
- Fair Haven1,013
- Fairmount9,724
- Fairport5,403
- Fairview (Dutchess County)6,213
- Fairview (Westchester County)3,034
- Falconer2,149
- Fallsburg1,865
- Farmingdale8,474
- Farmingville16,160
- Farnham435
- Fayetteville4,214
- Felts Mills402
- Fillmore543
- Fire Island352
- Firthcliffe5,432
- Fishers Island72
- Fishers Landing91
- Fishkill2,184
- Flanders6,609
- Fleischmanns148
- Floral Park16,169
- Florida2,893
- Flower Hill4,803
- Fly Creek114
- Fonda596
- Forest Home1,303
- Forestville721
- Fort Ann436
- Fort Covington1,041
- Fort Drum16,065
- Fort Edward3,152
- Fort Johnson364
- Fort Montgomery2,422
- Fort Plain2,290
- Fort Salonga10,199
- Fowlerville444
- Frankfort2,503
- Franklin424
- Franklin Square30,897
- Franklinville1,938
- Fredonia9,467
- Freedom Plains606
- Freeport44,088
- Freeville458
- Frewsburg1,792
- Friendship712
- Fulton11,272
- Fultonville678
- Gainesville224
- Galeville3,962
- Galway172
- Gananda6,273
- Gang Mills4,177
- Garden City22,941
- Garden City Park7,914
- Garden City South4,075
- Gardiner1,210
- Gardnertown4,760
- Garrattsville147
- Gasport1,212
- Gates4,691
- Geneseo7,701
- Geneva12,512
- Germantown1,042
- Ghent517
- Gilbertsville321
- Gilgo148
- Glasco2,210
- Glen Aubrey311
- Glen Cove28,112
- Glen Head4,653
- Glen Park624
- Glens Falls14,609
- Glens Falls North9,154
- Glenwood Landing3,896
- Gloversville14,962
- Golden's Bridge1,815
- Gordon Heights4,230
- Gorham315
- Goshen5,773
- Gouverneur3,615
- Gowanda2,683
- Grahamsville249
- Grand View-on-Hudson226
- Grandyle Village4,912
- Granville2,310
- Great Bend938
- Great Neck11,087
- Great Neck Estates3,023
- Great Neck Gardens1,492
- Great Neck Plaza7,593
- Great River1,899
- Greece13,943
- Green Island2,970
- Greene1,567
- Greenlawn15,210
- Greenport2,574
- Greenport West2,463
- Greenvale1,113
- Greenville (Greene County)620
- Greenville (Westchester County)9,280
- Greenwich1,689
- Greenwood Lake3,020
- Greigsville75
- Groton1,834
- Groveland Station463
- Guilford385
- Hadley1,170
- Hagaman1,044
- Hailesboro583
- Haines Falls513
- Halesite2,661
- Hall255
- Hamburg9,792
- Hamilton4,370
- Hamilton College2,058
- Hamlin4,987
- Hammond320
- Hammondsport506
- Hampton Bays15,706
- Hampton Manor5,334
- Hancock745
- Hankins225
- Hannawa Falls744
- Hannibal593
- Harbor Hills458
- Harbor Isle1,176
- Harriman2,586
- Harris Hill6,069
- Harrison29,961
- Hartsdale2,903
- Hartwick308
- Hartwick Seminary338
- Hastings-on-Hudson8,434
- Hauppauge20,793
- Haverstraw12,325
- Haviland3,923
- Hawthorne4,878
- Head of the Harbor1,384
- Hemlock778
- Hempstead58,801
- Henderson207
- Heritage Hills4,094
- Herkimer7,566
- Hermon636
- Herricks3,907
- Heuvelton546
- Hewlett7,570
- Hewlett Bay Park428
- Hewlett Harbor1,207
- Hewlett Neck519
- Hicksville43,780
- High Falls887
- Highland6,367
- Highland Falls3,683
- Highland-on-the-Lake3,584
- Hillburn1,289
- Hillcrest9,071
- Hillside911
- Hillside Lake784
- Hilton5,968
- Hobart409
- Holbrook26,449
- Holland1,024
- Holland Patent360
- Holley1,927
- Holtsville19,344
- Homer3,114
- Honeoye539
- Honeoye Falls2,765
- Hoosick Falls3,177
- Hopewell Junction1,656
- Hornell8,152
- Horseheads6,449
- Horseheads North2,676
- Hortonville205
- Houghton1,728
- Hudson5,865
- Hudson Falls7,395
- Hunt92
- Hunter156
- Huntington19,948
- Huntington Bay1,693
- Huntington Station32,601
- Hurley3,346
- Hurleyville1,061
- Hyde Park1,983
- Ilion7,593
- Interlaken493
- Inwood12,235
- Irondequoit50,657
- Irvington6,531
- Island Park4,976
- Islandia3,600
- Islip17,362
- Islip Terrace5,168
- Ithaca32,814
- Jacksonville592
- Jamesport1,593
- Jamestown28,188
- Jamestown West2,424
- Jefferson177
- Jefferson Heights1,192
- Jefferson Valley-Yorktown14,154
- Jeffersonville425
- Jericho13,759
- Johnson City14,940
- Johnstown8,111
- Jordan1,574
- Kaser5,694
- Katonah2,176
- Kauneonga Lake461
- Keeseville2,570
- Kenmore15,044
- Kennedy246
- Kensington1,189
- Kerhonkson1,677
- Keuka Park1,121
- Kiamesha Lake469
- Kinderhook1,072
- Kings Park16,516
- Kings Point5,634
- Kingston23,911
- Kiryas Joel38,916
- Kysorville89
- La Fargeville512
- Lackawanna19,753
- Lacona808
- Lake Carmel7,854
- Lake Delta3,202
- Lake Erie Beach3,279
- Lake George1,038
- Lake Grove11,061
- Lake Huntington326
- Lake Katrine2,176
- Lake Luzerne907
- Lake Mohegan5,468
- Lake Placid2,306
- Lake Ronkonkoma18,221
- Lake Success2,829
- Lakeland2,322
- Lakeview5,825
- Lakeville404
- Lakewood2,957
- Lancaster10,113
- Lansing3,876
- Larchmont6,567
- Latham13,802
- Lattingtown1,962
- Laurel1,360
- Laurel Hollow1,927
- Laurens160
- Lawrence6,778
- Le Roy4,301
- Leeds242
- Leicester499
- Levittown51,904
- Lewiston2,588
- Liberty5,142
- Lido Beach2,495
- Lima2,064
- Lime Lake656
- Limestone480
- Lincoln Park2,431
- Lincolndale1,323
- Lindenhurst27,142
- Linwood63
- Lisle239
- Little Falls4,550
- Little Valley1,243
- Liverpool2,695
- Livingston Manor727
- Livonia1,580
- Livonia Center366
- Lloyd Harbor3,565
- Loch Sheldrake1,308
- Lockport20,610
- Locust Valley4,153
- Lodi307
- Long Beach34,756
- Long Lake716
- Lorenz Park1,991
- Lorraine107
- Loudonville10,527
- Lowville3,404
- Lynbrook20,325
- Lyncourt4,095
- Lyndonville771
- Lyon Mountain312
- Lyons3,738
- Lyons Falls569
- MacDonnell Heights1,429
- Macedon2,157
- Machias751
- Madison403
- Madrid641
- Mahopac9,039
- Malden-on-Hudson275
- Malone5,429
- Malverne8,477
- Malverne Park Oaks635
- Mamaroneck19,826
- Manchester1,631
- Manhasset7,716
- Manhasset Hills3,692
- Manlius4,644
- Mannsville417
- Manorhaven6,958
- Manorville14,233
- Marathon952
- Marcellus1,894
- Marcy697
- Margaretville617
- Mariaville Lake1,085
- Marion1,400
- Marist College2,564
- Marlboro3,679
- Massapequa21,389
- Massapequa Park16,963
- Massena10,238
- Mastic15,708
- Mastic Beach16,735
- Matinecock867
- Mattituck4,606
- Mattydale5,971
- Maybrook3,142
- Mayfield1,099
- Mayville1,268
- McGraw974
- McLean410
- Mechanicstown8,808
- Mechanicville5,124
- Medford24,796
- Medina5,770
- Melrose Park1,960
- Melville19,714
- Menands4,505
- Meridian220
- Merrick21,744
- Merritt Park1,685
- Mexico2,241
- Middle Island11,027
- Middleburgh1,220
- Middleport1,987
- Middletown30,289
- Middleville652
- Milford475
- Mill Neck1,136
- Millbrook1,346
- Miller Place11,736
- Millerton851
- Millport243
- Millwood1,083
- Milton (Saratoga County)4,450
- Milton (Ulster County)1,679
- Mineola21,211
- Minetto1,437
- Mineville1,206
- Minoa3,653
- Mohawk2,520
- Mongaup Valley235
- Monroe9,515
- Monsey28,160
- Montauk4,223
- Montebello4,673
- Montgomery3,798
- Monticello7,279
- Montour Falls1,743
- Montrose3,717
- Mooers350
- Moravia1,385
- Moriches2,308
- Morris626
- Morrisonville1,950
- Morristown384
- Morrisville1,594
- Mount Ivy8,121
- Mount Kisco10,737
- Mount Morris3,146
- Mount Sinai11,093
- Mount Vernon72,427
- Mount Vision131
- Mountain Dale499
- Mountain Lodge Park1,669
- Munnsville369
- Munsey Park2,778
- Munsons Corners2,662
- Muttontown3,505
- Myers Corner10,877
- Nanuet19,799
- Napanoch776
- Napeague70
- Naples1,028
- Narrowsburg482
- Nassau1,058
- Nassau Lake830
- Natural Bridge91
- Nazareth College1,319
- Nedrow2,029
- Nelliston707
- Nelsonville714
- Nesconset13,833
- New Baltimore298
- New Berlin989
- New Cassel14,551
- New City34,458
- New Hackensack957
- New Hamburg740
- New Hartford1,989
- New Hempstead5,472
- New Hyde Park10,220
- New Paltz8,314
- New Rochelle82,769
- New Square9,803
- New Suffolk298
- New Windsor8,919
- New York8.48M
- New York Mills3,856
- Newark8,991
- Newark Valley1,051
- Newburgh28,519
- Newfane3,938
- Newfield999
- Newport491
- Niagara Falls47,987
- Niagara University1,473
- Nichols601
- Niskayuna21,227
- Nissequogue1,528
- Niverville1,181
- Norfolk1,204
- North Amityville21,138
- North Babylon17,963
- North Ballston Spa1,299
- North Bay257
- North Bay Shore20,282
- North Bellmore20,689
- North Bellport11,087
- North Blenheim79
- North Boston2,358
- North Collins1,081
- North Creek414
- North Gates9,904
- North Granville531
- North Great River3,909
- North Haven967
- North Hills5,415
- North Hornell1,043
- North Lindenhurst10,952
- North Lynbrook922
- North Massapequa17,877
- North Merrick12,366
- North New Hyde Park14,159
- North Patchogue6,984
- North Rose564
- North Sea6,458
- North Syracuse6,693
- North Tonawanda30,198
- North Valley Stream17,825
- North Wantagh11,940
- Northampton499
- Northeast Ithaca2,661
- Northport7,322
- Northville CDP1,912
- Northville village1,038
- Northwest Harbor5,205
- Northwest Ithaca2,225
- Norwich6,782
- Norwood1,374
- Noyack4,782
- Nunda1,242
- Nyack7,393
- Oak Beach69
- Oakdale7,115
- Oakfield1,659
- Ocean Beach24
- Oceanside31,639
- Odessa508
- Ogdensburg9,455
- Olcott527
- Old Bethpage6,546
- Old Brookville2,107
- Old Field1,007
- Old Forge574
- Old Westbury4,241
- Olean13,738
- Oneida10,171
- Oneida Castle597
- Oneonta15,045
- Ontario2,044
- Orange Lake9,784
- Orangeburg4,529
- Orchard Park3,072
- Orient1,121
- Oriskany1,238
- Oriskany Falls600
- Ossining26,950
- Oswego17,033
- Otego936
- Otisville1,135
- Otter Lake77
- Ovid402
- Owego3,912
- Oxbow92
- Oxford1,514
- Oyster Bay7,308
- Oyster Bay Cove2,075
- Painted Post1,824
- Palatine Bridge727
- Palenville870
- Palmyra3,287
- Pamelia Center907
- Panama451
- Parc98
- Parish601
- Parishville634
- Patchogue12,396
- Paul Smiths623
- Pavilion751
- Pawling2,005
- Peach Lake1,038
- Pearl River16,155
- Peconic848
- Peekskill25,625
- Pelham7,305
- Pelham Manor5,644
- Penn Yan4,714
- Perry3,871
- Perrysburg466
- Peru1,965
- Phelps2,254
- Philadelphia821
- Philmont1,439
- Phoenicia271
- Phoenix2,329
- Piermont2,514
- Pierrepont Manor425
- Piffard199
- Pike199
- Pine Bush1,868
- Pine Hill317
- Pine Plains1,280
- Pine Valley721
- Pittsford1,664
- Plainedge8,624
- Plainview25,982
- Plandome1,518
- Plandome Heights1,036
- Plandome Manor718
- Plattekill1,095
- Plattsburgh19,830
- Plattsburgh West1,328
- Pleasant Valley1,920
- Pleasantville7,371
- Plessis176
- Poestenkill744
- Point Lookout945
- Poland449
- Pomona3,996
- Poquott1,127
- Port Byron900
- Port Chester31,102
- Port Dickinson1,635
- Port Ewen3,426
- Port Gibson661
- Port Henry1,410
- Port Jefferson8,091
- Port Jefferson Station7,676
- Port Jervis8,652
- Port Leyden659
- Port Washington18,004
- Port Washington North3,149
- Portlandville101
- Portville951
- Potsdam8,427
- Pottersville140
- Poughkeepsie31,958
- Prattsburgh650
- Prattsville210
- Preston-Potter Hollow400
- Prospect218
- Pulaski2,156
- Pultneyville730
- Putnam Lake3,664
- Quiogue941
- Quogue760
- Radisson6,676
- Randolph953
- Ransomville1,564
- Rapids1,655
- Ravena3,243
- Red Creek699
- Red Hook2,275
- Red Oaks Mill3,254
- Redford340
- Redwood371
- Remsen373
- Remsenburg-Speonk1,564
- Rensselaer9,287
- Rensselaer Falls483
- Retsof102
- Rhinebeck2,650
- Rhinecliff669
- Richburg650
- Richfield Springs1,104
- Richmondville931
- Richville311
- Ridge12,503
- Rifton541
- Ripley920
- Riverhead14,936
- Riverside CDP4,038
- Riverside village624
- Rochester208,772
- Rochester Institute of Technology6,959
- Rock Hill2,546
- Rockville Centre25,765
- Rocky Point13,356
- Rodman220
- Roessleville10,968
- Rome31,795
- Romulus265
- Ronkonkoma18,709
- Roosevelt18,885
- Roscoe627
- Rosendale962
- Roslyn2,978
- Roslyn Estates1,405
- Roslyn Harbor1,036
- Roslyn Heights6,975
- Rotterdam22,695
- Round Lake915
- Round Top831
- Rouses Point2,414
- Ruby1,098
- Rushford315
- Rushville603
- Russell Gardens1,078
- Rye16,428
- Rye Brook9,900
- Sackets Harbor1,490
- Saddle Rock1,190
- Saddle Rock Estates485
- Sag Harbor2,489
- Sagaponack303
- Salamanca5,846
- Salem770
- Salisbury12,412
- Salisbury Center207
- Salisbury Mills293
- Salt Point322
- Saltaire8
- Sanborn1,573
- Sand Ridge838
- Sands Point2,722
- Sandy Creek638
- Saranac Lake4,965
- Saratoga Springs28,631
- Saugerties3,884
- Saugerties South2,251
- Savannah473
- Savona650
- Sayville15,408
- Scarsdale18,010
- Schaghticoke545
- Schenectady68,847
- Schenevus390
- Schoharie1,144
- Schroon Lake898
- Schuyler Lake83
- Schuylerville1,571
- Scio727
- Scotchtown10,252
- Scotia7,264
- Scotts Corners719
- Scottsburg99
- Scottsville2,723
- Sea Cliff5,033
- Seaford15,549
- Searingtown4,720
- Selden21,604
- Seneca Falls6,956
- Seneca Knolls2,001
- Setauket4,069
- Sharon Springs634
- Shelter Island2,125
- Shelter Island Heights1,230
- Shenorock1,558
- Sherburne1,422
- Sherman590
- Sherrill3,028
- Shinnecock Hills2,545
- Shirley28,375
- Shokan1,196
- Shoreham537
- Shorehaven545
- Shortsville1,713
- Shrub Oak2,498
- Sidney3,931
- Siena College2,500
- Silver Creek2,604
- Silver Springs558
- Sinclairville557
- Skaneateles2,543
- Slaterville Springs130
- Sleepy Hollow10,887
- Sleepy Hollow Lake1,354
- Sloan3,751
- Sloatsburg3,038
- Smallwood693
- Smithtown24,375
- Smithville Flats366
- Smyrna148
- Sodus1,820
- Sodus Point1,051
- Solvay6,544
- Sound Beach7,210
- South Blooming Grove3,866
- South Cairo619
- South Corning1,132
- South Dayton543
- South Edmeston107
- South Fallsburg1,914
- South Farmingdale14,676
- South Floral Park1,706
- South Glens Falls3,737
- South Hempstead3,108
- South Hill6,951
- South Huntington9,779
- South Ilion195
- South Lansing1,496
- South Lima153
- South Lockport9,144
- South Valley Stream6,512
- Southampton4,621
- Southold6,397
- Southport6,450
- Spackenkill4,279
- Sparkill1,483
- Sparrow Bush1,119
- Speculator409
- Spencer932
- Spencerport3,630
- Spring Valley33,192
- Springfield Center244
- Springs9,163
- Springville4,190
- Springwater584
- St. Bonaventure1,976
- St. James13,244
- St. John Fisher College1,361
- St. Johnsville1,790
- St. Regis Falls316
- Staatsburg358
- Stamford1,053
- Stannards642
- Star Lake713
- Stewart Manor1,797
- Stillwater1,874
- Stittville155
- Stone Ridge1,884
- Stony Brook12,868
- Stony Brook University9,530
- Stony Point12,728
- Stottville1,045
- Strykersville665
- Suffern11,441
- Sunset Bay384
- SUNY Oswego3,564
- Swan Lake161
- Sylvan Beach881
- Syosset18,433
- Syracuse146,384
- Taconic Shores606
- Tannersville759
- Tappan6,687
- Tarrytown11,784
- Terryville10,794
- Thendara64
- Theresa945
- Thiells4,475
- Thomaston2,744
- Thornwood4,140
- Thousand Island Park222
- Three Mile Bay44
- Ticonderoga3,260
- Tillson1,530
- Tioga Terrace2,057
- Titusville667
- Tivoli945
- Tonawanda15,030
- Tonawanda Town56,806
- Town Line2,229
- Tribes Hill959
- Troy51,033
- Trumansburg1,665
- Tuckahoe CDP1,249
- Tuckahoe village6,973
- Tully959
- Tupper Lake2,929
- Turin297
- Tuscarora98
- Tuxedo3,023
- Tuxedo Park740
- Unadilla1,419
- Unadilla Forks190
- Union Springs1,255
- Uniondale33,148
- Unionville695
- University at Buffalo7,020
- University Gardens4,110
- Upper Brookville2,004
- Upper Nyack1,991
- Upper Red Hook311
- Utica64,217
- Vails Gate3,052
- Valatie1,796
- Valhalla2,937
- Valley Cottage9,165
- Valley Falls451
- Valley Stream40,315
- Van Etten587
- Varna687
- Vassar College3,529
- Vernon1,238
- Verona1,389
- Verplanck650
- Victor2,687
- Victory754
- Village Green3,687
- Village of the Branch1,903
- Viola8,461
- Virgil220
- Voorheesville2,824
- Waddington1,062
- Wading River8,359
- Wadsworth196
- Wainscott612
- Walden6,868
- Walker Valley1,301
- Wallkill1,355
- Walton2,423
- Walton Park3,915
- Walworth725
- Wampsville540
- Wanakah2,664
- Wantagh18,365
- Wappingers Falls5,761
- Warrensburg3,194
- Warsaw3,048
- Warwick6,585
- Washington Heights2,383
- Washington Mills2,112
- Washingtonville5,707
- Wassaic374
- Watchtower3,974
- Water Mill2,764
- Waterford2,085
- Waterloo4,605
- Watertown24,375
- Waterville1,731
- Watervliet10,287
- Watkins Glen1,725
- Waverly4,305
- Wayland2,007
- Webster5,718
- Websters Crossing99
- Weedsport1,954
- Wells581
- Wells Bridge160
- Wellsburg448
- Wellsville4,923
- Wesley Hills6,196
- West Babylon43,570
- West Bay Shore4,208
- West Carthage1,864
- West Chazy867
- West Danby75
- West Elmira4,750
- West End1,891
- West Glens Falls10,050
- West Hampton Dunes107
- West Haverstraw10,711
- West Hempstead20,648
- West Hills5,369
- West Hurley1,673
- West Islip26,865
- West Kill158
- West Nyack3,681
- West Point6,349
- West Sand Lake3,479
- West Sayville4,800
- West Seneca45,303
- West Valley489
- West Winfield837
- Westbury15,808
- Westernville195
- Westfield3,185
- Westford101
- Westhampton3,900
- Westhampton Beach2,574
- Westmere8,334
- Westmoreland61
- Weston Mills1,431
- Westport403
- Westvale5,212
- Wheatley Heights4,729
- White Lake (Oneida County)55
- White Lake (Sullivan County)65
- White Plains60,666
- Whitehall2,690
- Whitesboro3,633
- Whitney Point965
- Williamson2,387
- Williamsville5,469
- Williston Park7,542
- Willsboro661
- Willsboro Point646
- Wilmington904
- Wilson1,379
- Windham184
- Windsor1,128
- Wingdale1,234
- Winthrop530
- Witherbee202
- Wolcott1,444
- Woodbourne439
- Woodbury CDP9,348
- Woodbury village11,334
- Woodmere18,061
- Woodridge955
- Woodsburgh830
- Woodstock2,239
- Woodsville63
- Worcester1,032
- Wurtsboro1,243
- Wurtsboro Hills1,179
- Wynantskill3,487
- Wyoming414
- Yaphank6,934
- Yonkers209,978
- York349
- Yorkshire1,138
- Yorktown Heights1,966
- Yorkville2,613
- Youngstown1,758
- Zena997
Metro and micro areas
Each of the 27 that reach into New York, with its whole population, from ACS 2020–2024 5-year estimates. Metro and micro areas are counties tied together by commuting, drawn by the Office of Management and Budget.
- Albany-Schenectady-Troy, NY Metro Area906,052
- Amsterdam, NY Micro Area49,528
- Auburn, NY Micro Area75,102
- Batavia, NY Micro Area57,787
- Binghamton, NY Metro Area245,242
- Buffalo-Cheektowaga, NY Metro Area1.16M
- Corning, NY Micro Area92,588
- Cortland, NY Micro Area46,246
- Elmira, NY Metro Area82,147
- Glens Falls, NY Metro Area126,039
- Gloversville, NY Micro Area52,487
- Hudson, NY Micro Area61,100
- Ithaca, NY Metro Area104,537
- Jamestown-Dunkirk, NY Micro Area125,544
- Kingston, NY Metro Area182,601
- Kiryas Joel-Poughkeepsie-Newburgh, NY Metro Area704,836
- Massena-Ogdensburg, NY Micro Area107,226
- Monticello, NY Micro Area79,721
- New York-Newark-Jersey City, NY-NJ Metro Area19.8M
- Olean, NY Micro Area76,145
- Oneonta, NY Micro Area60,108
- Plattsburgh, NY Micro Area78,493
- Rochester, NY Metro Area1.06M
- Seneca Falls, NY Micro Area32,920
- Syracuse, NY Metro Area656,410
- Utica-Rome, NY Metro Area288,881
- Watertown-Fort Drum, NY Metro Area115,040
ZIP codes
Each of the 1,777 with people in it, by the town it's centered in, from ACS 2020–2024 5-year estimates. These are the Census Bureau's ZIP Code Tabulation Areas, which follow the Postal Service's ZIP codes as closely as census blocks allow.
- 10001New York30,511
- 10002New York76,873
- 10003New York53,560
- 10004New York3,711
- 10005New York9,439
- 10006New York4,096
- 10007New York7,406
- 10009New York60,209
- 10010New York30,702
- 10011New York48,277
- 10012New York21,426
- 10013New York27,219
- 10014New York29,230
- 10016New York52,971
- 10017New York15,297
- 10018New York8,559
- 10019New York44,942
- 10021New York39,868
- 10022New York34,049
- 10023New York69,455
- 10024New York63,115
- 10025New York93,065
- 10026New York37,123
- 10027New York63,885
- 10028New York49,077
- 10029New York77,447
- 10030New York29,297
- 10031New York61,058
- 10032New York55,610
- 10033New York54,838
- 10034New York37,758
- 10035New York38,862
- 10036New York31,036
- 10037New York19,031
- 10038New York22,235
- 10039New York32,492
- 10040New York40,096
- 10044New York11,520
- 10065New York30,808
- 10069New York6,509
- 10075New York21,897
- 10128New York57,976
- 10152New York7
- 10162New York1,603
- 10279New York259
- 10280New York8,933
- 10282New York5,887
- 10301New York41,052
- 10302New York19,030
- 10303New York26,497
- 10304New York45,658
- 10305New York41,270
- 10306New York57,428
- 10307New York15,512
- 10308New York30,568
- 10309New York34,885
- 10310New York25,672
- 10312New York63,469
- 10314New York93,915
- 10451New York50,942
- 10452New York75,682
- 10453New York76,282
- 10454New York39,570
- 10455New York44,801
- 10456New York87,533
- 10457New York79,543
- 10458New York74,898
- 10459New York48,270
- 10460New York59,396
- 10461New York52,012
- 10462New York76,320
- 10463New York69,470
- 10464New York3,828
- 10465New York45,404
- 10466New York71,116
- 10467New York96,421
- 10468New York75,557
- 10469New York68,521
- 10470New York16,004
- 10471New York23,798
- 10472New York64,011
- 10473New York58,855
- 10474New York11,270
- 10475New York42,578
- 10501Shenorock1,727
- 10502Ardsley6,197
- 10503Irvington132
- 10504Armonk7,665
- 10505Shenorock1,119
- 10506Bedford6,244
- 10507Bedford Hills6,109
- 10509Brewster Hill20,046
- 10510Briarcliff Manor10,226
- 10511Buchanan2,397
- 10512Lake Carmel24,234
- 10514Chappaqua11,790
- 10516Nelsonville5,362
- 10517Crompond584
- 10518Golden's Bridge992
- 10519Heritage Hills99
- 10520Croton-on-Hudson12,368
- 10522Dobbs Ferry11,502
- 10523Elmsford9,450
- 10524Highland Falls4,578
- 10526Golden's Bridge2,128
- 10527Jefferson Valley-Yorktown418
- 10528Harrison14,091
- 10530Hartsdale13,892
- 10532Hawthorne5,347
- 10533Irvington7,362
- 10535Jefferson Valley-Yorktown392
- 10536Katonah10,669
- 10537Lake Mohegan2,439
- 10538Larchmont17,760
- 10540Lincolndale108
- 10541Mahopac26,361
- 10543Mamaroneck20,989
- 10545Ossining185
- 10546Millwood1,392
- 10547Lake Mohegan7,205
- 10548Montrose4,254
- 10549Mount Kisco16,135
- 10550Mount Vernon38,972
- 10552Mount Vernon22,341
- 10553Mount Vernon11,011
- 10560Peach Lake4,918
- 10562Millwood33,793
- 10566Peekskill25,625
- 10567Peekskill19,976
- 10570Pleasantville13,289
- 10573Port Chester40,786
- 10576Scotts Corners4,891
- 10577Harrison5,945
- 10578Golden's Bridge1,780
- 10579Shrub Oak9,019
- 10580Rye18,391
- 10583Scarsdale40,207
- 10588Shrub Oak2,783
- 10589Heritage Hills7,604
- 10590Scotts Corners6,989
- 10591Tarrytown23,926
- 10594Thornwood5,110
- 10595Valhalla7,243
- 10596Verplanck650
- 10597Golden's Bridge679
- 10598Yorktown Heights28,821
- 10601White Plains11,930
- 10603Fairview18,910
- 10604Harrison12,517
- 10605White Plains19,493
- 10606White Plains17,341
- 10607Fairview6,466
- 10701Yonkers70,676
- 10703Yonkers22,586
- 10704Yonkers31,921
- 10705Yonkers38,887
- 10706Hastings-on-Hudson9,183
- 10707Yonkers9,688
- 10708Bronxville22,482
- 10709Eastchester10,352
- 10710Yonkers25,855
- 10801New Rochelle42,754
- 10803Pelham Manor13,072
- 10804New Rochelle16,108
- 10805New Rochelle20,903
- 10901Montebello27,095
- 10913Blauvelt5,343
- 10914Washingtonville1,205
- 10916Maybrook4,238
- 10917Woodbury village1,923
- 10918Chester12,069
- 10919Bloomingburg1,551
- 10920Congers8,451
- 10921Florida4,231
- 10922Fort Montgomery1,403
- 10923West Haverstraw9,069
- 10924Goshen13,720
- 10925Greenwood Lake4,313
- 10926Tuxedo3,416
- 10927Haverstraw12,325
- 10928West Point5,071
- 10930Woodbury village9,569
- 10931Hillburn1,319
- 10932Washington Heights13
- 10933Unionville117
- 10940Middletown53,611
- 10941Scotchtown14,422
- 10950Monroe68,136
- 10952Monsey48,019
- 10953Salisbury Mills22
- 10954Nanuet26,495
- 10956New City31,898
- 10958Middletown3,054
- 10960Nyack15,251
- 10962Orangeburg4,767
- 10963Otisville3,842
- 10964Sparkill1,333
- 10965Pearl River15,206
- 10968Piermont2,456
- 10969Unionville1,150
- 10970Pomona11,497
- 10973Middletown2,358
- 10974Sloatsburg3,382
- 10975Tuxedo246
- 10976Sparkill2,002
- 10977Spring Valley71,571
- 10979Greenwood Lake222
- 10980Stony Point13,414
- 10983Tappan5,934
- 10984Thiells2,805
- 10985Pine Bush17
- 10986Verplanck1,806
- 10987Tuxedo4,411
- 10988Unionville695
- 10989Valley Cottage9,187
- 10990Warwick20,368
- 10992Washingtonville9,843
- 10993West Haverstraw4,888
- 10994West Nyack6,370
- 10996West Point6,349
- 10998Unionville3,889
- 11001Floral Park25,493
- 11003Elmont45,174
- 11004New York13,615
- 11005New York2,174
- 11010Franklin Square25,604
- 11020Lake Success5,676
- 11021Great Neck Plaza19,783
- 11023Great Neck9,630
- 11024Kings Point9,155
- 11030Manhasset18,051
- 11040North New Hyde Park41,988
- 11042Lake Success141
- 11050Port Washington32,794
- 11096Inwood10,428
- 11101New York42,219
- 11102New York28,503
- 11103New York35,163
- 11104New York26,132
- 11105New York37,936
- 11106New York40,930
- 11109New York7,948
- 11201New York70,674
- 11203New York74,817
- 11204New York79,800
- 11205New York51,676
- 11206New York93,020
- 11207New York93,198
- 11208New York105,428
- 11209New York71,004
- 11210New York57,915
- 11211New York65,314
- 11212New York89,020
- 11213New York68,846
- 11214New York89,397
- 11215New York70,441
- 11216New York60,685
- 11217New York43,490
- 11218New York72,042
- 11219New York94,196
- 11220New York90,652
- 11221New York91,588
- 11222New York42,853
- 11223New York78,093
- 11224New York50,822
- 11225New York58,158
- 11226New York95,144
- 11228New York42,241
- 11229New York78,377
- 11230New York86,978
- 11231New York38,276
- 11232New York27,816
- 11233New York81,822
- 11234New York83,187
- 11235New York78,558
- 11236New York88,051
- 11237New York45,334
- 11238New York58,345
- 11239New York16,410
- 11249New York47,728
- 11354New York53,028
- 11355New York80,801
- 11356New York25,824
- 11357New York43,346
- 11358New York37,665
- 11360New York19,469
- 11361New York30,127
- 11362New York18,492
- 11363New York7,223
- 11364New York35,276
- 11365New York42,322
- 11366New York13,463
- 11367New York40,923
- 11368New York105,716
- 11369New York35,133
- 11370New York30,267
- 11372New York64,756
- 11373New York98,403
- 11374New York46,989
- 11375New York76,839
- 11377New York81,690
- 11378New York36,392
- 11379New York36,773
- 11385New York101,704
- 11411New York20,540
- 11412New York39,828
- 11413New York45,965
- 11414New York31,308
- 11415New York21,154
- 11416New York25,919
- 11417New York30,578
- 11418New York35,481
- 11419New York47,441
- 11420New York49,415
- 11421New York40,612
- 11422New York33,757
- 11423New York28,534
- 11426New York19,411
- 11427New York24,607
- 11428New York19,028
- 11429New York26,832
- 11430New York588
- 11432New York62,892
- 11433New York37,884
- 11434New York68,263
- 11435New York56,826
- 11436New York22,527
- 11439New York2,170
- 11501Mineola21,641
- 11507Searingtown6,736
- 11509Atlantic Beach1,790
- 11510Baldwin35,701
- 11514Carle Place4,544
- 11516Cedarhurst9,112
- 11518East Rockaway10,149
- 11520Freeport44,910
- 11530Garden City27,939
- 11542Glen Cove28,965
- 11545Old Brookville12,172
- 11547Glenwood Landing706
- 11548Brookville2,261
- 11549Uniondale2,359
- 11550Hempstead60,960
- 11552West Hempstead25,174
- 11553Uniondale27,875
- 11554East Meadow36,821
- 11557Hewlett Bay Park8,504
- 11558Barnum Island8,454
- 11559Lawrence8,878
- 11560Locust Valley7,696
- 11561Long Beach38,708
- 11563Lynbrook22,899
- 11565Malverne9,009
- 11566Merrick34,741
- 11568Old Westbury4,144
- 11569Point Lookout945
- 11570Rockville Centre28,908
- 11572Oceanside30,436
- 11575Roosevelt18,705
- 11576Roslyn12,281
- 11577Roslyn Heights13,077
- 11579Sea Cliff5,033
- 11580Valley Stream43,092
- 11581South Valley Stream22,818
- 11590New Cassel47,599
- 11596Williston Park10,516
- 11598Woodmere13,599
- 11691New York69,359
- 11692New York22,734
- 11693New York13,244
- 11694New York21,489
- 11697New York4,429
- 11701Amityville29,509
- 11702Gilgo13,909
- 11703North Babylon17,187
- 11704West Babylon40,706
- 11705Bayport8,284
- 11706Bay Shore68,976
- 11709Bayville6,744
- 11710Bellmore34,834
- 11713North Bellport9,218
- 11714Bethpage22,695
- 11715Blue Point3,936
- 11716Bohemia9,659
- 11718Brightwaters3,179
- 11719Brookhaven3,235
- 11720Centereach29,292
- 11721Centerport6,426
- 11722Central Islip39,033
- 11724Cold Spring Harbor3,073
- 11725Commack29,073
- 11726Copiague21,455
- 11727Coram28,495
- 11729Deer Park27,231
- 11730East Islip14,247
- 11731Commack29,999
- 11732East Norwich3,228
- 11733Setauket17,752
- 11735East Farmingdale32,028
- 11738Farmingville18,877
- 11739Great River1,225
- 11740Greenlawn10,127
- 11741Holbrook26,667
- 11742Holtsville13,202
- 11743Halesite43,490
- 11746Dix Hills65,747
- 11747Melville20,513
- 11749Islandia3,600
- 11751Islip13,726
- 11752North Great River9,204
- 11753Jericho12,435
- 11754Kings Park17,565
- 11755Lake Grove12,144
- 11756Levittown42,665
- 11757Lindenhurst44,413
- 11758Massapequa54,375
- 11762Massapequa Park22,487
- 11763Medford29,973
- 11764Miller Place12,551
- 11765Mill Neck683
- 11766Mount Sinai10,750
- 11767Nesconset14,964
- 11768Fort Salonga22,030
- 11769Oakdale8,935
- 11770Fire Island77
- 11771Oyster Bay10,908
- 11772East Patchogue45,023
- 11776Terryville22,808
- 11777Belle Terre9,396
- 11778Rocky Point12,390
- 11779Lake Ronkonkoma38,206
- 11780Nissequogue15,018
- 11782Sayville14,405
- 11783Seaford21,127
- 11784Selden26,244
- 11786East Shoreham6,459
- 11787Smithtown34,499
- 11788Hauppauge17,374
- 11789Sound Beach7,369
- 11790Stony Brook21,074
- 11791Syosset25,520
- 11792Wading River8,904
- 11793Wantagh32,349
- 11794Stony Brook University831
- 11795West Islip25,379
- 11796West Sayville3,560
- 11797Woodbury CDP9,402
- 11801Hicksville41,585
- 11803Plainview29,713
- 11804Old Bethpage4,835
- 11901Riverhead33,091
- 11930Amagansett842
- 11931Aquebogue27
- 11932Bridgehampton725
- 11933Calverton6,693
- 11934Center Moriches9,418
- 11935Cutchogue2,863
- 11937Northwest Harbor21,882
- 11939East Marion1,331
- 11940East Moriches5,819
- 11941Eastport2,814
- 11942East Quogue5,406
- 11944Greenport5,037
- 11946Hampton Bays15,819
- 11947Jamesport148
- 11948Laurel924
- 11949Manorville14,563
- 11950Mastic17,599
- 11951Mastic Beach15,938
- 11952Mattituck5,040
- 11953Middle Island12,846
- 11954Montauk4,223
- 11955Moriches2,458
- 11956New Suffolk298
- 11957Fishers Island1,121
- 11958Peconic884
- 11959Quogue734
- 11960Remsenburg-Speonk830
- 11961Ridge12,315
- 11962Sagaponack712
- 11963Noyack8,390
- 11964Shelter Island2,906
- 11965Shelter Island Heights404
- 11967Shirley27,975
- 11968Tuckahoe CDP15,312
- 11970Jamesport416
- 11971Southold6,361
- 11972Remsenburg-Speonk334
- 11973Ridge48
- 11975Wainscott450
- 11976Water Mill2,952
- 11977Westhampton2,843
- 11978Quiogue4,705
- 11980Yaphank5,855
- 12007Ravena331
- 12008East Glenville422
- 12009Altamont7,934
- 12010Amsterdam27,750
- 12015Sleepy Hollow Lake3,852
- 12017Chatham471
- 12018Averill Park7,422
- 12019Country Knolls15,555
- 12020Ballston Spa34,937
- 120221,120
- 12023Middleburgh1,791
- 12024East Nassau78
- 12025Broadalbin5,244
- 12027East Glenville4,693
- 12028Hoosick Falls1,557
- 120291,069
- 12031Cobleskill120
- 12032662
- 12033Castleton-on-Hudson7,932
- 12035Central Bridge566
- 12036Jefferson223
- 12037Chatham3,926
- 1204027
- 12041Voorheesville468
- 12042Coxsackie280
- 12043Cobleskill8,287
- 12045Ravena207
- 12046Ravena358
- 12047Cohoes23,532
- 12051Coxsackie5,876
- 12052Poestenkill1,915
- 12053Delanson4,550
- 12054Voorheesville17,436
- 12056Duane Lake1,695
- 12057Cambridge1,789
- 12058Cairo1,220
- 12059Altamont1,530
- 12060Chatham1,859
- 12061East Greenbush9,854
- 12062East Nassau1,650
- 12063Nassau Lake665
- 12064East Worcester342
- 12065Clifton Gardens45,116
- 12066Esperance1,863
- 12067Voorheesville1,165
- 12068Fonda2,503
- 12069Tribes Hill425
- 12070Fort Johnson2,011
- 12071Middleburgh283
- 12072Fultonville2,882
- 12074Galway2,848
- 12075Ghent3,248
- 12076Prattsville1,549
- 12077Hampton Manor7,017
- 12078Mayfield22,589
- 12082Poestenkill2
- 12083Greenville3,844
- 12084Westmere5,328
- 12085Altamont357
- 12086Hagaman1,587
- 12087New Baltimore1,584
- 12090Hoosick Falls5,482
- 12092Central Bridge1,208
- 12093Jefferson1,276
- 12094Valley Falls2,656
- 12095Johnstown12,391
- 12106Kinderhook1,864
- 12108Speculator350
- 12110Latham20,081
- 12115Niverville60
- 12116Portlandville1,787
- 12117Mayfield2,871
- 12118Mechanicville17,069
- 12120Preston-Potter Hollow600
- 12121Schaghticoke2,280
- 12122Middleburgh3,596
- 12123Nassau4,457
- 12124New Baltimore298
- 12125East Nassau1,141
- 12130Niverville233
- 12131North Blenheim183
- 12132Niverville111
- 12134Northville village3,846
- 12136Chatham1,043
- 12137Mariaville Lake2,077
- 121382,695
- 12139227
- 12140Poestenkill1,512
- 12143Ravena5,664
- 12144Hampton Manor22,111
- 12147Preston-Potter Hollow466
- 12148Niskayuna4,023
- 12149Richmondville2,038
- 12150Mariaville Lake710
- 12151Round Lake967
- 12153Averill Park669
- 12154Stillwater2,777
- 12155Schenevus1,685
- 12156New Baltimore808
- 12157Schoharie4,713
- 12158Castleton-on-Hudson5,878
- 12159Voorheesville8,163
- 12160Central Bridge716
- 12161Ravena99
- 12164Speculator539
- 12165Chatham220
- 12166Canajoharie1,635
- 12167Stamford2,279
- 12168East Nassau1,752
- 12169East Nassau417
- 12170Stillwater5,351
- 12172Stottville176
- 12173Kinderhook2,099
- 12174Kinderhook427
- 12175Richmondville612
- 12176Greenville393
- 12177Tribes Hill387
- 12180Troy53,479
- 12182Waterford14,867
- 12183Green Island2,970
- 12184Valatie7,787
- 12185Valley Falls1,709
- 12186Voorheesville6,512
- 12187Cobleskill752
- 12188Waterford10,988
- 12189Watervliet18,656
- 12190Wells671
- 12192Coxsackie1,077
- 12193Greenville1,746
- 12194North Blenheim162
- 12195East Nassau162
- 12196West Sand Lake3,880
- 12197Worcester2,298
- 12198Wynantskill6,796
- 12202Albany10,166
- 12203Westmere30,771
- 12204Menands7,812
- 12205Colonie25,838
- 12206Albany14,572
- 12207Albany1,988
- 12208Albany23,289
- 12209Albany10,626
- 12210Albany10,297
- 12211Loudonville14,383
- 12222Albany6,889
- 12302East Glenville28,031
- 12303Rotterdam29,360
- 12304Schenectady22,403
- 12305Schenectady7,356
- 12306Mariaville Lake27,865
- 12307Schenectady7,050
- 12308Schenectady15,511
- 12309Niskayuna33,246
- 12401Lake Katrine35,136
- 12404Accord3,935
- 12405East Durham447
- 12406Fleischmanns644
- 12407Prattsville215
- 12409Woodstock865
- 12410Pine Hill343
- 12411Hurley325
- 12412Shokan475
- 12413Cairo3,368
- 12414Leeds10,169
- 12416Phoenicia106
- 12417Port Ewen828
- 12418East Durham427
- 12419Rosendale1,081
- 12420Cragsmoor381
- 12421Fleischmanns261
- 12422Preston-Potter Hollow399
- 12423East Durham970
- 12424Haines Falls239
- 12427Tannersville935
- 12428Mountain Dale6,995
- 12429Staatsburg185
- 12430Fleischmanns1,253
- 12431East Durham1,909
- 12432Glasco697
- 12433West Hurley470
- 12434Prattsville944
- 12435Mountain Dale209
- 12436Haines Falls607
- 12438Fleischmanns190
- 12439Windham384
- 12440Accord1,826
- 12441Fleischmanns106
- 12442Hunter537
- 12443Hurley3,559
- 12444Hunter576
- 12446Kerhonkson5,414
- 12448Woodstock207
- 12449Lake Katrine3,010
- 12450Hunter215
- 12451South Cairo909
- 12452West Kill33
- 12453Malden-on-Hudson241
- 12454Windham266
- 12455Margaretville1,689
- 12456Ruby390
- 12457Shokan1,041
- 12458Napanoch3,074
- 12459Andes30
- 12460Preston-Potter Hollow152
- 12461Shokan1,604
- 12463Palenville1,373
- 12464Phoenicia1,033
- 12465Pine Hill255
- 12466Port Ewen1,981
- 12468Prattsville1,329
- 12469Preston-Potter Hollow798
- 12470Round Top618
- 12471Rifton237
- 12472Rosendale1,146
- 12473Round Top831
- 12474Hobart857
- 12475Ruby557
- 12477Malden-on-Hudson19,066
- 12480Pine Hill510
- 12481Shokan1,247
- 12482South Cairo619
- 12483Cragsmoor45
- 12484Stone Ridge3,155
- 12485Tannersville1,021
- 12486Tillson1,440
- 12487Port Ewen4,035
- 12489Napanoch93
- 12491West Hurley1,981
- 12492West Kill298
- 12493Hyde Park526
- 12494Shokan934
- 12495Phoenicia277
- 12496Windham1,164
- 12498Woodstock4,572
- 12501Amenia2,476
- 12502Copake Lake984
- 12503Copake732
- 12504Bard College961
- 12507Barrytown227
- 12508Beacon19,566
- 12512New Hamburg194
- 12513Claverack-Red Mills228
- 12514Salt Point3,107
- 12515Clintondale1,492
- 12516Copake1,925
- 12517Copake Falls187
- 12518Firthcliffe6,114
- 12520Cornwall-on-Hudson3,081
- 12521Copake Lake2,056
- 12522Dover Plains4,959
- 12523Upper Red Hook1,908
- 12524Fishkill15,026
- 12525Gardiner2,749
- 12526Germantown3,548
- 12527Beacon40
- 12528Highland13,827
- 12529Copake Lake2,410
- 12530Claverack-Red Mills270
- 12531Shorehaven2,337
- 12533Hopewell Junction27,325
- 12534Claverack-Red Mills17,176
- 12538Haviland14,391
- 12540Freedom Plains8,856
- 12542Marlboro5,612
- 12543Maybrook3,190
- 12544Philmont127
- 12545Millbrook4,338
- 12546Millerton2,706
- 12547Milton3,144
- 12548Gardiner1,064
- 12549Montgomery10,745
- 12550Gardnertown55,152
- 12553Vails Gate27,384
- 12561New Paltz19,830
- 12563Putnam Lake7,304
- 12564Pawling7,734
- 12565Philmont1,439
- 12566Pine Bush10,269
- 12567Pine Plains2,695
- 12569Pleasant Valley9,837
- 12570Chelsea Cove6,698
- 12571Upper Red Hook10,108
- 12572Rhinebeck8,869
- 12574Rhinecliff619
- 12575Maybrook1,600
- 12577Salisbury Mills1,942
- 12578Salt Point2,249
- 12580Staatsburg4,542
- 12581Pine Plains1,914
- 12582Shorehaven5,786
- 12583Tivoli1,994
- 12585Millbrook1,144
- 12586Walden12,971
- 12589Wallkill18,646
- 12590Myers Corner35,712
- 12592Wassaic1,226
- 12594Wingdale4,222
- 12601Poughkeepsie44,164
- 12603Titusville42,304
- 12604Vassar College2,316
- 12701Monticello12,197
- 12719Barryville1,339
- 12720White Lake447
- 12721Bloomingburg7,359
- 12723Hortonville1,923
- 12724Jeffersonville60
- 12725Grahamsville403
- 12726Lake Huntington1,168
- 12729Otisville1,203
- 12732Eldred776
- 12733Fallsburg1,865
- 12734Swan Lake950
- 12736Hankins145
- 12737Eldred1,513
- 12738Bridgeville423
- 12740Grahamsville1,732
- 12741Hankins222
- 12742Hurleyville253
- 12743Eldred279
- 12745Hortonville20
- 12746Sparrow Bush778
- 12747Fallsburg2,234
- 12748Jeffersonville1,518
- 12749Kauneonga Lake419
- 12750Hortonville33
- 12751Kiamesha Lake1,407
- 12752Lake Huntington309
- 12754Liberty8,296
- 12758Livingston Manor4,025
- 12759Loch Sheldrake1,619
- 12760Hankins367
- 12762Mongaup Valley394
- 12763Mountain Dale890
- 12764Narrowsburg1,861
- 12765Grahamsville873
- 12766Jeffersonville535
- 12767Hankins156
- 12768Liberty857
- 12769Mountain Dale325
- 12770Barryville145
- 12771Port Jervis14,049
- 12775Rock Hill2,623
- 12776Roscoe2,073
- 12777Monticello695
- 12778Smallwood707
- 12779South Fallsburg2,205
- 12780Sparrow Bush2,346
- 12781Wurtsboro Hills177
- 12783Kauneonga Lake1,060
- 12785Rock Hill917
- 12786Smallwood610
- 12787Swan Lake192
- 12788Woodbourne3,037
- 12789Woodridge2,594
- 12790Wurtsboro4,537
- 12791Jeffersonville763
- 12792Barryville163
- 12801Glens Falls14,628
- 12803South Glens Falls9,712
- 12804Glens Falls North28,208
- 12808Pottersville284
- 12809Argyle3,669
- 12810471
- 12811181
- 12812Long Lake265
- 12814Bolton Landing1,168
- 12815Chestertown1,140
- 12816Cambridge4,824
- 12817Chestertown2,168
- 12819Whitehall350
- 12820Lake George10
- 12821North Granville2,124
- 12822Corinth6,284
- 12823Salem597
- 12824Warrensburg1,143
- 12827Fort Ann3,716
- 12828Fort Edward9,230
- 12831South Glens Falls18,025
- 12832Granville6,153
- 12833Saratoga Springs5,316
- 12834Greenwich6,039
- 12835Hadley2,708
- 12836498
- 12837Granville1,021
- 12838Fort Ann734
- 12839Hudson Falls13,541
- 12841Whitehall74
- 12842Speculator995
- 12843North Creek461
- 12844Lake George172
- 12845Lake George4,370
- 12846Lake Luzerne3,013
- 12847740
- 12849Granville371
- 12850Galway2,537
- 12851275
- 12852490
- 12853North Creek1,235
- 12854North Granville86
- 12855208
- 12856North Creek260
- 12857606
- 12858Schroon Lake118
- 12859Corinth1,622
- 12860Pottersville419
- 12861Ticonderoga501
- 12862North Creek127
- 12863Milton910
- 128648
- 12865Salem3,356
- 12866Saratoga Springs40,057
- 12870Schroon Lake1,756
- 12871Victory3,813
- 12872Schroon Lake22
- 12873Salem886
- 12874205
- 12878819
- 12883Ticonderoga4,744
- 12884Victory538
- 12885Warrensburg4,444
- 12886North Creek215
- 12887Whitehall4,691
- 12901Plattsburgh31,447
- 12903Parc1,824
- 12910Altona1,890
- 12911Keeseville41
- 12912Au Sable Forks1,682
- 12913989
- 12914Akwesasne711
- 12915Chateaugay55
- 12916Brushton2,143
- 12917Burke1,221
- 12918Cadyville2,412
- 12919Champlain2,961
- 12920Chateaugay2,624
- 12921Chazy2,304
- 1292244
- 12923Chateaugay532
- 12924Au Sable Forks333
- 12926Malone2,371
- 12927Cranberry Lake318
- 12928Port Henry1,984
- 12929Dannemora2,684
- 12930St. Regis Falls897
- 12932Elizabethtown1,278
- 12933Altona7
- 12934Lyon Mountain1,120
- 12935Altona1,180
- 12936Willsboro691
- 12937Fort Covington1,300
- 12939Paul Smiths173
- 12941Wilmington1,487
- 12942Wilmington450
- 12943260
- 12944Keeseville3,910
- 12945Saranac Lake391
- 12946Lake Placid4,872
- 12950Elizabethtown628
- 12952Lyon Mountain286
- 12953Malone12,893
- 12955Lyon Mountain503
- 12956Mineville1,271
- 12957Brushton1,781
- 12958Mooers1,827
- 12959Altona1,627
- 12960Witherbee1,143
- 12961Witherbee22
- 12962Morrisonville5,654
- 12964Witherbee73
- 12965Parishville363
- 12966Brushton2,656
- 12967Brasher Falls1,263
- 12969279
- 12970Paul Smiths1,084
- 12972Peru6,895
- 12973Tupper Lake154
- 12974Port Henry1,617
- 12975Keeseville78
- 12976Paul Smiths137
- 12977Saranac Lake1,213
- 12978Redford340
- 12979Rouses Point2,465
- 12980St. Regis Falls1,075
- 12981Redford2,259
- 12983Saranac Lake7,296
- 12985Redford755
- 12986Tupper Lake5,326
- 12987Wilmington119
- 129891,110
- 12992West Chazy4,615
- 12993Westport1,926
- 12996Willsboro1,903
- 12997Wilmington1,251
- 12998Witherbee399
- 13020Tully86
- 13021Auburn37,247
- 13024Auburn1,230
- 13026Aurora1,619
- 13027Baldwinsville35,088
- 13028Constantia1,162
- 13029Brewerton7,725
- 13030Bridgeport3,635
- 13031Camillus16,285
- 13032Canastota12,850
- 13033Cato3,732
- 13034Cayuga2,029
- 13035Cazenovia8,428
- 13036Central Square8,616
- 13037Chittenango9,607
- 13039North Syracuse16,951
- 13040McGraw2,595
- 13041Brewerton12,330
- 13042Cleveland1,960
- 13044Constantia2,643
- 13045Munsons Corners28,361
- 13051Cazenovia47
- 13052DeRuyter1,759
- 13053Dryden4,794
- 13054Durhamville1,334
- 13057Minoa14,253
- 13060Elbridge2,725
- 13061Morrisville668
- 13062Freeville195
- 13063Fabius1,624
- 13065Romulus80
- 13066Fayetteville12,504
- 13068Freeville4,592
- 13069Fulton22,810
- 13071Moravia796
- 13072DeRuyter840
- 13073Groton6,054
- 13074Hannibal4,496
- 13076Parish2,778
- 13077Homer6,405
- 13078Nedrow10,119
- 13080Jordan3,313
- 13081Interlaken1,122
- 13082Minoa4,314
- 13083Lacona1,835
- 13084Tully4,159
- 13087Homer116
- 13088Liverpool22,073
- 13090Liverpool29,004
- 13092Moravia2,689
- 13101McGraw2,358
- 13102McLean36
- 13103Central Square224
- 13104Manlius16,168
- 13108Marcellus6,093
- 13110Marcellus2,494
- 13111Hannibal1,463
- 13112Jordan2,140
- 13113Meridian56
- 13114Mexico7,214
- 13115Minetto127
- 13116Minoa3,653
- 13117Port Byron132
- 13118Moravia5,591
- 13120Nedrow1,625
- 13122DeRuyter1,257
- 13123North Bay90
- 13124DeRuyter88
- 13126Minetto36,495
- 13131Parish2,880
- 13132Sand Ridge3,626
- 13134Munnsville113
- 13135Phoenix6,515
- 13136406
- 13138Fabius157
- 13140Port Byron3,959
- 13141Tully652
- 13142Pulaski6,365
- 13143Red Creek2,504
- 13144Altmar1,219
- 13145Sandy Creek2,028
- 13146Savannah2,085
- 13147Aurora1,236
- 13148Seneca Falls10,749
- 13152Skaneateles7,681
- 13153Elbridge403
- 13154Savannah65
- 13155DeRuyter669
- 13156Fair Haven2,156
- 13157Sylvan Beach529
- 13158DeRuyter1,217
- 13159Tully5,204
- 13160Union Springs2,444
- 13162Sylvan Beach193
- 13163Wampsville286
- 13164Seneca Knolls2,904
- 13165Waterloo9,458
- 13166Weedsport5,622
- 13167Central Square3,215
- 13202Syracuse7,098
- 13203Syracuse16,180
- 13204Syracuse19,440
- 13205Syracuse19,137
- 13206Syracuse16,245
- 13207Syracuse12,290
- 13208Syracuse22,993
- 13209Lakeland12,714
- 13210Syracuse19,803
- 13211Mattydale6,111
- 13212North Syracuse19,917
- 13214DeWitt8,702
- 13215Westvale14,751
- 13219Westvale14,744
- 13224Syracuse8,659
- 13244Syracuse9,683
- 13301Remsen69
- 13302Altmar1,289
- 13303Lake Delta1,410
- 13304Barneveld1,653
- 13305Croghan403
- 13308Sylvan Beach3,862
- 13309Boonville5,825
- 13310Madison654
- 13312Otter Lake228
- 13313Bridgewater586
- 13314Unadilla Forks118
- 13315Burlington Flats1,237
- 13316Camden6,063
- 13317Ames3,888
- 13318Bridgewater896
- 13319Chadwicks344
- 13320Cherry Valley1,971
- 13321Clark Mills678
- 13322Clayville1,172
- 13323Clinton11,078
- 13324Cold Brook1,729
- 13325Constableville918
- 13326Cooperstown4,586
- 13327Croghan2,009
- 13328Oriskany Falls1,311
- 13329Dolgeville3,256
- 13331Thendara204
- 13332Earlville2,577
- 13333Springfield Center46
- 13334Morrisville1,067
- 13335Edmeston1,511
- 13337Schuyler Lake607
- 13338Otter Lake1,280
- 13339Fort Plain6,010
- 13340Frankfort7,404
- 13342Garrattsville255
- 13343Lowville1,606
- 13345Lyons Falls217
- 13346Hamilton6,406
- 13348Hartwick1,409
- 13350Herkimer9,522
- 13352Prospect25
- 1335363
- 13354Holland Patent3,554
- 13355Hamilton780
- 13357South Ilion10,167
- 13360Eagle Bay227
- 13361Springfield Center725
- 13363Lake Delta1,981
- 13364Unadilla Forks333
- 13365Dolgeville8,578
- 13367Lowville8,601
- 13368Lyons Falls1,129
- 13402Madison1,133
- 13403Marcy7,388
- 13404Lowville159
- 13406Middleville486
- 13407Mohawk5,042
- 13408Morrisville3,391
- 13409Munnsville2,144
- 13410Nelliston508
- 13411New Berlin2,999
- 13413New Hartford16,742
- 13415Garrattsville73
- 13416Newport2,369
- 13417New York Mills3,880
- 13418Waterville97
- 13420Thendara1,055
- 13421Oneida12,771
- 13424Oriskany2,306
- 13425Oriskany Falls2,010
- 13428Palatine Bridge1,689
- 13431Poland1,847
- 13433Port Leyden1,686
- 13435Prospect218
- 13436Eagle Bay135
- 13437254
- 13438Remsen3,065
- 13439Richfield Springs3,681
- 13440Rome41,555
- 13441Rome68
- 13450Westford143
- 13452St. Johnsville4,792
- 13454Salisbury Center735
- 13455Waterville74
- 13456Clayville3,848
- 13457Schuyler Lake26
- 13459Sharon Springs1,888
- 13460Sherburne4,182
- 13461Sherrill3,047
- 13464Smyrna1,207
- 13468Springfield Center256
- 13469Stittville855
- 13470Salisbury Center877
- 13471Camden2,806
- 13472Thendara259
- 13473Turin982
- 13475Springfield Center44
- 13476Vernon2,572
- 13477Vernon1,498
- 13478Verona3,078
- 13480Waterville3,321
- 13482Garrattsville108
- 13483Camden377
- 13484Morrisville100
- 13485Unadilla Forks1,779
- 13486Westernville646
- 13488Westford103
- 13489Constableville576
- 13490Westmoreland1,031
- 13491West Winfield3,431
- 13492Whitesboro11,250
- 13493Altmar2,428
- 13494White Lake346
- 13495Yorkville1,841
- 13501Utica38,931
- 13502Utica34,037
- 13601Watertown36,839
- 13602Fort Drum2,440
- 13603Fort Drum14,136
- 13605Adams5,259
- 13606Adams Center2,468
- 13607Alexandria Bay2,020
- 13608Oxbow1,676
- 13611Belleville147
- 13612Felts Mills2,865
- 13613Brasher Falls2,931
- 13614Morristown214
- 13615Brownville700
- 13616Calcium1,430
- 13617Canton12,431
- 13618Cape Vincent1,771
- 13619Carthage10,578
- 13620Croghan2,298
- 13621Norfolk589
- 13622Chaumont1,859
- 13623Hammond68
- 13624Clayton4,650
- 13625Colton1,792
- 13626Copenhagen2,202
- 13628Deferiet330
- 13630DeKalb Junction1,184
- 13632Depauville118
- 13633Richville389
- 13634Dexter3,570
- 13635Edwards1,279
- 13636Ellisburg141
- 13637Evans Mills5,212
- 13638Felts Mills157
- 13639Edwards23
- 13640Alexandria Bay318
- 13641Fishers Landing91
- 13642Gouverneur9,043
- 13643Great Bend193
- 13646Hammond2,546
- 13647Hannawa Falls26
- 136482,236
- 13649Akwesasne56
- 13650Henderson1,236
- 13651Henderson147
- 13652Hermon2,067
- 13654Heuvelton2,073
- 13655Akwesasne3,694
- 13656La Fargeville2,942
- 13658Madrid2,189
- 13659Lorraine386
- 13660Madrid1,774
- 13661Mannsville1,908
- 13662Massena15,556
- 13664Morristown384
- 13665Natural Bridge465
- 13666Cranberry Lake234
- 13667Norfolk3,476
- 13668Norwood3,563
- 13669Ogdensburg15,542
- 13670Star Lake378
- 13672449
- 13673Philadelphia2,097
- 13674Pierrepont Manor178
- 13675Plessis54
- 13676Potsdam12,874
- 13678Norfolk20
- 13679Redwood1,205
- 13680Rensselaer Falls1,186
- 13681Richville738
- 13682Rodman854
- 13683Akwesasne41
- 136841,149
- 13685Sackets Harbor2,362
- 13687483
- 13690Star Lake748
- 13691Theresa2,990
- 13692Thousand Island Park222
- 13693Three Mile Bay423
- 13694Waddington1,442
- 13695Cranberry Lake157
- 13696Potsdam181
- 13697Winthrop1,898
- 13699Potsdam2,194
- 13730Afton2,679
- 13731Andes1,038
- 13732Apalachin7,385
- 13733Bainbridge5,076
- 13734Nichols2,269
- 13736Newark Valley1,936
- 13738Blodgett Mills20
- 13739Bloomville833
- 13740Bloomville626
- 13743Candor3,077
- 13744Glen Aubrey1,125
- 13746Chenango Bridge2,535
- 13748Binghamton3,738
- 13750Davenport Center896
- 13751Davenport Center297
- 13752Andes858
- 13753Delhi5,696
- 13754Deposit2,768
- 13755Downsville652
- 13756Downsville697
- 13757Davenport Center1,130
- 13760Endicott42,896
- 13774Hancock323
- 13775Franklin1,752
- 13776Gilbertsville380
- 13777Glen Aubrey656
- 13778Greene5,351
- 13780Guilford968
- 13782Downsville936
- 13783Hancock2,035
- 13784Virgil382
- 13786Stamford430
- 13787Afton2,432
- 13788Hobart997
- 13790Endwell18,739
- 13795Windsor3,681
- 13796Laurens1,210
- 13797Lisle2,119
- 13801Smithville Flats1,545
- 13802Glen Aubrey729
- 13803Marathon4,273
- 13804Sidney244
- 13806Davenport Center143
- 13807Milford1,218
- 13808Morris1,581
- 13809Guilford1,410
- 13810Mount Vision1,090
- 13811Newark Valley4,127
- 13812Nichols2,574
- 13813Afton997
- 13814Sherburne25
- 13815Norwich12,654
- 13820Oneonta23,056
- 13825Otego2,903
- 13826Windsor141
- 13827Owego11,832
- 13830Oxford4,597
- 13832Smyrna448
- 13833Chenango Bridge4,190
- 13834Portlandville92
- 13835Marathon1,184
- 13838Sidney4,251
- 13839Unadilla1,360
- 13841Smithville Flats385
- 13842Hobart582
- 13843New Berlin2,038
- 13844Smyrna555
- 13846Franklin308
- 13847Walton18
- 13849Unadilla4,427
- 13850Binghamton University23,689
- 13856Walton5,881
- 13859Wells Bridge56
- 13860Davenport Center257
- 13861West End462
- 13862Whitney Point3,440
- 13863Smithville Flats382
- 13864Candor1,099
- 13865Windsor5,610
- 13901Chenango Bridge19,613
- 13902Binghamton University7,449
- 13903Binghamton17,569
- 13904Chenango Bridge9,221
- 13905Johnson City27,988
- 14001Akron8,937
- 14004Alden11,396
- 14005Alexander1,772
- 14006Angola9,260
- 14008Barker1,423
- 14009Arcade5,748
- 14011Attica8,122
- 14012Barker2,911
- 14013Oakfield1,423
- 14020Batavia22,002
- 14024Bliss1,773
- 14025North Boston3,243
- 14026Harris Hill617
- 14027Angola142
- 14028Olcott1,257
- 14029Houghton20
- 14030Yorkshire2,067
- 14031Clarence9,885
- 14032Clarence Center10,222
- 14033North Boston1,539
- 14034Gowanda2,086
- 14035Gowanda152
- 14036Corfu5,782
- 14037Strykersville904
- 14039Wyoming117
- 14040Attica1,974
- 14041Perrysburg308
- 14042Delevan3,967
- 14043Depew25,098
- 14047Highland-on-the-Lake6,013
- 14048Dunkirk14,739
- 14051Clarence Center19,739
- 14052East Aurora17,514
- 14054Pavilion1,391
- 14055Springville1,418
- 14056Corfu162
- 14057Eden7,972
- 14058Elba2,370
- 14059Elma Center9,138
- 14060Rushford362
- 14061Farnham93
- 14062Forestville3,266
- 14063Fredonia12,575
- 14065Bliss1,597
- 14066Gainesville991
- 14067Gasport3,976
- 14068University at Buffalo8,636
- 14069Holland443
- 14070Gowanda5,001
- 14072Grandyle Village21,488
- 14075Hamburg44,520
- 14080Holland4,444
- 14081Farnham2,742
- 14082Strykersville485
- 14083Strykersville75
- 14085Wanakah8,531
- 14086Lancaster35,635
- 14091North Collins1,316
- 14092Lewiston10,247
- 14094Lockport50,153
- 14098Lyndonville2,707
- 14101Machias1,997
- 14102Town Line1,856
- 14103Medina10,810
- 14105Middleport5,313
- 14108Newfane5,713
- 14109Niagara University1,473
- 14111North Collins3,186
- 14113Bliss709
- 14120North Tonawanda44,241
- 14125Oakfield3,648
- 14126Olcott109
- 14127Orchard Park31,543
- 14129Perrysburg1,236
- 14130Pike70
- 14131Ransomville5,252
- 14132Sanborn6,453
- 14134Yorkshire32
- 14135Forestville90
- 14136Silver Creek5,450
- 14138South Dayton2,046
- 14139Strykersville2,113
- 14141Springville7,603
- 14143Le Roy1,216
- 14145Strykersville1,185
- 14150Tonawanda Town41,260
- 14166Fredonia173
- 14167Strykersville1,804
- 14168Perrysburg50
- 14169East Aurora77
- 14170East Aurora2,292
- 14171West Valley1,611
- 14172Wilson3,091
- 14173Yorkshire266
- 14174Youngstown5,669
- 14201Buffalo12,369
- 14202Buffalo3,862
- 14203Buffalo2,424
- 14204Buffalo7,932
- 14206Buffalo21,631
- 14207Buffalo26,327
- 14208Buffalo12,572
- 14209Buffalo8,313
- 14210Buffalo15,563
- 14211Buffalo24,663
- 14212Buffalo13,299
- 14213Buffalo24,107
- 14214Buffalo21,314
- 14215Buffalo42,524
- 14216Buffalo22,849
- 14217Kenmore22,471
- 14218Lackawanna20,312
- 14219Blasdell10,652
- 14220Buffalo24,428
- 14221Williamsville55,255
- 14222Buffalo15,311
- 14223Tonawanda Town22,611
- 14224West Seneca41,219
- 14225Cheektowaga33,620
- 14226Eggertsville29,159
- 14227Cheektowaga20,621
- 14228University at Buffalo25,350
- 14260University at Buffalo924
- 14261University at Buffalo5,033
- 14301Niagara Falls10,923
- 14302Niagara Falls189
- 14303Niagara Falls6,156
- 14304Niagara Falls29,208
- 14305Niagara University16,696
- 14411Albion12,429
- 14413Sodus Point71
- 14414Avon6,576
- 14415Hall77
- 14416Bergen3,960
- 14418Keuka Park1,149
- 14420Brockport20,375
- 14422Elba1,809
- 14423Caledonia4,947
- 14424Canandaigua28,786
- 14425Victor13,839
- 14427Castile1,720
- 14428Churchville8,127
- 14432Clifton Springs5,518
- 14433Clyde4,404
- 14435Conesus2,512
- 14437Woodsville8,984
- 14441Dresden308
- 14445East Rochester7,529
- 14450Fairport42,750
- 14454Geneseo11,127
- 14456Geneva19,756
- 14462Groveland Station877
- 14463Hall255
- 14464Hamlin6,755
- 14466Hemlock1,754
- 14467Rochester Institute of Technology10,168
- 14468Hilton18,526
- 14469Bloomfield6,008
- 14470Holley7,758
- 14471Honeoye2,727
- 14472Honeoye Falls9,039
- 14475Bloomfield215
- 14476Hamlin2,443
- 14477Albion1,706
- 14478Keuka Park1,391
- 14479Medina234
- 14480Lakeville520
- 14481Leicester1,640
- 14482Le Roy8,339
- 14485Lima4,153
- 14486Linwood444
- 14487Livonia Center5,492
- 14489Lyons6,897
- 14502Gananda10,831
- 14504Manchester1,631
- 14505Marion5,138
- 14506Victor923
- 14507Rushville1,292
- 14510Mount Morris4,754
- 14511Caledonia548
- 14512Naples4,852
- 14513Newark13,375
- 14514Churchville6,572
- 14515Greece215
- 14516North Rose2,185
- 14517Nunda2,388
- 14519Ontario12,642
- 14521Ovid2,594
- 14522Palmyra9,121
- 14525Pavilion2,608
- 14526East Rochester19,629
- 14527Penn Yan12,677
- 14529Wayland77
- 14530Perry5,553
- 14532Phelps4,165
- 14533Retsof1,538
- 14534Pittsford33,230
- 14536Pike659
- 14537Port Gibson210
- 14539Retsof102
- 14541Romulus3,713
- 14542North Rose32
- 14543Scottsville3,717
- 14544Rushville2,371
- 14545Scottsburg141
- 14546Scottsville4,450
- 14548Manchester3,821
- 14549Perry426
- 14550Silver Springs1,301
- 14551Sodus5,063
- 14555Sodus Point1,165
- 14556Kysorville913
- 14557Le Roy128
- 14559Spencerport17,200
- 14560Websters Crossing2,412
- 14561Gorham2,081
- 14564Victor16,364
- 14568Walworth5,547
- 14569Warsaw6,430
- 14571Lyndonville1,190
- 14572Wayland4,817
- 14580Webster54,180
- 14585Lima170
- 14586Rochester Institute of Technology13,291
- 14588Ovid240
- 14589Williamson7,967
- 14590Wolcott5,191
- 14591Wyoming1,495
- 14592York143
- 14604Rochester3,251
- 14605Rochester11,783
- 14606North Gates25,538
- 14607Rochester17,891
- 14608Rochester12,792
- 14609Irondequoit40,274
- 14610Brighton14,311
- 14611Rochester17,145
- 14612Greece35,152
- 14613Rochester15,047
- 14614Rochester1,158
- 14615Rochester17,884
- 14616Greece26,863
- 14617Irondequoit21,788
- 14618Brighton25,476
- 14619Rochester13,477
- 14620Rochester23,769
- 14621Rochester32,381
- 14622Irondequoit12,574
- 14623Rochester Institute of Technology26,032
- 14624Gates38,626
- 14625St. John Fisher College10,717
- 14626Greece29,273
- 14627Rochester3,159
- 14701Jamestown38,461
- 14706Allegany5,939
- 14707Richburg129
- 14708Bolivar148
- 14709Angelica1,201
- 14710Panama2,980
- 14711Belfast2,063
- 14712Bemus Point3,262
- 14714Cuba555
- 14715Richburg2,484
- 14716Brocton2,453
- 14717Belfast586
- 14718Cassadaga1,854
- 14719Cattaraugus3,448
- 14720Celoron924
- 14721Portville227
- 14722Chautauqua243
- 14723Cherry Creek1,187
- 14724Sherman3,115
- 14726Cherry Creek2,494
- 14727Cuba4,925
- 14728Mayville842
- 14729West Valley756
- 14731Ellicottville1,226
- 14732Kennedy48
- 14733Falconer3,367
- 14735Fillmore2,575
- 14736Sherman172
- 14737Franklinville4,376
- 14738Frewsburg3,578
- 14739Friendship2,731
- 14740Sinclairville1,269
- 14741Ellicottville1,805
- 14742Lakewood72
- 14743Cuba2,037
- 14744Houghton2,188
- 14747Kennedy2,005
- 14748Salamanca446
- 14750Lakewood4,508
- 14752Cassadaga62
- 14753Limestone1,060
- 14754Bolivar586
- 14755Little Valley2,919
- 14756Chautauqua26
- 14757Mayville3,114
- 14760Olean17,474
- 14767Panama2,061
- 14769Brocton757
- 14770Portville2,621
- 14772East Randolph4,394
- 14774Richburg324
- 14775Ripley2,328
- 14777Rushford454
- 14778St. Bonaventure1,539
- 14779Salamanca6,738
- 14781Sherman1,796
- 14782Sinclairville2,099
- 14783Randolph80
- 14784Cassadaga805
- 14787Westfield4,771
- 14788Weston Mills107
- 14801Addison5,275
- 14802Alfred4,814
- 14803Alfred1,514
- 14804Alfred1,362
- 14805Odessa801
- 14806Andover1,912
- 14807Arkport2,681
- 14808Cohocton500
- 14809Avoca2,890
- 14810Bath11,534
- 14812Montour Falls2,954
- 14813Belmont2,480
- 14814Big Flats2,152
- 14815Hammondsport678
- 14816Breesport534
- 14817Slaterville Springs2,479
- 14818Burdett1,878
- 14819Canisteo755
- 14820606
- 14821Campbell2,958
- 14822Canaseraga851
- 14823Canisteo3,610
- 14824Erin687
- 14825Waverly751
- 14826Cohocton2,035
- 14827Coopers Plains22
- 14830South Corning19,015
- 14836Dalton1,055
- 14837Dundee5,801
- 14838Erin1,889
- 14839Canisteo610
- 14840Hammondsport2,425
- 14841Lodi698
- 14842Dundee802
- 14843Hornell12,383
- 14845Horseheads North20,327
- 14846Hunt928
- 14847Interlaken2,300
- 14850Ithaca68,610
- 14853Ithaca2,405
- 14854Jacksonville76
- 14855992
- 14858Addison1,425
- 14859Van Etten979
- 14860Lodi1,197
- 14861Wellsburg1,260
- 14864Millport1,197
- 14865Montour Falls2,421
- 14867Newfield5,149
- 14869Odessa982
- 14870Gang Mills9,795
- 14871West Elmira4,207
- 14872Pine Valley589
- 14873Prattsburgh1,945
- 14874Prattsburgh209
- 14877Andover658
- 14878Dundee602
- 14879Savona2,160
- 14880Scio1,548
- 14881Slaterville Springs117
- 14882Trumansburg4,191
- 14883Spencer4,184
- 14884Dalton362
- 14885749
- 14886Trumansburg6,652
- 14889Van Etten1,357
- 14891Watkins Glen4,561
- 14892Waverly7,703
- 14893Hammondsport37
- 14894Wellsburg1,244
- 14895Stannards9,061
- 14897Stannards671
- 148981,469
- 14901Elmira13,970
- 14903West Elmira7,078
- 14904Elmira14,861
- 14905West Elmira8,751
Towns and townships
Each of the 933 with people in it, from ACS 2020–2024 5-year estimates: the county subdivisions that are governments of their own. A city, borough or village that is one too is listed with the places above.
- Adams town4,928
- Addison town2,501
- Afton town2,733
- Alabama town1,831
- Albion town (Orleans County)7,206
- Albion town (Oswego County)1,899
- Alden town9,871
- Alexander town2,572
- Alexandria town3,713
- Alfred town6,221
- Allegany town7,410
- Allen town405
- Alma town644
- Almond town1,619
- Altona town2,490
- Amboy town1,286
- Amenia town3,857
- Amherst town130,546
- Amity town2,407
- Amsterdam town5,578
- Ancram town1,389
- Andes town1,129
- Andover town1,509
- Angelica town1,067
- Annsville town2,611
- Antwerp town1,777
- Arcade town4,210
- Arcadia town13,601
- Argyle town3,636
- Arietta town264
- Arkwright town859
- Ashford town1,834
- Ashland town (Chemung County)1,428
- Ashland town (Greene County)701
- Athens town3,936
- Attica town6,109
- Au Sable town3,156
- Augusta town1,851
- Aurelius town2,593
- Aurora town13,882
- Austerlitz town1,676
- Ava town633
- Avoca town2,340
- Avon town6,982
- Babylon town218,262
- Bainbridge town3,017
- Baldwin town816
- Ballston town12,433
- Bangor town2,019
- Barker town2,405
- Barre town1,910
- Barrington town1,794
- Barton town8,461
- Batavia town6,656
- Bath town11,350
- Bedford town16,722
- Beekman town14,069
- Beekmantown town5,439
- Belfast town1,797
- Bellmont town1,167
- Bennington town3,220
- Benson town271
- Benton town2,948
- Bergen town3,081
- Berkshire town1,263
- Berlin town1,960
- Berne town2,679
- Bethany town1,754
- Bethel town4,054
- Bethlehem town35,139
- Big Flats town7,592
- Binghamton town4,533
- Birdsall town149
- Black Brook town1,315
- Bleecker town563
- Blenheim town305
- Blooming Grove town18,635
- Bolivar town1,967
- Bolton town2,034
- Bombay town1,117
- Boonville town4,465
- Boston town7,948
- Bovina town683
- Boylston town545
- Bradford town695
- Brandon town511
- Brant town2,224
- Brasher town2,592
- Bridgewater town1,310
- Brighton town (Franklin County)1,351
- Brighton town (Monroe County)36,834
- Bristol town2,081
- Broadalbin town5,099
- Brookfield town2,150
- Brookhaven town489,810
- Broome town773
- Brownville town5,797
- Brunswick town12,524
- Brutus town4,269
- Burke town1,284
- Burlington town1,050
- Burns town888
- Busti town7,452
- Butler town1,759
- Butternuts town1,743
- Byron town2,139
- Cairo town6,700
- Caledonia town4,137
- Callicoon town3,030
- Cambria town5,732
- Cambridge town1,912
- Camden town4,714
- Cameron town1,049
- Camillus town25,270
- Campbell town3,117
- Canaan town1,791
- Canadice town1,631
- Canajoharie town3,658
- Canandaigua town11,270
- Candor town5,051
- Caneadea town2,316
- Canisteo town3,243
- Canton town11,551
- Cape Vincent town2,532
- Carlisle town1,489
- Carlton town2,808
- Carmel town33,837
- Caroga town983
- Caroline town3,280
- Carroll town3,417
- Carrollton town1,303
- Castile town2,710
- Catharine town1,370
- Catlin town2,518
- Cato town2,542
- Caton town2,082
- Catskill town11,321
- Cayuta town528
- Cazenovia town6,693
- Centerville town700
- Champion town4,530
- Champlain town5,667
- Charleston town1,394
- Charlotte town1,501
- Charlton town4,337
- Chateaugay town1,984
- Chatham town4,060
- Chautauqua town3,965
- Chazy town4,071
- Cheektowaga town88,989
- Chemung town2,361
- Chenango town10,787
- Cherry Creek town1,060
- Cherry Valley town1,089
- Chester town (Orange County)12,668
- Chester town (Warren County)3,074
- Chesterfield town2,492
- Chili town28,982
- Cicero town31,133
- Cincinnatus town998
- Clare town80
- Clarence town33,097
- Clarendon town3,322
- Clarkson town6,810
- Clarkstown town86,937
- Clarksville town1,007
- Claverack town6,054
- Clay town59,995
- Clayton town4,693
- Clermont town2,067
- Clifton Park town37,991
- Clifton town768
- Clinton town (Clinton County)574
- Clinton town (Dutchess County)4,072
- Clymer town2,165
- Cobleskill town6,292
- Cochecton town1,489
- Coeymans town7,240
- Cohocton town2,375
- Colchester town1,713
- Colden town3,145
- Coldspring town616
- Colesville town4,797
- Collins town4,643
- Colonie town85,997
- Colton town1,395
- Columbia town1,508
- Columbus town849
- Concord town8,269
- Conesus town1,869
- Conesville town750
- Conewango town2,073
- Conklin town4,916
- Conquest town1,874
- Constable town1,501
- Constantia town4,772
- Copake town3,313
- Corinth town6,572
- Corning town5,829
- Cornwall town12,755
- Cortlandt town41,794
- Cortlandville town8,279
- Coventry town1,392
- Covert town2,004
- Covington town1,409
- Coxsackie town7,776
- Crawford town9,088
- Croghan town3,209
- Crown Point town1,984
- Cuba town3,105
- Cuyler town738
- Danby town3,359
- Dannemora town3,307
- Dansville town1,908
- Danube town888
- Darien town2,988
- Davenport town2,946
- Day town843
- Dayton town1,829
- De Kalb town2,067
- De Peyster town955
- Decatur town328
- Deerfield town3,933
- Deerpark town7,452
- Delaware town2,261
- Delhi town5,153
- Denmark town2,630
- Denning town587
- Deposit town1,285
- DeRuyter town1,279
- DeWitt town25,589
- Diana town1,383
- Dickinson town (Broome County)5,001
- Dickinson town (Franklin County)1,134
- Dix town3,660
- Dover town8,393
- Dresden town551
- Dryden town13,604
- Duane town226
- Duanesburg town6,083
- Dunkirk town1,169
- Durham town2,641
- Eagle town1,231
- East Bloomfield town3,637
- East Fishkill town29,772
- East Greenbush town16,687
- East Hampton town28,701
- East Otto town996
- East Rochester town6,218
- Eastchester town33,974
- Easton town2,317
- Eaton town4,144
- Eden town7,546
- Edinburg town1,337
- Edmeston town2,130
- Edwards town1,327
- Elba town2,210
- Elbridge town5,440
- Elizabethtown town1,149
- Ellenburg town1,992
- Ellery town4,073
- Ellicott town8,659
- Ellicottville town1,181
- Ellington town1,554
- Ellisburg town3,339
- Elma town11,687
- Elmira town6,662
- Enfield town3,310
- Ephratah town1,509
- Erin town1,912
- Erwin town7,965
- Esopus town9,561
- Esperance town1,794
- Essex town710
- Evans town15,183
- Exeter town913
- Fabius town2,063
- Fairfield town1,801
- Fallsburg town14,581
- Farmersville town1,437
- Farmington town14,643
- Fayette town3,607
- Fenner town1,719
- Fenton town6,304
- Fine town1,284
- Fishkill town22,924
- Fleming town2,463
- Florence town1,117
- Florida town2,690
- Floyd town3,702
- Forestburgh town789
- Forestport town1,693
- Fort Ann town5,311
- Fort Covington town1,410
- Fort Edward town5,964
- Fowler town1,869
- Frankfort town6,931
- Franklin town (Delaware County)2,359
- Franklin town (Franklin County)1,251
- Franklinville town2,764
- Freedom town2,483
- Freetown town911
- Fremont town (Steuben County)794
- Fremont town (Sullivan County)1,189
- French Creek town976
- Friendship town1,635
- Fulton town1,192
- Gaines town3,216
- Gainesville town1,839
- Galen town4,369
- Gallatin town1,667
- Galway town3,538
- Gardiner town5,645
- Gates town29,008
- Geddes town16,831
- Genesee Falls town400
- Genesee town1,492
- Geneseo town10,338
- Geneva town3,471
- Genoa town1,643
- Georgetown town603
- German Flatts town12,134
- German town274
- Germantown town1,681
- Gerry town1,668
- Ghent town5,267
- Gilboa town1,348
- Glen town2,555
- Glenville town29,372
- Gorham town4,093
- Goshen town14,468
- Gouverneur town6,486
- Grafton town1,859
- Granby town6,497
- Grand Island town21,488
- Granger town614
- Granville town6,182
- Great Valley town1,629
- Greece town95,395
- Green Island town2,970
- Greenburgh town93,990
- Greene town5,161
- Greenfield town8,039
- Greenport town4,425
- Greenville town (Greene County)3,761
- Greenville town (Orange County)4,676
- Greenwich town4,850
- Greenwood town699
- Greig town1,004
- Groton town5,612
- Grove town539
- Groveland town2,528
- Guilderland town37,260
- Guilford town2,696
- Hadley town2,074
- Hague town703
- Halcott town337
- Halfmoon town26,245
- Hamburg town60,234
- Hamden town1,245
- Hamilton town6,350
- Hamlin town8,652
- Hammond town1,683
- Hampton town1,145
- Hamptonburgh town5,500
- Hancock town2,769
- Hannibal town4,493
- Hanover town6,882
- Hardenburgh town153
- Harford town980
- Harmony town2,344
- Harpersfield town1,568
- Harrietstown town5,222
- Harrisburg town478
- Harrison town29,961
- Hartford town1,895
- Hartland town3,828
- Hartsville town512
- Hartwick town2,143
- Hastings town9,345
- Haverstraw town39,107
- Hebron town1,751
- Hector town4,850
- Hempstead town790,202
- Henderson town1,698
- Henrietta town48,065
- Herkimer town9,534
- Hermon town1,146
- Highland town2,234
- Highlands town12,823
- Hillsdale town1,795
- Hinsdale town2,187
- Holland town3,266
- Homer town6,178
- Hoosick town6,671
- Hope town587
- Hopewell town3,906
- Hopkinton town1,000
- Horicon town1,700
- Hornby town1,781
- Hornellsville town3,962
- Horseheads town18,854
- Hounsfield town3,257
- Howard town1,254
- Hume town2,055
- Humphrey town758
- Hunter town3,042
- Huntington town204,059
- Hurley town6,163
- Huron town2,240
- Hyde Park town21,240
- Independence town756
- Indian Lake town1,268
- Inlet town227
- Ira town2,019
- Irondequoit town50,657
- Ischua town751
- Islip town339,106
- Italy town1,028
- Ithaca town20,968
- Jackson town1,695
- Jasper town1,308
- Java town2,049
- Jay town2,354
- Jefferson town1,226
- Jerusalem town4,278
- Jewett town1,099
- Johnsburg town1,786
- Johnstown town6,452
- Junius town1,196
- Keene town710
- Kendall town2,591
- Kent town12,896
- Kiantone town1,865
- Kinderhook town8,229
- Kingsbury town12,896
- Kingston town945
- Kirkland town9,786
- Kirkwood town5,387
- Knox town2,559
- Kortright town1,627
- LaFayette town4,878
- LaGrange town16,384
- Lake George town3,496
- Lake Luzerne town3,080
- Lake Pleasant town863
- Lancaster town45,148
- Lansing town11,789
- Lapeer town718
- Laurens town2,274
- Lawrence town1,623
- Le Ray town25,266
- Le Roy town7,571
- Lebanon town1,422
- Ledyard town1,811
- Lee town6,074
- Leicester town1,859
- Lenox town8,658
- Leon town1,459
- Lewis town (Essex County)1,156
- Lewis town (Lewis County)913
- Lewisboro town12,089
- Lewiston town15,788
- Lexington town763
- Leyden town1,661
- Liberty town10,358
- Lima town4,118
- Lincklaen town283
- Lincoln town1,749
- Lindley town1,622
- Lisbon town4,235
- Lisle town2,658
- Litchfield town1,418
- Little Falls town1,418
- Little Valley town1,700
- Livingston town3,616
- Livonia town7,505
- Lloyd town11,154
- Locke town1,805
- Lockport town20,516
- Lodi town1,825
- Long Lake town875
- Lorraine town878
- Louisville town3,013
- Lowville town4,875
- Lumberland town2,068
- Lyme town2,066
- Lyndon town642
- Lyons town5,594
- Lyonsdale town1,159
- Lysander town23,086
- Macedon town9,243
- Machias town2,290
- Macomb town752
- Madison town2,730
- Madrid town1,767
- Maine town5,089
- Malone town11,673
- Malta town17,398
- Mamakating town12,728
- Mamaroneck town31,236
- Manchester town9,333
- Manheim town3,058
- Manlius town33,328
- Mansfield town691
- Marathon town2,042
- Marbletown town5,724
- Marcellus town6,018
- Marcy town8,676
- Marilla town5,148
- Marion town4,523
- Marlborough town8,819
- Marshall town2,163
- Martinsburg town1,189
- Maryland town1,498
- Masonville town1,143
- Massena town12,319
- Mayfield town6,108
- McDonough town946
- Mendon town9,019
- Mentz town1,753
- Meredith town1,467
- Mexico town5,276
- Middleburgh town3,134
- Middlebury town1,336
- Middlefield town1,797
- Middlesex town1,407
- Middletown town3,292
- Milan town2,301
- Milford town2,790
- Milo town6,823
- Milton town19,036
- Mina town937
- Minden town4,181
- Minerva town836
- Minetto town1,754
- Minisink town4,661
- Mohawk town3,560
- Moira town2,895
- Monroe town21,586
- Montague town130
- Montezuma town1,271
- Montgomery town23,265
- Montour town2,566
- Mooers town3,439
- Moravia town3,110
- Moreau town16,631
- Morehouse town63
- Moriah town4,483
- Morris town1,899
- Morristown town2,567
- Mount Hope town6,465
- Mount Kisco town10,737
- Mount Morris town4,360
- Mount Pleasant town44,769
- Murray town4,754
- Nanticoke town1,683
- Naples town2,606
- Napoli town1,592
- Nassau town4,511
- Nelson town1,765
- Neversink town3,380
- New Albion town2,053
- New Baltimore town3,199
- New Berlin town2,639
- New Bremen town2,783
- New Castle town18,022
- New Hartford town22,015
- New Haven town2,951
- New Hudson town995
- New Lebanon town2,271
- New Lisbon town1,203
- New Paltz town15,330
- New Scotland town9,127
- New Windsor town27,877
- Newark Valley town3,559
- Newburgh town31,915
- Newcomb town490
- Newfane town9,239
- Newfield town4,992
- Newport town1,740
- Newstead town8,681
- Niagara town7,797
- Nichols town2,741
- Niles town1,147
- Niskayuna town23,591
- Norfolk town4,402
- North Castle town12,228
- North Collins town3,503
- North Dansville town5,242
- North East town2,974
- North Elba town7,540
- North Greenbush town13,297
- North Harmony town1,881
- North Hempstead town237,012
- North Hudson town208
- North Norwich town1,357
- North Salem town5,148
- Northampton town2,594
- Northumberland town5,219
- Norway town930
- Norwich town3,521
- Nunda town2,671
- Oakfield town3,106
- Ogden town20,208
- Ohio town980
- Olean town1,664
- Olive town4,254
- Oneonta town4,994
- Onondaga town22,573
- Ontario town10,491
- Oppenheim town1,796
- Orange town1,196
- Orangetown town48,605
- Orangeville town1,273
- Orchard Park town29,779
- Orleans town2,778
- Orwell town914
- Osceola town134
- Ossian town689
- Ossining town39,276
- Oswegatchie town4,025
- Oswego town8,369
- Otego town2,718
- Otisco town2,545
- Otsego town3,627
- Otselic town909
- Otto town798
- Ovid town2,094
- Owasco town3,511
- Owego town18,729
- Oxford town3,546
- Oyster Bay town299,509
- Palatine town3,200
- Palermo town3,456
- Palm Tree town38,916
- Palmyra town7,354
- Pamelia town3,304
- Paris town4,261
- Parish town2,418
- Parishville town1,658
- Parma town16,111
- Patterson town11,560
- Pavilion town2,089
- Pawling town8,044
- Pelham town12,949
- Pembroke town4,218
- Pendleton town7,034
- Penfield town38,965
- Perinton town46,961
- Perry town4,836
- Perrysburg town1,578
- Persia town2,048
- Perth town3,541
- Peru town6,710
- Petersburgh town1,310
- Pharsalia town563
- Phelps town6,624
- Philadelphia town1,557
- Philipstown town9,879
- Piercefield town311
- Pierrepont town2,521
- Pike town812
- Pinckney town285
- Pine Plains town2,243
- Pitcairn town833
- Pitcher town576
- Pittsfield town1,233
- Pittsford town30,543
- Pittstown town5,474
- Plainfield town1,016
- Plattekill town10,406
- Plattsburgh town11,830
- Pleasant Valley town9,794
- Plymouth town1,395
- Poestenkill town4,327
- Poland town2,059
- Pomfret town12,795
- Pompey town7,047
- Portage town961
- Porter town6,474
- Portland town3,924
- Portville town3,442
- Potsdam town14,819
- Potter town1,871
- Poughkeepsie town45,636
- Pound Ridge town5,012
- Prattsburgh town1,716
- Prattsville town701
- Preble town1,150
- Preston town856
- Princetown town1,860
- Providence town1,971
- Pulteney town1,072
- Putnam town540
- Putnam Valley town11,755
- Queensbury town29,201
- Ramapo town152,401
- Randolph town2,156
- Rathbone town1,151
- Reading town1,637
- Red Hook town11,108
- Red House town22
- Redfield town386
- Remsen town1,666
- Rensselaerville town1,901
- Rhinebeck town7,610
- Richfield town1,949
- Richford town795
- Richland town5,716
- Richmond town3,331
- Richmondville town2,209
- Ridgeway town6,514
- Riga town5,534
- Ripley town2,269
- Riverhead town35,980
- Rochester town7,362
- Rockland town3,307
- Rodman town1,466
- Romulus town3,110
- Root town1,963
- Rose town2,126
- Roseboom town630
- Rosendale town5,744
- Rossie town785
- Rotterdam town30,616
- Roxbury town2,272
- Royalton town7,478
- Rush town3,464
- Rushford town1,185
- Russell town2,091
- Russia town2,272
- Rutland town3,009
- Rye town48,734
- Salamanca town536
- Salem town2,611
- Salina town32,840
- Salisbury town1,933
- Sand Lake town8,326
- Sandy Creek town3,806
- Sanford town2,130
- Sangerfield town2,431
- Santa Clara town511
- Saranac town3,822
- Saratoga town5,850
- Sardinia town2,703
- Saugerties town19,223
- Savannah town1,482
- Scarsdale town18,010
- Schaghticoke town7,359
- Schodack town12,933
- Schoharie town3,111
- Schroeppel town7,938
- Schroon town1,897
- Schuyler Falls town4,851
- Schuyler town3,280
- Scio town1,495
- Scipio town1,497
- Scott town1,082
- Scriba town6,603
- Sempronius town789
- Seneca Falls town8,982
- Seneca town2,622
- Sennett town3,264
- Seward town2,055
- Shandaken town2,789
- Sharon town1,656
- Shawangunk town13,365
- Shelby town4,858
- Sheldon town2,216
- Shelter Island town3,355
- Sherburne town3,909
- Sheridan town2,529
- Sherman town1,390
- Sidney town5,492
- Skaneateles town7,090
- Smithfield town1,240
- Smithtown town116,097
- Smithville town1,525
- Smyrna town1,392
- Sodus town8,080
- Solon town899
- Somers town21,264
- Somerset town3,060
- South Bristol town1,624
- South Valley town273
- Southampton town69,679
- Southeast town18,180
- Southold town23,905
- Southport town9,150
- Spafford town1,795
- Sparta town1,479
- Spencer town2,917
- Springfield town952
- Springport town2,352
- Springwater town2,503
- St. Armand town1,555
- St. Johnsville town2,583
- Stafford town2,251
- Stamford town1,935
- Stanford town3,692
- Stark town685
- Starkey town3,381
- Stephentown town2,774
- Sterling town3,192
- Steuben town828
- Stillwater town9,396
- Stockbridge town1,965
- Stockholm town3,826
- Stockport town2,642
- Stockton town1,948
- Stony Creek town903
- Stony Point town14,833
- Stratford town769
- Stuyvesant town2,009
- Sullivan town14,690
- Summerhill town886
- Summit town976
- Sweden town13,472
- Taghkanic town1,283
- Taylor town451
- Theresa town2,621
- Thompson town16,714
- Throop town1,651
- Thurman town977
- Thurston town1,097
- Ticonderoga town4,705
- Tioga town4,348
- Tompkins town1,187
- Tonawanda town71,850
- Torrey town996
- Trenton town4,257
- Triangle town2,773
- Troupsburg town1,018
- Truxton town1,077
- Tully town2,649
- Tupper Lake town5,104
- Turin town1,065
- Tuscarora town1,402
- Tusten town1,539
- Tuxedo town3,763
- Tyre town1,054
- Tyrone town1,755
- Ulster town12,675
- Ulysses town4,809
- Unadilla town4,076
- Union town55,078
- Union Vale town4,567
- Urbana town1,951
- Van Buren town14,237
- Van Etten town1,328
- Varick town1,724
- Venice town1,468
- Vernon town8,219
- Verona town5,884
- Vestal town30,978
- Veteran town3,269
- Victor town15,989
- Victory town1,907
- Vienna town5,184
- Villenova town992
- Virgil town2,525
- Volney town5,642
- Waddington town2,021
- Wales town3,015
- Wallkill town31,023
- Walton town5,222
- Walworth town9,273
- Wappinger town28,252
- Ward town384
- Warren town1,294
- Warrensburg town3,954
- Warsaw town5,288
- Warwick town31,859
- Washington town4,496
- Waterford town8,163
- Waterloo town7,324
- Watertown town5,557
- Watson town1,976
- Waverly town794
- Wawarsing town12,533
- Wawayanda town7,537
- Wayland town3,698
- Wayne town1,033
- Webb town1,529
- Webster town45,226
- Wells town671
- Wellsville town6,978
- West Almond town361
- West Bloomfield town2,738
- West Monroe town4,060
- West Seneca town45,303
- West Sparta town1,093
- West Turin town1,733
- West Union town520
- Westerlo town3,208
- Western town1,839
- Westfield town4,474
- Westford town862
- Westmoreland town5,892
- Westport town1,550
- Westville town1,881
- Wethersfield town815
- Wheatfield town18,549
- Wheatland town4,857
- Wheeler town1,195
- White Creek town3,261
- Whitehall town4,005
- Whitestown town17,908
- Willet town768
- Williamson town6,823
- Williamstown town1,522
- Willing town1,616
- Willsboro town1,903
- Wilmington town1,251
- Wilna town5,677
- Wilson town5,789
- Wilton town17,456
- Windham town1,432
- Windsor town5,708
- Winfield town1,874
- Wirt town1,253
- Wolcott town3,971
- Woodbury town12,224
- Woodhull town1,554
- Woodstock town6,258
- Worcester town2,149
- Worth town222
- Wright town1,739
- Yates town2,429
- York town3,164
- Yorkshire town3,779
- Yorktown town35,869
School districts
Each of the 679 with people in it, from ACS 2020–2024 5-year estimates. Elementary districts teach the lower grades and secondary districts the upper ones, under them; the rest are unified, teaching every grade.
- Addison Central School District6,800
- Adirondack Central School District8,218
- Afton Central School District3,656
- Akron Central School District9,005
- Albany City School District100,492
- Albion Central School District13,653
- Alden Central School District12,645
- Alexander Central School District4,686
- Alexandria Central School District3,589
- Alfred-Almond Central School District8,315
- Allegany-Limestone Central School District8,849
- Altmar-Parish-Williamstown Central School District7,109
- Amagansett Union Free School District909
- Amherst Central School District23,675
- Amityville Union Free School District28,342
- Amsterdam City School District24,801
- Andes Central School District1,069
- Andover Central School District2,056
- Ardsley Union Free School District11,555
- Argyle Central School District3,949
- Arkport Central School District2,727
- Arlington Central School District59,163
- Attica Central School District11,724
- Auburn City School District31,444
- AuSable Valley Central School District8,939
- Averill Park Central School District18,773
- Avoca Central School District3,412
- Avon Central School District6,895
- Babylon Union Free School District11,752
- Bainbridge-Guilford Central School District5,562
- Baldwin Union Free School District36,257
- Baldwinsville Central School District38,088
- Ballston Spa Central School District31,630
- Barker Central School District5,600
- Batavia City School District18,162
- Bath Central School District10,265
- Bay Shore Union Free School District36,988
- Bayport-Blue Point Union Free School District13,329
- Beacon City School District27,900
- Beaver River Central School District5,683
- Bedford Central School District27,045
- Beekmantown Central School District12,999
- Belfast Central School District2,080
- Belleville Henderson Central School District3,289
- Bellmore Union Free School Districtelementary11,983
- Bellmore-Merrick Central High School Districtsecondary70,537
- Bemus Point Central School District4,671
- Berlin Central School District6,297
- Berne-Knox-Westerlo Central School District5,999
- Bethlehem Central School District28,738
- Bethpage Union Free School District19,846
- Binghamton City School District48,549
- Blind Brook-Rye Union Free School District7,585
- Bolivar-Richburg Central School District4,323
- Bolton Central School District1,669
- Boquet Valley Central School District at Elizabethtown-Lewis-Westport3,959
- Bradford Central School District1,561
- Brasher Falls Central School District5,525
- Brentwood Union Free School District91,916
- Brewster Central School District22,195
- Briarcliff Manor Union Free School District8,043
- Bridgehampton Union Free School District1,007
- Brighton Central School District25,166
- Broadalbin-Perth Central School District10,835
- Brockport Central School District26,714
- Brocton Central School District3,943
- Bronxville Union Free School District6,510
- Brookfield Central School District1,135
- Brookhaven-Comsewogue Union Free School District22,093
- Brunswick Central School District (Brittonkill)8,745
- Brushton-Moira Central School District4,663
- Buffalo City School District276,854
- Burnt Hills-Ballston Lake Central School District19,320
- Byram Hills Central School District11,489
- Byron-Bergen Central School District6,446
- Cairo-Durham Central School District9,798
- Caledonia-Mumford Central School District5,461
- Cambridge Central School District6,979
- Camden Central School District13,068
- Campbell-Savona Central School District4,891
- Canajoharie Central School District6,745
- Canandaigua City School District27,109
- Canaseraga Central School District1,413
- Canastota Central School District9,839
- Candor Central School District4,967
- Canisteo-Greenwood Central School District5,267
- Canton Central School District12,582
- Carle Place Union Free School District9,795
- Carmel Central School District28,961
- Carthage Central School District18,547
- Cassadaga Valley Central School District5,893
- Cato-Meridian Central School District5,479
- Catskill Central School District11,614
- Cattaraugus-Little Valley Central School District6,573
- Cazenovia Central School District10,425
- Center Moriches Union Free School District9,190
- Central Islip Union Free School District42,195
- Central Square Central School District25,432
- Central Valley Central School District13,703
- Chappaqua Central School District16,522
- Charlotte Valley Central School District3,036
- Chateaugay Central School District3,188
- Chatham Central School District9,606
- Chautauqua Lake Central School District5,172
- Chazy Union Free School District2,742
- Cheektowaga Central School District21,494
- Cheektowaga-Maryvale Union Free School District18,320
- Cheektowaga-Sloan Union Free School District10,931
- Chenango Forks Central School District9,181
- Chenango Valley Central School District12,305
- Cherry Valley-Springfield Central School District3,300
- Chester Union Free School District6,311
- Chittenango Central School District12,968
- Churchville-Chili Central School District29,120
- Cincinnatus Central School District3,187
- Clarence Central School District30,807
- Clarkstown Central School District50,108
- Cleveland Hill Union Free School District12,578
- Clifton-Fine Central School District2,066
- Clinton Central School District11,166
- Clyde-Savannah Central School District5,266
- Clymer Central School District3,636
- Cobleskill-Richmondville Central School District13,564
- Cohoes City School District18,159
- Cold Spring Harbor Central School District8,386
- Colton-Pierrepont Central School District2,558
- Commack Union Free School District37,219
- Connetquot Central School District38,030
- Cooperstown Central School District6,075
- Copenhagen Central School District2,965
- Copiague Union Free School District33,046
- Corinth Central School District7,574
- Corning City School District32,623
- Cornwall Central School District17,708
- Cortland City School District22,477
- Coxsackie-Athens Central School District11,714
- Croton-Harmon Union Free School District9,154
- Crown Point Central School District1,959
- Cuba-Rushford Central School District6,560
- Dalton-Nunda Central School District (Keshequa)4,769
- Dansville Central School District9,400
- Deer Park Union Free School District25,885
- Delaware Academy Central School District at Delhi8,156
- Depew Union Free School District14,958
- Deposit Central School District2,959
- DeRuyter Central School District2,100
- Dobbs Ferry Union Free School District9,383
- Dolgeville Central School District5,262
- Dover Union Free School District9,669
- Downsville Central School District1,946
- Dryden Central School District12,844
- Duanesburg Central School District4,679
- Dundee Central School District6,486
- Dunkirk City School District13,836
- East Aurora Union Free School District12,503
- East Bloomfield Central School District6,430
- East Greenbush Central School District31,927
- East Hampton Union Free School District12,490
- East Irondequoit Central School District27,688
- East Islip Union Free School District23,867
- East Meadow Union Free School District51,306
- East Moriches Union Free School District6,896
- East Quogue Union Free School District5,581
- East Ramapo Central School District (Spring Valley)136,857
- East Rochester Union Free School District8,580
- East Rockaway Union Free School District9,284
- East Syracuse-Minoa Central School District21,451
- East Williston Union Free School District9,479
- Eastchester Union Free School District19,688
- Eastport-South Manor Central School District19,430
- Eden Central School District9,882
- Edgemont Union Free School District6,614
- Edinburg Common School District1,437
- Edmeston Central School District3,283
- Edwards-Knox Central School District3,648
- Elba Central School District2,834
- Eldred Central School District4,416
- Ellenville Central School District11,873
- Ellicottville Central School District2,951
- Elmira City School District43,137
- Elmira Heights Central School District6,955
- Elmont Union Free School Districtelementary53,895
- Elmsford Union Free School District9,293
- Elwood Union Free School District14,730
- Evans-Brant Central School District (Lake Shore)16,773
- Fabius-Pompey Central School District4,789
- Fairport Central School District41,137
- Falconer Central School District6,464
- Fallsburg Central School District12,139
- Farmingdale Union Free School District39,774
- Fayetteville-Manlius Central School District26,134
- Fillmore Central School District5,118
- Fire Island Union Free School District384
- Fishers Island Union Free School District72
- Floral Park-Bellerose Union Free School Districtelementary19,797
- Florida Union Free School District5,109
- Fonda-Fultonville Central School District8,481
- Forestville Central School District3,638
- Fort Ann Central School District5,060
- Fort Edward Union Free School District3,084
- Fort Plain Central School District5,315
- Frankfort-Schuyler Central School District6,752
- Franklin Central School District2,001
- Franklin Square Union Free School Districtelementary26,945
- Franklinville Central School District4,700
- Fredonia Central School District12,820
- Freeport Union Free School District40,154
- Frewsburg Central School District4,714
- Friendship Central School District1,796
- Frontier Central School District38,173
- Fulton City School District19,676
- Galway Central School District6,476
- Gananda Central School District5,693
- Garden City Union Free School District22,941
- Garrison Union Free School District2,785
- Gates-Chili Central School District34,187
- General Brown Central School District8,865
- Genesee Valley Central School District3,867
- Geneseo Central School District11,688
- Geneva City School District16,943
- Georgetown-South Otselic Central School District2,290
- Germantown Central School District4,764
- Gilbertsville-Mount Upton Central School District2,532
- Gilboa-Conesville Central School District2,767
- Glen Cove City School District28,112
- Glens Falls City School District15,604
- Glens Falls Common School Districtelementary2,152
- Gloversville City School District17,736
- Gorham-Middlesex Central School District (Marcus Whitman)9,635
- Goshen Central School District17,609
- Gouverneur Central School District9,962
- Gowanda Central School District8,862
- Grand Island Central School District21,488
- Granville Central School District7,441
- Great Neck Union Free School District47,994
- Greece Central School District82,209
- Green Island Union Free School District2,970
- Greenburgh Central School District23,106
- Greene Central School District6,506
- Greenport Union Free School District5,320
- Greenville Central School District8,634
- Greenwich Central School District6,356
- Greenwood Lake Union Free School District6,025
- Groton Central School District5,167
- Guilderland Central School District39,074
- Hadley-Luzerne Central School District6,538
- Haldane Central School District5,362
- Half Hollow Hills Central School District46,271
- Hamburg Central School District25,115
- Hamilton Central School District6,757
- Hammond Central School District2,127
- Hammondsport Central School District3,414
- Hampton Bays Union Free School District15,558
- Hancock Central School District2,335
- Hannibal Central School District7,769
- Harborfields Central School District18,668
- Harpursville Central School District4,264
- Harrison Central School District29,961
- Harrisville Central School District2,069
- Hartford Central School District2,255
- Hastings-on-Hudson Union Free School District8,980
- Hauppauge Union Free School District23,969
- Haverstraw-Stony Point Central School District (North Rockland)49,823
- Hempstead Union Free School District46,807
- Hendrick Hudson Central School District17,128
- Herkimer Central School District9,499
- Hermon-DeKalb Central School District2,502
- Herricks Union Free School District23,489
- Heuvelton Central School District3,991
- Hewlett-Woodmere Union Free School District19,966
- Hicksville Union Free School District41,214
- Highland Central School District13,276
- Highland Falls Central School District12,798
- Hilton Central School District26,087
- Hinsdale Central School District2,905
- Holland Central School District6,786
- Holland Patent Central School District9,424
- Holley Central School District7,606
- Homer Central School District12,126
- Honeoye Central School District5,776
- Honeoye Falls-Lima Central School District13,916
- Hoosic Valley Central School District6,954
- Hoosick Falls Central School District7,058
- Hornell City School District10,397
- Horseheads Central School District26,298
- Hudson City School District14,836
- Hudson Falls Central School District15,585
- Hunter-Tannersville Central School District3,925
- Huntington Union Free School District35,151
- Hyde Park Central School District34,080
- Indian Lake Central School District1,268
- Indian River Central School District24,117
- Inlet Common School District227
- Iroquois Central School District17,580
- Irvington Union Free School District9,037
- Island Park Union Free School District8,454
- Island Trees Union Free School District15,613
- Islip Union Free School District18,758
- Ithaca City School District70,303
- Jamestown City School District30,239
- Jamesville-DeWitt Central School District19,028
- Jasper-Troupsburg Central School District3,255
- Jefferson Central School District1,505
- Jericho Union Free School District15,751
- Johnsburg Central School District1,958
- Johnson City Central School District18,797
- Johnstown City School District11,254
- Jordan-Elbridge Central School District8,278
- Katonah-Lewisboro Union Free School District18,186
- Keene Central School District728
- Kendall Central School District4,879
- Kenmore-Tonawanda Union Free School District65,575
- Kinderhook Central School District (Ichabod Crane)13,666
- Kings Park Central School District21,845
- Kingston City School District51,931
- Kiryas Joel Village Union Free School District38,916
- La Fargeville Central School District3,332
- Lackawanna City School District19,753
- LaFayette Central School District4,623
- Lake George Central School District6,662
- Lake Placid Central School District5,821
- Lake Pleasant Central School District863
- Lakeland Central School District35,008
- Lancaster Central School District45,861
- Lansing Central School District7,653
- Lansingburgh Central School District17,242
- Laurens Central School District2,461
- Lawrence Union Free School District39,161
- Le Roy Central School District8,526
- Letchworth Central School District5,128
- Levittown Union Free School District46,158
- Lewiston-Porter Central School District18,346
- Liberty Central School District11,033
- Lindenhurst Union Free School District41,121
- Lisbon Central School District4,221
- Little Falls City School District6,605
- Liverpool Central School District50,856
- Livingston Manor Central School District2,789
- Livonia Central School District9,746
- Lockport City School District35,141
- Locust Valley Central School District17,112
- Long Beach City School District39,653
- Long Lake Central School District716
- Longwood Central School District69,251
- Lowville Academy and Central School District8,734
- Lyme Central School District2,247
- Lynbrook Union Free School District18,177
- Lyncourt Union Free School District3,943
- Lyndonville Central School District3,904
- Lyons Central School District6,265
- Madison Central School District2,846
- Madrid-Waddington Central School District3,654
- Mahopac Central School District27,150
- Maine-Endwell Central School District14,357
- Malone Central School District16,673
- Malverne Union Free School District15,945
- Mamaroneck Union Free School District30,223
- Manchester-Shortsville Central School District5,458
- Manhasset Union Free School District16,705
- Marathon Central School District4,696
- Marcellus Central School District10,319
- Margaretville Central School District3,456
- Marion Central School District5,704
- Marlboro Central School District12,358
- Massapequa Union Free School District47,425
- Massena Central School District16,436
- Mattituck-Cutchogue Union Free School District8,827
- Mayfield Central School District6,290
- McGraw Central School District3,007
- Mechanicville City School District10,147
- Medina Central School District10,495
- Menands Union Free School District4,113
- Merrick Union Free School Districtelementary17,453
- Mexico Central School District12,442
- Middle Country Central School District64,883
- Middleburgh Central School District5,406
- Middletown City School District45,741
- Milford Central School District2,708
- Millbrook Central School District7,343
- Miller Place Union Free School District15,188
- Mineola Union Free School District27,097
- Minerva Central School District854
- Minisink Valley Central School District23,271
- Monroe-Woodbury Central School District38,429
- Montauk Union Free School District4,223
- Monticello Central School District23,645
- Moravia Central School District6,845
- Moriah Central School District4,508
- Morris Central School District2,445
- Morristown Central School District3,327
- Morrisville-Eaton Central School District5,268
- Mount Markham Central School District6,903
- Mount Morris Central School District4,699
- Mount Pleasant Central School District12,957
- Mount Sinai Union Free School District11,074
- Mount Vernon School District72,427
- Nanuet Union Free School District15,136
- Naples Central School District5,215
- New Hartford Central School District16,981
- New Hyde Park-Garden City Park Union Free School Districtelementary22,728
- New Lebanon Central School District3,929
- New Paltz Central School District20,791
- New Rochelle City School District82,769
- New Suffolk Common School District298
- New York City Department Of Education8.48M
- New York Mills Union Free School District5,665
- Newark Central School District14,414
- Newark Valley Central School District7,417
- Newburgh City School District68,211
- Newcomb Central School District490
- Newfane Central School District9,789
- Newfield Central School District5,082
- Niagara Falls City School District47,987
- Niagara-Wheatfield Central School District25,982
- Niskayuna Central School District24,772
- North Babylon Union Free School District30,840
- North Bellmore Union Free School Districtelementary26,918
- North Collins Central School District4,436
- North Colonie Central School District43,681
- North Greenbush Common School District (Williams)2,090
- North Merrick Union Free School Districtelementary14,183
- North Rose-Wolcott Central School District8,687
- North Salem Central School District6,911
- North Shore Central School District16,445
- North Syracuse Central School District58,772
- North Tonawanda City School District30,198
- North Warren Central School District4,573
- Northeast Central School District6,220
- Northeastern Clinton Central School District8,915
- Northern Adirondack Central School District5,663
- Northport-East Northport Union Free School District35,588
- Northville Central School District3,051
- Norwich City School District12,411
- Norwood-Norfolk Central School District6,882
- Nyack Union Free School District23,426
- Oakfield-Alabama Central School District5,330
- Oceanside Union Free School District35,720
- Odessa-Montour Central School District5,527
- Ogdensburg City School District9,786
- Olean City School District14,894
- Oneida City School District13,957
- Oneonta City School District21,499
- Onondaga Central School District4,983
- Onteora Central School District15,035
- Oppenheim-Ephratah-St. Johnsville Central School District5,866
- Orchard Park Central School District34,878
- Oriskany Central School District3,999
- Ossining Union Free School District36,272
- Oswego City School District31,991
- Otego-Unadilla Central School District6,037
- Owego-Apalachin Central School District13,587
- Oxford Academy and Central School District4,964
- Oyster Bay-East Norwich Central School District13,656
- Oysterponds Union Free School District2,276
- Palmyra-Macedon Central School District12,245
- Panama Central School District3,136
- Parishville-Hopkinton Central School District2,436
- Patchogue-Medford Union Free School District52,038
- Pavilion Central School District4,286
- Pawling Central School District8,523
- Pearl River Union Free School District14,191
- Peekskill City School District24,231
- Pelham Union Free School District12,949
- Pembroke Central School District7,473
- Penfield Central School District30,801
- Penn Yan Central School District14,871
- Perry Central School District6,468
- Peru Central School District12,234
- Phelps-Clifton Springs Central School District11,127
- Phoenix Central School District11,068
- Pine Bush Central School District35,865
- Pine Plains Central School District8,169
- Pine Valley Central School District (South Dayton)4,386
- Piseco Common School District268
- Pittsford Central School District34,905
- Plainedge Union Free School District19,076
- Plainview-Old Bethpage Central School District29,647
- Plattsburgh City School District19,830
- Pleasantville Union Free School District8,712
- Pocantico Hills Central School District4,218
- Poland Central School District3,775
- Port Byron Central School District5,513
- Port Chester-Rye Union Free School District33,417
- Port Jefferson Union Free School District7,928
- Port Jervis City School District16,590
- Port Washington Union Free School District33,435
- Portville Central School District4,568
- Potsdam Central School District13,975
- Poughkeepsie City School District31,958
- Prattsburgh Central School District2,853
- Pulaski Central School District5,764
- Putnam Central School District564
- Putnam Valley Central School District10,497
- Queensbury Union Free School District22,761
- Quogue Union Free School District858
- Randolph Central School District6,510
- Raquette Lake Union Free School District159
- Ravena-Coeymans-Selkirk Central School District13,095
- Red Creek Central School District5,594
- Red Hook Central School District13,824
- Remsen Central School District2,719
- Remsenburg-Speonk Union Free School District1,107
- Rensselaer City School District9,287
- Rhinebeck Central School District10,119
- Richfield Springs Central School District3,787
- Ripley Central School District1,902
- Riverhead Central School District43,671
- Rochester City School District208,772
- Rockville Centre Union Free School District24,193
- Rocky Point Union Free School District17,005
- Rome City School District36,418
- Romulus Central School District4,434
- Rondout Valley Central School District17,697
- Roosevelt Union Free School District20,814
- Roscoe Central School District2,138
- Roslyn Union Free School District17,663
- Rotterdam-Mohonasen Central School District21,233
- Roxbury Central School District2,536
- Royalton-Hartland Central School District9,281
- Rush-Henrietta Central School District56,684
- Rye City School District15,207
- Rye Neck Union Free School District8,953
- Sachem Central School District83,436
- Sackets Harbor Central School District3,690
- Sag Harbor Union Free School District8,610
- Sagaponack Common School District294
- Salamanca City School District7,374
- Salem Central School District4,033
- Salmon River Central School District7,465
- Sandy Creek Central School District5,343
- Saranac Central School District12,006
- Saranac Lake Central School District12,530
- Saratoga Springs City School District52,212
- Saugerties Central School District20,759
- Sauquoit Valley Central School District5,908
- Sayville Union Free School District17,019
- Scarsdale Union Free School District19,023
- Schalmont Central School District15,062
- Schenectady City School District68,847
- Schenevus Central School District2,138
- Schodack Central School District5,617
- Schoharie Central School District6,526
- Schroon Lake Central School District2,105
- Schuylerville Central School District10,112
- Scio Central School District1,926
- Scotia-Glenville Central School District19,119
- Seaford Union Free School District16,126
- Seneca Falls Central School District10,066
- Sewanhaka Central High School Districtsecondary123,365
- Sharon Springs Central School District1,882
- Shelter Island Union Free School District3,355
- Shenendehowa Central School District69,543
- Sherburne-Earlville Central School District8,233
- Sherman Central School District2,393
- Sherrill City School District12,105
- Shoreham-Wading River Central School District13,121
- Sidney Central School District7,225
- Silver Creek Central School District6,131
- Skaneateles Central School District9,095
- Smithtown Central School District55,300
- Sodus Central School District7,636
- Solvay Union Free School District9,561
- Somers Central School District20,424
- South Colonie Central School District38,252
- South Country Central School District27,448
- South Glens Falls Central School District22,066
- South Huntington Union Free School District40,162
- South Jefferson Central School District10,744
- South Kortright Central School District2,532
- South Lewis Central School District6,694
- South Orangetown Central School District20,797
- South Seneca Central School District6,445
- Southampton Union Free School District14,496
- Southern Cayuga Central School District6,072
- Southold Union Free School District7,138
- Southwestern Central School District at Jamestown10,131
- Spackenkill Union Free School District8,621
- Spencer-Van Etten Central School District5,868
- Spencerport Central School District22,805
- Springs Union Free School District9,163
- Springville-Griffith Institute Central School12,452
- St. Regis Falls Central School District1,994
- Stamford Central School District2,582
- Starpoint Central School District19,251
- Stillwater Central School District8,144
- Stockbridge Valley Central School District2,445
- Suffern Central School District31,570
- Sullivan West Central School District10,150
- Susquehanna Valley Central School District9,821
- Sweet Home Central School District40,591
- Syosset Central School District35,701
- Syracuse City School District146,384
- Taconic Hills Central School District11,560
- Thousand Islands Central School District6,880
- Three Village Central School District48,218
- Ticonderoga Central School District5,353
- Tioga Central School District5,437
- Tonawanda City School District15,030
- Town of Webb Union Free School District1,958
- Tri-Valley Central School District6,153
- Troy City School District40,531
- Trumansburg Central School District7,275
- Tuckahoe Common School District3,313
- Tuckahoe Union Free School District7,776
- Tully Central School District5,496
- Tupper Lake Central School District5,415
- Tuxedo Union Free School District3,677
- Unadilla Valley Central School District5,037
- Union Free School District of the Tarrytowns21,782
- Union Springs Central School District6,333
- Union-Endicott Central School District30,950
- Uniondale Union Free School District46,421
- Utica City School District64,217
- Valhalla Union Free School District9,742
- Valley Central School District (Montgomery)28,274
- Valley Stream Central High School Districtsecondary64,691
- Valley Stream Union Free School District 13elementary29,369
- Valley Stream Union Free School District 24elementary16,382
- Valley Stream Union Free School District 30elementary18,940
- Van Hornesville-Owen D. Young Central School District1,551
- Vestal Central School District34,695
- Victor Central School District27,893
- Voorheesville Central School District7,931
- Wainscott Common School District621
- Wallkill Central School District18,884
- Walton Central School District6,238
- Wantagh Union Free School District17,763
- Wappingers Central School District74,447
- Warrensburg Central School District5,470
- Warsaw Central School District6,410
- Warwick Valley Central School District24,659
- Washingtonville Central School District25,609
- Waterford-Halfmoon Union Free School District6,026
- Waterloo Central School District10,885
- Watertown City School District29,043
- Waterville Central School District5,568
- Watervliet City School District11,365
- Watkins Glen Central School District7,637
- Waverly Central School District9,185
- Wayland-Cohocton Central School District9,144
- Wayne Central School District15,392
- Webster Central School District60,669
- Weedsport Central School District5,213
- Wells Central School District994
- Wellsville Central School District8,852
- West Babylon Union Free School District28,146
- West Canada Valley Central School District4,406
- West Genesee Central School District31,379
- West Hempstead Union Free School District18,694
- West Irondequoit Central School District22,969
- West Islip Union Free School District27,000
- West Seneca Central School District53,502
- West Valley Central School District1,798
- Westbury Union Free School District27,146
- Westfield Central School District4,692
- Westhampton Beach Union Free School District7,320
- Westhill Central School District13,772
- Westmoreland Central School District6,789
- Wheatland-Chili Central School District5,481
- Wheelerville Union Free School Districtelementary1,059
- White Plains City School District60,666
- Whitehall Central School District4,739
- Whitesboro Central School District25,640
- Whitesville Central School District817
- Whitney Point Central School District8,568
- William Floyd Union Free School District51,815
- Williamson Central School District6,622
- Williamsville Central School District76,350
- Willsboro Central School District2,540
- Wilson Central School District8,392
- Windham-Ashland-Jewett Central School District2,993
- Windsor Central School District10,417
- Worcester Central School District2,381
- Wynantskill Union Free School District3,027
- Wyoming Central School District1,624
- Yonkers City School District209,978
- York Central School District4,845
- Yorkshire-Pioneer Central School District16,414
- Yorktown Central School District20,089
Congressional districts
As drawn for the 119th Congress (2025–2027).
- Congressional District 1778,092
- Congressional District 2782,282
- Congressional District 3770,395
- Congressional District 4773,177
- Congressional District 5789,687
- Congressional District 6733,304
- Congressional District 7753,548
- Congressional District 8759,088
- Congressional District 9737,304
- Congressional District 10733,272
- Congressional District 11752,901
- Congressional District 12719,940
- Congressional District 13778,141
- Congressional District 14718,731
- Congressional District 15751,695
- Congressional District 16775,704
- Congressional District 17777,627
- Congressional District 18786,484
- Congressional District 19774,788
- Congressional District 20782,695
- Congressional District 21770,419
- Congressional District 22767,369
- Congressional District 23770,072
- Congressional District 24771,272
- Congressional District 25771,484
- Congressional District 26772,895
State senate districts
The upper chamber’s districts, as drawn in 2024.
- State Senate District 1323,808
- State Senate District 2320,156
- State Senate District 3331,477
- State Senate District 4329,895
- State Senate District 5323,277
- State Senate District 6326,702
- State Senate District 7323,251
- State Senate District 8319,602
- State Senate District 9321,569
- State Senate District 10333,501
- State Senate District 11308,020
- State Senate District 12297,947
- State Senate District 13291,182
- State Senate District 14323,460
- State Senate District 15316,236
- State Senate District 16293,961
- State Senate District 17282,594
- State Senate District 18313,282
- State Senate District 19303,641
- State Senate District 20319,088
- State Senate District 21295,441
- State Senate District 22299,909
- State Senate District 23307,986
- State Senate District 24325,834
- State Senate District 25326,455
- State Senate District 26315,682
- State Senate District 27296,624
- State Senate District 28288,654
- State Senate District 29312,001
- State Senate District 30323,796
- State Senate District 31320,471
- State Senate District 32309,949
- State Senate District 33298,268
- State Senate District 34303,584
- State Senate District 35317,138
- State Senate District 36311,373
- State Senate District 37318,723
- State Senate District 38327,050
- State Senate District 39321,709
- State Senate District 40317,852
- State Senate District 41323,331
- State Senate District 42322,917
- State Senate District 43314,964
- State Senate District 44330,722
- State Senate District 45320,803
- State Senate District 46317,064
- State Senate District 47307,948
- State Senate District 48321,245
- State Senate District 49318,304
- State Senate District 50316,220
- State Senate District 51324,483
- State Senate District 52316,514
- State Senate District 53318,725
- State Senate District 54316,908
- State Senate District 55318,916
- State Senate District 56317,728
- State Senate District 57321,827
- State Senate District 58322,168
- State Senate District 59294,227
- State Senate District 60326,112
- State Senate District 61316,591
- State Senate District 62315,582
- State Senate District 63307,919
Assembly districts
The lower chamber’s districts, as drawn in 2024.
- Assembly District 1129,486
- Assembly District 2136,040
- Assembly District 3136,388
- Assembly District 4127,743
- Assembly District 5136,012
- Assembly District 6137,763
- Assembly District 7124,167
- Assembly District 8134,194
- Assembly District 9130,483
- Assembly District 10129,316
- Assembly District 11138,372
- Assembly District 12128,163
- Assembly District 13128,255
- Assembly District 14133,508
- Assembly District 15132,837
- Assembly District 16139,169
- Assembly District 17129,463
- Assembly District 18136,065
- Assembly District 19135,396
- Assembly District 20129,348
- Assembly District 21139,409
- Assembly District 22128,160
- Assembly District 23147,825
- Assembly District 24136,161
- Assembly District 25118,412
- Assembly District 26128,700
- Assembly District 27123,443
- Assembly District 28139,145
- Assembly District 29136,472
- Assembly District 30118,897
- Assembly District 31132,006
- Assembly District 32131,317
- Assembly District 33132,414
- Assembly District 34130,703
- Assembly District 35116,135
- Assembly District 36126,089
- Assembly District 37132,053
- Assembly District 38129,048
- Assembly District 39126,032
- Assembly District 40118,200
- Assembly District 41130,607
- Assembly District 42119,952
- Assembly District 43135,808
- Assembly District 44138,292
- Assembly District 45120,467
- Assembly District 46138,919
- Assembly District 47131,078
- Assembly District 48131,265
- Assembly District 49113,593
- Assembly District 50146,502
- Assembly District 51122,727
- Assembly District 52144,543
- Assembly District 53128,326
- Assembly District 54121,657
- Assembly District 55134,599
- Assembly District 56145,408
- Assembly District 57142,677
- Assembly District 58117,584
- Assembly District 59112,820
- Assembly District 60127,359
- Assembly District 61130,890
- Assembly District 62139,301
- Assembly District 63140,042
- Assembly District 64135,700
- Assembly District 65129,355
- Assembly District 66130,171
- Assembly District 67137,319
- Assembly District 68141,870
- Assembly District 69138,838
- Assembly District 70140,871
- Assembly District 71143,378
- Assembly District 72132,037
- Assembly District 73127,378
- Assembly District 74128,796
- Assembly District 75126,530
- Assembly District 76129,354
- Assembly District 77127,052
- Assembly District 78125,246
- Assembly District 79129,369
- Assembly District 80127,284
- Assembly District 81124,919
- Assembly District 82127,286
- Assembly District 83132,556
- Assembly District 84134,648
- Assembly District 85130,329
- Assembly District 86132,471
- Assembly District 87113,619
- Assembly District 88137,568
- Assembly District 89134,960
- Assembly District 90140,484
- Assembly District 91140,759
- Assembly District 92139,106
- Assembly District 93142,972
- Assembly District 94132,975
- Assembly District 95128,960
- Assembly District 96135,766
- Assembly District 97138,616
- Assembly District 98133,834
- Assembly District 99134,913
- Assembly District 100133,157
- Assembly District 101137,192
- Assembly District 102136,713
- Assembly District 103134,151
- Assembly District 104137,605
- Assembly District 105136,198
- Assembly District 106138,394
- Assembly District 107129,616
- Assembly District 108129,883
- Assembly District 109134,773
- Assembly District 110132,778
- Assembly District 111130,020
- Assembly District 112136,299
- Assembly District 113138,523
- Assembly District 114130,753
- Assembly District 115138,599
- Assembly District 116135,672
- Assembly District 117130,325
- Assembly District 118136,440
- Assembly District 119130,231
- Assembly District 120134,438
- Assembly District 121130,510
- Assembly District 122138,724
- Assembly District 123133,207
- Assembly District 124132,819
- Assembly District 125134,489
- Assembly District 126133,030
- Assembly District 127131,149
- Assembly District 128128,269
- Assembly District 129130,523
- Assembly District 130136,155
- Assembly District 131137,133
- Assembly District 132133,928
- Assembly District 133135,429
- Assembly District 134131,714
- Assembly District 135131,706
- Assembly District 136133,792
- Assembly District 137134,214
- Assembly District 138139,846
- Assembly District 139131,186
- Assembly District 140130,058
- Assembly District 141124,779
- Assembly District 142129,956
- Assembly District 143132,935
- Assembly District 144135,448
- Assembly District 145132,557
- Assembly District 146130,546
- Assembly District 147141,366
- Assembly District 148130,604
- Assembly District 149132,659
- Assembly District 150127,381
PUMAs
Public Use Microdata Areas: areas of 100,000 people or more that the state draws from census tracts, for the Census Bureau’s microdata.
- Albany County (East Central)–Albany City PUMA108,861
- Albany County (Outside Albany City) PUMA208,157
- Broome County (West Central)–Greater Binghamton City & Greater Johnson City Village PUMA128,457
- Cattaraugus & Allegany Counties PUMA123,304
- Cayuga & Onondaga (South) Counties PUMA109,262
- Chautauqua County PUMA125,544
- Chenango, Delaware Counties & Broome County outside Greater Binghamton City PUMA159,729
- Clinton, Franklin, Essex & Hamilton Counties PUMA167,251
- Columbia & Greene Counties PUMA108,509
- Dutchess County (North & East) PUMA116,800
- Dutchess County (Southwest)–Fishkill & Wappinger town PUMA143,604
- Erie County (Central) PUMA154,045
- Erie County (North Central) PUMA130,546
- Erie County (Northeast) PUMA113,632
- Erie County (Northwest) PUMA108,368
- Erie County (South) PUMA167,177
- Erie County (West Central)–Buffalo City (East) PUMA154,842
- Erie County (West Central)–Buffalo City (West) PUMA122,012
- Fulton & Montgomery Counties PUMA102,015
- Genesee, Orleans & Wyoming Counties PUMA137,148
- Herkimer (North & Central) & Oneida (Outer) Counties PUMA108,227
- Jefferson & Lewis Counties PUMA141,647
- Livingston & Ontario Counties PUMA174,123
- Madison & Cortland Counties PUMA113,574
- Monroe County (Central)–Greece & Gates Towns PUMA124,403
- Monroe County (Central)–Rochester City (East) PUMA106,194
- Monroe County (Central)–Rochester City (West) PUMA102,151
- Monroe County (East) PUMA135,275
- Monroe County (North & West) PUMA104,626
- Monroe County (South) PUMA181,104
- Nassau County (Central)–Hempstead Town (East Central) PUMA104,667
- Nassau County (Central)–Hempstead Town (North Central)–Meadowbrook Corridor PUMA154,922
- Nassau County (Central)–Hempstead Town (Northeast) PUMA113,077
- Nassau County (East Central)–Oyster Bay Town (Central) PUMA105,205
- Nassau County (Northeast)–Oyster Bay Town (North) & Glen Cove City PUMA114,036
- Nassau County (Northwest)–North Hempstead Town (North) PUMA119,143
- Nassau County (South Central)–Hempstead Town (Southeast) PUMA107,446
- Nassau County (Southeast)–Oyster Bay Town (South) PUMA108,380
- Nassau County (Southwest)–Hempstead Town (Southwest) & Long Beach City PUMA111,050
- Nassau County (West Central)–Hempstead Town (Northwest) PUMA118,824
- Nassau County (West Central)–Hempstead Town (West Central) PUMA114,972
- Nassau County (West Central)–North Hempstead Town (South) PUMA117,869
- Niagara County (North & East) PUMA106,190
- Niagara County (Southwest)–Greater Niagara Falls & North Tonawanda Area PUMA104,531
- NYC-Bronx Community District 4–Highbridge & Concourse PUMA146,986
- NYC-Bronx Community District 5–Morris Heights & Mount Hope PUMA131,607
- NYC-Bronx Community District 7–Fordham, Bedford Park, & Norwood PUMA127,686
- NYC-Bronx Community District 8–Riverdale, Kingsbridge, & Marble Hill PUMA97,765
- NYC-Bronx Community District 9–Soundview & Parkchester PUMA168,884
- NYC-Bronx Community District 10–Co-op City & Throgs Neck PUMA127,088
- NYC-Bronx Community District 11–Pelham Parkway & Morris Park PUMA113,929
- NYC-Bronx Community District 12–Wakefield, Williamsbridge, & Eastchester PUMA158,428
- NYC-Bronx Community Districts 1 & 2–Melrose, Mott Haven, Longwood, & Hunts Point PUMA154,955
- NYC-Bronx Community Districts 3 & 6–Morrisania, Tremont, Belmont, & West Farms PUMA177,451
- NYC-Brooklyn Community District 1–Williamsburg & Greenpoint PUMA208,119
- NYC-Brooklyn Community District 2–Downtown Brooklyn & Fort Greene PUMA128,393
- NYC-Brooklyn Community District 3–Bedford-Stuyvesant PUMA182,837
- NYC-Brooklyn Community District 4–Bushwick PUMA112,557
- NYC-Brooklyn Community District 5–East New York & Cypress Hills PUMA198,737
- NYC-Brooklyn Community District 6–Park Slope & Carroll Gardens PUMA120,019
- NYC-Brooklyn Community District 7–Sunset Park & Windsor Terrace PUMA120,461
- NYC-Brooklyn Community District 8–Crown Heights (North) PUMA109,788
- NYC-Brooklyn Community District 9–Crown Heights (South) PUMA98,347
- NYC-Brooklyn Community District 10–Bay Ridge & Dyker Heights PUMA124,966
- NYC-Brooklyn Community District 11–Bensonhurst & Bath Beach PUMA181,185
- NYC-Brooklyn Community District 12–Borough Park & Kensington PUMA196,315
- NYC-Brooklyn Community District 13–Coney Island & Brighton Beach PUMA111,396
- NYC-Brooklyn Community District 14–Flatbush & Midwood PUMA154,853
- NYC-Brooklyn Community District 15–Sheepshead Bay & Gravesend (East) PUMA152,473
- NYC-Brooklyn Community District 16–Ocean Hill & Brownsville PUMA101,832
- NYC-Brooklyn Community District 17–East Flatbush PUMA148,116
- NYC-Brooklyn Community District 18–Canarsie & Flatlands PUMA181,186
- NYC-Manhattan Community District 3–Lower East Side & Chinatown PUMA154,628
- NYC-Manhattan Community District 4–Chelsea & Hell's Kitchen PUMA117,703
- NYC-Manhattan Community District 7–Upper West Side PUMA221,194
- NYC-Manhattan Community District 8–Upper East Side & Roosevelt Island PUMA211,810
- NYC-Manhattan Community District 9–Morningside Heights & Hamilton Heights PUMA112,952
- NYC-Manhattan Community District 10–Harlem PUMA135,011
- NYC-Manhattan Community District 11–East Harlem PUMA127,516
- NYC-Manhattan Community District 12–Washington Heights & Inwood PUMA197,225
- NYC-Manhattan Community Districts 1 & 2–Financial District & Greenwich Village PUMA155,522
- NYC-Manhattan Community Districts 5 & 6–Midtown, East Midtown, & Flatiron PUMA195,916
- NYC-Queens Community District 1–Astoria & Queensbridge PUMA176,862
- NYC-Queens Community District 2–Long Island City, Sunnyside, & Woodside PUMA124,290
- NYC-Queens Community District 3–Jackson Heights & East Elmhurst PUMA161,589
- NYC-Queens Community District 4–Elmhurst & Corona PUMA167,356
- NYC-Queens Community District 5–Ridgewood, Maspeth, & Middle Village PUMA177,081
- NYC-Queens Community District 6–Forest Hills & Rego Park PUMA123,365
- NYC-Queens Community District 7–Flushing, Murray Hill, & Whitestone PUMA249,029
- NYC-Queens Community District 8–Fresh Meadows, Hillcrest, & Briarwood PUMA151,100
- NYC-Queens Community District 9–Kew Gardens, Richmond Hill, & Woodhaven PUMA146,302
- NYC-Queens Community District 10–South Ozone Park & Howard Beach PUMA136,010
- NYC-Queens Community District 11–Auburndale, Bayside, & Douglaston PUMA120,166
- NYC-Queens Community District 12–Jamaica, St. Albans, & Hollis PUMA253,804
- NYC-Queens Community District 13–Queens Village, Bellerose, & Rosedale PUMA204,843
- NYC-Queens Community District 14–The Rockaways PUMA131,255
- NYC-Staten Island Community District 1–North Shore PUMA182,594
- NYC-Staten Island Community District 2–Mid-Island PUMA141,510
- NYC-Staten Island Community District 3–South Shore PUMA170,852
- Oneida County (Central)–Greater Utica & Rome Cities PUMA162,544
- Onondaga County (Central)–Syracuse City (Outer) PUMA163,420
- Onondaga County (Central)–Syracuse City PUMA146,384
- Onondaga County (North) PUMA127,165
- Orange County (Northeast)–Greater Newburgh City PUMA124,419
- Orange County (Northwest) PUMA129,723
- Orange County (Southeast) PUMA152,474
- Oswego County PUMA117,953
- Otsego, Schoharie, Oneida (South) & Herkimer (South) Counties PUMA108,267
- Putnam County & Southern Dutchess County PUMA135,923
- Rensselaer County–Troy City PUMA160,332
- Rockland County (North)–New City & Congers PUMA105,585
- Rockland County (South)–Orangetown, Clarkstown (South) & Ramapo (Southeast) Towns PUMA109,079
- Rockland County (West)–Spring Valley, Suffern Villages & Monsey PUMA127,219
- Saratoga County (Outer) PUMA121,913
- Saratoga County (South & Central) PUMA116,371
- Schenectady County–Schenectady City PUMA160,369
- St. Lawrence County PUMA107,226
- Steuben (outside Corning City), Schuyler, Chemung (North) & Tioga (North) Counties PUMA112,562
- Suffolk County (Central)–Brookhaven Town (Central) PUMA126,181
- Suffolk County (Central)–Brookhaven Town (West Central) PUMA111,120
- Suffolk County (Central)–Islip Town (East) PUMA98,956
- Suffolk County (Central)–Islip Town (Northwest) PUMA133,647
- Suffolk County (East) PUMA162,070
- Suffolk County (North Central)–Brookhaven Town (North) PUMA115,527
- Suffolk County (Northwest)–Huntington Town (North) PUMA99,381
- Suffolk County (Northwest)–Huntington Town (South) PUMA104,678
- Suffolk County (Northwest)–Smithtown Town PUMA116,097
- Suffolk County (South Central)–Brookhaven Town (South) PUMA137,724
- Suffolk County (Southwest)–Babylon Town (Southeast) PUMA101,357
- Suffolk County (Southwest)–Islip Town (South) PUMA106,503
- Suffolk County (West Central)–Babylon Town (Northwest) PUMA116,905
- Sullivan & Ulster (West) Counties PUMA113,657
- Tioga (South), Chemung (South) & Steuben (East) Counties–Elmira & Corning Cities PUMA127,599
- Tompkins County PUMA104,537
- Ulster County (East) PUMA148,665
- Warren & Washington Counties PUMA126,039
- Wayne & Seneca & Yates Counties PUMA148,375
- Westchester County (Central) PUMA112,000
- Westchester County (Northeast) PUMA137,091
- Westchester County (Northwest) PUMA151,464
- Westchester County (South Central East)–Mount Vernon City PUMA119,350
- Westchester County (South Central West)–New Rochelle City PUMA121,737
- Westchester County (Southeast)–White Plains & Rye City PUMA148,057
- Westchester County (Southwest)–Yonkers City PUMA209,978
Urban areas
Each that reaches into New York, with its whole population. Urban areas are the densely settled land the Census Bureau draws after each census, whatever the city lines.
- Albany–Schenectady, NY598,717
- Albion, NY7,028
- Amsterdam, NY21,337
- Auburn, NY30,365
- Batavia, NY16,886
- Bath, NY6,498
- Binghamton, NY154,194
- Bradford, PA–NY10,854
- Bridgeport–Stamford, CT–NY924,041
- Brockport, NY12,856
- Buffalo, NY945,701
- Canajoharie–Fort Plain, NY5,484
- Canandaigua, NY18,702
- Canastota, NY5,589
- Canton, NY6,827
- Carthage, NY5,570
- Catskill, NY6,670
- Chester, NY5,781
- Chittenango, NY5,240
- Clayton, NY2,132
- Clifton Springs, NY6,371
- Cobleskill, NY5,550
- Collins, NY3,898
- Conesus Lake, NY4,672
- Corinth, NY3,650
- Corning, NY20,012
- Cortland, NY24,564
- Coxsackie, NY4,991
- Danbury, CT–NY172,957
- Dansville, NY4,679
- Dunkirk–Fredonia, NY23,264
- East Aurora, NY9,285
- East Hampton North–Springs–Northwest Harbor, NY22,439
- Ellenville, NY6,614
- Elmira, NY61,238
- Fire Island, NY371
- Fulton, NY12,603
- Geneseo, NY8,026
- Geneva, NY28,845
- Glens Falls, NY71,963
- Gloversville, NY25,948
- Hilton, NY7,939
- Hornell, NY10,994
- Hudson, NY10,549
- Ilion–Herkimer, NY22,921
- Ithaca, NY58,571
- Jamestown, NY43,488
- Kingston, NY48,959
- Kiryas Joel, NY77,524
- Lake Erie Beach, NY7,627
- Lake Placid, NY3,340
- Le Roy, NY4,705
- Liberty, NY5,277
- Little Falls, NY4,552
- Lockport, NY35,219
- Malone, NY6,411
- Massena, NY11,283
- Mechanicville, NY12,164
- Medina, NY6,150
- Middletown, NY61,145
- Montauk, NY3,646
- Monticello, NY12,742
- New Paltz, NY11,092
- New York–Jersey City–Newark, NY–NJ19.1M
- Newark, NY13,448
- Norwich, NY7,678
- Ogdensburg, NY9,721
- Olean, NY21,419
- Oneida, NY12,506
- Oneonta, NY18,206
- Oswego, NY24,826
- Owego, NY4,424
- Palmyra, NY4,462
- Penn Yan, NY8,242
- Perry, NY4,497
- Plattsburgh, NY29,105
- Port Jervis, NY–PA17,050
- Potsdam, NY8,417
- Poughkeepsie–Newburgh, NY314,334
- Ravena–Bethlehem, NY8,537
- Riverhead–Southold, NY52,098
- Rochester, NY700,727
- Rome, NY28,827
- Salamanca, NY6,092
- Saranac Lake, NY5,198
- Saratoga Springs, NY77,375
- Sayre–Waverly, PA–NY16,941
- Sidney, NY4,531
- Silver Creek, NY3,545
- Sullivan–Sylvan Beach, NY3,327
- Syracuse, NY409,716
- Tupper Lake, NY3,442
- Utica, NY116,762
- Walden, NY16,484
- Warwick, NY7,149
- Watertown, NY51,282
- Wellsville, NY5,612
- West Milford, NJ–NY17,757
- West Point–Highland Falls, NY11,502
Tribal areas
Each that reaches into New York, with its whole population.
- Allegany Reservation, NY6,005
- Cattaraugus Reservation, NY1,977
- Cayuga Nation TDSA, NY2,999
- Oneida Indian Nation Reservation, NY61,992
- Onondaga Nation Reservation, NY338
- Poospatuck (state) Reservation, NY742
- Shinnecock (state) Reservation, NY450
- St. Regis Mohawk Reservation, NY3,661
- Tonawanda Reservation, NY224
- Tuscarora Nation Reservation, NY642
Turn New York into your planning report.
Social Explorer Studio builds an editable profile of any place, with tables and charts beside the county and state, and exports to Word, PDF and Excel.
Questions about New York
What is the population of New York?
20,002,427 people, according to the ACS 2025 1-year estimates, which the Census Bureau adjusts to match its own population estimate. That’s the 4th largest of the 50 states and DC.
What is the FIPS code for New York?
36. Every county’s and place’s FIPS code in New York starts with it. The Census Bureau’s full geographic identifier (GEOID) is 0400000US36.
What is the largest city in New York?
New York, with 8,584,629 people. Other large places here include Buffalo, Yonkers and Rochester.
What is the median household income in New York?
$89,210 (±$934), according to the ACS 2025 1-year estimates, higher than the US ($84,780).
What is the median age in New York?
39.8 years (±0.1), according to the ACS 2025 1-year estimates, higher than the US (39.5).
How much does housing cost in New York?
New York’s median home value is $470,900 (±$5,866) and its median gross rent is $1,704 (±$14) a month, according to the ACS 2025 1-year estimates. 49.1% (±0.7%) of its renters pay 30% or more of their income on rent.
Is New York growing?
New York’s population grew 1.0%, from 19,795,791 in 2015 to 20,002,427 in 2025, according to the ACS 1-year estimates.
Where do people who work in New York live?
8,578,463 of its 9,411,356 jobs are held by people who live here. Of those who commute in, the most come from New Jersey, Connecticut, Pennsylvania.
Where does this census data come from?
The U.S. Census Bureau’s American Community Survey, through Social Explorer’s tables: the latest 1-year estimates where they exist, for the most recent numbers, and 5-year estimates otherwise. Each table lists its code, so you can find it again.
Is this data free to use?
Yes. You can read it, cite it, download the CSV and embed the charts, with no account. To map other variables, compare your own areas or build a report, see Social Explorer’s plans in a live demo.
Sources and how to cite
American Community Survey 2025 1-year estimates, or 2020–2024 5-year estimates where noted, U.S. Census Bureau, from Social Explorer’s tables A00001, A00002, A01004, A04001, A06001, A08001, A09005, A10001, A10003, A10008, A10030, A10036, A10040, A10047, A10055, A10060, A12001, A13004, A14006, A14024, A14028, A16002, A17005, A18002, A18009, A20001, B02002, B09001, B13002, B18101, C16001. Maps by census tract use 2020–2024 5-year estimates, since the 1-year survey doesn’t cover tracts. Commuting: LEHD LODES 2023. These are estimates from a sample, each with its margin of error. Data retrieved November 14, 2026. How these profiles are made.
U.S. Census Bureau, American Community Survey 2025 1-year estimates, or 2020–2024 5-year estimates where noted, via Social Explorer. “New York.” https://www.socialexplorer.com/places/new-york. Accessed November 14, 2026.