

Iowa: Population, demographics and census data
Home to 3,238,387 people, the 31st largest of the 50 states and DC, anchored by Des Moines. It grew 3.7% between 2015 and 2025.
- Population
- 3.24M. Census Bureau estimate · Rank 31 of the 50 states and DC
- Median household income
- $76,483 ±$958. US $84,780
- Median age
- 39.4 ±0.2. US 39.5
ACS 2025 1-year estimates, U.S. Census Bureau
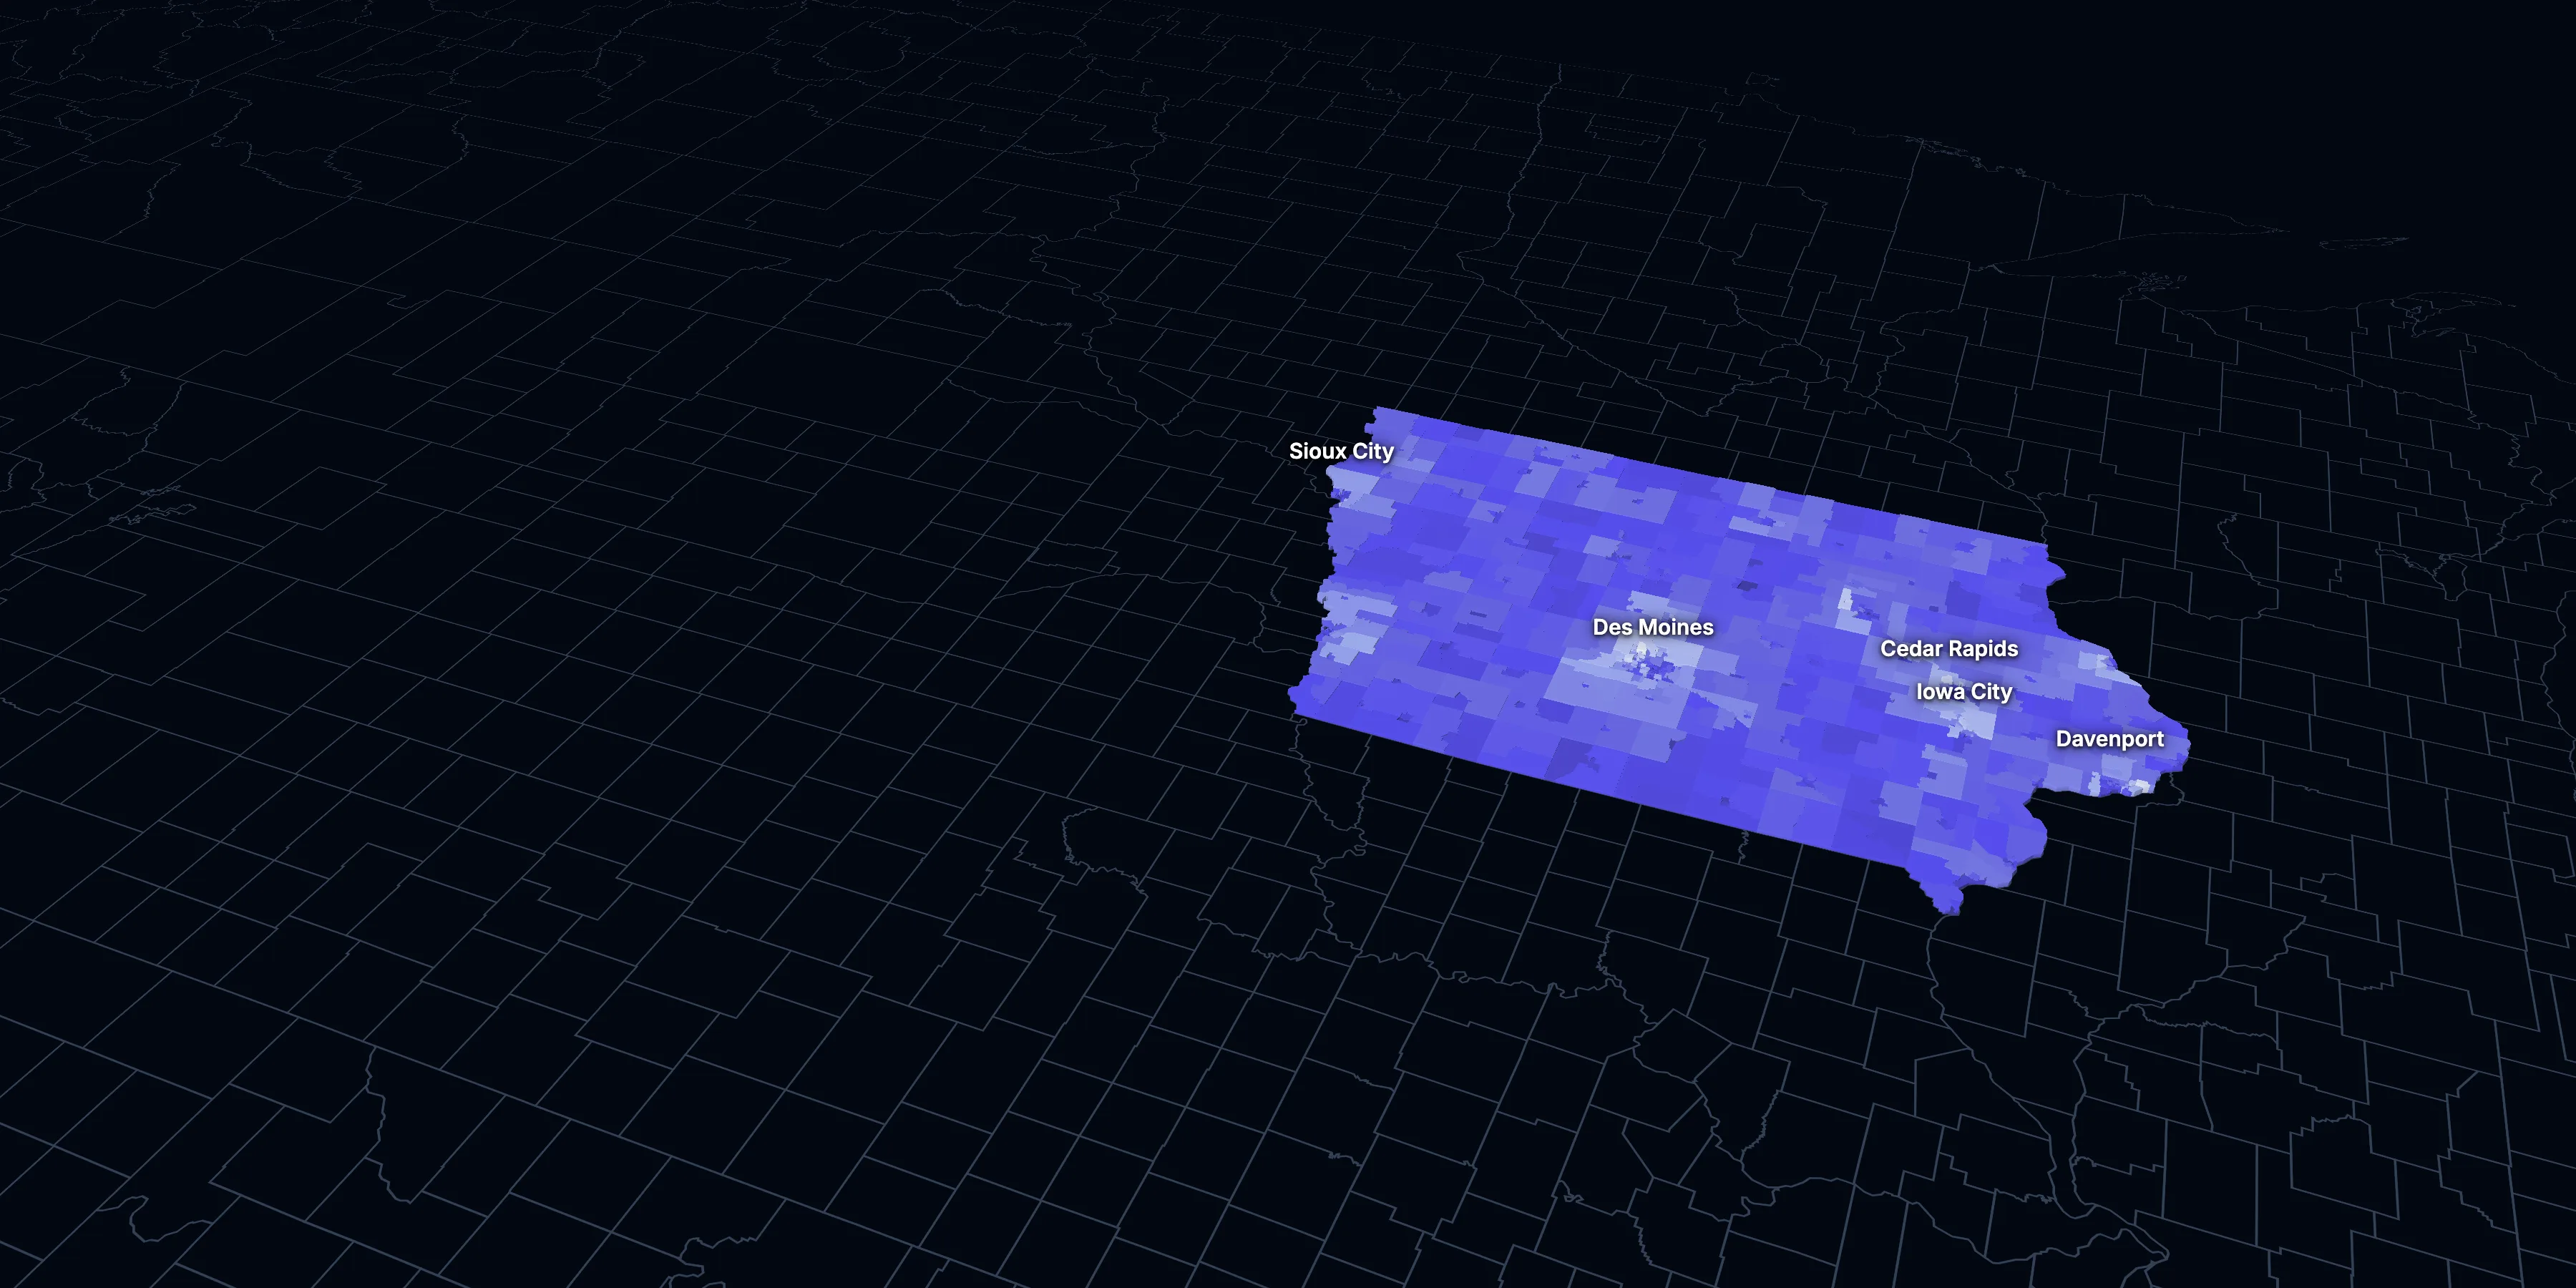
Taller, lighter tracts have higher household incomes
About Iowa
Iowa’s median household income is $76,483 (±$958), lower than the US ($84,780), and its median age is 39.4 (±0.2), according to the ACS 2025 1-year estimates. Its largest city is Des Moines.
± is each figure’s margin of error, at 90% confidence, and † marks one too uncertain to lean on. Under each percentage in the tables is the number it counts. How the margins are worked out.
FIPS code 19
Highlights
What stands out in Iowa
The numbers where Iowa sits furthest from the nation, or past a recognized policy benchmark.
Past a policy benchmark
35.8%
Very highHomes built before 1960
That’s higher than the US (24.0%). Older homes carry more lead-paint risk: the EPA found lead paint in 69% of homes built from 1940 to 1959.
Furthest from the national picture
22.2%
Lower than the USCommute 30 minutes or more
That’s lower than the US (39.2%). It’s the 7th lowest of the 50 states and DC.
$1,026
Lower than the USMedian gross rent
That’s lower than the US ($1,557). It’s the 7th lowest of the 50 states and DC.
10.2%
Very lowSpeak a language other than English at home
That’s lower than the US (22.9%).
6.6%
Very lowBorn outside the US
That’s lower than the US (14.7%).
2.31
Lower than the USPeople per household
That’s lower than the US (2.49). It’s the 7th lowest of the 50 states and DC.
2015 to 2025
How Iowa changed in ten years
The state added 114,488 people. It got older, more foreign-born and better educated, and poverty fell 1.1 points.
Population, change since 2015
+3.7% in the state and +6.3% in the US.
Source: ACS 1-year, 2015 to 2025, table A00001.
Show data
| Iowa | United States | |
|---|---|---|
| 2015 | 0.0% | 0.0% |
| 2016 | +0.3% | +0.5% |
| 2017 | +0.7% | +1.3% |
| 2018 | +1.0% | +1.8% |
| 2019 | +1.0% | +2.1% |
| 2021 | +2.2% | +3.3% |
| 2022 | +2.5% | +3.7% |
| 2023 | +2.7% | +4.2% |
| 2024 | +3.8% | +5.8% |
| 2025 | +3.7% | +6.3% |
Embed
Median household income, in 2025 dollars
+2.0% in the state and +10.9% in the US.
Source: ACS 1-year, 2015 to 2025, table A14006.
Show data
| Iowa | United States | |
|---|---|---|
| 2015 | $74,989 | $76,413 |
| 2016 | $76,078 | $77,931 |
| 2017 | $77,553 | $79,891 |
| 2018 | $77,497 | $80,059 |
| 2019 | $78,322 | $83,427 |
| 2021 | $78,588 | $83,521 |
| 2022 | $77,087 | $82,811 |
| 2023 | $75,996 | $82,683 |
| 2024 | $78,031 | $84,339 |
| 2025 | $76,483 | $84,780 |
Embed
Living in poverty
−1.1 points in the state and −3.0 points in the US.
Source: ACS 1-year, 2015 to 2025, table A13004.
Show data
| Iowa | United States | |
|---|---|---|
| 2015 | 12.2% | 14.7% |
| 2016 | 11.8% | 14.0% |
| 2017 | 10.7% | 13.4% |
| 2018 | 11.2% | 13.1% |
| 2019 | 11.2% | 12.3% |
| 2021 | 11.1% | 12.8% |
| 2022 | 11.0% | 12.6% |
| 2023 | 11.3% | 12.5% |
| 2024 | 11.3% | 12.1% |
| 2025 | 11.0% | 11.8% |
Embed
Bachelor’s degree or more
+5.8 points in the state and +6.7 points in the US.
Source: ACS 1-year, 2015 to 2025, table A12001.
Show data
| Iowa | United States | |
|---|---|---|
| 2015 | 26.8% | 30.6% |
| 2016 | 28.4% | 31.3% |
| 2017 | 28.9% | 32.0% |
| 2018 | 29.0% | 32.6% |
| 2019 | 29.3% | 33.1% |
| 2021 | 30.5% | 35.0% |
| 2022 | 32.3% | 35.7% |
| 2023 | 31.5% | 36.2% |
| 2024 | 32.1% | 36.8% |
| 2025 | 32.6% | 37.4% |
Embed
Median gross rent, in 2025 dollars
+4.3% in the state and +18.5% in the US.
Source: ACS 1-year, 2015 to 2025, table A18009.
Show data
| Iowa | United States | |
|---|---|---|
| 2015 | $984 | $1,314 |
| 2016 | $1,002 | $1,327 |
| 2017 | $1,006 | $1,340 |
| 2018 | $1,004 | $1,368 |
| 2019 | $1,026 | $1,393 |
| 2021 | $1,015 | $1,427 |
| 2022 | $987 | $1,440 |
| 2023 | $1,010 | $1,496 |
| 2024 | $1,014 | $1,537 |
| 2025 | $1,026 | $1,557 |
Embed
Median home value, in 2025 dollars
+27.1% in the state and +39.3% in the US.
Source: ACS 1-year, 2015 to 2025, table A10036.
Show data
| Iowa | United States | |
|---|---|---|
| 2015 | $186,460 | $266,469 |
| 2016 | $192,471 | $277,278 |
| 2017 | $197,423 | $288,124 |
| 2018 | $196,474 | $296,908 |
| 2019 | $201,738 | $305,336 |
| 2021 | $208,930 | $337,116 |
| 2022 | $215,571 | $355,481 |
| 2023 | $226,925 | $361,931 |
| 2024 | $234,918 | $372,685 |
| 2025 | $237,000 | $371,100 |
Embed
ACS 1-year estimates. The dotted stretch of each line spans 2020, when the Census Bureau released no standard 1-year estimates. Dollar values are in 2025 dollars.
| Indicator | 2015 | 2025 | Change |
|---|---|---|---|
| Population | 3,123,899 | 3,238,387 | +3.7% |
| Median age | 38.1 | 39.4 | +1.3 years |
| 65 and over | 16.0% | 20.0% | +4.0 points |
| Born outside the US | 4.8% | 6.6% | +1.8 points |
| Hispanic or Latino | 5.6% | 7.9% | +2.3 points |
| Median household income | $74,989 | $76,483 | +2.0% |
| Living in poverty | 12.2% | 11.0% | −1.1 points |
| Bachelor’s degree or more | 26.8% | 32.6% | +5.8 points |
| Households that rent | 29.3% | 28.6% | −0.7 points |
| Median gross rent | $984 | $1,026 | +4.3% |
| Median home value | $186,460 | $237,000 | +27.1% |
896 census tracts
Iowa, tract by tract
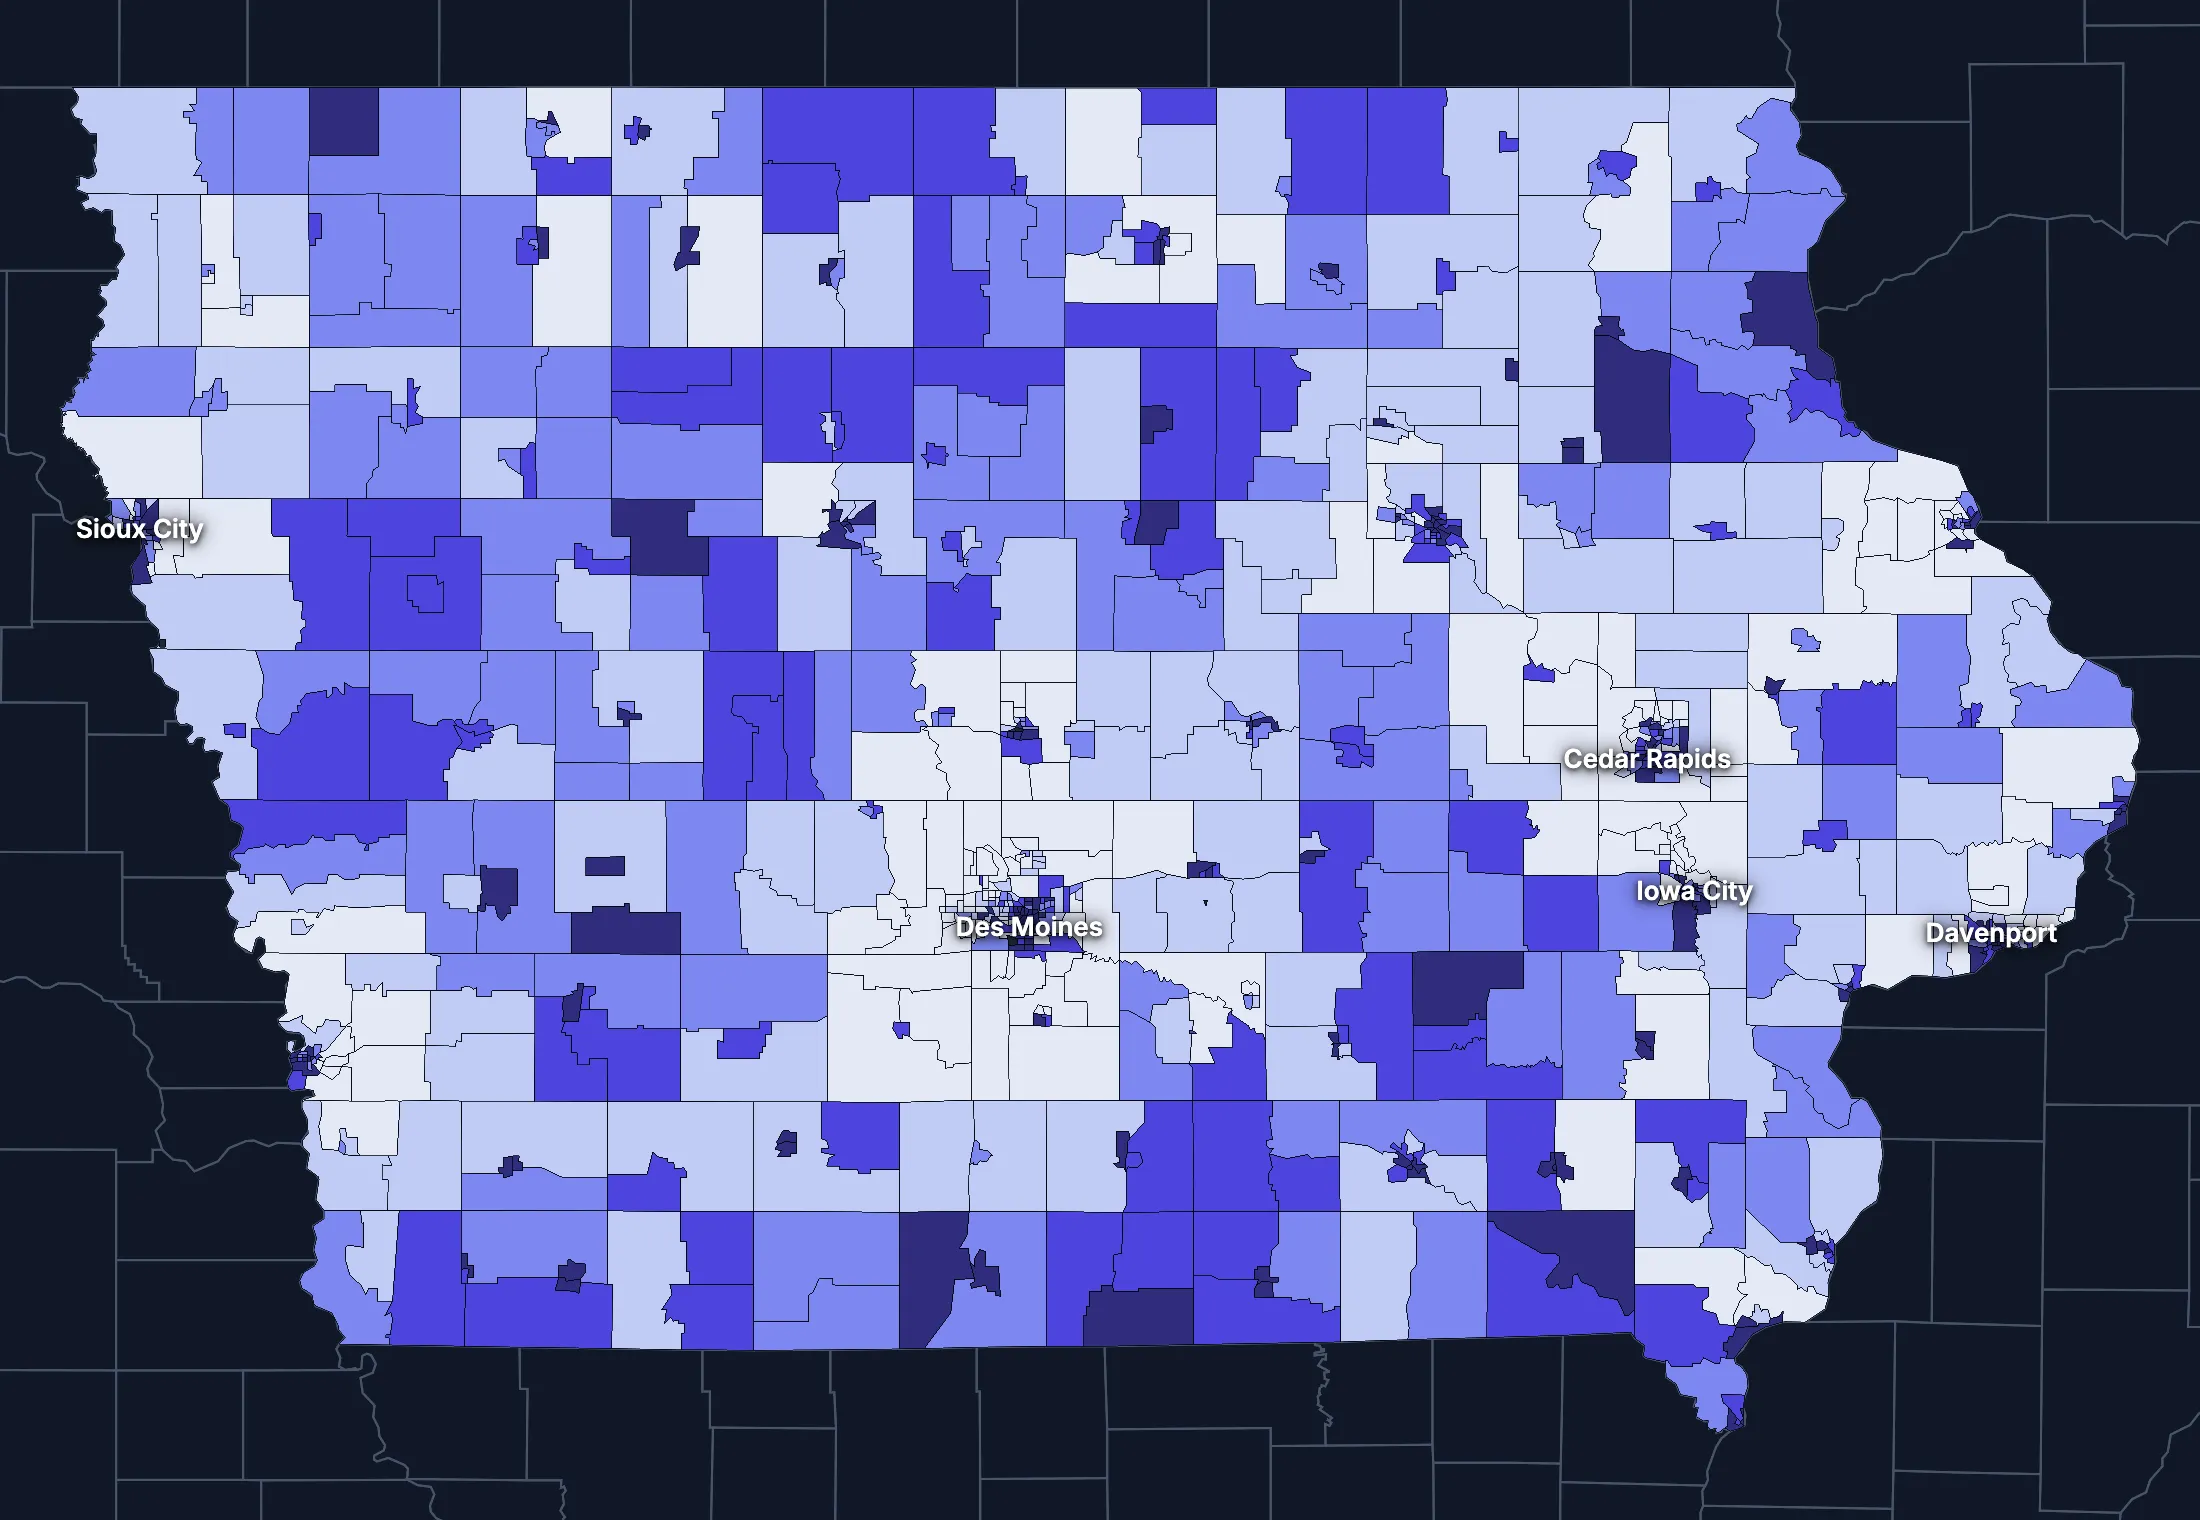
State averages hide a lot. These census tracts are the closest the census comes to neighborhoods.
Where the state’s average misleads
Each tick is one census tract, and the dark line marks the state. Hover over a tick or tap it to see the tract.
Poverty
164 of 892 tracts are at least 1.5 times the state’s overall 11.1%, and 219 are at two-thirds of it or less.
Highest: Tract 11.02, 78.4%. Lowest: Tract 112.03, 0.7%.
Renters paying 30% or more of income
71 of 880 tracts are at least 1.5 times the state’s overall 40.5%, and 270 are at two-thirds of it or less.
Highest: Tract 12, 89.2%. Lowest: Tract 9506, 0.0%.
Adults with a bachelor’s degree
121 of 893 tracts are at least 1.5 times the state’s overall 31.4%, and 304 are at two-thirds of it or less.
Highest: Tract 8, 100.0%. Lowest: Tract 9800, 0.4%.
Median household income
76 of 892 tracts are at least 1.5 times the typical tract’s $72,837, and 65 are at two-thirds of it or less.
Highest: Tract 114.05, $198,056. Lowest: Tract 16.01, $18,520.
American Community Survey 2020–2024 5-year estimates, by census tract. Income is capped at $250,000+ by the Census Bureau.
People
Who lives in Iowa
Its median age of 39.4 is about the same as the US (39.5). 6.6% of residents were born outside the US, and 10.2% speak a language other than English at home.
Age
Source: ACS 2025 1-year, table A01001.
Show data
| Iowa | United States | |
|---|---|---|
| Under 18 | 22.1% ±0.3% , number 717,168 ±10,220 | 21.0% ±<0.1% , number 71,689,151 ±111,800 |
| 18 to 24 | 9.9% ±0.3% , number 319,591 ±8,211 | 9.3% ±<0.1% , number 31,716,680 ±98,660 |
| 25 to 34 | 12.3% ±0.2% , number 396,774 ±5,286 | 13.6% ±<0.1% , number 46,357,354 ±55,690 |
| 35 to 44 | 12.8% ±0.3% , number 415,776 ±8,429 | 13.4% ±<0.1% , number 45,746,189 ±105,700 |
| 45 to 54 | 11.1% ±0.2% , number 358,680 ±5,211 | 11.8% ±<0.1% , number 40,257,563 ±53,540 |
| 55 to 64 | 11.8% ±0.3% , number 382,714 ±8,095 | 12.1% ±<0.1% , number 41,242,904 ±104,700 |
| 65 to 74 | 11.2% ±0.2% , number 363,595 ±6,996 | 10.8% ±<0.1% , number 36,895,650 ±91,520 |
| 75 and over | 8.8% ±0.2% , number 284,089 ±6,975 | 8.2% ±<0.1% , number 27,879,368 ±78,140 |
Embed
Race and ethnicity
Source: ACS 2025 1-year, table A04001.
Show data
| Iowa | United States | |
|---|---|---|
| White, not Hispanic | 80.2% ±0.2% , number 2,597,202 ±5,208 | 55.0% ±<0.1% , number 187,959,031 ±58,340 |
| Hispanic or Latino | 7.9% ±0.1% , number 255,322 ±1,951 | 20.5% ±<0.1% , number 69,975,516 ±13,270 |
| Black, not Hispanic | 4.3% ±0.2% , number 137,778 ±6,340 | 11.7% ±<0.1% , number 40,096,453 ±106,200 |
| Asian, not Hispanic | 2.5% ±0.1% , number 82,362 ±4,016 | 6.5% ±<0.1% , number 22,096,709 ±58,340 |
| Other or multiracial | 5.1% ±0.3% , number 165,723 ±9,064 | 6.3% ±<0.1% , number 21,657,150 ±150,100 |
Embed
Language spoken at home
Source: ACS 2025 1-year, table C16001.
Show data
| Iowa | United States | |
|---|---|---|
| English only | 89.8% ±0.4% , number 2,746,549 ±12,630 | 77.1% ±0.1% , number 249,390,588 ±275,300 |
| Spanish | 5.1% ±0.3% , number 157,348 ±7,968 | 13.9% ±0.1% , number 44,921,985 ±177,800 |
| Other Indo-European | 2.3% ±0.3% , number 68,964 ±8,013 | 4.0% ±<0.1% , number 12,862,980 ±113,500 |
| Asian and Pacific Island | 1.6% ±0.2% , number 50,321 ±6,085 | 3.8% ±<0.1% , number 12,288,841 ±99,740 |
| Arabic and other | 1.2% ±0.2% , number 35,212 ±6,578 | 1.3% ±<0.1% , number 4,116,949 ±71,480 |
Embed
Marital status
Source: ACS 2025 1-year, table A11001.
Show data
| Iowa | United States | |
|---|---|---|
| Now married | 50.8% ±0.6% , number 1,347,411 ±15,010 | 47.9% ±0.1% , number 135,567,564 ±223,300 |
| Never married | 31.3% ±0.5% , number 830,706 ±12,080 | 34.8% ±0.1% , number 98,647,238 ±152,600 |
| Divorced | 10.5% ±0.3% , number 277,182 ±8,358 | 10.2% ±<0.1% , number 28,879,967 ±112,900 |
| Widowed | 6.2% ±0.2% , number 163,581 ±5,296 | 5.5% ±<0.1% , number 15,599,094 ±69,430 |
| Separated | 1.2% ±0.1% , number 32,636 ±3,472 | 1.6% ±<0.1% , number 4,441,399 ±49,160 |
Embed
Where people lived a year ago
Source: ACS 2025 1-year, table A08001.
Show data
| Iowa | United States | |
|---|---|---|
| Same home | 88.6% ±0.5% , number 2,840,082 ±15,920 | 88.4% ±0.1% , number 298,889,697 ±214,800 |
| Same county | 5.5% ±0.4% , number 177,059 ±11,630 | 6.0% ±<0.1% , number 20,202,671 ±166,300 |
| Another county in the state | 3.4% ±0.2% , number 109,412 ±7,700 | 3.0% ±<0.1% , number 10,168,097 ±89,190 |
| Another state | 2.0% ±0.2% , number 64,097 ±6,943 | 2.1% ±<0.1% , number 7,025,589 ±81,660 |
| Another country | 0.4% ±0.1% , number 13,941 ±3,820 | 0.6% ±<0.1% , number 1,984,943 ±47,210 |
Embed
Top countries of birth, among those born abroad
Source: ACS 2020–2024 5-year, table A07001.
Show data
| Iowa | |
|---|---|
| Mexico | 23.6% , number 44,890 |
| India | 6.2% , number 11,701 |
| Guatemala | 4.1% , number 7,876 |
| China, Excluding Hong Kong and Taiwan | 3.7% , number 6,972 |
| Vietnam | 3.6% , number 6,801 |
| Middle Africa | 3.2% , number 6,047 |
Embed
All the numbers
| Indicator | Iowa | US | Rank among states* | Table |
|---|---|---|---|---|
| Population | 3,238,387 | 341,784,859 | 31st | A00001 |
| People per square mile | 58 | 97 | 37th | A00002 |
| Land area (square miles) | 55,854 | – | – | A00002 |
| Median age | 39.4 ±0.2 | 39.5 ±0.1 | 33rd | A01004 |
| Under 18 | 22.1% ±0.3% , number 717,168 ±10,220 | 21.0% ±<0.1% , number 71,689,151 ±111,800 | 15th | B02002 |
| 65 and over | 20.0% ±0.3% , number 647,684 ±9,879 | 19.0% ±<0.1% , number 64,775,018 ±120,300 | 20th | B02002 |
| Born outside the US | 6.6% ±0.3% , number 214,002 ±8,511 | 14.7% ±0.1% , number 50,409,320 ±204,800 | 35th | A06001 |
| Speak a language other than English at home | 10.2% ±0.4% , number 311,845 ±14,420 | 22.9% ±0.1% , number 74,190,755 ±244,000 | 33rd | C16001 |
| Veterans (adults) | 6.0% ±0.2% , number 151,216 ±5,897 | 5.9% ±<0.1% , number 15,746,228 ±85,320 | 34th | A16002 |
| Living with a disability | 13.5% ±0.3% , number 431,148 ±10,770 | 13.7% ±<0.1% , number 46,271,455 ±126,000 | 34th | B18101 |
| Women 15–50 who had a baby in the past year | 5.3% ±0.4% , number 38,572 ±3,240 | 5.0% ±0.1% , number 4,016,759 ±44,040 | 10th | B13002 |
| Lived in the same home a year ago | 88.6% ±0.5% , number 2,840,082 ±15,920 | 88.4% ±0.1% , number 298,889,697 ±214,800 | 30th | A08001 |
| White, not Hispanic | 80.2% ±0.2% , number 2,597,202 ±5,208 | 55.0% ±<0.1% , number 187,959,031 ±58,340 | 6th | A04001 |
| Hispanic or Latino | 7.9% ±0.1% , number 255,322 ±1,951 | 20.5% ±<0.1% , number 69,975,516 ±13,270 | 36th | A04001 |
| Black, not Hispanic | 4.3% ±0.2% , number 137,778 ±6,340 | 11.7% ±<0.1% , number 40,096,453 ±106,200 | 37th | A04001 |
| Asian, not Hispanic | 2.5% ±0.1% , number 82,362 ±4,016 | 6.5% ±<0.1% , number 22,096,709 ±58,340 | 32nd | A04001 |
*1 is the highest. Population is ranked among all states, and the rest among those of 1,000 people or more, whose figures can be ranked. Ranks use 5-year estimates, the only ones covering every state, so they can differ slightly from the figures here.
Income and work
Lower incomes than the US
The median household income is $76,483, lower than the US ($84,780). 11.0% of people live in poverty, and 5.7% have no health insurance, lower than the US (8.4%).
Household income
Source: ACS 2025 1-year, table A14001.
Show data
| Iowa | United States | |
|---|---|---|
| Under $25,000 | 14.2% ±0.6% , number 192,042 ±8,177 | 14.0% ±0.1% , number 18,727,548 ±88,990 |
| $25,000 to $49,999 | 17.9% ±0.6% , number 241,989 ±8,555 | 15.4% ±0.1% , number 20,665,585 ±101,400 |
| $50,000 to $74,999 | 17.0% ±0.6% , number 230,787 ±7,676 | 15.3% ±0.1% , number 20,513,565 ±88,500 |
| $75,000 to $99,999 | 14.0% ±0.5% , number 189,192 ±6,532 | 12.5% ±0.1% , number 16,814,245 ±87,520 |
| $100,000 to $149,999 | 18.7% ±0.6% , number 253,726 ±7,703 | 17.9% ±0.1% , number 24,018,984 ±99,670 |
| $150,000 to $199,999 | 8.8% ±0.4% , number 119,658 ±5,050 | 10.1% ±0.1% , number 13,521,827 ±70,660 |
| $200,000 or more | 9.5% ±0.4% , number 128,110 ±5,528 | 14.8% ±0.1% , number 19,801,668 ±84,120 |
Embed
What residents do for work
Source: ACS 2025 1-year, table A17004.
Show data
| Iowa | United States | |
|---|---|---|
| Education and health care | 25.0% ±0.6% , number 413,172 ±10,670 | 24.4% ±0.1% , number 40,862,193 ±140,800 |
| Manufacturing | 13.6% ±0.4% , number 225,446 ±7,458 | 9.6% ±0.1% , number 16,064,394 ±91,270 |
| Retail trade | 11.8% ±0.5% , number 195,463 ±8,763 | 10.6% ±0.1% , number 17,781,181 ±96,660 |
| Professional and business services | 7.9% ±0.4% , number 130,774 ±6,837 | 12.8% ±0.1% , number 21,375,231 ±87,110 |
| Finance, insurance and real estate | 7.7% ±0.4% , number 126,933 ±6,258 | 6.6% ±<0.1% , number 11,025,569 ±68,570 |
| Arts, food and lodging | 7.3% ±0.4% , number 121,289 ±6,487 | 8.9% ±0.1% , number 14,811,502 ±87,840 |
| Construction | 7.0% ±0.3% , number 116,247 ±5,264 | 6.7% ±<0.1% , number 11,254,981 ±79,620 |
| Transportation and warehousing | 4.9% ±0.3% , number 81,225 ±4,445 | 5.9% ±<0.1% , number 9,832,211 ±73,020 |
Embed
Where workers come from and go
Iowa has 1,546,079 jobs and 1,540,171 employed residents. 105,944 people commute in to work and 100,036 commute out, while 1,440,135 both live and work here. The most commuters come from Illinois.
Most commuters come from
- Illinois: 41,254
- Nebraska: 23,287
- Minnesota: 8,114
Most residents commute to
- Nebraska: 39,624
- Illinois: 26,781
- Minnesota: 8,362
Show data
| Iowa | |
|---|---|
| Live and work here | 1,440,135 |
| Work here, live elsewhere | 105,944 |
| Live here, work elsewhere | 100,036 |
Embed
All the numbers
| Indicator | Iowa | US | Rank among states* | Table |
|---|---|---|---|---|
| Median household income | $76,483 ±$958 | $84,780 ±$215 | 32nd | A14006 |
| Income per person | $42,709 ±$644 | $47,171 ±$115 | 33rd | A14024 |
| Income inequality (Gini index) | 0.453 ±0.006 | 0.482 ±0.001 | 49th | A14028 |
| Living in poverty | 11.0% ±0.5% , number 346,480 ±15,390 | 11.8% ±0.1% , number 39,264,183 ±277,400 | 31st | A13004 |
| Unemployment rate | 3.5% ±0.3% , number 59,337 ±4,561 | 4.9% ±<0.1% , number 8,574,594 ±64,350 | 44th | A17005 |
| No health insurance | 5.7% ±0.3% , number 180,672 ±10,460 | 8.4% ±<0.1% , number 28,323,306 ±152,000 | 44th | A20001 |
*1 is the highest. Population is ranked among all states, and the rest among those of 1,000 people or more, whose figures can be ranked. Ranks use 5-year estimates, the only ones covering every state, so they can differ slightly from the figures here.
Education
Fewer college degrees than the US
32.6% of adults 25 and over have a bachelor’s degree or more, lower than the US (37.4%).
Highest level of education
Source: ACS 2025 1-year, table A12001.
Show data
| Iowa | United States | |
|---|---|---|
| Less than high school | 6.3% ±0.4% , number 138,090 ±7,795 | 9.4% ±0.1% , number 22,321,002 ±120,500 |
| High school only | 28.9% ±0.5% , number 636,721 ±12,160 | 25.6% ±0.1% , number 61,096,726 ±203,400 |
| Some college | 32.2% ±0.6% , number 709,483 ±13,760 | 27.7% ±0.1% , number 65,920,977 ±173,500 |
| Bachelor’s degree | 21.4% ±0.5% , number 471,914 ±11,480 | 22.3% ±0.1% , number 53,224,312 ±196,700 |
| Graduate degree | 11.1% ±0.4% , number 245,420 ±8,698 | 15.0% ±0.1% , number 35,816,011 ±159,400 |
Embed
All the numbers
| Indicator | Iowa | US | Rank among states* | Table |
|---|---|---|---|---|
| Bachelor’s degree or more | 32.6% ±0.6% , number 717,334 ±14,400 | 37.4% ±0.1% , number 89,040,323 ±253,200 | 39th | A12001 |
| High school graduate or more | 93.7% ±1.0% , number 2,063,538 ±23,340 | 90.6% ±0.2% , number 216,058,026 ±368,200 | 11th | A12001 |
*1 is the highest. Population is ranked among all states, and the rest among those of 1,000 people or more, whose figures can be ranked. Ranks use 5-year estimates, the only ones covering every state, so they can differ slightly from the figures here.
Housing
Home values outran incomes
28.6% of households rent, lower than the US (34.7%). The median home is worth $237,000 and the median rent is $1,026. After inflation, home values rose 27% from 2015 to 2025, while household income rose 2%.
Housing costs and income, 2015 to 2025, after inflation
Source: ACS 1-year, table A10036, A18009, A14006.
Show data
| Iowa | United States | |
|---|---|---|
| Median home value | +27.1% | +39.3% |
| Median rent | +4.3% | +18.5% |
| Median household income | +2.0% | +10.9% |
Embed
Types of homes
Source: ACS 2025 1-year, table A10032.
Show data
| Iowa | United States | |
|---|---|---|
| Single-family, detached | 71.5% ±0.6% , number 1,048,342 ±8,494 | 60.9% ±0.1% , number 90,335,844 ±173,300 |
| Single-family, attached | 4.7% ±0.3% , number 69,449 ±4,614 | 6.4% ±<0.1% , number 9,527,703 ±51,230 |
| 2 to 4 units | 5.2% ±0.3% , number 76,779 ±4,845 | 7.5% ±0.1% , number 11,109,005 ±75,790 |
| 5 to 19 units | 8.0% ±0.4% , number 116,854 ±6,316 | 8.7% ±0.1% , number 12,829,882 ±97,590 |
| 20 or more units | 7.6% ±0.4% , number 111,265 ±6,461 | 11.1% ±0.1% , number 16,381,450 ±92,310 |
| Mobile homes and other | 3.0% ±0.3% , number 44,475 ±3,964 | 5.4% ±<0.1% , number 8,045,083 ±53,680 |
Embed
When homes were built
Source: ACS 2025 1-year, table A10055.
Show data
| Iowa | United States | |
|---|---|---|
| 2010 or later | 14.2% ±0.6% , number 192,576 ±8,238 | 15.1% ±0.1% , number 20,257,912 ±101,300 |
| 2000 to 2009 | 11.0% ±0.5% , number 149,309 ±6,795 | 13.8% ±0.1% , number 18,535,840 ±92,260 |
| 1980 to 1999 | 16.4% ±0.6% , number 222,511 ±7,815 | 24.1% ±0.1% , number 32,332,570 ±118,900 |
| 1960 to 1979 | 22.5% ±0.6% , number 305,388 ±8,377 | 22.9% ±0.1% , number 30,726,302 ±110,000 |
| Before 1960 | 35.8% ±0.8% , number 485,720 ±10,560 | 24.0% ±0.1% , number 32,210,798 ±121,500 |
Embed
All the numbers
| Indicator | Iowa | US | Rank among states* | Table |
|---|---|---|---|---|
| Housing units | 1,467,164 | – | – | A10001 |
| Households | 1,355,504 ±6,652 | – | – | A10008 |
| People per household | 2.31 ±0.01 | 2.49 ±0.01 | 45th | A10003 |
| Households that rent | 28.6% ±0.7% , number 387,776 ±9,082 | 34.7% ±0.1% , number 46,551,688 ±193,200 | 41st | A10060 |
| Vacant homes | 7.6% ±0.5% , number 111,660 ±6,663 | 9.6% ±0.1% , number 14,165,545 ±137,100 | 39th | A10047, A10060 |
| Median gross rent | $1,026 ±$18 | $1,557 ±$4 | 45th | A18009 |
| Median home value | $237,000 ±$2,264 | $371,100 ±$646 | 46th | A10036 |
| Renters paying 30% or more of income | 43.0% ±1.7% , number 166,604 ±7,803 | 48.3% ±0.2% , number 22,486,693 ±122,100 | 42nd | A18002 |
| Owners paying 30% or more of income | 18.5% ±0.7% , number 178,997 ±6,764 | 24.2% ±0.1% , number 21,201,943 ±93,050 | 47th | A10040 |
| Homes built before 1960 | 35.8% ±0.8% , number 485,720 ±10,560 | 24.0% ±0.1% , number 32,210,798 ±121,500 | 9th | A10055 |
*1 is the highest. Population is ranked among all states, and the rest among those of 1,000 people or more, whose figures can be ranked. Ranks use 5-year estimates, the only ones covering every state, so they can differ slightly from the figures here.
Getting around
A driving state with short commutes
76.5% of workers drive alone and 9.6% work from home. 22.2% of those who travel to work spend 30 minutes or more getting there, and 6.2% of households have no vehicle.
How people get to work
Source: ACS 2025 1-year, table A09005.
Show data
| Iowa | United States | |
|---|---|---|
| Drive alone | 76.5% ±0.7% , number 1,244,406 ±14,020 | 69.8% ±0.1% , number 115,297,377 ±192,900 |
| Carpool | 8.6% ±0.5% , number 139,279 ±7,528 | 8.9% ±0.1% , number 14,712,170 ±97,240 |
| Public transit | 1.1% ±0.2% , number 17,656 ±2,651 | 4.3% ±<0.1% , number 7,100,386 ±63,330 |
| Walk | 2.6% ±0.2% , number 42,030 ±3,703 | 2.4% ±<0.1% , number 4,016,469 ±41,070 |
| Work from home | 9.6% ±0.4% , number 156,353 ±7,202 | 12.9% ±0.1% , number 21,288,393 ±105,700 |
| Other | 1.6% ±0.2% , number 25,997 ±3,152 | 1.7% ±<0.1% , number 2,799,658 ±41,510 |
Embed
Time spent getting to work
Source: ACS 2025 1-year, table B09001.
Show data
| Iowa | United States | |
|---|---|---|
| Under 10 minutes | 23.4% ±0.7% , number 344,540 ±10,250 | 12.0% ±0.1% , number 17,199,225 ±93,440 |
| 10 to 19 minutes | 34.0% ±0.8% , number 500,206 ±11,950 | 27.8% ±0.1% , number 40,059,540 ±137,700 |
| 20 to 29 minutes | 20.4% ±0.6% , number 299,066 ±9,256 | 21.0% ±0.1% , number 30,221,743 ±111,100 |
| 30 to 39 minutes | 11.3% ±0.4% , number 166,710 ±6,630 | 17.1% ±0.1% , number 24,659,138 ±103,800 |
| 40 to 59 minutes | 6.6% ±0.3% , number 97,393 ±5,026 | 12.6% ±0.1% , number 18,104,709 ±97,070 |
| 60 minutes or more | 4.2% ±0.3% , number 61,453 ±4,601 | 9.5% ±0.1% , number 13,681,705 ±84,440 |
Embed
Vehicles per household
Source: ACS 2025 1-year, table A10030.
Show data
| Iowa | United States | |
|---|---|---|
| None | 6.2% ±0.4% , number 84,684 ±5,123 | 8.8% ±0.1% , number 11,781,997 ±77,240 |
| One | 31.1% ±0.8% , number 421,693 ±10,900 | 33.1% ±0.1% , number 44,424,682 ±160,700 |
| Two | 36.4% ±0.8% , number 492,797 ±10,710 | 36.0% ±0.1% , number 48,200,889 ±176,800 |
| Three or more | 26.3% ±0.7% , number 356,330 ±9,104 | 22.1% ±0.1% , number 29,655,854 ±113,300 |
Embed
All the numbers
| Indicator | Iowa | US | Rank among states* | Table |
|---|---|---|---|---|
| Drive to work alone | 76.5% ±0.7% , number 1,244,406 ±14,020 | 69.8% ±0.1% , number 115,297,377 ±192,900 | 13th | A09005 |
| Take public transit | 1.1% ±0.2% , number 17,656 ±2,651 | 4.3% ±<0.1% , number 7,100,386 ±63,330 | 31st | A09005 |
| Work from home | 9.6% ±0.4% , number 156,353 ±7,202 | 12.9% ±0.1% , number 21,288,393 ±105,700 | 37th | A09005 |
| Commute 30 minutes or more | 22.2% ±0.6% , number 325,556 ±9,507 | 39.2% ±0.1% , number 56,445,552 ±165,300 | 45th | B09001 |
| Households with no vehicle | 6.2% ±0.4% , number 84,684 ±5,337 | 8.8% ±<0.1% , number 11,781,997 ±64,240 | 37th | A10030 |
*1 is the highest. Population is ranked among all states, and the rest among those of 1,000 people or more, whose figures can be ranked. Ranks use 5-year estimates, the only ones covering every state, so they can differ slightly from the figures here.
Places
The largest cities in Iowa
Population, from the latest estimates available. Figures cover the whole of each place.
Largest cities
- Des Moines: 212,205
- Cedar Rapids: 137,932
- Davenport: 100,357
- Sioux City: 86,102
- Ankeny: 77,828
- Iowa City: 76,236
- West Des Moines: 74,138
- Ames: 68,217
States like this one
- Michigan: 10,077,761
- Indiana: 6,851,073
- Missouri: 6,191,814
- South Carolina: 5,296,225
States at least a third this size, with the closest income, education, age, housing and origins.
Every county and place in Iowa
Find any county, city, town, metro area, ZIP code, school district or district in Iowa.
Counties
Each of the 99 counties with its population, from ACS 2020–2024 5-year estimates.
- Adair County7,460
- Adams County3,622
- Allamakee County14,092
- Appanoose County12,184
- Audubon County5,599
- Benton County25,724
- Black Hawk County131,049
- Boone County26,668
- Bremer County25,204
- Buchanan County20,694
- Buena Vista County20,753
- Butler County14,268
- Calhoun County9,803
- Carroll County20,594
- Cass County13,096
- Cedar County18,349
- Cerro Gordo County42,632
- Cherokee County11,600
- Chickasaw County11,807
- Clarke County9,662
- Clay County16,461
- Clayton County17,013
- Clinton County46,268
- Crawford County16,277
- Dallas County107,968
- Davis County9,157
- Decatur County7,759
- Delaware County17,558
- Des Moines County38,487
- Dickinson County17,990
- Dubuque County99,030
- Emmet County9,262
- Fayette County19,288
- Floyd County15,328
- Franklin County9,956
- Fremont County6,514
- Greene County8,688
- Grundy County12,384
- Guthrie County10,688
- Hamilton County14,886
- Hancock County10,671
- Hardin County16,639
- Harrison County14,632
- Henry County20,004
- Howard County9,445
- Humboldt County9,591
- Ida County6,911
- Iowa County16,507
- Jackson County19,390
- Jasper County37,954
- Jefferson County15,705
- Johnson County156,639
- Jones County20,896
- Keokuk County9,924
- Kossuth County14,516
- Lee County32,893
- Linn County230,004
- Louisa County10,678
- Lucas County8,716
- Lyon County12,162
- Madison County16,926
- Mahaska County22,021
- Marion County33,642
- Marshall County40,114
- Mills County14,568
- Mitchell County10,575
- Monona County8,557
- Monroe County7,513
- Montgomery County10,214
- Muscatine County42,559
- O'Brien County14,126
- Osceola County6,100
- Page County15,131
- Palo Alto County8,863
- Plymouth County25,747
- Pocahontas County7,046
- Polk County503,175
- Pottawattamie County93,424
- Poweshiek County18,545
- Ringgold County4,645
- Sac County9,689
- Scott County174,608
- Shelby County11,778
- Sioux County36,212
- Story County100,466
- Tama County16,868
- Taylor County5,868
- Union County11,993
- Van Buren County7,241
- Wapello County35,362
- Warren County54,409
- Washington County22,561
- Wayne County6,532
- Webster County36,886
- Winnebago County10,583
- Winneshiek County19,873
- Woodbury County106,247
- Worth County7,350
- Wright County12,791
Cities, towns and other places
Each of the 1,017 with its population, from ACS 2020–2024 5-year estimates. Census-designated places are communities without a local government of their own, drawn by the Census Bureau so they can be counted.
- Ackley1,482
- Ackworth75
- Adair830
- Adel6,430
- Afton817
- Agency435
- Ainsworth633
- Akron1,689
- Albert City722
- Albia3,663
- Albion622
- Alburnett795
- Alden833
- Alexander245
- Algona5,377
- Alleman429
- Allerton395
- Allison929
- Alta2,250
- Alta Vista194
- Alton1,459
- Altoona21,495
- Alvord173
- Amana755
- Ames67,669
- Anamosa5,629
- Anderson37
- Andover124
- Andrew423
- Anita957
- Ankeny72,615
- Anthon514
- Aplington1,111
- Arcadia796
- Archer130
- Aredale48
- Argo28
- Argyle62
- Arion137
- Arispe78
- Arlington427
- Armstrong703
- Arnolds Park922
- Arthur252
- Asbury5,989
- Ashton461
- Aspinwall45
- Atalissa253
- Atkins2,225
- Atlantic6,763
- Auburn160
- Audubon2,130
- Augusta26
- Aurelia991
- Aurora214
- Avoca1,444
- Ayrshire146
- Badger433
- Bagley223
- Baldwin153
- Balltown72
- Bancroft626
- Bankston14
- Barnes City117
- Barnum250
- Bassett50
- Batavia536
- Battle Creek803
- Baxter1,247
- Bayard398
- Beacon425
- Beaconsfield8
- Beaman125
- Beaver51
- Beaverdale910
- Bedford1,336
- Belle Plaine2,380
- Bellevue2,259
- Belmond2,694
- Bennett390
- Bentley189
- Benton27
- Berkley5
- Bernard112
- Bertram239
- Bettendorf39,647
- Bevington15
- Big Rock6
- Birmingham454
- Blairsburg139
- Blairstown654
- Blakesburg310
- Blanchard33
- Blencoe280
- Blockton122
- Bloomfield2,742
- Blue Grass1,972
- Bode379
- Bonaparte302
- Bondurant8,560
- Boone12,424
- Bouton168
- Boxholm168
- Boyden757
- Braddyville173
- Bradford178
- Bradgate104
- Brandon307
- Brayton101
- Breda477
- Bridgewater124
- Brighton588
- Bristow197
- Britt1,882
- Bronson312
- Brooklyn1,459
- Brunsville210
- Buck Grove42
- Buckeye75
- Buffalo1,097
- Buffalo Center911
- Burchinal6
- Burlington23,728
- Burr Oak225
- Burt511
- Bussey414
- Calamus417
- California Junction169
- Callender413
- Calmar974
- Calumet113
- Camanche4,550
- Cambridge803
- Cantril335
- Carbon46
- Carlisle4,255
- Carpenter81
- Carroll10,208
- Carson834
- Carter Lake3,767
- Cascade2,375
- Casey381
- Castalia142
- Castana162
- Cedar Falls40,888
- Cedar Rapids137,264
- Center Junction126
- Center Point2,562
- Centerville5,372
- Central City1,356
- Centralia117
- Chapin137
- Chariton4,242
- Charles City7,232
- Charlotte454
- Charter Oak580
- Chatsworth54
- Chelsea404
- Cherokee5,154
- Chester150
- Chillicothe83
- Churdan427
- Cincinnati229
- Clare128
- Clarence1,166
- Clarinda5,353
- Clarion2,770
- Clarksville1,237
- Clayton57
- Clear Lake7,607
- Clearfield396
- Cleghorn271
- Clemons108
- Clermont627
- Climbing Hill45
- Clinton24,322
- Clio32
- Clive19,012
- Clutier426
- Coalville649
- Coburg36
- Coggon744
- Coin277
- Colesburg545
- Colfax2,210
- College Springs171
- Collins533
- Colo686
- Columbus City323
- Columbus Junction2,110
- Colwell38
- Conesville439
- Conrad1,191
- Conroy199
- Conway35
- Coon Rapids1,467
- Coppock29
- Coralville23,234
- Corning1,567
- Correctionville761
- Corwith249
- Corydon1,628
- Cotter31
- Coulter228
- Council Bluffs62,586
- Craig49
- Crawfordsville312
- Crescent549
- Cresco3,908
- Creston7,435
- Cromwell103
- Crystal Lake283
- Cumberland302
- Cumming545
- Curlew54
- Cushing243
- Cylinder46
- Dakota City752
- Dallas Center2,161
- Dana28
- Danbury283
- Danville930
- Davenport100,913
- Davis City160
- Dawson102
- Dayton689
- De Soto1,041
- Decatur190
- Decorah7,535
- Dedham280
- Deep River335
- Defiance251
- Delaware138
- Delhi432
- Delmar480
- Deloit309
- Delphos4
- Delta363
- Denison8,260
- Denmark835
- Denver2,379
- Derby110
- Des Moines212,421
- DeWitt5,546
- Dexter620
- Diagonal454
- Diamondhead Lake285
- Dickens131
- Dike1,365
- Dixon190
- Dolliver161
- Donahue390
- Donnellson776
- Doon529
- Douds243
- Dougherty88
- Dow City454
- Downey59
- Dows562
- Drakesville149
- Dubuque59,174
- Dumont783
- Duncan21
- Duncombe376
- Dundee177
- Dunkerton821
- Dunlap1,170
- Durango18
- Durant1,946
- Dyersville4,423
- Dysart1,519
- Eagle Grove3,593
- Earlham1,528
- Earling478
- Earlville868
- Early869
- East Amana91
- East Peru92
- Eddyville1,163
- Edgewood752
- Elberon143
- Eldon726
- Eldora2,617
- Eldridge6,818
- Elgin735
- Elk Horn728
- Elk Run Heights964
- Elkader1,293
- Elkhart899
- Elkport22
- Elliott420
- Ellston28
- Ellsworth482
- Elma659
- Ely2,186
- Emerson570
- Emmetsburg3,648
- Epworth1,894
- Essex854
- Estherville5,839
- Evansdale4,518
- Everly584
- Exira705
- Exline73
- Fairbank1,275
- Fairfax2,900
- Fairfield9,456
- Fairport109
- Farley1,889
- Farmersburg375
- Farmington540
- Farnhamville386
- Farragut413
- Fayette1,309
- Fenton290
- Ferguson85
- Fertile255
- Floris128
- Floyd315
- Fonda589
- Fontanelle615
- Forest City4,290
- Fort Atkinson346
- Fort Dodge24,827
- Fort Madison10,133
- Fostoria181
- Franklin148
- Fraser148
- Fredericksburg989
- Frederika236
- Fredonia240
- Fremont924
- Fruitland1,049
- Frytown113
- Galt34
- Galva447
- Garber105
- Garden City36
- Garden Grove171
- Garnavillo816
- Garner3,049
- Garrison286
- Garwin571
- Geneva152
- George1,064
- Gibson68
- Gilbert1,381
- Gilbertville761
- Gillett Grove40
- Gilman623
- Gilmore City748
- Gladbrook992
- Glenwood5,144
- Glidden1,169
- Goldfield613
- Goodell268
- Goose Lake387
- Gowrie932
- Graettinger1,096
- Graf47
- Grafton271
- Grand Junction603
- Grand Mound510
- Grand River166
- Grandview449
- Granger1,979
- Grant35
- Granville265
- Gravity128
- Gray70
- Greeley252
- Green Mountain87
- Greene1,339
- Greenfield1,894
- Greenville62
- Grimes16,366
- Grinnell9,505
- Griswold975
- Grundy Center2,809
- Gruver30
- Guernsey50
- Guthrie Center1,689
- Guttenberg1,782
- Halbur284
- Hamburg927
- Hamilton107
- Hampton4,306
- Hancock216
- Hanlontown249
- Hansell83
- Harcourt249
- Hardy10
- Harlan4,891
- Harper155
- Harpers Ferry253
- Harris222
- Hartford760
- Hartley1,553
- Hartwick114
- Harvey174
- Hastings164
- Havelock162
- Haverhill142
- Hawarden2,658
- Hawkeye482
- Hayesville52
- Hazleton720
- Hedrick913
- Henderson143
- Hiawatha7,206
- High Amana36
- Hills974
- Hillsboro120
- Hinton931
- Holiday Lake397
- Holland327
- Holstein1,600
- Holy Cross280
- Homestead252
- Hopkinton676
- Hornick340
- Hospers916
- Houghton72
- Hubbard773
- Hudson2,699
- Hull2,317
- Humboldt4,771
- Humeston551
- Huxley4,544
- Ida Grove1,967
- Imogene49
- Independence6,164
- Indianola16,044
- Inwood793
- Ionia336
- Iowa City75,752
- Iowa Falls5,038
- Ireton552
- Irvington34
- Irwin352
- Jackson Junction26
- Jamaica189
- Janesville917
- Jefferson4,152
- Jesup2,561
- Jewell Junction1,084
- Johnston24,384
- Joice207
- Jolley19
- Kalona2,692
- Kamrar145
- Kanawha756
- Kellerton286
- Kelley382
- Kellogg676
- Kensett270
- Kent Estates1,848
- Keokuk9,662
- Keomah Village123
- Keosauqua914
- Keota891
- Keswick255
- Keystone674
- Kimballton319
- Kingsley1,472
- Kingston77
- Kinross171
- Kirkman58
- Kirkville266
- Kiron249
- Klemme544
- Knierim76
- Knoxville7,473
- La Motte267
- La Porte City2,071
- Lacona354
- Ladora240
- Lake City1,693
- Lake Mills2,088
- Lake Panorama928
- Lake Park1,184
- Lake View967
- Lakeside563
- Lakota266
- Lambs Grove181
- Lamoni2,207
- Lamont514
- Lanesboro78
- Lansing1,115
- Larchwood1,136
- Larrabee147
- Latimer681
- Laurel278
- Laurens1,206
- Lawler363
- Lawton790
- Le Claire4,735
- Le Grand720
- Le Mars10,640
- Le Roy19
- Leando74
- Ledyard112
- Lehigh340
- Leighton150
- Leland306
- Lenox1,569
- Leon1,899
- Lester340
- Letts361
- Lewis461
- Libertyville324
- Lidderdale177
- Lime Springs442
- Lincoln113
- Linden150
- Lineville259
- Linn Grove215
- Lisbon1,714
- Liscomb298
- Little Cedar40
- Little Rock395
- Little Sioux129
- Livermore416
- Lockridge452
- Logan1,392
- Lohrville277
- Lone Rock106
- Lone Tree1,218
- Long Grove793
- Lorimor319
- Lost Nation390
- Loveland52
- Lovilia414
- Low Moor253
- Lowden699
- Lowell43
- Lu Verne318
- Luana317
- Lucas145
- Luther159
- Luxemburg229
- Luzerne120
- Lynnville527
- Lytton357
- Macedonia249
- Macksburg56
- Madrid2,808
- Magnolia180
- Maharishi Vedic City282
- Malcom221
- Mallard263
- Maloy30
- Malvern1,323
- Manchester5,191
- Manilla630
- Manly1,320
- Manning1,533
- Manson1,645
- Mapleton989
- Maquoketa6,075
- Marathon234
- Marble Rock191
- Marcus1,180
- Marengo2,725
- Marion41,896
- Marne98
- Marquette443
- Marshalltown27,626
- Martelle457
- Martensdale569
- Martinsburg101
- Marysville70
- Mason City27,050
- Masonville68
- Massena383
- Matlock144
- Maurice206
- Maxwell905
- Maynard471
- Maysville220
- McCallsburg326
- McCausland397
- McClelland140
- McGregor719
- McIntire89
- Mechanicsville964
- Mediapolis1,928
- Melbourne804
- Melcher-Dallas1,176
- Melrose115
- Melvin230
- Menlo398
- Meriden138
- Merrill846
- Meservey262
- Meyer14
- Middle Amana683
- Middletown322
- Miles398
- Milford3,311
- Miller25
- Millersburg129
- Millerton44
- Milo731
- Milton493
- Minburn354
- Minden630
- Mineola110
- Mingo328
- Missouri Valley2,666
- Mitchell117
- Mitchellville2,579
- Modale181
- Mona21
- Mondamin403
- Monmouth121
- Monona1,531
- Monroe2,120
- Montezuma1,410
- Monticello4,071
- Montour206
- Montpelier209
- Montrose744
- Mooar144
- Moorhead195
- Moorland166
- Moravia624
- Morley46
- Morning Sun802
- Morrison96
- Moscow614
- Moulton498
- Mount Auburn172
- Mount Ayr1,816
- Mount Pleasant8,951
- Mount Sterling36
- Mount Union111
- Mount Vernon4,513
- Moville1,670
- Murray614
- Muscatine23,489
- Mystic216
- Nashua1,622
- Nemaha48
- Neola1,116
- Nevada6,983
- New Albin399
- New Hampton3,453
- New Hartford675
- New Haven30
- New Liberty141
- New London2,338
- New Market397
- New Providence173
- New Sharon1,180
- New Vienna372
- New Virginia587
- Newell944
- Newhall996
- Newton15,700
- Nichols373
- Nodaway73
- Nora Springs1,363
- North Buena Vista139
- North English852
- North Liberty21,125
- North Washington134
- Northboro90
- Northwood2,040
- Norwalk14,183
- Norway546
- Numa58
- Oak Hills137
- Oakland1,408
- Oakland Acres191
- Oakville204
- Ocheyedan511
- Odebolt945
- Oelwein5,834
- Ogden1,859
- Okoboji969
- Olds72
- Olin830
- Ollie238
- Onawa2,839
- Onslow284
- Orange City6,426
- Orchard69
- Orient448
- Orleans527
- Osage3,561
- Osceola5,523
- Oskaloosa11,504
- Ossian806
- Osterdock136
- Otho380
- Oto68
- Otranto34
- Ottosen31
- Ottumwa25,430
- Owasa25
- Oxford779
- Oxford Junction461
- Oyens81
- Pacific Junction150
- Packwood539
- Palmer134
- Palo1,438
- Panama245
- Panora1,579
- Panorama Park145
- Park View2,437
- Parkersburg1,766
- Parnell303
- Paton273
- Patterson346
- Paullina869
- Pella10,720
- Peosta2,040
- Percival105
- Perry7,985
- Persia294
- Peterson298
- Pierson302
- Pilot Mound132
- Pisgah255
- Plainfield314
- Plano39
- Pleasant Hill11,136
- Pleasant Plain92
- Pleasanton61
- Pleasantville1,899
- Plover45
- Plymouth407
- Pocahontas1,763
- Polk City6,037
- Pomeroy542
- Popejoy109
- Portland29
- Portsmouth204
- Postville2,979
- Prairie City1,711
- Prairieburg143
- Prescott213
- Preston1,044
- Primghar1,014
- Princeton794
- Promise City105
- Protivin312
- Pulaski403
- Quasqueton703
- Quimby286
- Radcliffe657
- Rake190
- Ralston61
- Randalia60
- Randall142
- Randolph235
- Rathbun30
- Raymond899
- Readlyn736
- Reasnor152
- Red Oak5,510
- Redding51
- Redfield780
- Reinbeck1,715
- Rembrandt157
- Remsen1,823
- Renwick229
- Rhodes265
- Riceville823
- Richland544
- Rickardsville234
- Ricketts61
- Ridgeway315
- Rinard62
- Ringsted380
- Rippey196
- River Sioux7
- Riverdale396
- Riverside890
- Riverton188
- Robins3,332
- Rochester90
- Rock Falls119
- Rock Rapids2,661
- Rock Valley4,059
- Rockford839
- Rockwell986
- Rockwell City2,401
- Rodman26
- Rodney39
- Roland1,559
- Rolfe626
- Rome79
- Rose Hill300
- Roseville12
- Rossie88
- Rowan186
- Rowley353
- Royal585
- Rudd481
- Runnells440
- Russell613
- Ruthven732
- Rutland120
- Ryan346
- Sabula547
- Sac City1,885
- Sageville88
- Salem349
- Salix402
- Sanborn1,323
- Sandusky354
- Sandyville44
- Saylorville3,366
- Scarville66
- Schaller775
- Schleswig831
- Scranton542
- Searsboro109
- Sergeant Bluff5,171
- Sexton24
- Seymour594
- Shambaugh113
- Shannon City115
- Sharpsburg83
- Sheffield1,053
- Shelby752
- Sheldahl361
- Sheldon5,474
- Shell Rock1,625
- Shellsburg868
- Shenandoah4,892
- Sherrill162
- Shueyville740
- Sibley2,803
- Sidney955
- Sigourney1,954
- Silver City504
- Sioux Center8,454
- Sioux City86,101
- Sioux Rapids722
- Slater1,401
- Sloan1,018
- Smithland137
- Soldier133
- Solon3,152
- Somers149
- South Amana121
- South English260
- Spencer11,400
- Sperry73
- Spillville356
- Spirit Lake5,518
- Spragueville90
- Spring Hill39
- Springbrook125
- Springville1,172
- St. Ansgar1,206
- St. Anthony92
- St. Benedict25
- St. Charles914
- St. Donatus135
- St. Joseph73
- St. Lucas154
- St. Marys96
- St. Olaf76
- St. Paul65
- Stacyville545
- Stanhope509
- Stanley69
- Stanton522
- Stanwood533
- State Center1,412
- Steamboat Rock312
- Stockport210
- Stockton170
- Stone City154
- Storm Lake11,428
- Story City3,398
- Stout296
- Stratford735
- Strawberry Point1,267
- Struble76
- Stuart1,655
- Sully1,022
- Sumner2,106
- Sun Valley Lake163
- Superior111
- Sutherland629
- Swaledale148
- Swan55
- Swea City591
- Swedesburg119
- Swisher1,182
- Tabor877
- Tama3,051
- Templeton351
- Tennant84
- Terril290
- Thayer45
- Thompson459
- Thor257
- Thornburg55
- Thornton514
- Thurman217
- Tiffin5,737
- Tingley128
- Tipton3,106
- Titonka452
- Toeterville56
- Toledo1,966
- Toronto87
- Traer1,519
- Trenton75
- Treynor1,126
- Tripoli1,156
- Truesdale187
- Truro518
- Turin131
- Twin Lakes579
- Udell13
- Underwood898
- Union378
- Unionville78
- University Heights1,384
- University Park645
- Urbana1,639
- Urbandale46,595
- Ute351
- Vail527
- Valeria43
- Van Horne612
- Van Meter1,628
- Van Wert188
- Varina29
- Ventura733
- Victor987
- Villisca1,048
- Vincent161
- Vining68
- Vinton4,948
- Volga216
- Wadena177
- Wahpeton443
- Walcott1,725
- Walford1,329
- Walker661
- Wall Lake725
- Wallingford128
- Walnut1,342
- Wapello1,765
- Washburn714
- Washington7,290
- Washta180
- Waterloo67,008
- Waterville137
- Watkins201
- Waucoma291
- Waukee29,236
- Waukon3,792
- Waverly10,494
- Wayland1,191
- Webb102
- Webster134
- Webster City7,769
- Weldon88
- Wellman1,454
- Wellsburg673
- Welton114
- Wesley360
- West Amana124
- West Bend855
- West Branch2,594
- West Burlington3,189
- West Chester178
- West Des Moines71,083
- West Liberty3,776
- West Okoboji418
- West Point840
- West Union2,489
- Westfield123
- Westgate178
- Weston192
- Westphalia117
- Westside308
- Westwood130
- Wever142
- What Cheer580
- Wheatland925
- Whiting777
- Whittemore569
- Whitten164
- Willey94
- Williams369
- Williamsburg3,360
- Williamson190
- Wilton2,920
- Windsor Heights5,143
- Winfield1,007
- Winterset5,416
- Winthrop1,040
- Wiota78
- Woden219
- Woodbine1,471
- Woodburn165
- Woodward977
- Woolstock181
- Worthington431
- Wyoming525
- Yale405
- Yarmouth85
- Yetter15
- Yorktown57
- Zearing566
- Zwingle76
Metro and micro areas
Each of the 24 that reach into Iowa, with its whole population, from ACS 2020–2024 5-year estimates. Metro and micro areas are counties tied together by commuting, drawn by the Office of Management and Budget.
- Ames, IA Metro Area127,134
- Burlington, IA-IL Micro Area44,680
- Carroll, IA Micro Area20,594
- Cedar Rapids, IA Metro Area276,624
- Clinton, IA Micro Area46,268
- Davenport-Moline-Rock Island, IA-IL Metro Area381,503
- Des Moines-West Des Moines, IA Metro Area731,120
- Dubuque, IA Metro Area99,030
- Fort Dodge, IA Micro Area36,886
- Fort Madison, IA Micro Area32,893
- Iowa City, IA Metro Area179,200
- Le Mars, IA Micro Area25,747
- Marshalltown, IA Micro Area40,114
- Mason City, IA Micro Area49,982
- Muscatine, IA Micro Area42,559
- Omaha, NE-IA Metro Area982,064
- Oskaloosa, IA Micro Area22,021
- Ottumwa, IA Micro Area35,362
- Pella, IA Micro Area33,642
- Sioux City, IA-NE-SD Metro Area144,682
- Spencer, IA Micro Area16,461
- Spirit Lake, IA Micro Area17,990
- Storm Lake, IA Micro Area20,753
- Waterloo-Cedar Falls, IA Metro Area168,637
ZIP codes
Each of the 969 with people in it, by the town it's centered in, from ACS 2020–2024 5-year estimates. These are the Census Bureau's ZIP Code Tabulation Areas, which follow the Postal Service's ZIP codes as closely as census blocks allow.
- 50001Ackworth650
- 50002Adair1,496
- 50003Adel9,948
- 50005Albion812
- 50006Alden1,437
- 50007Alleman444
- 50008Allerton722
- 50009Altoona22,886
- 50010Ames33,799
- 50012Ames1,913
- 50013Ames4,211
- 50014Ames32,958
- 50020Anita1,197
- 50021Ankeny30,283
- 50022Atlantic8,526
- 50023Ankeny46,306
- 50025Audubon3,148
- 50026Bagley481
- 50027Barnes City148
- 50028Baxter1,981
- 50029Bayard523
- 50031Beaver51
- 50032Altoona707
- 50033Bevington12
- 50034Blairsburg328
- 50035Bondurant10,131
- 50036Boone16,154
- 50038Van Meter235
- 50039Bouton344
- 50040Boxholm168
- 50041Bradford51
- 50042Brayton226
- 50044Bussey901
- 50046Cambridge1,554
- 50047Carlisle6,690
- 50048Casey562
- 50049Chariton6,414
- 50050Churdan712
- 50051Clemons224
- 50052Clio80
- 50054Colfax3,166
- 50055Collins1,102
- 50056Colo1,003
- 50057Melcher-Dallas327
- 50058Coon Rapids1,999
- 50060Corydon2,417
- 50061Cumming2,123
- 50062Melcher-Dallas789
- 50063Dallas Center2,720
- 50064Dana100
- 50065Pleasanton517
- 50066Dawson191
- 50067Decatur354
- 50068Derby215
- 50069De Soto1,109
- 50070Dexter1,221
- 50071Dows847
- 50072Earlham2,979
- 50073Elkhart1,208
- 50074Sun Valley Lake215
- 50075Ellsworth807
- 50076Exira1,301
- 50078Ferguson85
- 50101Galt57
- 50102Garden City36
- 50103Garden Grove453
- 50104Gibson103
- 50105Gilbert1,487
- 50106Gilman1,163
- 50107Grand Junction764
- 50108Grand River376
- 50109Granger3,309
- 50110Gray29
- 50111Grimes16,865
- 50112Grinnell11,862
- 50115Guthrie Center2,809
- 50116Marysville261
- 50117Audubon128
- 50118Hartford920
- 50119Harvey392
- 50120Haverhill428
- 50122Hubbard1,297
- 50123Humeston883
- 50124Huxley4,859
- 50125Indianola20,121
- 50126Iowa Falls6,368
- 50127Mingo10
- 50128Jamaica330
- 50129Jefferson5,014
- 50130Jewell Junction1,468
- 50131Johnston24,583
- 50132Kamrar427
- 50133Kellerton528
- 50134Kelley770
- 50135Kellogg1,754
- 50136Thornburg376
- 50137Sully114
- 50138Knoxville11,117
- 50139Lacona1,025
- 50140Lamoni2,842
- 50141Laurel587
- 50142Le Grand720
- 50143Leighton538
- 50144Leon2,692
- 50145Lacona139
- 50146Linden577
- 50147Lineville463
- 50148Liscomb406
- 50149Lorimor883
- 50150Lovilia736
- 50151Lucas727
- 50152Luther138
- 50153Lynnville890
- 50154McCallsburg394
- 50155Macksburg94
- 50156Madrid4,575
- 50157Malcom473
- 50158Marshalltown31,396
- 50160Martensdale569
- 50161Maxwell2,296
- 50162Melbourne1,164
- 50163Melcher-Dallas689
- 50164Menlo682
- 50165Millerton44
- 50166Milo2,023
- 50167Minburn592
- 50168Mingo826
- 50169Mitchellville3,667
- 50170Monroe3,024
- 50171Montezuma2,524
- 50173Montour705
- 50174Murray1,259
- 50201Nevada8,320
- 50206New Providence349
- 50207New Sharon2,325
- 50208Newton20,595
- 50210New Virginia1,487
- 50211Norwalk16,835
- 50212Ogden2,993
- 50213Osceola7,489
- 50214Monroe719
- 50216Panora2,786
- 50217Paton561
- 50218Patterson346
- 50219Pella14,416
- 50220Perry9,216
- 50222East Peru328
- 50223Pilot Mound236
- 50225Pleasantville3,364
- 50226Polk City7,759
- 50227Popejoy107
- 50228Prairie City2,120
- 50229Bevington1,585
- 50230Radcliffe1,145
- 50231Randall142
- 50232Reasnor569
- 50233Redfield1,406
- 50234Rhodes559
- 50235Rippey431
- 50236Roland1,761
- 50237Runnells3,635
- 50238Russell1,195
- 50239St. Anthony354
- 50240St. Charles2,393
- 50241St. Marys96
- 50242Searsboro326
- 50243Sheldahl361
- 50244Sheldahl1,729
- 50246Stanhope614
- 50247State Center2,004
- 50248Story City4,216
- 50249Stratford1,312
- 50250Stuart2,832
- 50251Sully1,365
- 50252Swan236
- 50254Thayer296
- 50255Thornburg51
- 50256Bussey643
- 50257Truro914
- 50258Union958
- 50261Van Meter3,399
- 50262Van Wert263
- 50263Waukee29,611
- 50264Weldon502
- 50265West Des Moines33,488
- 50266West Des Moines37,523
- 50268What Cheer908
- 50269Whitten164
- 50271Williams581
- 50272Williamson190
- 50273Winterset8,950
- 50274Wiota234
- 50275Woodburn506
- 50276Woodward2,679
- 50277Yale582
- 50278Zearing891
- 50309Des Moines10,110
- 50310Des Moines31,177
- 50311Des Moines14,574
- 50312Des Moines15,802
- 50313Saylorville17,440
- 50314Des Moines10,438
- 50315Des Moines34,816
- 50316Des Moines16,710
- 50317Des Moines36,548
- 50320Des Moines24,807
- 50321Des Moines7,900
- 50322Urbandale31,931
- 50323Urbandale17,265
- 50324Windsor Heights5,143
- 50325Clive19,012
- 50327Pleasant Hill13,177
- 50401Mason City28,703
- 50420Alexander473
- 50421Belmond3,168
- 50423Britt2,291
- 50424Buffalo Center1,441
- 50426Carpenter81
- 50427Chapin137
- 50428Clear Lake9,071
- 50430Corwith520
- 50431Coulter228
- 50432Crystal Lake283
- 50433Dougherty157
- 50434Fertile396
- 50435Floyd713
- 50436Forest City5,771
- 50438Garner3,995
- 50439Goodell454
- 50440Grafton361
- 50441Hampton5,450
- 50444Hanlontown394
- 50446Joice476
- 50447Kanawha1,145
- 50448Kensett620
- 50449Klemme785
- 50450Lake Mills2,952
- 50451Lakota432
- 50452Latimer946
- 50453Leland537
- 50454Little Cedar229
- 50455Meyer201
- 50456Manly1,699
- 50457Meservey463
- 50458Nora Springs2,094
- 50459Northwood3,045
- 50460Orchard688
- 50461Osage5,228
- 50464Plymouth694
- 50465Rake190
- 50466Riceville1,972
- 50467Rock Falls63
- 50468Rockford1,617
- 50469Rockwell1,527
- 50470Rowan287
- 50471Rudd740
- 50472St. Ansgar2,560
- 50473Scarville219
- 50475Sheffield1,446
- 50476Stacyville706
- 50477Swaledale250
- 50478Thompson737
- 50479Thornton655
- 50480Titonka809
- 50482Ventura748
- 50483Wesley672
- 50484Woden411
- 50501Fort Dodge28,823
- 50510Albert City1,042
- 50511Algona7,240
- 50514Armstrong1,117
- 50515Ayrshire251
- 50516Badger586
- 50517Bancroft833
- 50518Barnum365
- 50519St. Joseph765
- 50520Bradgate114
- 50521Lehigh45
- 50522Burt705
- 50523Callender682
- 50524Clare439
- 50525Clarion3,179
- 50527Curlew106
- 50528Cylinder366
- 50529Dakota City752
- 50530Dayton1,090
- 50531Dolliver325
- 50532Duncombe804
- 50533Eagle Grove3,977
- 50535Early1,198
- 50536Emmetsburg4,207
- 50538Farnhamville661
- 50539Fenton444
- 50540Fonda998
- 50541Gilmore City1,067
- 50542Goldfield859
- 50543Gowrie1,420
- 50544Harcourt565
- 50545Hardy139
- 50546Havelock356
- 50548Humboldt5,722
- 50551Jolley96
- 50552Knierim76
- 50554Laurens1,653
- 50556Ledyard159
- 50557Lehigh804
- 50558Livermore653
- 50559Lone Rock289
- 50560Lu Verne732
- 50561Lytton585
- 50562Mallard377
- 50563Manson2,505
- 50565Marathon380
- 50566Moorland325
- 50567Nemaha280
- 50568Newell1,384
- 50569Otho551
- 50570Ottosen203
- 50571Palmer273
- 50573Plover31
- 50574Pocahontas2,132
- 50575Pomeroy696
- 50576Rembrandt277
- 50577Renwick341
- 50578Ringsted633
- 50579Rockwell City3,034
- 50581Rolfe809
- 50582Rutland170
- 50583Sac City2,288
- 50585Sioux Rapids1,080
- 50586Somers272
- 50588Storm Lake13,431
- 50590Swea City718
- 50591Thor405
- 50592Truesdale187
- 50593Varina29
- 50594Vincent288
- 50595Webster City8,885
- 50597West Bend1,341
- 50598Whittemore818
- 50599Woolstock410
- 50601Ackley2,299
- 50602Allison1,254
- 50603Alta Vista555
- 50604Aplington1,590
- 50605Aredale63
- 50606Arlington803
- 50607Aurora403
- 50608Aplington24
- 50609Beaman377
- 50611Bristow364
- 50612Traer369
- 50613Cedar Falls43,867
- 50616Charles City9,358
- 50619Clarksville2,150
- 50620Colwell36
- 50621Conrad1,601
- 50622Denver3,549
- 50623Dunkerton153
- 50624Dike1,855
- 50625Dumont930
- 50626Dunkerton1,468
- 50627Eldora3,276
- 50628Elma1,423
- 50629Fairbank2,082
- 50630Fredericksburg1,372
- 50631Frederika225
- 50632Garwin1,201
- 50633Geneva423
- 50634Gilbertville761
- 50635Gladbrook1,423
- 50636Greene2,186
- 50638Grundy Center3,441
- 50641Hazleton1,950
- 50642Holland577
- 50643Hudson3,027
- 50644Independence8,419
- 50645Ionia1,193
- 50647Janesville1,978
- 50648Jesup4,269
- 50649Aplington12
- 50650Lamont648
- 50651La Porte City3,147
- 50652Lincoln113
- 50653Marble Rock486
- 50654Masonville275
- 50655Maynard739
- 50657Morrison96
- 50658Nashua2,450
- 50659New Hampton5,688
- 50660New Hartford1,143
- 50662Oelwein6,576
- 50664Fairbank63
- 50665Parkersburg2,693
- 50666Plainfield753
- 50667Raymond899
- 50668Readlyn1,216
- 50669Reinbeck2,439
- 50670Shell Rock2,270
- 50671Stanley182
- 50672Steamboat Rock611
- 50673Stout250
- 50674Sumner3,446
- 50675Traer2,198
- 50676Tripoli2,017
- 50677Waverly12,673
- 50680Wellsburg1,027
- 50681Westgate481
- 50682Winthrop1,692
- 50701Washburn30,232
- 50702Waterloo20,882
- 50703Waterloo17,952
- 50707Evansdale7,784
- 50801Creston9,034
- 50830Afton1,846
- 50831Arispe22
- 50833Bedford2,077
- 50835Benton69
- 50836Blockton304
- 50837Bridgewater282
- 50839Carbon46
- 50840Clearfield552
- 50841Corning2,340
- 50842Cromwell99
- 50843Cumberland540
- 50845Diagonal831
- 50846Fontanelle1,276
- 50847Grant35
- 50848Gravity256
- 50849Greenfield2,374
- 50851Lenox2,193
- 50853Massena716
- 50854Mount Ayr2,391
- 50857Nodaway156
- 50858Orient848
- 50859Prescott676
- 50860Redding94
- 50861Shannon City311
- 50862Sharpsburg123
- 50863Tingley194
- 50864Villisca1,662
- 51001Akron2,342
- 51002Alta2,787
- 51003Alton1,938
- 51004Anthon858
- 51005Aurelia1,561
- 51006Battle Creek1,287
- 51007Bronson691
- 51008Brunsville210
- 51009Calumet113
- 51010Castana425
- 51011Chatsworth54
- 51012Cherokee6,311
- 51014Cleghorn549
- 51015Climbing Hill45
- 51016Correctionville1,080
- 51018Cushing542
- 51019Danbury448
- 51020Galva632
- 51022Granville960
- 51023Hawarden3,473
- 51024Hinton2,081
- 51025Holstein1,925
- 51026Hornick910
- 51027Ireton1,280
- 51028Kingsley2,191
- 51029Larrabee261
- 51030Lawton1,468
- 51031Le Mars12,808
- 51033Linn Grove421
- 51034Mapleton1,674
- 51035Marcus1,627
- 51036Maurice445
- 51037Meriden327
- 51038Merrill1,449
- 51039Moville2,845
- 51040Onawa3,500
- 51041Orange City7,324
- 51044Oto165
- 51045Oyens66
- 51046Paullina1,326
- 51047Peterson693
- 51048Pierson435
- 51049Quimby448
- 51050Remsen2,962
- 51051Rodney39
- 51052Salix1,050
- 51053Schaller1,016
- 51054Sergeant Bluff5,583
- 51055Sloan1,346
- 51056Smithland346
- 51058Sutherland1,096
- 51060Ute706
- 51061Washta389
- 51062Westfield503
- 51063Whiting1,072
- 51101Sioux City1,031
- 51103Sioux City16,895
- 51104Sioux City23,197
- 51105Sioux City10,415
- 51106Sioux City28,592
- 51108Hinton5,960
- 51109Sioux City3,606
- 51111Sioux City39
- 51201Sheldon6,430
- 51230Alvord478
- 51231Archer562
- 51232Ashton658
- 51234Boyden1,172
- 51235Doon1,007
- 51237George1,605
- 51238Hospers1,502
- 51239Hull2,876
- 51240Inwood1,914
- 51241Larchwood2,103
- 51242Lester379
- 51243Little Rock735
- 51244Matlock144
- 51245Primghar1,377
- 51246Rock Rapids4,041
- 51247Rock Valley5,094
- 51248Sanborn1,534
- 51249Sibley3,564
- 51250Sioux Center9,970
- 51301Spencer12,638
- 51331Arnolds Park935
- 51333Dickens374
- 51334Estherville6,960
- 51338Everly852
- 51340Fostoria75
- 51341Gillett Grove40
- 51342Graettinger1,385
- 51343Greenville172
- 51345Harris347
- 51346Hartley2,247
- 51347Lake Park1,470
- 51350Melvin383
- 51351West Okoboji4,988
- 51354Ocheyedan965
- 51355Okoboji1,048
- 51357Royal910
- 51358Ruthven1,213
- 51360Spirit Lake8,653
- 51363Superior111
- 51364Terril803
- 51365Wallingford416
- 51366Webb245
- 51401Carroll11,990
- 51430Arcadia1,063
- 51431Arthur430
- 51432Aspinwall45
- 51433Auburn567
- 51436Breda815
- 51439Charter Oak818
- 51440Dedham334
- 51441Deloit468
- 51442Denison9,692
- 51443Glidden1,653
- 51444Halbur290
- 51445Ida Grove2,485
- 51446Irwin499
- 51447Kirkman113
- 51448Kiron612
- 51449Lake City1,950
- 51450Lake View1,619
- 51451Lanesboro74
- 51452Lidderdale177
- 51453Lohrville500
- 51454Manilla1,254
- 51455Manning2,279
- 51458Odebolt1,290
- 51459Ralston54
- 51460Ricketts61
- 51461Schleswig1,097
- 51462Scranton1,049
- 51463Templeton412
- 51465Vail689
- 51466Wall Lake1,043
- 51467Westside596
- 51501Council Bluffs34,618
- 51503Council Bluffs37,972
- 51510Carter Lake3,767
- 51520Arion243
- 51521Avoca1,953
- 51523Blencoe379
- 51525Carson1,067
- 51526Crescent1,664
- 51527Defiance362
- 51528Dow City674
- 51529Dunlap1,732
- 51530Earling809
- 51531Elk Horn889
- 51532Elliott644
- 51533Emerson844
- 51534Glenwood8,874
- 51535Griswold1,697
- 51536Hancock613
- 51537Harlan6,382
- 51540Hastings372
- 51541Henderson273
- 51542Loveland802
- 51543Kimballton478
- 51544Lewis793
- 51545Little Sioux267
- 51546Logan3,114
- 51548McClelland415
- 51549Macedonia363
- 51550Magnolia169
- 51551Malvern1,842
- 51552Marne169
- 51553Minden998
- 51554Mineola194
- 51555Missouri Valley4,952
- 51556Modale266
- 51557Mondamin828
- 51558Moorhead549
- 51559Neola1,841
- 51560Oakland1,772
- 51561Pacific Junction1,039
- 51562Panama506
- 51563Persia629
- 51564Pisgah520
- 51565Portsmouth516
- 51566Red Oak7,010
- 51570Shelby1,118
- 51571Silver City902
- 51572Soldier371
- 51573Stanton979
- 51575Treynor1,609
- 51576Underwood1,769
- 51577Walnut1,561
- 51578Westphalia116
- 51579Woodbine2,282
- 51601Shenandoah5,629
- 51630Blanchard160
- 51631Braddyville324
- 51632Clarinda6,624
- 51636Coin455
- 51637College Springs171
- 51638Essex1,258
- 51639Farragut919
- 51640Hamburg1,381
- 51645Imogene419
- 51646New Market767
- 51647Northboro172
- 51648Percival257
- 51649Randolph346
- 51650Riverton197
- 51651Shambaugh103
- 51652Anderson1,569
- 51653Tabor1,446
- 51654Thurman325
- 51656Yorktown57
- 52001Sageville43,101
- 52002Asbury17,005
- 52003Dubuque13,796
- 52030Andrew423
- 52031Bellevue5,403
- 52032Bernard1,305
- 52033Cascade3,292
- 52035Colesburg1,331
- 52036Delaware135
- 52037Delmar1,172
- 52038Dundee463
- 52039Rickardsville1,079
- 52040Dyersville5,584
- 52041Earlville1,468
- 52042Edgewood1,804
- 52043Elkader2,058
- 52044Elkport297
- 52045Epworth2,777
- 52046Farley3,129
- 52047Farmersburg462
- 52048Garber201
- 52049Garnavillo1,370
- 52050Greeley422
- 52052Osterdock2,999
- 52053Holy Cross1,148
- 52054La Motte794
- 52056Luxemburg229
- 52057Manchester8,193
- 52060Maquoketa8,007
- 52064Miles685
- 52065Luxemburg671
- 52066North Buena Vista124
- 52068Peosta5,280
- 52069Spragueville1,743
- 52070Sabula990
- 52071St. Donatus135
- 52072St. Olaf454
- 52073Sherrill1,381
- 52074Spragueville119
- 52075Springbrook125
- 52076Strawberry Point2,258
- 52077Volga313
- 52078Worthington870
- 52079Zwingle995
- 52101Decorah12,706
- 52132Spillville1,759
- 52133Castalia673
- 52134Chester223
- 52135Clermont834
- 52136Cresco5,840
- 52140671
- 52141Elgin1,259
- 52142Fayette1,890
- 52144Fort Atkinson1,075
- 52146Harpers Ferry752
- 52147Hawkeye911
- 52151Lansing1,886
- 52154Lawler592
- 52155Lime Springs1,110
- 52156Luana769
- 52157McGregor1,451
- 52158Marquette290
- 52159Monona2,398
- 52160New Albin818
- 52161Ossian1,532
- 52162Postville3,744
- 52163Protivin333
- 52164Randalia187
- 52165Ridgeway1,098
- 52166St. Lucas137
- 52168Spillville356
- 52169Wadena367
- 52170Waterville555
- 52171Waucoma1,314
- 52172Waukon5,877
- 52175West Union3,484
- 52201Ainsworth1,148
- 52202Alburnett1,269
- 52203Amana2,231
- 52205Anamosa8,627
- 52206Atkins2,564
- 52207Baldwin256
- 52208Belle Plaine2,877
- 52209Blairstown1,158
- 52210Brandon958
- 52211Brooklyn2,795
- 52212Center Junction601
- 52213Center Point4,114
- 52214Central City2,761
- 52215Chelsea960
- 52216Clarence1,551
- 52217Clutier573
- 52218Coggon1,413
- 52219Prairieburg143
- 52220Conroy199
- 52221Guernsey332
- 52222Deep River631
- 52223Delhi1,199
- 52224Dysart2,141
- 52225Elberon387
- 52227Ely2,996
- 52228Fairfax3,802
- 52229Garrison678
- 52231Harper539
- 52232Hartwick277
- 52233Hiawatha7,000
- 52235Hills974
- 52236Homestead564
- 52237Hopkinton1,830
- 52240Iowa City35,074
- 52241Coralville23,250
- 52242Iowa City4,688
- 52245Iowa City22,853
- 52246Iowa City22,308
- 52247Kalona5,914
- 52248Keota1,675
- 52249Keystone1,060
- 52251Ladora544
- 52252Monticello13
- 52253Lisbon2,622
- 52254Lost Nation1,004
- 52255Lowden980
- 52257Luzerne216
- 52301Marengo4,028
- 52302Marion42,706
- 52305Martelle913
- 52306Mechanicsville1,642
- 52307Middle Amana63
- 52308Millersburg129
- 52309Monmouth443
- 52310Monticello6,450
- 52312Morley46
- 52313Mount Auburn480
- 52314Mount Vernon6,200
- 52315Newhall1,339
- 52316North English1,597
- 52317North Liberty23,097
- 52318Norway1,099
- 52320Olin1,425
- 52321Onslow395
- 52322Oxford2,266
- 52323Oxford Junction942
- 52324Palo2,216
- 52325Parnell477
- 52326Quasqueton694
- 52327Riverside3,796
- 52328Robins2,712
- 52329Rowley671
- 52330Ryan940
- 52332Shellsburg1,612
- 52333Solon7,295
- 52334Conroy181
- 52335South English644
- 52336Springville2,397
- 52337Stanwood729
- 52338Swisher3,934
- 52339Tama4,326
- 52340Tiffin6,128
- 52341Robins1,378
- 52342Toledo2,705
- 52344Walker67
- 52345Urbana1,609
- 52346Van Horne1,113
- 52347Victor1,386
- 52348Vining66
- 52349Vinton7,737
- 52351Walford1,329
- 52352Walker1,833
- 52353Washington9,241
- 52354Watkins420
- 52355Webster283
- 52356Wellman2,664
- 52358West Branch3,598
- 52359West Chester308
- 52361Williamsburg4,582
- 52362Wyoming816
- 52401Cedar Rapids2,181
- 52402Cedar Rapids42,938
- 52403Bertram22,551
- 52404Cedar Rapids42,958
- 52405Cedar Rapids26,526
- 52411Hiawatha8,342
- 52501Ottumwa30,371
- 52530Agency945
- 52531Albia6,036
- 52533Batavia1,201
- 52534Beacon321
- 52535Birmingham725
- 52536Blakesburg814
- 52537Bloomfield7,069
- 52540Brighton1,088
- 52542Cantril588
- 52543Kirkville541
- 52544Centerville8,121
- 52548Chillicothe83
- 52549Cincinnati487
- 52550Delta552
- 52551Leando782
- 52552Drakesville940
- 52553Eddyville1,846
- 52554Eldon1,078
- 52555Exline193
- 52556Fairfield11,448
- 52557Fairfield685
- 52560Floris458
- 52561Fremont1,112
- 52562Hayesville52
- 52563Hedrick1,602
- 52565Keosauqua1,518
- 52566Kirkville266
- 52567Libertyville506
- 52568Martinsburg80
- 52569Melrose550
- 52570Milton1,130
- 52571Moravia1,660
- 52572Moulton844
- 52573Mount Sterling148
- 52574Mystic377
- 52576Ollie371
- 52577Beacon14,585
- 52580Packwood711
- 52581Plano168
- 52583Promise City389
- 52584Pulaski420
- 52585Richland838
- 52586Rose Hill600
- 52588Douds91
- 52590Seymour1,464
- 52591Sigourney2,721
- 52593Udell97
- 52594Unionville676
- 52595University Park545
- 52601West Burlington27,341
- 52619Argyle441
- 52620Bonaparte1,097
- 52621Crawfordsville604
- 52623Danville1,982
- 52624Denmark734
- 52625Donnellson2,338
- 52626Farmington1,103
- 52627Fort Madison12,677
- 52630Hillsboro235
- 52631Houghton65
- 52632Mooar11,711
- 52635Lockridge890
- 52637Mediapolis3,041
- 52638Middletown508
- 52639Montrose1,745
- 52640Morning Sun1,274
- 52641Westwood12,428
- 52644Mount Union394
- 52645New London3,503
- 52646Oakville255
- 52647Olds72
- 52649Salem913
- 52650Sperry799
- 52651Stockport398
- 52652Swedesburg119
- 52653Wapello3,083
- 52654Wayland1,884
- 52655Beaverdale4,322
- 52656West Point1,833
- 52657St. Paul65
- 52658Wever927
- 52659Winfield1,329
- 52660Yarmouth279
- 52701Andover124
- 52720Atalissa964
- 52721Bennett809
- 52722Bettendorf41,264
- 52726Blue Grass5,160
- 52727Goose Lake398
- 52728Buffalo984
- 52729Calamus886
- 52730Low Moor4,776
- 52731Charlotte867
- 52732Clinton25,880
- 52737Columbus City323
- 52738Columbus Junction3,398
- 52739Conesville788
- 52742DeWitt7,284
- 52745Dixon443
- 52746Donahue1,240
- 52747Durant2,160
- 52748Long Grove9,594
- 52749Fruitland1,049
- 52750Goose Lake654
- 52751Grand Mound976
- 52752Grandview413
- 52753Le Claire6,020
- 52754Letts1,533
- 52755Lone Tree2,092
- 52756Park View1,982
- 52757Low Moor242
- 52758McCausland298
- 52759Montpelier167
- 52760Moscow992
- 52761Muscatine29,474
- 52765New Liberty427
- 52766Nichols677
- 52767Panorama Park386
- 52768Princeton1,352
- 52769Stockton698
- 52771Andover56
- 52772Tipton5,348
- 52773Maysville2,389
- 52774Welton101
- 52776West Liberty5,090
- 52777Wheatland1,389
- 52778Wilton3,632
- 52801Davenport1,788
- 52802Davenport9,466
- 52803Davenport22,742
- 52804Davenport26,835
- 52806Davenport26,871
- 52807Bettendorf15,617
Towns and townships
Each of the 1,596 with people in it, from ACS 2020–2024 5-year estimates: the county subdivisions that are governments of their own. A city, borough or village that is one too is listed with the places above.
- Adams township (Dallas County)1,791
- Adams township (Delaware County)745
- Adams township (Keokuk County)407
- Adams township (Mahaska County)107
- Adams township (Wapello County)523
- Adel township8,489
- Afton township (Cherokee County)126
- Afton township (Howard County)860
- Agency township1,085
- Albion township (Butler County)2,080
- Albion township (Howard County)480
- Alden township1,125
- Allen township (Harrison County)202
- Allen township (Polk County)4,226
- Allen township (Warren County)4,829
- Allens Grove township875
- Allison township (Lyon County)250
- Allison township (Osceola County)170
- Amaqua township478
- America township11,228
- Amherst township869
- Amity township435
- Amsterdam township808
- Anderson township226
- Arcadia township978
- Arlington township1,950
- Armstrong Grove township876
- Ashton township556
- Athens township449
- Auburn township555
- Audubon township212
- Avery township (Hancock County)365
- Avery township (Humboldt County)224
- Badger township1,094
- Baker township (Guthrie County)239
- Baker township (O'Brien County)165
- Baker township (Osceola County)314
- Baltimore township725
- Bangor township595
- Banks township74
- Banner township970
- Barclay township395
- Barnes township458
- Barton township112
- Bath township226
- Battle township263
- Bear Creek township1,772
- Bear Grove township (Cass County)218
- Bear Grove township (Guthrie County)305
- Beaver township (Boone County)65
- Beaver township (Butler County)1,259
- Beaver township (Dallas County)507
- Beaver township (Grundy County)686
- Beaver township (Guthrie County)526
- Beaver township (Humboldt County)399
- Beaver township (Polk County)3,282
- Bedford township1,373
- Belknap township1,465
- Bellair township378
- Bellevue township2,791
- Bellville township278
- Belmond township401
- Belmont township1,301
- Belvidere township202
- Bennezette township233
- Bennington township307
- Benton township (Benton County)1,245
- Benton township (Cass County)119
- Benton township (Des Moines County)977
- Benton township (Fremont County)257
- Benton township (Keokuk County)1,136
- Benton township (Lucas County)310
- Benton township (Ringgold County)88
- Benton township (Taylor County)294
- Benton township (Wayne County)237
- Bertram township2,381
- Bethel township296
- Big Creek township2,289
- Big Grove township (Benton County)77
- Big Grove township (Johnson County)4,864
- Bingham township441
- Black Hawk township (Black Hawk County)3,105
- Black Hawk township (Grundy County)1,962
- Black Hawk township (Jefferson County)152
- Black Oak township536
- Blaine township (Ida County)400
- Blaine township (Wright County)707
- Blairsburg township200
- Bloomfield township (Clinton County)811
- Bloomfield township (Polk County)33,841
- Bloomfield township (Winneshiek County)702
- Bloomington township (Decatur County)302
- Bloomington township (Muscatine County)24,353
- Blue Grass township3,830
- Bluff Creek township196
- Bluffton township247
- Boardman township1,796
- Bonaparte township517
- Boomer township359
- Boone township (Dallas County)35,220
- Boone township (Hancock County)143
- Booth township43
- Boulder township385
- Boyer township (Crawford County)273
- Boyer township (Harrison County)1,914
- Boyer Valley township1,060
- Bradford township1,995
- Brandon township163
- Bremen township926
- Brighton township (Cass County)225
- Brighton township (Washington County)759
- Bristol township (Greene County)138
- Bristol township (Worth County)526
- Britt township2,015
- Brooke township218
- Brookfield township (Clinton County)320
- Brookfield township (Worth County)111
- Brown township2,108
- Bruce township214
- Buchanan township (Jefferson County)609
- Buchanan township (Page County)326
- Buckeye township234
- Buckingham township211
- Buena Vista township (Clayton County)357
- Buena Vista township (Jasper County)572
- Buffalo township (Buchanan County)424
- Buffalo township (Kossuth County)620
- Buffalo township (Linn County)694
- Buffalo township (Scott County)5,120
- Buffalo township (Winnebago County)1,006
- Buncombe township2,330
- Burnside township230
- Burr Oak township (Mitchell County)205
- Burr Oak township (Winneshiek County)710
- Burrell township308
- Burt township857
- Butler township (Butler County)1,562
- Butler township (Calhoun County)612
- Butler township (Jackson County)284
- Butler township (Scott County)3,239
- Byron township1,215
- Caldwell township240
- Caledonia township288
- Calhoun township (Calhoun County)105
- Calhoun township (Harrison County)263
- Calmar township1,784
- Camanche township4,649
- Cameron township171
- Camp township2,590
- Canaan township464
- Canoe township497
- Canton township448
- Capel township409
- Carl township278
- Carlton township992
- Carroll township (O'Brien County)824
- Carroll township (Tama County)149
- Carson township897
- Cascade township1,288
- Cass township (Boone County)548
- Cass township (Cass County)723
- Cass township (Cedar County)482
- Cass township (Clayton County)1,801
- Cass township (Guthrie County)2,717
- Cass township (Hamilton County)368
- Cass township (Harrison County)270
- Cass township (Jones County)446
- Cass township (Shelby County)413
- Cass township (Wapello County)153
- Castle Grove township469
- Cedar Falls township491
- Cedar township (Benton County)584
- Cedar township (Black Hawk County)1,497
- Cedar township (Calhoun County)288
- Cedar township (Cherokee County)332
- Cedar township (Floyd County)474
- Cedar township (Greene County)94
- Cedar township (Jefferson County)273
- Cedar township (Johnson County)526
- Cedar township (Lee County)367
- Cedar township (Lucas County)185
- Cedar township (Mahaska County)1,285
- Cedar township (Mitchell County)795
- Cedar township (Monroe County)283
- Cedar township (Muscatine County)359
- Cedar township (Pocahontas County)835
- Cedar township (Sac County)452
- Cedar township (Van Buren County)188
- Cedar township (Washington County)215
- Centennial township289
- Center Grove township8,793
- Center township (Allamakee County)381
- Center township (Calhoun County)1,079
- Center township (Cedar County)4,136
- Center township (Clinton County)763
- Center township (Decatur County)230
- Center township (Dubuque County)2,908
- Center township (Emmet County)134
- Center township (Fayette County)257
- Center township (Henry County)1,103
- Center township (Jefferson County)1,233
- Center township (Mills County)579
- Center township (Monona County)119
- Center township (O'Brien County)302
- Center township (Pocahontas County)1,865
- Center township (Pottawattamie County)163
- Center township (Shelby County)526
- Center township (Sioux County)669
- Center township (Wapello County)26,937
- Center township (Winnebago County)2,366
- Chariton township265
- Charleston township824
- Charter Oak township681
- Chequest township225
- Cherokee township5,821
- Chester township (Howard County)252
- Chester township (Poweshiek County)264
- Chickasaw township705
- Cincinnati township246
- Clark township1,712
- Clay township (Clay County)740
- Clay township (Grundy County)1,559
- Clay township (Hardin County)542
- Clay township (Harrison County)76
- Clay township (Jones County)60
- Clay township (Marion County)913
- Clay township (Polk County)23,327
- Clay township (Shelby County)984
- Clay township (Washington County)208
- Clay township (Wayne County)162
- Clay township (Webster County)386
- Clayton township (Clayton County)285
- Clayton township (Taylor County)46
- Clear Creek township (Jasper County)422
- Clear Creek township (Johnson County)10,095
- Clear Creek township (Keokuk County)236
- Clear Lake township (Cerro Gordo County)1,469
- Clear Lake township (Hamilton County)743
- Cleona township497
- Clermont township863
- Cleveland township (Davis County)911
- Cleveland township (Lyon County)223
- Clinton township (Linn County)812
- Clinton township (Ringgold County)99
- Clinton township (Sac County)76
- Clinton township (Wayne County)122
- Coffins Grove township437
- Coldwater township1,780
- Colfax township (Boone County)973
- Colfax township (Dallas County)336
- Colfax township (Grundy County)618
- Colfax township (Page County)127
- Colfax township (Pocahontas County)79
- Colfax township (Webster County)205
- College township568
- Collins township806
- Colony township (Adams County)211
- Colony township (Delaware County)753
- Columbia township (Tama County)221
- Columbia township (Wapello County)1,096
- Columbus City township2,856
- Competine township247
- Concord township (Dubuque County)818
- Concord township (Hancock County)3,319
- Concord township (Hardin County)167
- Concord township (Louisa County)796
- Concord township (Woodbury County)1,717
- Concordia township777
- Cono township307
- Cook township119
- Coon township47
- Coon Valley township236
- Cooper township (Monona County)633
- Cooper township (Webster County)610
- Corinth township315
- Corwin township2,152
- Corydon township1,786
- Cox Creek township138
- Crawford township (Madison County)769
- Crawford township (Washington County)591
- Crescent township1,037
- Cresco township888
- Crocker township68,211
- Crystal township (Hancock County)402
- Crystal township (Tama County)160
- Cummins township434
- Dahlonega township628
- Dale township (Lyon County)155
- Dale township (O'Brien County)451
- Dallas township (Dallas County)248
- Dallas township (Marion County)1,529
- Dallas township (Taylor County)560
- Danville township (Des Moines County)806
- Danville township (Worth County)312
- Dawson township70
- Dayton township (Bremer County)352
- Dayton township (Butler County)132
- Dayton township (Cedar County)1,383
- Dayton township (Chickasaw County)1,552
- Dayton township (Iowa County)197
- Dayton township (Webster County)1,146
- Dayton township (Wright County)369
- Decatur township325
- Decorah township9,351
- Deep Creek township868
- Deep River township490
- Deer Creek township (Mills County)218
- Deer Creek township (Webster County)258
- Deer Creek township (Worth County)131
- Deerfield township563
- Delana township583
- Delaware township (Delaware County)6,740
- Delaware township (Polk County)10,261
- Delaware township (Sac County)287
- Delhi township803
- Denison township8,770
- Denmark township (Emmet County)463
- Denmark township (Lee County)1,121
- Des Moines township (Boone County)13,343
- Des Moines township (Dallas County)2,005
- Des Moines township (Jasper County)2,168
- Des Moines township (Jefferson County)269
- Des Moines township (Lee County)790
- Des Moines township (Pocahontas County)99
- Des Moines township (Polk County)100,004
- Des Moines township (Van Buren County)280
- DeWitt township6,316
- Diamond Lake township411
- Diamond township194
- Dodge township (Boone County)430
- Dodge township (Dubuque County)1,774
- Dodge township (Guthrie County)413
- Dodge township (Union County)399
- Doon township1,018
- Dougherty township148
- Douglas township (Adams County)74
- Douglas township (Appanoose County)122
- Douglas township (Audubon County)191
- Douglas township (Boone County)2,651
- Douglas township (Bremer County)342
- Douglas township (Clay County)191
- Douglas township (Harrison County)205
- Douglas township (Ida County)121
- Douglas township (Madison County)484
- Douglas township (Mitchell County)164
- Douglas township (Montgomery County)217
- Douglas township (Page County)55
- Douglas township (Polk County)12,380
- Douglas township (Sac County)155
- Douglas township (Shelby County)188
- Douglas township (Union County)630
- Douglas township (Webster County)1,094
- Dover township (Fayette County)515
- Dover township (Pocahontas County)102
- Doyle township188
- Drakesville township515
- Dresden township475
- Dubuque township7,800
- Dutch Creek township391
- Eagle Grove township3,812
- Eagle township (Black Hawk County)314
- Eagle township (Kossuth County)74
- Eagle township (Sioux County)193
- East Boyer township396
- East Des Moines township111
- East Holman township1,200
- East Lancaster township10
- East Lincoln township (Mitchell County)417
- East Lincoln township (Warren County)985
- East Lucas township368
- East Orange township786
- East River township190
- East township1,211
- East Waterloo township1,163
- Eden township (Benton County)414
- Eden township (Carroll County)475
- Eden township (Clinton County)557
- Eden township (Decatur County)369
- Eden township (Fayette County)561
- Eden township (Marshall County)714
- Eden township (Sac County)202
- Eden township (Winnebago County)185
- Edna township44
- Eldora township273
- Eldorado township1,326
- Elgin township (Lyon County)532
- Elgin township (Plymouth County)195
- Eliot township385
- Elk Creek township433
- Elk River township1,073
- Elk township (Buena Vista County)124
- Elk township (Clayton County)288
- Elk township (Delaware County)719
- Elkhart township1,609
- Elkhorn township (Plymouth County)232
- Elkhorn township (Webster County)678
- Ell township769
- Ellington township (Hancock County)446
- Ellington township (Palo Alto County)57
- Ellis township341
- Ellsworth township (Emmet County)219
- Ellsworth township (Hamilton County)546
- Elm Grove township (Calhoun County)63
- Elm Grove township (Louisa County)230
- Emmet township264
- Emmetsburg township2,712
- English River township (Keokuk County)588
- English River township (Washington County)4,610
- English township (Iowa County)1,463
- English township (Lucas County)548
- Erin township59
- Estherville township6,218
- Etna township1,801
- Eureka township (Adair County)17
- Eureka township (Sac County)827
- Ewoldt township251
- Excelsior township99
- Exira township972
- Fabius township226
- Fairbank township1,657
- Fairfax township4,675
- Fairfield township (Buena Vista County)879
- Fairfield township (Cedar County)188
- Fairfield township (Fayette County)642
- Fairfield township (Grundy County)505
- Fairfield township (Jackson County)157
- Fairfield township (Palo Alto County)283
- Fairview township (Allamakee County)134
- Fairview township (Jasper County)2,611
- Fairview township (Jones County)7,338
- Fairview township (Monona County)109
- Fairview township (Osceola County)321
- Fairview township (Shelby County)254
- Falls township1,036
- Farmers Creek township405
- Farmersburg township444
- Farmington township (Cedar County)2,189
- Farmington township (Van Buren County)881
- Fayette township (Decatur County)150
- Fayette township (Linn County)1,543
- Felix township185
- Fenton township443
- Fern Valley township140
- Fertile township650
- Fillmore township696
- Fisher township719
- Flint River township1,924
- Florence township1,905
- Floyd township (Floyd County)662
- Floyd township (O'Brien County)5,503
- Floyd township (Sioux County)1,142
- Floyd township (Woodbury County)746
- Forest City township606
- Forest township4,542
- Four Mile township11,559
- Fox River township411
- Fox township651
- Frankfort township248
- Franklin township (Allamakee County)218
- Franklin township (Appanoose County)734
- Franklin township (Bremer County)400
- Franklin township (Cass County)199
- Franklin township (Clarke County)134
- Franklin township (Decatur County)323
- Franklin township (Des Moines County)825
- Franklin township (Greene County)140
- Franklin township (Lee County)1,163
- Franklin township (Linn County)7,313
- Franklin township (Marion County)286
- Franklin township (Monona County)272
- Franklin township (Monroe County)151
- Franklin township (O'Brien County)1,373
- Franklin township (Polk County)5,485
- Franklin township (Story County)25,578
- Franklin township (Washington County)430
- Frankville township559
- Fredericksburg township917
- Frederika township410
- Fredonia township254
- Freedom township (Hamilton County)209
- Freedom township (Palo Alto County)1,266
- Freeman township384
- Fremont township (Benton County)2,670
- Fremont township (Bremer County)1,735
- Fremont township (Buchanan County)221
- Fremont township (Butler County)374
- Fremont township (Cedar County)983
- Fremont township (Clarke County)591
- Fremont township (Fayette County)548
- Fremont township (Hamilton County)216
- Fremont township (Johnson County)1,631
- Fremont township (Page County)229
- Fremont township (Winneshiek County)173
- French Creek township219
- Fruitland township2,418
- Fulton township (Muscatine County)822
- Fulton township (Webster County)357
- Galva township624
- Garden Grove township377
- Garden township1,272
- Garfield township (Calhoun County)157
- Garfield township (Clay County)212
- Garfield township (Hancock County)301
- Garfield township (Ida County)127
- Garfield township (Kossuth County)178
- Garfield township (Lyon County)264
- Garfield township (Mahaska County)1,116
- Garfield township (Montgomery County)119
- Garfield township (Plymouth County)1,700
- Garfield township (Pocahontas County)231
- Garfield township (Sioux County)154
- Garnavillo township987
- Garner township7,815
- Gay township34
- Geneseo township (Cerro Gordo County)1,031
- Geneseo township (Tama County)435
- Geneva township413
- German township (Grundy County)145
- German township (Kossuth County)82
- Giard township124
- Gillett Grove township270
- Gilman township556
- Glenwood township (Mills County)6,037
- Glenwood township (Winneshiek County)341
- Glidden township1,400
- Goewey township225
- Goodrich township248
- Goshen township516
- Gower township310
- Gowrie township1,069
- Graham township645
- Grand Meadow township (Cherokee County)209
- Grand Meadow township (Clayton County)544
- Grand River township (Adair County)153
- Grand River township (Decatur County)10
- Grand River township (Madison County)107
- Grand River township (Wayne County)351
- Grandview township1,208
- Grange township194
- Grant township (Adams County)185
- Grant township (Boone County)365
- Grant township (Buena Vista County)427
- Grant township (Carroll County)343
- Grant township (Cass County)1,046
- Grant township (Cerro Gordo County)316
- Grant township (Clinton County)351
- Grant township (Dallas County)1,839
- Grant township (Franklin County)378
- Grant township (Greene County)205
- Grant township (Grundy County)1,829
- Grant township (Guthrie County)286
- Grant township (Hardin County)123
- Grant township (Ida County)163
- Grant township (Kossuth County)112
- Grant township (Linn County)1,221
- Grant township (Lyon County)232
- Grant township (Monona County)158
- Grant township (Montgomery County)531
- Grant township (O'Brien County)108
- Grant township (Page County)5,300
- Grant township (Plymouth County)350
- Grant township (Pocahontas County)153
- Grant township (Poweshiek County)395
- Grant township (Ringgold County)185
- Grant township (Sioux County)576
- Grant township (Story County)1,368
- Grant township (Tama County)297
- Grant township (Taylor County)509
- Grant township (Union County)282
- Grant township (Winnebago County)222
- Grant township (Woodbury County)125
- Grant township (Wright County)1,428
- Great Oak township152
- Greeley township (Audubon County)223
- Greeley township (Shelby County)72
- Green Bay township (Clarke County)191
- Green Bay township (Lee County)516
- Green township (Fremont County)472
- Green township (Wapello County)818
- Greenbrier township199
- Greencastle township1,123
- Greene township264
- Greenfield township (Adair County)1,932
- Greenfield township (Calhoun County)217
- Greenfield township (Jones County)891
- Greenfield township (Warren County)8,591
- Greenwood township718
- Griggs township1,688
- Grimes township859
- Grove township (Adair County)140
- Grove township (Cass County)7,084
- Grove township (Davis County)289
- Grove township (Humboldt County)157
- Grove township (Pottawattamie County)171
- Grove township (Shelby County)19
- Grove township (Taylor County)144
- Grove township (Worth County)2,436
- Guilford township101
- Hale township358
- Hamilton township (Decatur County)113
- Hamilton township (Franklin County)153
- Hamilton township (Hamilton County)167
- Hamlin township134
- Hampshire township625
- Hancock township312
- Hanover township (Allamakee County)110
- Hanover township (Crawford County)97
- Hardin township (Greene County)275
- Hardin township (Hardin County)5,704
- Hardin township (Johnson County)382
- Hardin township (Pottawattamie County)1,197
- Hardin township (Webster County)85
- Harlan township (Fayette County)792
- Harlan township (Page County)353
- Harrisburg township514
- Harrison township (Adair County)145
- Harrison township (Benton County)437
- Harrison township (Boone County)433
- Harrison township (Harrison County)1,344
- Harrison township (Kossuth County)629
- Harrison township (Lee County)236
- Harrison township (Mahaska County)972
- Harrison township (Osceola County)144
- Hartford township1,219
- Hartland township88
- Hartley township1,873
- Hayes township (Buena Vista County)1,111
- Hayes township (Crawford County)111
- Hayes township (Ida County)147
- Hazel Dell township1,318
- Hazel Green township191
- Hazleton township1,594
- Hebron township128
- Henry township (Plymouth County)268
- Henry township (Van Buren County)63
- Herdland township157
- Hesper township216
- Hickory Grove township (Jasper County)530
- Hickory Grove township (Scott County)529
- High Lake township465
- High Point township91
- Highland township (Clayton County)186
- Highland township (Greene County)542
- Highland township (Guthrie County)491
- Highland township (O'Brien County)312
- Highland township (Palo Alto County)887
- Highland township (Tama County)203
- Highland township (Union County)354
- Highland township (Wapello County)79
- Highland township (Washington County)210
- Highland township (Winneshiek County)207
- Hilton township581
- Holland township6,606
- Holt township68
- Homer township (Benton County)215
- Homer township (Buchanan County)628
- Honey Creek township (Delaware County)916
- Honey Creek township (Iowa County)253
- Horton township172
- Howard Center township153
- Howard township (Howard County)354
- Howard township (Story County)2,376
- Howard township (Tama County)241
- Howard township (Wayne County)43
- Humboldt township545
- Hungerford township1,890
- Huron township393
- Illyria township348
- Independence township (Appanoose County)287
- Independence township (Hamilton County)356
- Independence township (Jasper County)1,746
- Independence township (Palo Alto County)149
- Indian Creek township (Mills County)965
- Indian Creek township (Story County)1,951
- Indian Village township986
- Indiana township615
- Ingham township294
- Ingraham township829
- Inland township725
- Iowa Lake township95
- Iowa township (Allamakee County)723
- Iowa township (Benton County)337
- Iowa township (Cedar County)689
- Iowa township (Crawford County)153
- Iowa township (Dubuque County)549
- Iowa township (Iowa County)596
- Iowa township (Jackson County)522
- Iowa township (Washington County)2,593
- Iowa township (Wright County)290
- Irvington township165
- Jack Creek township134
- Jackson township (Adair County)361
- Jackson township (Benton County)855
- Jackson township (Boone County)995
- Jackson township (Bremer County)1,471
- Jackson township (Butler County)641
- Jackson township (Calhoun County)154
- Jackson township (Clarke County)521
- Jackson township (Crawford County)85
- Jackson township (Des Moines County)103
- Jackson township (Greene County)143
- Jackson township (Guthrie County)633
- Jackson township (Hardin County)202
- Jackson township (Harrison County)589
- Jackson township (Henry County)551
- Jackson township (Jackson County)611
- Jackson township (Jones County)376
- Jackson township (Keokuk County)329
- Jackson township (Lee County)1,658
- Jackson township (Linn County)1,413
- Jackson township (Lucas County)453
- Jackson township (Madison County)320
- Jackson township (Monroe County)237
- Jackson township (Poweshiek County)1,733
- Jackson township (Sac County)2,085
- Jackson township (Shelby County)262
- Jackson township (Taylor County)53
- Jackson township (Van Buren County)1,333
- Jackson township (Warren County)978
- Jackson township (Washington County)614
- Jackson township (Wayne County)229
- Jackson township (Webster County)372
- Jackson township (Winneshiek County)210
- Jacksonville township352
- James township165
- Jamestown township772
- Jasper township (Adams County)444
- Jasper township (Carroll County)206
- Jefferson township (Adair County)170
- Jefferson township (Allamakee County)519
- Jefferson township (Bremer County)3,584
- Jefferson township (Buchanan County)994
- Jefferson township (Butler County)119
- Jefferson township (Clayton County)2,675
- Jefferson township (Dubuque County)1,302
- Jefferson township (Fayette County)6,295
- Jefferson township (Harrison County)1,891
- Jefferson township (Henry County)1,454
- Jefferson township (Johnson County)4,334
- Jefferson township (Lee County)1,188
- Jefferson township (Louisa County)200
- Jefferson township (Madison County)731
- Jefferson township (Mahaska County)304
- Jefferson township (Marshall County)880
- Jefferson township (Polk County)14,527
- Jefferson township (Poweshiek County)404
- Jefferson township (Ringgold County)148
- Jefferson township (Shelby County)849
- Jefferson township (Taylor County)144
- Jefferson township (Warren County)2,292
- Jefferson township (Wayne County)22
- Jenkins township897
- Johns township238
- Johnson township (Plymouth County)152
- Johnson township (Webster County)403
- Jones township310
- Jordan township184
- Junction township808
- Kane township1,021
- Kedron township619
- Keg Creek township948
- Kellogg township1,062
- Kendrick township149
- Kennebec township310
- Kensett township433
- Keokuk township772
- King township578
- Kniest township364
- Knox township (Clarke County)278
- Knox township (Pottawattamie County)1,757
- Knoxville township10,089
- La Grange township454
- Lafayette township (Allamakee County)259
- Lafayette township (Bremer County)619
- Lafayette township (Keokuk County)1,277
- Lafayette township (Story County)3,126
- Lake Creek township251
- Lake Prairie township12,903
- Lake township (Cerro Gordo County)189
- Lake township (Clay County)185
- Lake township (Humboldt County)168
- Lake township (Monona County)210
- Lake township (Muscatine County)257
- Lake township (Pocahontas County)337
- Lake township (Pottawattamie County)1,249
- Lake township (Wright County)168
- Lakeport township201
- Lakeville township1,502
- Lansing township1,342
- Larchwood township1,617
- Layton township1,454
- Le Claire township6,077
- Le Grand township1,402
- Le Roy township273
- Ledyard township434
- Lee township (Adair County)40
- Lee township (Buena Vista County)109
- Lee township (Franklin County)75
- Lee township (Madison County)1,163
- Lee township (Polk County)64,103
- Lenox township2,312
- Leroy township (Audubon County)2,347
- Leroy township (Benton County)1,139
- Lester township1,337
- Levey township904
- Lewis township12,110
- Liberal township386
- Liberty township (Buchanan County)1,237
- Liberty township (Cherokee County)179
- Liberty township (Clarke County)228
- Liberty township (Clinton County)311
- Liberty township (Dubuque County)598
- Liberty township (Hamilton County)213
- Liberty township (Hancock County)216
- Liberty township (Jefferson County)448
- Liberty township (Johnson County)1,401
- Liberty township (Keokuk County)413
- Liberty township (Lucas County)444
- Liberty township (Marion County)963
- Liberty township (Marshall County)235
- Liberty township (Mitchell County)237
- Liberty township (O'Brien County)235
- Liberty township (Plymouth County)310
- Liberty township (Ringgold County)264
- Liberty township (Scott County)557
- Liberty township (Warren County)429
- Liberty township (Woodbury County)957
- Liberty township (Wright County)664
- Lick Creek township (Davis County)863
- Lick Creek township (Van Buren County)459
- Lime Creek township (Cerro Gordo County)532
- Lime Creek township (Washington County)2,186
- Lincoln township (Adair County)990
- Lincoln township (Adams County)22
- Lincoln township (Appanoose County)173
- Lincoln township (Audubon County)266
- Lincoln township (Black Hawk County)374
- Lincoln township (Buena Vista County)64
- Lincoln township (Calhoun County)1,824
- Lincoln township (Cass County)58
- Lincoln township (Cerro Gordo County)399
- Lincoln township (Clay County)259
- Lincoln township (Dallas County)257
- Lincoln township (Emmet County)260
- Lincoln township (Grundy County)235
- Lincoln township (Hamilton County)662
- Lincoln township (Harrison County)110
- Lincoln township (Iowa County)236
- Lincoln township (Johnson County)174
- Lincoln township (Kossuth County)115
- Lincoln township (Lucas County)451
- Lincoln township (Madison County)685
- Lincoln township (Mahaska County)369
- Lincoln township (Monona County)281
- Lincoln township (Montgomery County)117
- Lincoln township (O'Brien County)61
- Lincoln township (Page County)345
- Lincoln township (Plymouth County)232
- Lincoln township (Pocahontas County)127
- Lincoln township (Polk County)1,473
- Lincoln township (Pottawattamie County)320
- Lincoln township (Poweshiek County)328
- Lincoln township (Ringgold County)75
- Lincoln township (Scott County)482
- Lincoln township (Shelby County)245
- Lincoln township (Sioux County)2,694
- Lincoln township (Story County)759
- Lincoln township (Tama County)224
- Lincoln township (Union County)229
- Lincoln township (Winnebago County)218
- Lincoln township (Winneshiek County)785
- Lincoln township (Worth County)1,677
- Lincoln township (Wright County)1,411
- Linden township125
- Linn township (Cedar County)134
- Linn township (Dallas County)694
- Linn township (Linn County)817
- Linn township (Warren County)11,330
- Linton township420
- Liscomb township314
- Liston township306
- Little Sioux township (Harrison County)207
- Little Sioux township (Woodbury County)285
- Lizard township116
- Lloyd township663
- Lockridge township809
- Locust Grove township (Fremont County)150
- Locust Grove township (Jefferson County)791
- Lodomillo township668
- Logan township (Calhoun County)34
- Logan township (Clay County)123
- Logan township (Ida County)120
- Logan township (Lyon County)400
- Logan township (Marshall County)1,053
- Logan township (Sioux County)626
- Logan township (Winnebago County)162
- Lone Tree township822
- Long Creek township332
- Lost Grove township597
- Lost Island township157
- Lotts Creek township (Kossuth County)52
- Lotts Creek township (Ringgold County)47
- Lovell township5,238
- Lu Verne township439
- Ludlow township611
- Lynn Grove township1,973
- Lynn township470
- Lyon township (Hamilton County)1,411
- Lyon township (Lyon County)454
- Lyons township165
- Macedonia township344
- Madison township (Buchanan County)668
- Madison township (Butler County)235
- Madison township (Clarke County)132
- Madison township (Fremont County)85
- Madison township (Hancock County)527
- Madison township (Johnson County)4,645
- Madison township (Jones County)631
- Madison township (Lee County)9,121
- Madison township (Madison County)1,633
- Madison township (Mahaska County)328
- Madison township (Polk County)6,101
- Madison township (Poweshiek County)648
- Madison township (Winneshiek County)259
- Magnolia township893
- Magor township417
- Maine township1,565
- Makee township3,967
- Malaka township435
- Malcom township597
- Mallory township387
- Mantua township214
- Maple River township364
- Maple township (Ida County)1,047
- Maple township (Monona County)701
- Maple Valley township53
- Maquoketa township2,966
- Marcus township499
- Marcy township1,252
- Marengo township2,647
- Marietta township190
- Marion township (Clayton County)310
- Marion township (Davis County)407
- Marion township (Franklin County)1,184
- Marion township (Hamilton County)932
- Marion township (Henry County)462
- Marion township (Lee County)281
- Marion township (Linn County)44,817
- Marion township (Marshall County)823
- Marion township (Plymouth County)676
- Marion township (Washington County)720
- Mariposa township102
- Marshall township (Louisa County)98
- Marshall township (Pocahontas County)103
- Marshall township (Taylor County)155
- Mason township (Cerro Gordo County)278
- Mason township (Taylor County)352
- Massena township595
- Massillon township272
- Maxfield township1,279
- Meadow township (Clay County)270
- Meadow township (Plymouth County)196
- Melrose township135
- Melville township126
- Mendon township1,707
- Mercer township199
- Middle Fork township50
- Middlefield township274
- Midland township94
- Milford township (Crawford County)342
- Milford township (Dickinson County)1,155
- Milford township (Story County)580
- Military township1,232
- Miller township174
- Millville township422
- Milo township1,182
- Minden township1,042
- Minerva township597
- Mitchell township228
- Monmouth township575
- Monona township2,409
- Monroe township (Benton County)106
- Monroe township (Butler County)1,492
- Monroe township (Fremont County)177
- Monroe township (Johnson County)643
- Monroe township (Linn County)14,053
- Monroe township (Madison County)675
- Monroe township (Mahaska County)225
- Monroe township (Monroe County)567
- Monroe township (Ringgold County)62
- Monroe township (Shelby County)161
- Monroe township (Wayne County)266
- Montpelier township1,079
- Montrose township1,302
- Morgan township (Crawford County)254
- Morgan township (Decatur County)110
- Morgan township (Franklin County)197
- Morgan township (Harrison County)512
- Morgan township (Woodbury County)137
- Morning Sun township1,225
- Morton township67
- Mosalem township1,995
- Moscow township870
- Mott township263
- Mound Prairie township710
- Mount Valley township723
- Mount Vernon township (Black Hawk County)1,492
- Mount Vernon township (Cerro Gordo County)332
- Moville township766
- Nassau township2,266
- Nebraska township67
- Neola township1,296
- Nevada township (Palo Alto County)28
- Nevada township (Story County)7,025
- New Albany township933
- New Buda township263
- New Hampton township3,139
- New Hope township581
- New London township2,685
- New Oregon township735
- New Wine township4,558
- Newark township206
- Newburg township495
- Newell township1,214
- Newport township1,988
- Newton township (Buchanan County)187
- Newton township (Carroll County)351
- Newton township (Jasper County)15,266
- Newton township (Winnebago County)226
- Niles township219
- Nishnabotny township1,064
- Noble township200
- Nodaway township (Adams County)113
- Nodaway township (Page County)5,775
- Nodaway township (Taylor County)72
- Nokomis township2,514
- North Fork township174
- Norwalk township1,396
- Norway township (Humboldt County)386
- Norway township (Winnebago County)230
- Norway township (Wright County)182
- Oak Dale township157
- Oak township2,686
- Oakfield township267
- Oakland township (Franklin County)202
- Oakland township (Louisa County)523
- Ocheyedan township593
- Ohio township868
- Okoboji township2,425
- Olive township826
- Omega township153
- Oneida township (Delaware County)1,422
- Oneida township (Tama County)496
- Oran township701
- Orange township (Black Hawk County)667
- Orange township (Clinton County)944
- Orange township (Guthrie County)157
- Oregon township988
- Orient township661
- Orleans township334
- Orono township652
- Orthel township160
- Osage township3,658
- Osceola township (Clarke County)377
- Osceola township (Franklin County)144
- Otho township665
- Oto township439
- Otranto township317
- Otter Creek township (Crawford County)1,198
- Otter Creek township (Jackson County)861
- Otter Creek township (Linn County)1,383
- Otter Creek township (Lucas County)246
- Otter Creek township (Tama County)135
- Otter township1,141
- Owen township224
- Oxford township (Johnson County)1,811
- Oxford township (Jones County)640
- Paint Creek township412
- Palermo township3,038
- Palestine township6,779
- Palmyra township751
- Palo Alto township4,245
- Paradise township270
- Paris township297
- Paton township392
- Penn township (Guthrie County)381
- Penn township (Jefferson County)294
- Penn township (Johnson County)31,822
- Penn township (Madison County)610
- Peoples township382
- Perry township (Buchanan County)3,197
- Perry township (Davis County)539
- Perry township (Jackson County)816
- Perry township (Plymouth County)985
- Perry township (Tama County)1,822
- Peru township1,483
- Peterson township411
- Pierce township1,190
- Pike township702
- Pilot Grove township116
- Pilot Mound township162
- Pilot township (Cherokee County)210
- Pilot township (Iowa County)378
- Pioneer township1,459
- Pitcher township1,184
- Pittsford township933
- Plank township383
- Plato township541
- Platte township (Taylor County)1,683
- Platte township (Union County)189
- Plattville township456
- Pleasant Grove township (Des Moines County)503
- Pleasant Grove township (Floyd County)173
- Pleasant Grove township (Mahaska County)127
- Pleasant Grove township (Marion County)2,951
- Pleasant Ridge township159
- Pleasant township (Appanoose County)653
- Pleasant township (Cass County)1,059
- Pleasant township (Hardin County)249
- Pleasant township (Lucas County)173
- Pleasant township (Monroe County)241
- Pleasant township (Pottawattamie County)171
- Pleasant township (Poweshiek County)196
- Pleasant township (Union County)84
- Pleasant township (Wapello County)241
- Pleasant township (Winneshiek County)539
- Pleasant township (Wright County)2,754
- Pleasant Valley township (Carroll County)530
- Pleasant Valley township (Cerro Gordo County)442
- Pleasant Valley township (Fayette County)939
- Pleasant Valley township (Grundy County)261
- Pleasant Valley township (Johnson County)150
- Pleasant Valley township (Scott County)41,593
- Pleasant Valley township (Webster County)694
- Plum Creek township422
- Plymouth township1,011
- Poe township196
- Poland township318
- Polk township (Benton County)2,306
- Polk township (Bremer County)916
- Polk township (Jefferson County)844
- Polk township (Shelby County)85
- Polk township (Taylor County)58
- Polk township (Wapello County)696
- Port Louisa township748
- Portland township (Cerro Gordo County)303
- Portland township (Kossuth County)111
- Portland township (Plymouth County)1,920
- Post township2,887
- Poweshiek township1,234
- Powhatan township136
- Poyner township2,739
- Prairie Creek township699
- Prairie Springs township403
- Prairie township (Davis County)596
- Prairie township (Delaware County)183
- Prairie township (Fremont County)143
- Prairie township (Keokuk County)274
- Prairie township (Kossuth County)97
- Prairie township (Mahaska County)1,683
- Prescott township330
- Preston township229
- Princeton township1,336
- Providence township (Buena Vista County)127
- Providence township (Hardin County)265
- Prussia township96
- Putnam township (Fayette County)252
- Putnam township (Linn County)2,846
- Pymosa township435
- Quincy township1,551
- Raglan township221
- Ramsey township161
- Rawles township757
- Read township326
- Reading township (Calhoun County)687
- Reading township (Sioux County)610
- Red Oak township (Cedar County)227
- Red Oak township (Montgomery County)5,843
- Red Rock township582
- Reeve township141
- Remsen township1,888
- Rice township43
- Richland township (Adair County)129
- Richland township (Carroll County)224
- Richland township (Chickasaw County)267
- Richland township (Decatur County)279
- Richland township (Delaware County)530
- Richland township (Dickinson County)189
- Richland township (Franklin County)102
- Richland township (Guthrie County)437
- Richland township (Jackson County)445
- Richland township (Jasper County)170
- Richland township (Jones County)547
- Richland township (Keokuk County)749
- Richland township (Lyon County)1,108
- Richland township (Mahaska County)410
- Richland township (Sac County)1,009
- Richland township (Story County)281
- Richland township (Tama County)92
- Richland township (Wapello County)1,022
- Richland township (Warren County)1,245
- Richman township685
- Riley township114
- Ripley township103
- Riverdale township308
- Riverside township (Fremont County)311
- Riverside township (Lyon County)410
- Riverton township (Clay County)205
- Riverton township (Floyd County)400
- Riverton township (Fremont County)211
- Rochester township1,013
- Rock Creek township1,206
- Rock Grove township1,716
- Rock township (Cherokee County)77
- Rock township (Lyon County)3,297
- Rock township (Mitchell County)260
- Rock township (Sioux County)4,680
- Rock township (Woodbury County)840
- Rockford township (Floyd County)1,325
- Rockford township (Pottawattamie County)472
- Roland township534
- Rome township1,324
- Roosevelt township48
- Rose Grove township172
- Roselle township653
- Ross township (Franklin County)404
- Ross township (Taylor County)100
- Round Prairie township372
- Rudd township696
- Rush Lake township385
- Rutland township (Humboldt County)297
- Rutland township (Woodbury County)491
- Sac township414
- Salem township811
- Salt Creek township (Davis County)331
- Salt Creek township (Tama County)778
- Sand Creek township126
- Saratoga township325
- Saylor township6,753
- Scotch Grove township572
- Scott township (Buena Vista County)169
- Scott township (Fayette County)131
- Scott township (Floyd County)172
- Scott township (Franklin County)495
- Scott township (Fremont County)273
- Scott township (Hamilton County)167
- Scott township (Henry County)1,219
- Scott township (Johnson County)1,941
- Scott township (Madison County)875
- Scott township (Mahaska County)500
- Scott township (Montgomery County)841
- Scott township (Poweshiek County)194
- Scranton township807
- Seely township151
- Seneca township174
- Settlers township107
- Seventy-Six township (Muscatine County)439
- Seventy-Six township (Washington County)182
- Sharon township (Appanoose County)104
- Sharon township (Audubon County)526
- Sharon township (Clinton County)840
- Sharon township (Johnson County)1,625
- Shelby township968
- Shell Rock township1,917
- Sheridan township (Carroll County)284
- Sheridan township (Cherokee County)640
- Sheridan township (Poweshiek County)187
- Sheridan township (Scott County)7,464
- Sheridan township (Sioux County)961
- Sherman township (Calhoun County)602
- Sherman township (Hardin County)945
- Sherman township (Jasper County)394
- Sherman township (Kossuth County)243
- Sherman township (Monona County)348
- Sherman township (Montgomery County)678
- Sherman township (Pocahontas County)173
- Sherman township (Sioux County)390
- Sherman township (Story County)160
- Shiloh township954
- Sidney township1,450
- Sigourney township2,067
- Silver Creek township (Ida County)59
- Silver Creek township (Mills County)101
- Silver Creek township (Pottawattamie County)921
- Silver Lake township (Dickinson County)1,256
- Silver Lake township (Palo Alto County)279
- Silver Lake township (Worth County)396
- Silver township151
- Sioux township (Clay County)350
- Sioux township (Lyon County)377
- Sioux township (Monona County)46
- Sioux township (Plymouth County)176
- Sioux township (Sioux County)117
- Sloan township1,118
- Smithfield township348
- Soap Creek township427
- Soldier township (Crawford County)154
- Soldier township (Monona County)331
- South Fork township (Delaware County)1,233
- South Fork township (Jackson County)4,371
- South Fork township (Wayne County)340
- South township1,586
- Spaulding township190
- Sperry township352
- Spirit Lake township1,122
- Spring Creek township (Black Hawk County)325
- Spring Creek township (Mahaska County)1,601
- Spring Creek township (Tama County)1,444
- Spring Grove township764
- Spring Rock township1,289
- Spring township301
- Spring Valley township (Dallas County)8,575
- Spring Valley township (Monona County)347
- Springdale township3,065
- Springfield township (Cedar County)906
- Springfield township (Kossuth County)18
- Springfield township (Winneshiek County)388
- Squaw Creek township651
- St. Ansgar township1,632
- St. Charles township1,378
- St. Clair township (Benton County)465
- St. Clair township (Monona County)530
- St. John township4,046
- St. Marys township86
- Stacyville township761
- Stanton township344
- Stapleton township739
- State Center township1,635
- Steady Run township173
- Stockholm township197
- Stuart township1,013
- Sugar Creek township (Cedar County)188
- Sugar Creek township (Poweshiek County)361
- Sugar Grove township962
- Summerset township1,103
- Summit township (Adair County)1,122
- Summit township (Clay County)416
- Summit township (Marion County)1,694
- Summit township (O'Brien County)602
- Sumner No. 2 township266
- Sumner township (Buchanan County)3,093
- Sumner township (Iowa County)598
- Sumner township (Webster County)334
- Sumner township (Winneshiek County)375
- Superior township350
- Swan Lake township (Emmet County)63
- Swan Lake township (Pocahontas County)1,304
- Swea township30
- Sweetland township2,120
- Table Mound township3,440
- Tama township (Des Moines County)755
- Tama township (Tama County)3,117
- Tarkio township240
- Taylor township (Allamakee County)552
- Taylor township (Appanoose County)727
- Taylor township (Benton County)981
- Taylor township (Dubuque County)4,673
- Taylor township (Harrison County)380
- Taylor township (Marshall County)19,661
- Tete Des Morts township1,167
- Thompson township462
- Tilden township225
- Timber Creek township10,246
- Tingley township248
- Tippecanoe township866
- Tipton township1,088
- Toledo township2,777
- Trenton township267
- Troy township (Clarke County)985
- Troy township (Iowa County)3,611
- Troy township (Monroe County)4,662
- Troy township (Wright County)99
- Twelve Mile Lake township71
- Twin Lake township283
- Twin Lakes township1,526
- Udell township385
- Ulster township367
- Union City township170
- Union Prairie township828
- Union township (Adair County)103
- Union township (Adams County)133
- Union township (Appanoose County)302
- Union township (Benton County)783
- Union township (Black Hawk County)549
- Union township (Boone County)367
- Union township (Calhoun County)431
- Union township (Carroll County)1,584
- Union township (Cass County)518
- Union township (Cerro Gordo County)191
- Union township (Crawford County)685
- Union township (Dallas County)2,076
- Union township (Davis County)180
- Union township (Delaware County)604
- Union township (Des Moines County)701
- Union township (Fayette County)408
- Union township (Floyd County)514
- Union township (Guthrie County)44
- Union township (Hardin County)963
- Union township (Harrison County)379
- Union township (Jackson County)774
- Union township (Johnson County)586
- Union township (Kossuth County)374
- Union township (Louisa County)105
- Union township (Lucas County)237
- Union township (Madison County)539
- Union township (Mahaska County)145
- Union township (Marion County)513
- Union township (Mitchell County)114
- Union township (Monroe County)650
- Union township (O'Brien County)999
- Union township (Plymouth County)78
- Union township (Polk County)296
- Union township (Poweshiek County)600
- Union township (Ringgold County)207
- Union township (Shelby County)700
- Union township (Story County)1,303
- Union township (Union County)1,184
- Union township (Van Buren County)739
- Union township (Warren County)504
- Union township (Wayne County)108
- Union township (Woodbury County)568
- Union township (Worth County)478
- Urbana township138
- Utica township182
- Valley township (Guthrie County)1,877
- Valley township (Page County)258
- Valley township (Pottawattamie County)461
- Van Buren township (Jackson County)1,670
- Van Buren township (Keokuk County)350
- Van Buren township (Lee County)194
- Van Buren township (Van Buren County)1,278
- Van Meter township5,253
- Vermillion township899
- Vernon Springs township4,454
- Vernon township (Dubuque County)4,171
- Vernon township (Humboldt County)392
- Vernon township (Palo Alto County)74
- Vernon township (Van Buren County)98
- Vernon township (Wright County)36
- Victoria township104
- Victory township556
- Vienna township257
- Village township534
- Viola township (Audubon County)164
- Viola township (Osceola County)174
- Viola township (Sac County)556
- Virginia township925
- Volga township581
- Wacousta township150
- Wagner township226
- Wall Lake township (Sac County)1,218
- Wall Lake township (Wright County)101
- Walnut township (Adair County)141
- Walnut township (Appanoose County)527
- Walnut township (Dallas County)39,414
- Walnut township (Fremont County)145
- Walnut township (Jefferson County)155
- Walnut township (Madison County)251
- Walnut township (Palo Alto County)1,251
- Walnut township (Polk County)69,695
- Walnut township (Wayne County)1,101
- Wapello township2,304
- Wapsinonoc township4,750
- Ward township261
- Warren township (Bremer County)570
- Warren township (Keokuk County)492
- Warren township (Lucas County)102
- Warren township (Poweshiek County)545
- Warren township (Story County)581
- Warren township (Wayne County)616
- Washington township (Adair County)157
- Washington township (Adams County)82
- Washington township (Appanoose County)635
- Washington township (Black Hawk County)940
- Washington township (Bremer County)397
- Washington township (Buchanan County)4,272
- Washington township (Buena Vista County)771
- Washington township (Butler County)182
- Washington township (Carroll County)160
- Washington township (Cass County)469
- Washington township (Chickasaw County)921
- Washington township (Clarke County)253
- Washington township (Clinton County)224
- Washington township (Crawford County)121
- Washington township (Dallas County)302
- Washington township (Des Moines County)138
- Washington township (Dubuque County)391
- Washington township (Fremont County)320
- Washington township (Greene County)472
- Washington township (Grundy County)272
- Washington township (Harrison County)430
- Washington township (Iowa County)1,047
- Washington township (Jackson County)409
- Washington township (Jasper County)2,675
- Washington township (Johnson County)1,005
- Washington township (Jones County)440
- Washington township (Keokuk County)892
- Washington township (Lee County)2,727
- Washington township (Linn County)3,382
- Washington township (Lucas County)720
- Washington township (Marion County)604
- Washington township (Marshall County)389
- Washington township (Montgomery County)195
- Washington township (Page County)174
- Washington township (Plymouth County)631
- Washington township (Polk County)297
- Washington township (Pottawattamie County)179
- Washington township (Poweshiek County)326
- Washington township (Ringgold County)485
- Washington township (Shelby County)574
- Washington township (Sioux County)184
- Washington township (Story County)46,860
- Washington township (Taylor County)223
- Washington township (Van Buren County)132
- Washington township (Wapello County)1,065
- Washington township (Washington County)7,864
- Washington township (Wayne County)82
- Washington township (Webster County)747
- Washington township (Winneshiek County)964
- Waterford township (Clay County)66
- Waterford township (Clinton County)711
- Waterloo township340
- Waterman township877
- Waubonsie township69
- Waveland township276
- Wayne township (Henry County)446
- Wayne township (Jones County)683
- Wayne township (Mitchell County)209
- Wayne township (Monroe County)73
- Weaver township452
- Webster township (Hamilton County)350
- Webster township (Madison County)214
- Webster township (Polk County)63,017
- Webster township (Webster County)253
- Welcome township2,429
- Wells township143
- Welton township468
- Wesley township451
- West Bend township1,000
- West Branch township7,272
- West Des Moines township249
- West Fork township (Franklin County)38
- West Fork township (Monona County)291
- West Fork township (Woodbury County)426
- West Grove township532
- West Holman township2,023
- West Lancaster township148
- West Lincoln township (Mitchell County)186
- West Lincoln township (Warren County)814
- West Lucas township10,251
- West Point township (Butler County)1,226
- West Point township (Lee County)1,584
- West Side township1,105
- West township98
- Westburg township726
- Westfield township (Fayette County)256
- Westfield township (Plymouth County)490
- Westphalia township587
- Westport township25
- Wheatland township686
- Wheeler township (Lyon County)1,056
- Wheeler township (Sac County)89
- White Breast township592
- White Cloud township140
- White Oak township (Mahaska County)449
- White Oak township (Warren County)1,007
- Whitebreast township605
- Whitewater township1,409
- Whittemore township816
- Williams township (Calhoun County)80
- Williams township (Hamilton County)405
- Willow township (Cherokee County)583
- Willow township (Crawford County)73
- Willow township (Greene County)102
- Willow township (Monona County)90
- Willow township (Woodbury County)510
- Wilson township208
- Wilton township3,222
- Windsor township699
- Winfield township2,096
- Wisner township114
- Wolf Creek township168
- Woodbury township6,439
- Woodland township71
- Woolstock township369
- Worth township903
- Wright township (Pottawattamie County)188
- Wright township (Wayne County)382
- Wyacondah township188
- Wyoming township883
- Yell township (Boone County)2,049
- Yell township (Webster County)42
- Yellow Springs township488
- York township (Iowa County)409
- York township (Pottawattamie County)182
- York township (Tama County)376
School districts
Each of the 325 with people in it, from ACS 2020–2024 5-year estimates.
- Adair-Casey Community School District2,074
- Adel-De Soto-Minburn Community School District11,020
- AGWSR Community School District4,351
- AHSTW Community School District5,373
- Akron-Westfield Community School District3,120
- Albert City-Truesdale Community School District1,508
- Albia Community School District6,777
- Alburnett Community School District3,478
- Alden Community School District1,490
- Algona Community School District11,526
- Allamakee Community School District8,229
- Alta-Aurelia Community School District4,724
- Ames Community School District63,271
- Anamosa Community School District9,451
- Andrew Community School District1,813
- Ankeny Community School District76,759
- Aplington-Parkersburg Community School District4,086
- Ar-We-Va Community School District2,360
- Atlantic Community School District8,567
- Audubon Community School District3,340
- Ballard Community School District8,516
- Baxter Community School District2,213
- BCLUW Community School District3,566
- Bedford Community School District2,919
- Belle Plaine Community School District3,225
- Bellevue Community School District4,717
- Belmond-Klemme Community School District4,860
- Bennett Community School District1,173
- Benton Community School District9,691
- Bettendorf Community School District23,193
- Bondurant-Farrar Community School District11,137
- Boone Community School District14,241
- Boyden-Hull Community School District3,953
- Boyer Valley Community School District2,509
- Brooklyn-Guernsey-Malcom Community School District3,318
- Burlington Community School District27,723
- Cal Community School District1,846
- Calamus-Wheatland Community School District2,663
- CAM Community School District2,610
- Camanche Community School District5,446
- Cardinal Community School District3,285
- Carlisle Community School District10,961
- Carroll Community School District14,035
- Cedar Falls Community School District42,790
- Cedar Rapids Community School District127,262
- Center Point-Urbana Community School District6,059
- Centerville Community School District8,306
- Central City Community School District2,694
- Central Community School District3,165
- Central Decatur Community School District3,788
- Central DeWitt Community School District8,372
- Central Lee Community School District4,496
- Central Lyon Community School District4,619
- Central Springs Community School District5,466
- Chariton Community School District8,276
- Charles City Community School District10,223
- Charter Oak-Ute Community School District1,864
- Cherokee Community School District6,344
- Clarinda Community School District6,845
- Clarion-Goldfield-Dows Community School District5,098
- Clarke Community School District8,437
- Clarksville Community School District1,987
- Clay Central-Everly Community School District2,237
- Clayton Ridge Community School District5,110
- Clear Creek-Amana Community School District18,491
- Clear Lake Community School District8,321
- Clinton Community School District23,695
- Colfax-Mingo Community School District4,155
- College Community School District28,424
- Collins-Maxwell Community School District3,287
- Colo-Nesco Community School District2,542
- Columbus Community School District4,513
- Coon Rapids-Bayard Community School District2,572
- Corning Community School District2,392
- Council Bluffs Community School District59,676
- Creston Community School District9,847
- Dallas Center-Grimes Community School District15,294
- Danville Community School District2,691
- Davenport Community School District107,285
- Davis County Community School District8,821
- Decorah Community School District12,621
- Delwood Community School District1,113
- Denison Community School District10,517
- Denver Community School District4,412
- Des Moines Independent Community School District209,522
- Diagonal Community School District821
- Dike-New Hartford Community School District4,270
- Dubuque Community School District79,101
- Dunkerton Community School District2,377
- Durant Community School District2,970
- Eagle Grove Community School District4,801
- Earlham Community School District3,315
- East Buchanan Community School District3,203
- East Marshall Community School District3,780
- East Mills Community School District3,113
- East Sac County Community School District5,602
- East Union Community School District3,176
- Eastern Allamakee Community School District2,517
- Easton Valley Community School District3,688
- Eddyville-Blakesburg-Fremont Community School District5,712
- Edgewood-Colesburg Community School District3,033
- Eldora-New Providence Community School District3,596
- Emmetsburg Community School District4,626
- English Valleys Community School District2,811
- Essex Community School District1,238
- Estherville Lincoln Central Community School District7,574
- Exira-Elk Horn-Kimballton Community School District3,107
- Fairfield Community School District14,124
- Forest City Community School District7,414
- Fort Dodge Community School District28,993
- Fort Madison Community School District16,561
- Fremont-Mills Community School District2,561
- Galva-Holstein Community School District2,635
- Garner-Hayfield-Ventura Community School District5,540
- George-Little Rock Community School District2,399
- Gilbert Community School District8,476
- Gilmore City-Bradgate Community School District1,158
- Gladbrook-Reinbeck Community School District4,316
- Glenwood Community School District10,712
- Glidden-Ralston Community School District1,689
- GMG Community School District2,060
- Graettinger-Terril Community School District2,559
- Greene County Community School District7,379
- Grinnell-Newburg Community School District12,729
- Griswold Community School District3,234
- Grundy Center Community School District3,908
- Guthrie Center Community School District2,788
- H-L-V Community School District2,259
- Hamburg Community School District1,324
- Hampton-Dumont Community School District6,562
- Harlan Community School District8,266
- Harris-Lake Park Community School District1,817
- Hartley-Melvin-Sanborn Community School District4,073
- Highland Community School District3,855
- Hinton Community School District2,924
- Howard-Winneshiek Community School District8,927
- Hubbard-Radcliffe Community School District2,546
- Hudson Community School District3,681
- Humboldt Community School District7,250
- IKM-Manning Community School District4,281
- Independence Community School District8,955
- Indianola Community School District20,583
- Interstate 35 Community School District4,365
- Iowa City Community School District123,585
- Iowa Falls Community School District6,247
- Iowa Valley Community School District3,628
- Janesville Consolidated School District2,650
- Jesup Community School District5,281
- Johnston Community School District41,124
- Keokuk Community School District11,632
- Keota Community School District1,980
- Kingsley-Pierson Community School District2,520
- Knoxville Community School District11,273
- Lake Mills Community School District3,998
- Lamoni Community School District3,086
- Laurens-Marathon Community School District2,062
- Lawton-Bronson Community School District3,183
- Le Mars Community School District13,986
- Lenox Community School District2,511
- Lewis Central Community School District15,709
- Linn-Mar Community School District43,218
- Lisbon Community School District2,541
- Logan-Magnolia Community School District3,154
- Lone Tree Community School District2,208
- Louisa-Muscatine Community School District4,270
- Lynnville-Sully Community School District2,975
- Madrid Community School District3,925
- Manson Northwest Webster Community School District4,007
- Maple Valley-Anthon Oto Community School District3,573
- Maquoketa Community School District8,519
- Maquoketa Valley Community School District4,608
- Marcus-Meriden-Cleghorn Community School District2,669
- Marion Independent School District12,101
- Marshalltown Community School District30,337
- Martensdale-St. Marys Community School District3,827
- Mason City Community School District28,006
- Mediapolis Community School District5,285
- Melcher-Dallas Community School District1,776
- MFL MarMac Community School District5,181
- Mid-Prairie Community School District9,768
- Midland Community School District3,631
- Missouri Valley Community School District5,241
- MOC-Floyd Valley Community School District11,239
- Montezuma Community School District3,136
- Monticello Community School District6,887
- Moravia Community School District2,484
- Mormon Trail Community School District1,613
- Morning Sun Community School District1,219
- Moulton-Udell Community School District1,244
- Mount Ayr Community School District3,781
- Mount Pleasant Community School District13,203
- Mount Vernon Community School District7,058
- Murray Community School District1,474
- Muscatine Community School District28,797
- Nashua-Plainfield Community School District3,914
- Nevada Community School District8,759
- New Hampton Community School District7,042
- New London Community School District3,360
- Newell-Fonda Community School District2,401
- Newton Community School District21,512
- Nodaway Valley Community School District4,038
- North Butler Community School District3,709
- North Cedar Community School District4,886
- North Fayette Valley Community School District8,485
- North Iowa Community School District2,845
- North Kossuth Community School District1,702
- North Linn Community School District2,944
- North Mahaska Community School District2,675
- North Polk Community School District9,460
- North Scott Community School District16,030
- North Tama County Community School District2,911
- North Union Community School District2,647
- Northeast Community School District3,577
- Northwood-Kensett Community School District3,221
- Norwalk Community School District17,034
- Odebolt Arthur Battle Creek Ida Grove Community School District5,359
- Oelwein Community School District8,015
- Ogden Community School District3,417
- Okoboji Community School District7,250
- Olin Consolidated School District1,646
- Orient-Macksburg Community School District1,160
- Osage Community School District6,008
- Oskaloosa Community School District15,820
- Ottumwa Community School District29,498
- Panorama Community School District4,821
- Paton-Churdan Community School District1,074
- PCM Community School District5,567
- Pekin Community School District3,530
- Pella Community School District15,694
- Perry Community School District9,852
- Pleasant Valley Community School District27,555
- Pleasantville Community School District3,740
- Pocahontas Area Community School District4,507
- Postville Community School District3,880
- Red Oak Community School District6,898
- Remsen-Union Community School District3,363
- Riceville Community School District2,526
- River Valley Community School District2,485
- Riverside Community School District3,461
- Rock Valley Community School District5,212
- Roland-Story Community School District5,706
- Rudd-Rockford-Marble Rock Community School District3,006
- Ruthven-Ayrshire Community School District1,389
- Saydel Community School District9,244
- Schaller-Crestland Community School District2,462
- Schleswig Community School District1,400
- Sergeant Bluff-Luton Community School District6,144
- Seymour Community School District2,907
- Sheldon Community School District7,946
- Shenandoah Community School District7,004
- Sibley-Ocheyedan Community School District4,578
- Sidney Community School District2,151
- Sigourney Community School District3,430
- Sioux Center Community School District10,725
- Sioux Central Community School District2,499
- Sioux City Community School District87,389
- Solon Community School District7,046
- South Central Calhoun Community School District6,497
- South Hamilton Community School District3,566
- South O'Brien Community School District4,136
- South Page Community School District1,484
- South Tama County Community School District8,233
- South Winneshiek Community School District4,683
- Southeast Polk Community School District43,814
- Southeast Valley Community School District6,974
- Southeast Warren Community School District3,266
- Spencer Community School District12,664
- Spirit Lake Community School District8,581
- Springville Community School District2,493
- St. Ansgar Community School District4,082
- Stanton Community School District1,068
- Starmont Community School District3,756
- Storm Lake Community School District12,969
- Stratford Community School District1,258
- Sumner-Fredericksburg Community School District4,609
- Tipton Community School District5,546
- Treynor Community School District3,164
- Tri-Center Community School District3,328
- Tri-County Community School District1,711
- Tripoli Community School District2,568
- Turkey Valley Community School District2,811
- Twin Cedars Community School District2,353
- Twin Rivers Community School District1,265
- Underwood Community School District3,815
- Union Community School District5,982
- United Community School District3,626
- Urbandale Community School District20,794
- Van Buren County Community School District7,375
- Van Meter Community School District3,641
- Villisca Community School District1,776
- Vinton-Shellsburg Community School District10,343
- Waco Community School District2,931
- Wapello Community School District3,111
- Wapsie Valley Community School District3,748
- Washington Community School District10,287
- Waterloo Community School District76,132
- Waukee Community School District73,679
- Waverly-Shell Rock Community School District14,332
- Wayne Community School District3,867
- Webster City Community School District10,835
- West Bend-Mallard Community School District1,770
- West Branch Community School District4,713
- West Burlington Independent School District2,796
- West Central Community School District1,719
- West Central Valley Community School District5,598
- West Delaware County Community School District9,613
- West Des Moines Community School District65,892
- West Fork Community School District4,400
- West Hancock Community School District3,560
- West Harrison Community School District2,464
- West Liberty Community School District6,249
- West Lyon Community School District5,160
- West Marshall Community School District4,357
- West Monona Community School District4,024
- West Sioux Community School District4,020
- Western Dubuque County Community School District22,697
- Westwood Community School District3,411
- Whiting Community School District1,105
- Williamsburg Community School District5,872
- Wilton Community School District4,590
- Winfield-Mount Union Community School District1,685
- Winterset Community School District10,491
- Woodbine Community School District2,470
- Woodbury Central Community School District3,082
- Woodward-Granger Community School District5,610
Congressional districts
As drawn for the 119th Congress (2025–2027).
- Congressional District 1800,735
- Congressional District 2795,370
- Congressional District 3816,359
- Congressional District 4798,043
State senate districts
The upper chamber’s districts, as drawn in 2024.
- State Senate District 164,766
- State Senate District 264,195
- State Senate District 363,683
- State Senate District 463,424
- State Senate District 563,469
- State Senate District 663,087
- State Senate District 763,066
- State Senate District 863,963
- State Senate District 962,966
- State Senate District 1063,247
- State Senate District 1165,297
- State Senate District 1264,323
- State Senate District 1363,545
- State Senate District 1471,384
- State Senate District 1563,061
- State Senate District 1665,114
- State Senate District 1761,916
- State Senate District 1863,721
- State Senate District 1963,944
- State Senate District 2067,817
- State Senate District 2169,170
- State Senate District 2264,383
- State Senate District 2366,747
- State Senate District 2464,358
- State Senate District 2564,590
- State Senate District 2665,010
- State Senate District 2763,016
- State Senate District 2863,397
- State Senate District 2963,566
- State Senate District 3063,598
- State Senate District 3164,291
- State Senate District 3263,721
- State Senate District 3364,725
- State Senate District 3463,699
- State Senate District 3562,909
- State Senate District 3663,351
- State Senate District 3763,657
- State Senate District 3862,953
- State Senate District 3963,862
- State Senate District 4063,697
- State Senate District 4163,288
- State Senate District 4263,608
- State Senate District 4365,067
- State Senate District 4463,386
- State Senate District 4565,727
- State Senate District 4664,913
- State Senate District 4764,584
- State Senate District 4862,345
- State Senate District 4963,877
- State Senate District 5063,024
State house districts
The lower chamber’s districts, as drawn in 2024.
- State House District 132,218
- State House District 232,548
- State House District 332,532
- State House District 431,663
- State House District 531,584
- State House District 632,099
- State House District 731,660
- State House District 831,764
- State House District 931,360
- State House District 1032,109
- State House District 1131,549
- State House District 1231,538
- State House District 1331,617
- State House District 1431,449
- State House District 1531,537
- State House District 1632,426
- State House District 1731,342
- State House District 1831,624
- State House District 1931,226
- State House District 2032,021
- State House District 2131,906
- State House District 2233,391
- State House District 2332,288
- State House District 2432,035
- State House District 2531,875
- State House District 2631,670
- State House District 2737,335
- State House District 2834,049
- State House District 2931,278
- State House District 3031,783
- State House District 3133,757
- State House District 3231,357
- State House District 3331,012
- State House District 3430,904
- State House District 3531,532
- State House District 3632,189
- State House District 3731,774
- State House District 3832,170
- State House District 3933,837
- State House District 4033,980
- State House District 4137,263
- State House District 4231,907
- State House District 4332,352
- State House District 4432,031
- State House District 4533,847
- State House District 4632,900
- State House District 4732,212
- State House District 4832,146
- State House District 4930,747
- State House District 5033,843
- State House District 5133,050
- State House District 5231,960
- State House District 5331,233
- State House District 5431,783
- State House District 5531,631
- State House District 5631,766
- State House District 5731,749
- State House District 5831,817
- State House District 5931,557
- State House District 6032,041
- State House District 6133,356
- State House District 6230,935
- State House District 6331,812
- State House District 6431,909
- State House District 6532,351
- State House District 6632,374
- State House District 6732,168
- State House District 6831,531
- State House District 6932,300
- State House District 7030,609
- State House District 7131,509
- State House District 7231,842
- State House District 7332,415
- State House District 7431,242
- State House District 7531,665
- State House District 7631,288
- State House District 7732,237
- State House District 7831,625
- State House District 7931,855
- State House District 8031,842
- State House District 8131,113
- State House District 8232,175
- State House District 8331,316
- State House District 8432,292
- State House District 8532,370
- State House District 8632,697
- State House District 8731,023
- State House District 8832,363
- State House District 8933,512
- State House District 9032,215
- State House District 9133,085
- State House District 9231,828
- State House District 9333,307
- State House District 9431,277
- State House District 9531,461
- State House District 9630,884
- State House District 9731,997
- State House District 9831,880
- State House District 9931,927
- State House District 10031,097
PUMAs
Public Use Microdata Areas: areas of 100,000 people or more that the state draws from census tracts, for the Census Bureau’s microdata.
- Black Hawk County–Waterloo & Cedar Falls Cities PUMA131,049
- Bremer, Winneshiek, Fayette, Clayton, Allamakee, Chickasaw & Howard Counties PUMA116,722
- Cedar Rapids City PUMA122,527
- Cerro Gordo, Floyd, Kossuth, Hancock, Winnebago, Mitchell & Worth Counties PUMA111,655
- Clinton, Muscatine, Jones & Cedar Counties PUMA128,072
- Dallas, Madison Counties PUMA124,894
- Des Moines City PUMA186,089
- Des Moines, Lee, Henry & Louisa Counties PUMA102,062
- Dubuque, Buchanan, Jackson & Delaware Counties–Dubuque City PUMA156,672
- Jasper, Marion, Warren Counties PUMA126,005
- Johnson County–Iowa City PUMA156,639
- Linn County outside Cedar Rapids City PUMA107,477
- Marshall, Benton, Poweshiek, Tama & Iowa Counties PUMA117,758
- Northwest Central Iowa–Storm Lake, Denison & Cherokee Region PUMA119,918
- Polk County (East)–Ankeny & Altoona Cities PUMA149,103
- Polk County (West) PUMA167,983
- Scott County–Davenport City PUMA174,608
- Sioux, Clay, Dickinson, O'Brien, Lyon, Emmet, Palo Alto & Osceola Counties PUMA121,176
- Southern Iowa PUMA110,353
- Southwest Iowa–Council Bluffs City PUMA171,245
- Story & Boone Counties PUMA127,134
- Wapello, Mahaska, Washington, Jefferson, Keokuk, Davis & Van Buren Counties PUMA121,971
- Webster, Hardin, Hamilton, Butler, Wright, Grundy, Franklin & Humboldt Counties PUMA127,401
- Woodbury & Plymouth Counties–Sioux City PUMA131,994
Urban areas
Each that reaches into Iowa, with its whole population. Urban areas are the densely settled land the Census Bureau draws after each census, whatever the city lines.
- Adel, IA5,609
- Algona, IA5,377
- Ames, IA67,283
- Anamosa, IA5,484
- Atlantic, IA6,608
- Boone, IA12,364
- Burlington, IA–IL27,995
- Carroll, IA10,088
- Cedar Rapids, IA193,597
- Centerville, IA5,371
- Charles City, IA7,340
- Cherokee, IA4,775
- Clarinda, IA5,186
- Clear Lake, IA8,293
- Clinton–Fulton, IA–IL30,944
- Creston, IA7,435
- Davenport, IA–IL283,341
- Decorah, IA7,732
- Denison, IA8,060
- Des Moines, IA555,031
- DeWitt, IA5,004
- Dubuque, IA–IL69,287
- Estherville, IA5,723
- Fairfield, IA9,276
- Fort Dodge, IA24,715
- Fort Madison, IA–IL9,696
- Glenwood, IA5,137
- Grinnell, IA9,439
- Harlan, IA4,683
- Humboldt, IA5,159
- Independence, IA6,167
- Indianola, IA15,361
- Iowa City, IA130,264
- Iowa Falls, IA5,020
- Keokuk, IA–IL12,176
- Knoxville, IA7,439
- Le Mars, IA10,320
- Manchester, IA5,112
- Maquoketa, IA6,056
- Marshalltown, IA27,665
- Mason City, IA25,628
- Mount Pleasant, IA8,669
- Mount Vernon, IA5,995
- Muscatine, IA24,504
- Nevada, IA6,987
- Newton, IA15,708
- Oelwein, IA6,728
- Omaha, NE–IA825,474
- Orange City, IA7,342
- Osceola, IA5,435
- Oskaloosa, IA12,475
- Ottumwa, IA24,956
- Pella, IA10,425
- Perry, IA7,598
- Polk City, IA5,202
- Prairie du Chien, WI–IA6,009
- Red Oak, IA5,410
- Sheldon, IA5,221
- Shenandoah, IA4,899
- Sioux Center, IA8,454
- Sioux City, IA–NE–SD113,986
- Spencer, IA10,956
- Spirit Lake, IA13,074
- Storm Lake, IA11,937
- Tama, IA4,864
- Vinton, IA4,744
- Washington, IA6,745
- Waterloo, IA114,370
- Waverly, IA8,621
- Webster City, IA7,442
- Winterset, IA4,970
Tribal areas
Each that reaches into Iowa, with its whole population.
Turn Iowa into your planning report.
Social Explorer Studio builds an editable profile of any place, with tables and charts beside the county and state, and exports to Word, PDF and Excel.
Questions about Iowa
What is the population of Iowa?
3,238,387 people, according to the ACS 2025 1-year estimates, which the Census Bureau adjusts to match its own population estimate. That’s the 31st largest of the 50 states and DC.
What is the FIPS code for Iowa?
19. Every county’s and place’s FIPS code in Iowa starts with it. The Census Bureau’s full geographic identifier (GEOID) is 0400000US19.
What is the largest city in Iowa?
Des Moines, with 212,205 people. Other large cities here include Cedar Rapids, Davenport and Sioux City.
What is the median household income in Iowa?
$76,483 (±$958), according to the ACS 2025 1-year estimates, lower than the US ($84,780).
What is the median age in Iowa?
39.4 years (±0.2), according to the ACS 2025 1-year estimates, about the same as the US (39.5).
How much does housing cost in Iowa?
Iowa’s median home value is $237,000 (±$2,264) and its median gross rent is $1,026 (±$18) a month, according to the ACS 2025 1-year estimates. 43.0% (±1.7%) of its renters pay 30% or more of their income on rent.
Is Iowa growing?
Iowa’s population grew 3.7%, from 3,123,899 in 2015 to 3,238,387 in 2025, according to the ACS 1-year estimates.
Where do people who work in Iowa live?
1,440,135 of its 1,546,079 jobs are held by people who live here. Of those who commute in, the most come from Illinois, Nebraska, Minnesota.
Where does this census data come from?
The U.S. Census Bureau’s American Community Survey, through Social Explorer’s tables: the latest 1-year estimates where they exist, for the most recent numbers, and 5-year estimates otherwise. Each table lists its code, so you can find it again.
Is this data free to use?
Yes. You can read it, cite it, download the CSV and embed the charts, with no account. To map other variables, compare your own areas or build a report, see Social Explorer’s plans in a live demo.
Sources and how to cite
American Community Survey 2025 1-year estimates, or 2020–2024 5-year estimates where noted, U.S. Census Bureau, from Social Explorer’s tables A00001, A00002, A01004, A04001, A06001, A08001, A09005, A10001, A10003, A10008, A10030, A10036, A10040, A10047, A10055, A10060, A12001, A13004, A14006, A14024, A14028, A16002, A17005, A18002, A18009, A20001, B02002, B09001, B13002, B18101, C16001. Maps by census tract use 2020–2024 5-year estimates, since the 1-year survey doesn’t cover tracts. Commuting: LEHD LODES 2023. These are estimates from a sample, each with its margin of error. Data retrieved November 14, 2026. How these profiles are made.
U.S. Census Bureau, American Community Survey 2025 1-year estimates, or 2020–2024 5-year estimates where noted, via Social Explorer. “Iowa.” https://www.socialexplorer.com/places/iowa. Accessed November 14, 2026.