

Nebraska: Population, demographics and census data
Home to 2,018,006 people, the 37th largest of the 50 states and DC, anchored by Omaha and Lincoln. It grew 6.4% between 2015 and 2025.
- Population
- 2.02M. Census Bureau estimate · Rank 37 of the 50 states and DC
- Median household income
- $81,614 ±$1,319. US $84,780
- Median age
- 37.9 ±0.3. US 39.5
ACS 2025 1-year estimates, U.S. Census Bureau
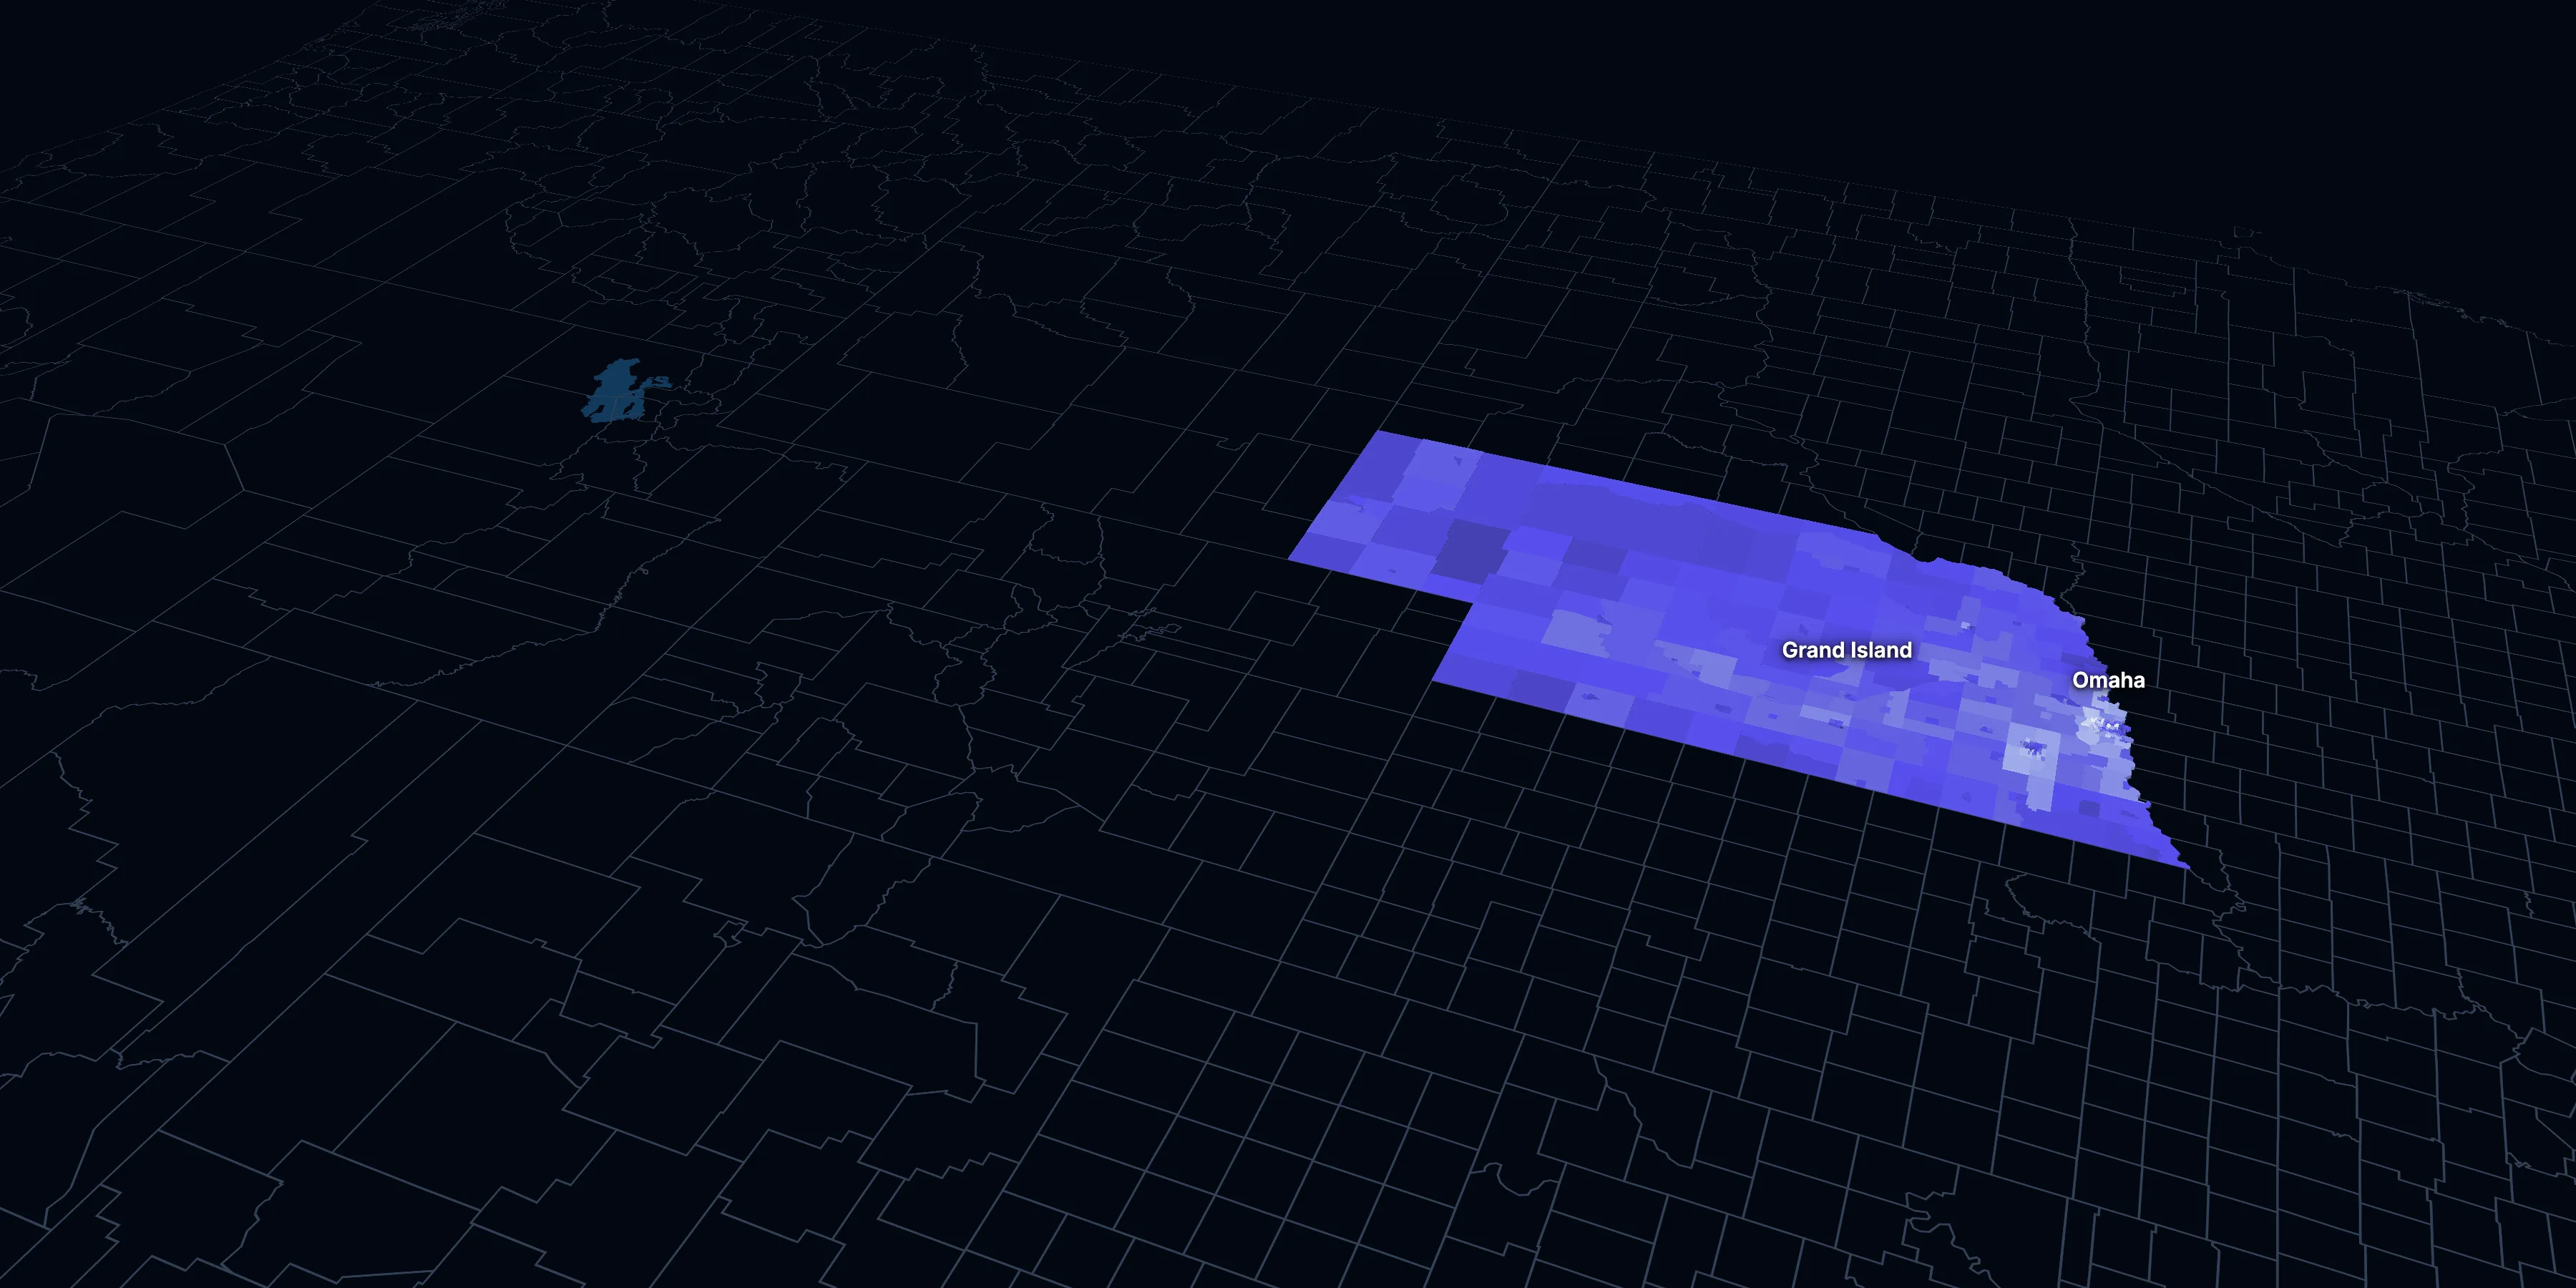
Taller, lighter tracts have higher household incomes
About Nebraska
Nebraska’s median household income is $81,614 (±$1,319), lower than the US ($84,780), and its median age is 37.9 (±0.3), according to the ACS 2025 1-year estimates. Its largest city is Omaha.
± is each figure’s margin of error, at 90% confidence, and † marks one too uncertain to lean on. Under each percentage in the tables is the number it counts. How the margins are worked out.
FIPS code 31
Highlights
What stands out in Nebraska
The numbers where Nebraska sits furthest from the nation, or past a recognized policy benchmark.
Past a policy benchmark
30.2%
HighHomes built before 1960
That’s higher than the US (24.0%). Older homes carry more lead-paint risk: the EPA found lead paint in 69% of homes built from 1940 to 1959.
+8 points
ElevatedRent growth ahead of income
After inflation, rent grew 16% from 2015 to 2025, and household income 8%. The dots show rent growth.
Furthest from the national picture
20.9%
Lower than the USCommute 30 minutes or more
That’s lower than the US (39.2%). It’s the 6th lowest of the 50 states and DC.
23.4%
3rd among statesUnder 18
That’s higher than the US (21.0%). It’s the 3rd highest of the 50 states and DC.
$1,194
Lower than the USMedian gross rent
That’s lower than the US ($1,557).
11.8%
Lower than the USLiving with a disability
That’s lower than the US (13.7%).
2015 to 2025
How Nebraska changed in ten years
The state added 121,816 people. It got older, more foreign-born and better educated, and poverty fell 2.4 points.
Population, change since 2015
+6.4% in the state and +6.3% in the US.
Source: ACS 1-year, 2015 to 2025, table A00001.
Show data
| Nebraska | United States | |
|---|---|---|
| 2015 | 0.0% | 0.0% |
| 2016 | +0.6% | +0.5% |
| 2017 | +1.3% | +1.3% |
| 2018 | +1.7% | +1.8% |
| 2019 | +2.0% | +2.1% |
| 2021 | +3.6% | +3.3% |
| 2022 | +3.8% | +3.7% |
| 2023 | +4.3% | +4.2% |
| 2024 | +5.8% | +5.8% |
| 2025 | +6.4% | +6.3% |
Embed
Median household income, in 2025 dollars
+8.3% in the state and +10.9% in the US.
Source: ACS 1-year, 2015 to 2025, table A14006.
Show data
| Nebraska | United States | |
|---|---|---|
| 2015 | $75,346 | $76,413 |
| 2016 | $76,998 | $77,931 |
| 2017 | $79,406 | $79,891 |
| 2018 | $76,994 | $80,059 |
| 2019 | $80,275 | $83,427 |
| 2021 | $80,046 | $83,521 |
| 2022 | $77,097 | $82,811 |
| 2023 | $79,355 | $82,683 |
| 2024 | $78,936 | $84,339 |
| 2025 | $81,614 | $84,780 |
Embed
Living in poverty
−2.4 points in the state and −3.0 points in the US.
Source: ACS 1-year, 2015 to 2025, table A13004.
Show data
| Nebraska | United States | |
|---|---|---|
| 2015 | 12.6% | 14.7% |
| 2016 | 11.4% | 14.0% |
| 2017 | 10.8% | 13.4% |
| 2018 | 11.0% | 13.1% |
| 2019 | 9.9% | 12.3% |
| 2021 | 10.8% | 12.8% |
| 2022 | 11.2% | 12.6% |
| 2023 | 10.5% | 12.5% |
| 2024 | 10.9% | 12.1% |
| 2025 | 10.2% | 11.8% |
Embed
Bachelor’s degree or more
+6.0 points in the state and +6.7 points in the US.
Source: ACS 1-year, 2015 to 2025, table A12001.
Show data
| Nebraska | United States | |
|---|---|---|
| 2015 | 30.2% | 30.6% |
| 2016 | 31.4% | 31.3% |
| 2017 | 31.7% | 32.0% |
| 2018 | 32.4% | 32.6% |
| 2019 | 33.2% | 33.1% |
| 2021 | 34.4% | 35.0% |
| 2022 | 34.7% | 35.7% |
| 2023 | 35.3% | 36.2% |
| 2024 | 35.4% | 36.8% |
| 2025 | 36.2% | 37.4% |
Embed
Median gross rent, in 2025 dollars
+16.1% in the state and +18.5% in the US.
Source: ACS 1-year, 2015 to 2025, table A18009.
Show data
| Nebraska | United States | |
|---|---|---|
| 2015 | $1,028 | $1,314 |
| 2016 | $1,040 | $1,327 |
| 2017 | $1,061 | $1,340 |
| 2018 | $1,073 | $1,368 |
| 2019 | $1,091 | $1,393 |
| 2021 | $1,093 | $1,427 |
| 2022 | $1,089 | $1,440 |
| 2023 | $1,109 | $1,496 |
| 2024 | $1,139 | $1,537 |
| 2025 | $1,194 | $1,557 |
Embed
Median home value, in 2025 dollars
+43.9% in the state and +39.3% in the US.
Source: ACS 1-year, 2015 to 2025, table A10036.
Show data
| Nebraska | United States | |
|---|---|---|
| 2015 | $193,995 | $266,469 |
| 2016 | $200,316 | $277,278 |
| 2017 | $206,295 | $288,124 |
| 2018 | $209,141 | $296,908 |
| 2019 | $219,258 | $305,336 |
| 2021 | $245,469 | $337,116 |
| 2022 | $257,444 | $355,481 |
| 2023 | $260,863 | $361,931 |
| 2024 | $271,917 | $372,685 |
| 2025 | $279,200 | $371,100 |
Embed
ACS 1-year estimates. The dotted stretch of each line spans 2020, when the Census Bureau released no standard 1-year estimates. Dollar values are in 2025 dollars.
| Indicator | 2015 | 2025 | Change |
|---|---|---|---|
| Population | 1,896,190 | 2,018,006 | +6.4% |
| Median age | 36.1 | 37.9 | +1.8 years |
| 65 and over | 14.7% | 18.4% | +3.7 points |
| Born outside the US | 6.8% | 8.8% | +2.0 points |
| Hispanic or Latino | 10.4% | 14.3% | +3.9 points |
| Median household income | $75,346 | $81,614 | +8.3% |
| Living in poverty | 12.6% | 10.2% | −2.4 points |
| Bachelor’s degree or more | 30.2% | 36.2% | +6.0 points |
| Households that rent | 34.1% | 34.1% | −0.0 points |
| Median gross rent | $1,028 | $1,194 | +16.1% |
| Median home value | $193,995 | $279,200 | +43.9% |
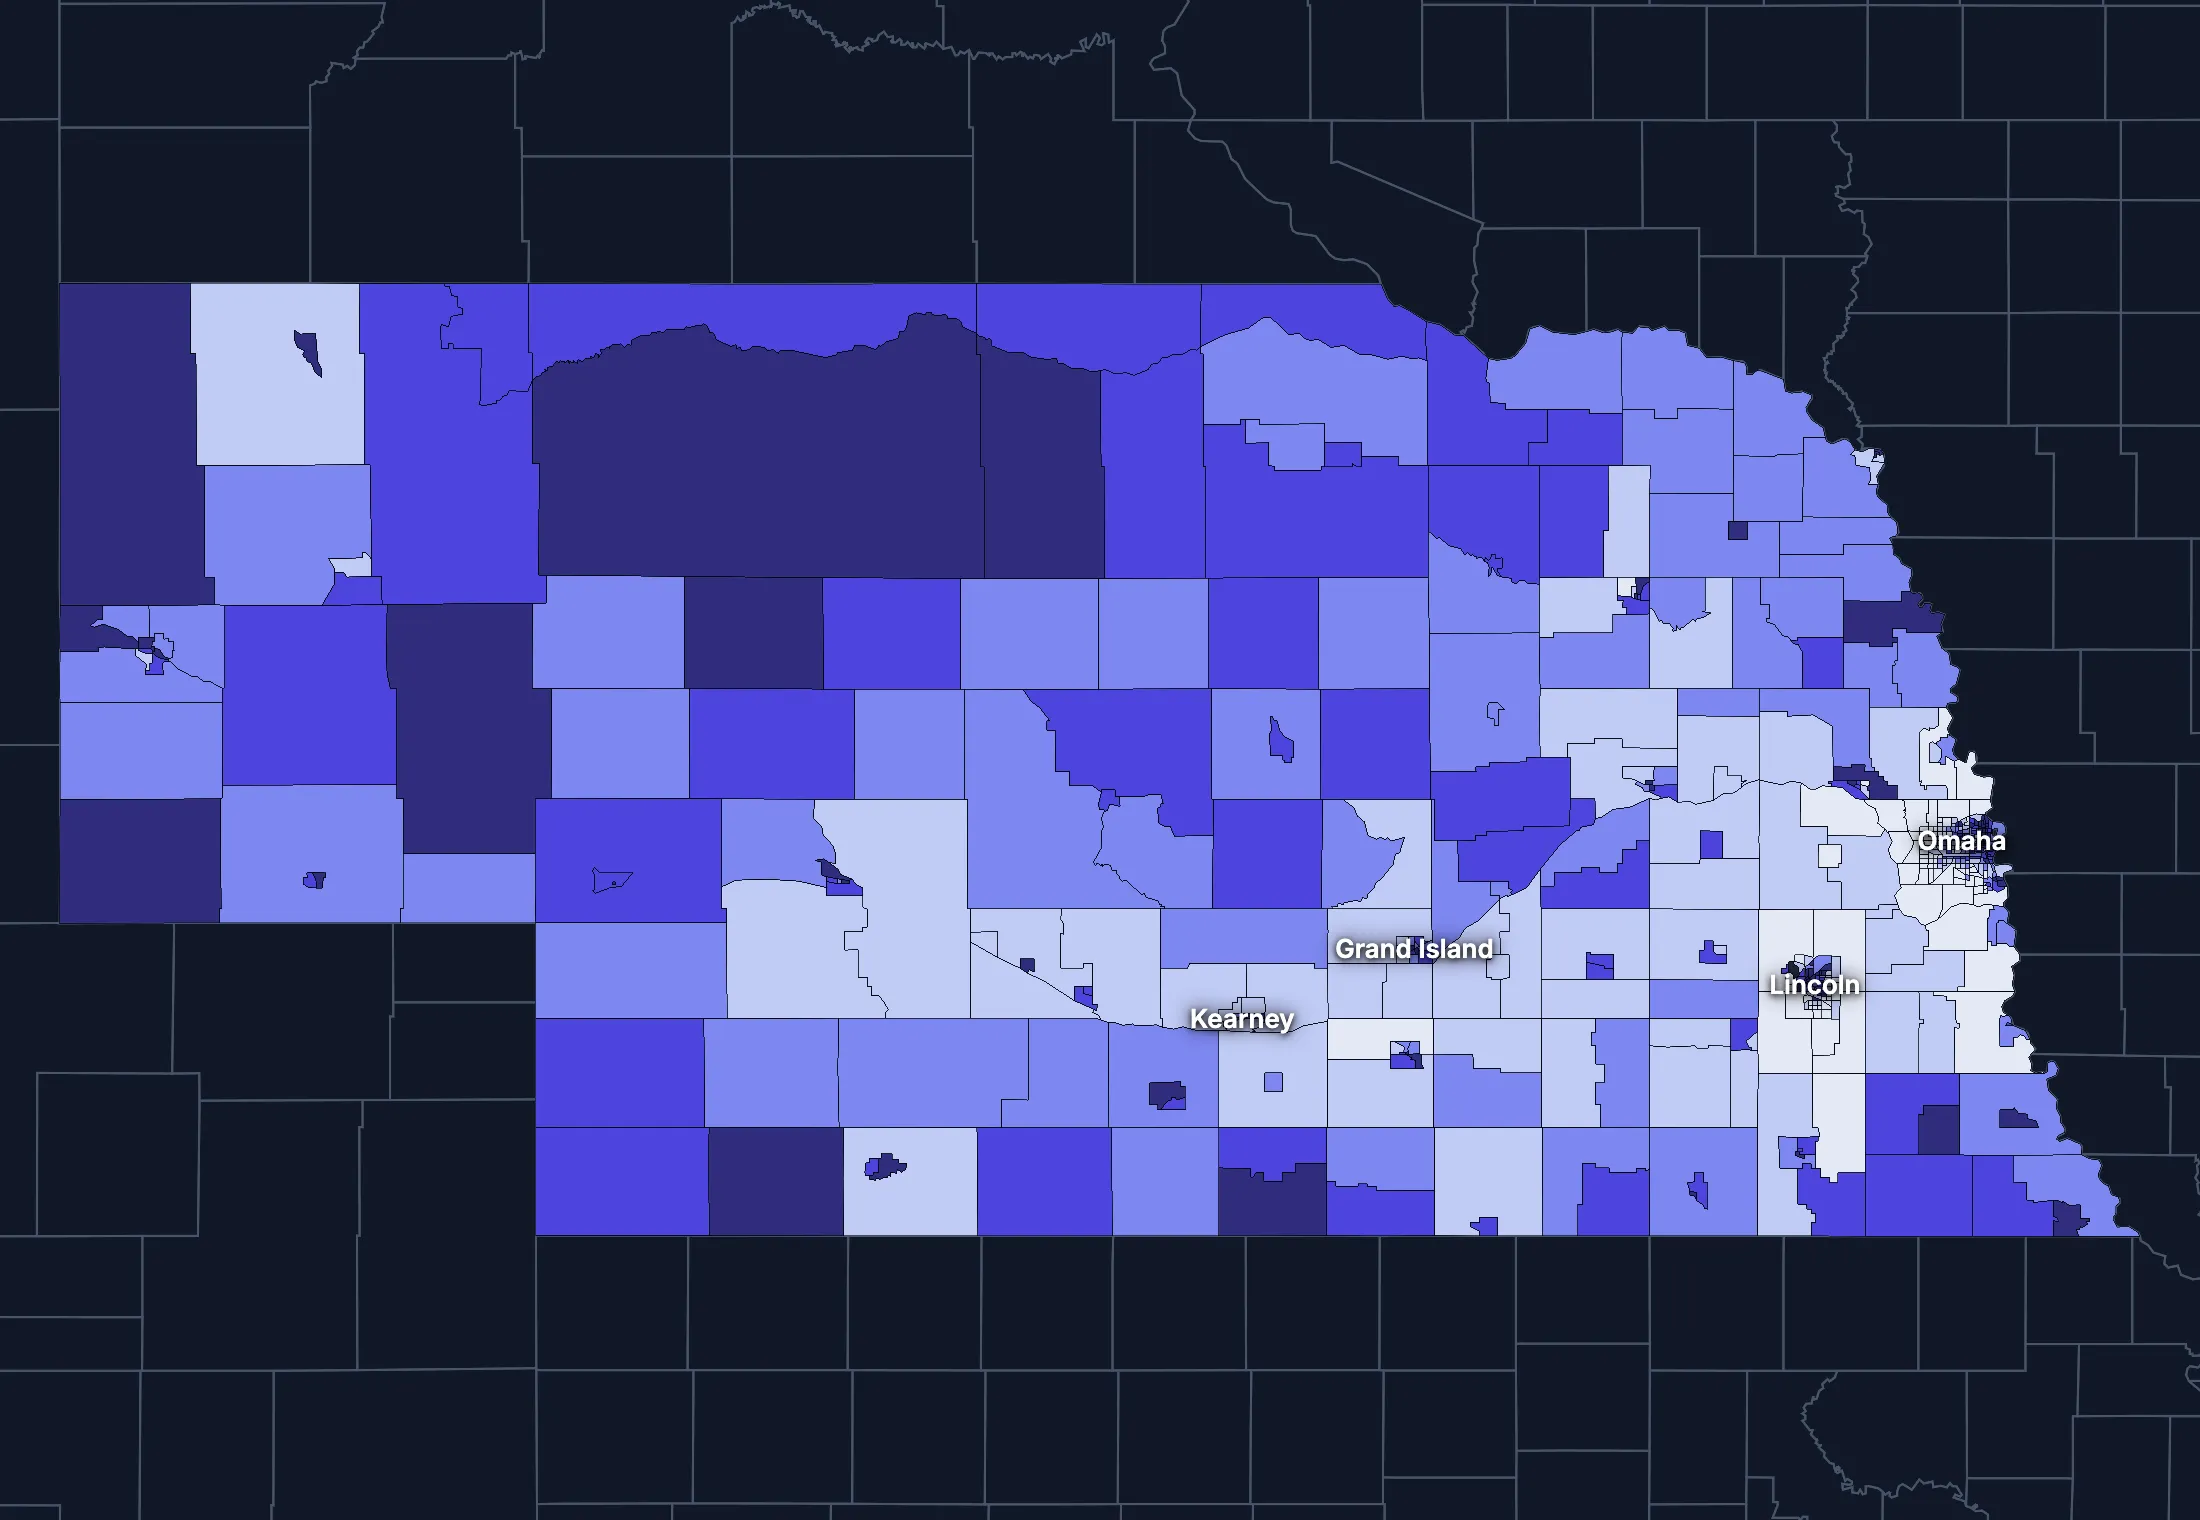
553 census tracts
Nebraska, tract by tract
State averages hide a lot. These census tracts are the closest the census comes to neighborhoods.
Where the state’s average misleads
Each tick is one census tract, and the dark line marks the state. Hover over a tick or tap it to see the tract.
Poverty
113 of 550 tracts are at least 1.5 times the state’s overall 10.6%, and 150 are at two-thirds of it or less.
Highest: Tract 74.73, 66.3%. Lowest: Tract 103.02, 0.0%.
Renters paying 30% or more of income
38 of 539 tracts are at least 1.5 times the state’s overall 41.9%, and 155 are at two-thirds of it or less.
Highest: Tract 73.20, 93.7%. Lowest: Tract 9681, 0.0%.
Adults with a bachelor’s degree
80 of 552 tracts are at least 1.5 times the state’s overall 34.6%, and 160 are at two-thirds of it or less.
Highest: Tract 47, 83.3%. Lowest: Tract 35, 2.0%.
Median household income
78 of 550 tracts are at least 1.5 times the typical tract’s $73,222, and 45 are at two-thirds of it or less.
Highest: Tract 75.14, $243,857. Lowest: Tract 9661, $24,565.
American Community Survey 2020–2024 5-year estimates, by census tract. Income is capped at $250,000+ by the Census Bureau.
People
Who lives in Nebraska
Its median age of 37.9 is lower than the US (39.5). 8.8% of residents were born outside the US, and 13.8% speak a language other than English at home.
Age
Source: ACS 2025 1-year, table A01001.
Show data
| Nebraska | United States | |
|---|---|---|
| Under 18 | 23.4% ±0.4% , number 471,592 ±8,528 | 21.0% ±<0.1% , number 71,689,151 ±111,800 |
| 18 to 24 | 10.0% ±0.4% , number 202,794 ±7,206 | 9.3% ±<0.1% , number 31,716,680 ±98,660 |
| 25 to 34 | 12.9% ±0.2% , number 260,534 ±4,753 | 13.6% ±<0.1% , number 46,357,354 ±55,690 |
| 35 to 44 | 13.4% ±0.4% , number 269,665 ±7,465 | 13.4% ±<0.1% , number 45,746,189 ±105,700 |
| 45 to 54 | 11.1% ±0.2% , number 223,747 ±4,010 | 11.8% ±<0.1% , number 40,257,563 ±53,540 |
| 55 to 64 | 10.8% ±0.3% , number 218,731 ±6,258 | 12.1% ±<0.1% , number 41,242,904 ±104,700 |
| 65 to 74 | 10.6% ±0.3% , number 214,261 ±5,839 | 10.8% ±<0.1% , number 36,895,650 ±91,520 |
| 75 and over | 7.8% ±0.2% , number 156,682 ±4,464 | 8.2% ±<0.1% , number 27,879,368 ±78,140 |
Embed
Race and ethnicity
Source: ACS 2025 1-year, table A04001.
Show data
| Nebraska | United States | |
|---|---|---|
| White, not Hispanic | 72.2% ±0.2% , number 1,456,568 ±4,025 | 55.0% ±<0.1% , number 187,959,031 ±58,340 |
| Hispanic or Latino | 14.3% ±<0.1% , number 288,240 ±941 | 20.5% ±<0.1% , number 69,975,516 ±13,270 |
| Black, not Hispanic | 4.6% ±0.3% , number 92,349 ±5,146 | 11.7% ±<0.1% , number 40,096,453 ±106,200 |
| Asian, not Hispanic | 2.9% ±0.1% , number 59,399 ±2,975 | 6.5% ±<0.1% , number 22,096,709 ±58,340 |
| Other or multiracial | 6.0% ±0.4% , number 121,450 ±7,455 | 6.3% ±<0.1% , number 21,657,150 ±150,100 |
Embed
Language spoken at home
Source: ACS 2025 1-year, table C16001.
Show data
| Nebraska | United States | |
|---|---|---|
| English only | 86.2% ±0.6% , number 1,635,584 ±11,350 | 77.1% ±0.1% , number 249,390,588 ±275,300 |
| Spanish | 9.4% ±0.4% , number 178,380 ±7,945 | 13.9% ±0.1% , number 44,921,985 ±177,800 |
| Other Indo-European | 1.7% ±0.3% , number 32,102 ±5,402 | 4.0% ±<0.1% , number 12,862,980 ±113,500 |
| Asian and Pacific Island | 1.8% ±0.2% , number 33,383 ±4,566 | 3.8% ±<0.1% , number 12,288,841 ±99,740 |
| Arabic and other | 0.9% ±0.2% , number 17,392 ±3,824 | 1.3% ±<0.1% , number 4,116,949 ±71,480 |
Embed
Marital status
Source: ACS 2025 1-year, table A11001.
Show data
| Nebraska | United States | |
|---|---|---|
| Now married | 52.2% ±0.7% , number 851,768 ±11,450 | 47.9% ±0.1% , number 135,567,564 ±223,300 |
| Never married | 32.1% ±0.6% , number 523,600 ±9,318 | 34.8% ±0.1% , number 98,647,238 ±152,600 |
| Divorced | 9.5% ±0.4% , number 155,136 ±6,801 | 10.2% ±<0.1% , number 28,879,967 ±112,900 |
| Widowed | 5.1% ±0.3% , number 82,912 ±4,108 | 5.5% ±<0.1% , number 15,599,094 ±69,430 |
| Separated | 1.1% ±0.2% , number 18,063 ±2,677 | 1.6% ±<0.1% , number 4,441,399 ±49,160 |
Embed
Where people lived a year ago
Source: ACS 2025 1-year, table A08001.
Show data
| Nebraska | United States | |
|---|---|---|
| Same home | 86.9% ±0.7% , number 1,733,709 ±14,990 | 88.4% ±0.1% , number 298,889,697 ±214,800 |
| Same county | 7.9% ±0.6% , number 157,775 ±11,250 | 6.0% ±<0.1% , number 20,202,671 ±166,300 |
| Another county in the state | 3.0% ±0.3% , number 59,361 ±6,000 | 3.0% ±<0.1% , number 10,168,097 ±89,190 |
| Another state | 1.9% ±0.3% , number 38,125 ±5,268 | 2.1% ±<0.1% , number 7,025,589 ±81,660 |
| Another country | 0.3% ±0.1% , number 6,149 ±1,918 | 0.6% ±<0.1% , number 1,984,943 ±47,210 |
Embed
Top countries of birth, among those born abroad
Source: ACS 2020–2024 5-year, table A07001.
Show data
| Nebraska | |
|---|---|
| Mexico | 30.4% , number 48,431 |
| Guatemala | 7.6% , number 12,108 |
| India | 4.4% , number 7,070 |
| Cuba | 4.2% , number 6,624 |
| Vietnam | 4.0% , number 6,335 |
| El Salvador | 4.0% , number 6,294 |
Embed
All the numbers
| Indicator | Nebraska | US | Rank among states* | Table |
|---|---|---|---|---|
| Population | 2,018,006 | 341,784,859 | 37th | A00001 |
| People per square mile | 26 | 97 | 44th | A00002 |
| Land area (square miles) | 76,815 | – | – | A00002 |
| Median age | 37.9 ±0.3 | 39.5 ±0.1 | 45th | A01004 |
| Under 18 | 23.4% ±0.4% , number 471,592 ±8,528 | 21.0% ±<0.1% , number 71,689,151 ±111,800 | 3rd | B02002 |
| 65 and over | 18.4% ±0.4% , number 370,943 ±7,350 | 19.0% ±<0.1% , number 64,775,018 ±120,300 | 39th | B02002 |
| Born outside the US | 8.8% ±0.5% , number 177,500 ±9,750 | 14.7% ±0.1% , number 50,409,320 ±204,800 | 25th | A06001 |
| Speak a language other than English at home | 13.8% ±0.6% , number 261,257 ±11,300 | 22.9% ±0.1% , number 74,190,755 ±244,000 | 25th | C16001 |
| Veterans (adults) | 6.3% ±0.3% , number 96,241 ±4,567 | 5.9% ±<0.1% , number 15,746,228 ±85,320 | 28th | A16002 |
| Living with a disability | 11.8% ±0.4% , number 234,585 ±7,965 | 13.7% ±<0.1% , number 46,271,455 ±126,000 | 39th | B18101 |
| Women 15–50 who had a baby in the past year | 6.2% ±0.7% , number 28,855 ±3,431 | 5.0% ±0.1% , number 4,016,759 ±44,040 | 6th | B13002 |
| Lived in the same home a year ago | 86.9% ±0.7% , number 1,733,709 ±14,990 | 88.4% ±0.1% , number 298,889,697 ±214,800 | 35th | A08001 |
| White, not Hispanic | 72.2% ±0.2% , number 1,456,568 ±4,025 | 55.0% ±<0.1% , number 187,959,031 ±58,340 | 17th | A04001 |
| Hispanic or Latino | 14.3% ±<0.1% , number 288,240 ±941 | 20.5% ±<0.1% , number 69,975,516 ±13,270 | 19th | A04001 |
| Black, not Hispanic | 4.6% ±0.3% , number 92,349 ±5,146 | 11.7% ±<0.1% , number 40,096,453 ±106,200 | 33rd | A04001 |
| Asian, not Hispanic | 2.9% ±0.1% , number 59,399 ±2,975 | 6.5% ±<0.1% , number 22,096,709 ±58,340 | 30th | A04001 |
*1 is the highest. Population is ranked among all states, and the rest among those of 1,000 people or more, whose figures can be ranked. Ranks use 5-year estimates, the only ones covering every state, so they can differ slightly from the figures here.
Income and work
Lower incomes than the US
The median household income is $81,614, lower than the US ($84,780). 10.2% of people live in poverty, and 7.5% have no health insurance, lower than the US (8.4%).
Household income
Source: ACS 2025 1-year, table A14001.
Show data
| Nebraska | United States | |
|---|---|---|
| Under $25,000 | 12.7% ±0.8% , number 105,239 ±6,236 | 14.0% ±0.1% , number 18,727,548 ±88,990 |
| $25,000 to $49,999 | 16.6% ±0.8% , number 137,332 ±6,837 | 15.4% ±0.1% , number 20,665,585 ±101,400 |
| $50,000 to $74,999 | 16.7% ±0.9% , number 138,439 ±7,412 | 15.3% ±0.1% , number 20,513,565 ±88,500 |
| $75,000 to $99,999 | 13.7% ±0.7% , number 113,691 ±5,718 | 12.5% ±0.1% , number 16,814,245 ±87,520 |
| $100,000 to $149,999 | 19.0% ±0.7% , number 156,819 ±6,245 | 17.9% ±0.1% , number 24,018,984 ±99,670 |
| $150,000 to $199,999 | 9.7% ±0.5% , number 80,438 ±4,568 | 10.1% ±0.1% , number 13,521,827 ±70,660 |
| $200,000 or more | 11.5% ±0.6% , number 95,291 ±5,215 | 14.8% ±0.1% , number 19,801,668 ±84,120 |
Embed
What residents do for work
Source: ACS 2025 1-year, table A17004.
Show data
| Nebraska | United States | |
|---|---|---|
| Education and health care | 25.5% ±0.6% , number 268,912 ±6,633 | 24.4% ±0.1% , number 40,862,193 ±140,800 |
| Manufacturing | 10.3% ±0.6% , number 108,853 ±6,465 | 9.6% ±0.1% , number 16,064,394 ±91,270 |
| Retail trade | 9.8% ±0.5% , number 103,370 ±4,994 | 10.6% ±0.1% , number 17,781,181 ±96,660 |
| Professional and business services | 9.2% ±0.5% , number 96,993 ±5,322 | 12.8% ±0.1% , number 21,375,231 ±87,110 |
| Arts, food and lodging | 7.9% ±0.6% , number 83,811 ±6,014 | 8.9% ±0.1% , number 14,811,502 ±87,840 |
| Construction | 7.6% ±0.5% , number 80,105 ±5,421 | 6.7% ±<0.1% , number 11,254,981 ±79,620 |
| Finance, insurance and real estate | 7.1% ±0.4% , number 75,120 ±4,695 | 6.6% ±<0.1% , number 11,025,569 ±68,570 |
| Transportation and warehousing | 5.9% ±0.5% , number 61,851 ±4,795 | 5.9% ±<0.1% , number 9,832,211 ±73,020 |
Embed
Where workers come from and go
Nebraska has 998,142 jobs and 972,691 employed residents. 68,925 people commute in to work and 43,474 commute out, while 929,217 both live and work here. The most commuters come from Iowa.
Most commuters come from
- Iowa: 39,624
- Kansas: 4,475
- South Dakota: 3,298
Most residents commute to
- Iowa: 23,287
- South Dakota: 5,252
- Kansas: 4,299
Show data
| Nebraska | |
|---|---|
| Live and work here | 929,217 |
| Work here, live elsewhere | 68,925 |
| Live here, work elsewhere | 43,474 |
Embed
All the numbers
| Indicator | Nebraska | US | Rank among states* | Table |
|---|---|---|---|---|
| Median household income | $81,614 ±$1,319 | $84,780 ±$215 | 29th | A14006 |
| Income per person | $44,794 ±$921 | $47,171 ±$115 | 27th | A14024 |
| Income inequality (Gini index) | 0.454 ±0.008 | 0.482 ±0.001 | 37th | A14028 |
| Living in poverty | 10.2% ±0.7% , number 200,232 ±13,520 | 11.8% ±0.1% , number 39,264,183 ±277,400 | 34th | A13004 |
| Unemployment rate | 3.2% ±0.4% , number 34,728 ±4,086 | 4.9% ±<0.1% , number 8,574,594 ±64,350 | 49th | A17005 |
| No health insurance | 7.5% ±0.4% , number 148,447 ±8,334 | 8.4% ±<0.1% , number 28,323,306 ±152,000 | 26th | A20001 |
*1 is the highest. Population is ranked among all states, and the rest among those of 1,000 people or more, whose figures can be ranked. Ranks use 5-year estimates, the only ones covering every state, so they can differ slightly from the figures here.
Education
College degrees close to the US
36.2% of adults 25 and over have a bachelor’s degree or more, lower than the US (37.4%).
Highest level of education
Source: ACS 2025 1-year, table A12001.
Show data
| Nebraska | United States | |
|---|---|---|
| Less than high school | 6.8% ±0.4% , number 90,880 ±5,977 | 9.4% ±0.1% , number 22,321,002 ±120,500 |
| High school only | 25.5% ±0.7% , number 342,226 ±10,030 | 25.6% ±0.1% , number 61,096,726 ±203,400 |
| Some college | 31.6% ±0.8% , number 423,924 ±10,740 | 27.7% ±0.1% , number 65,920,977 ±173,500 |
| Bachelor’s degree | 22.6% ±0.6% , number 303,930 ±8,432 | 22.3% ±0.1% , number 53,224,312 ±196,700 |
| Graduate degree | 13.6% ±0.6% , number 182,660 ±7,432 | 15.0% ±0.1% , number 35,816,011 ±159,400 |
Embed
All the numbers
| Indicator | Nebraska | US | Rank among states* | Table |
|---|---|---|---|---|
| Bachelor’s degree or more | 36.2% ±0.8% , number 486,590 ±11,240 | 37.4% ±0.1% , number 89,040,323 ±253,200 | 26th | A12001 |
| High school graduate or more | 93.2% ±1.3% , number 1,252,740 ±18,500 | 90.6% ±0.2% , number 216,058,026 ±368,200 | 17th | A12001 |
*1 is the highest. Population is ranked among all states, and the rest among those of 1,000 people or more, whose figures can be ranked. Ranks use 5-year estimates, the only ones covering every state, so they can differ slightly from the figures here.
Housing
Home values outran incomes
34.1% of households rent, about the same as the US (34.7%). The median home is worth $279,200 and the median rent is $1,194. After inflation, home values rose 44% from 2015 to 2025, while household income rose 8%.
Housing costs and income, 2015 to 2025, after inflation
Source: ACS 1-year, table A10036, A18009, A14006.
Show data
| Nebraska | United States | |
|---|---|---|
| Median home value | +43.9% | +39.3% |
| Median rent | +16.1% | +18.5% |
| Median household income | +8.3% | +10.9% |
Embed
Types of homes
Source: ACS 2025 1-year, table A10032.
Show data
| Nebraska | United States | |
|---|---|---|
| Single-family, detached | 71.0% ±0.9% , number 632,472 ±7,910 | 60.9% ±0.1% , number 90,335,844 ±173,300 |
| Single-family, attached | 4.2% ±0.4% , number 37,808 ±3,471 | 6.4% ±<0.1% , number 9,527,703 ±51,230 |
| 2 to 4 units | 4.0% ±0.4% , number 35,626 ±3,434 | 7.5% ±0.1% , number 11,109,005 ±75,790 |
| 5 to 19 units | 8.9% ±0.6% , number 79,586 ±5,618 | 8.7% ±0.1% , number 12,829,882 ±97,590 |
| 20 or more units | 9.3% ±0.6% , number 82,846 ±5,541 | 11.1% ±0.1% , number 16,381,450 ±92,310 |
| Mobile homes and other | 2.5% ±0.4% , number 22,456 ±3,202 | 5.4% ±<0.1% , number 8,045,083 ±53,680 |
Embed
When homes were built
Source: ACS 2025 1-year, table A10055.
Show data
| Nebraska | United States | |
|---|---|---|
| 2010 or later | 14.9% ±0.7% , number 123,100 ±6,128 | 15.1% ±0.1% , number 20,257,912 ±101,300 |
| 2000 to 2009 | 11.8% ±0.6% , number 97,780 ±5,294 | 13.8% ±0.1% , number 18,535,840 ±92,260 |
| 1980 to 1999 | 19.4% ±0.8% , number 160,123 ±6,404 | 24.1% ±0.1% , number 32,332,570 ±118,900 |
| 1960 to 1979 | 23.7% ±0.9% , number 196,367 ±7,196 | 22.9% ±0.1% , number 30,726,302 ±110,000 |
| Before 1960 | 30.2% ±1.0% , number 249,879 ±8,479 | 24.0% ±0.1% , number 32,210,798 ±121,500 |
Embed
All the numbers
| Indicator | Nebraska | US | Rank among states* | Table |
|---|---|---|---|---|
| Housing units | 890,794 | – | – | A10001 |
| Households | 827,249 ±4,929 | – | – | A10008 |
| People per household | 2.38 ±0.01 | 2.49 ±0.01 | 34th | A10003 |
| Households that rent | 34.1% ±1.0% , number 282,038 ±8,055 | 34.7% ±0.1% , number 46,551,688 ±193,200 | 18th | A10060 |
| Vacant homes | 7.1% ±0.6% , number 63,545 ±4,998 | 9.6% ±0.1% , number 14,165,545 ±137,100 | 46th | A10047, A10060 |
| Median gross rent | $1,194 ±$20 | $1,557 ±$4 | 35th | A18009 |
| Median home value | $279,200 ±$3,160 | $371,100 ±$646 | 38th | A10036 |
| Renters paying 30% or more of income | 41.7% ±2.3% , number 117,523 ±7,394 | 48.3% ±0.2% , number 22,486,693 ±122,100 | 39th | A18002 |
| Owners paying 30% or more of income | 19.1% ±0.9% , number 103,873 ±5,347 | 24.2% ±0.1% , number 21,201,943 ±93,050 | 39th | A10040 |
| Homes built before 1960 | 30.2% ±1.0% , number 249,879 ±8,479 | 24.0% ±0.1% , number 32,210,798 ±121,500 | 15th | A10055 |
*1 is the highest. Population is ranked among all states, and the rest among those of 1,000 people or more, whose figures can be ranked. Ranks use 5-year estimates, the only ones covering every state, so they can differ slightly from the figures here.
Getting around
A driving state with short commutes
77.0% of workers drive alone and 8.9% work from home. 20.9% of those who travel to work spend 30 minutes or more getting there, and 5.4% of households have no vehicle.
How people get to work
Source: ACS 2025 1-year, table A09005.
Show data
| Nebraska | United States | |
|---|---|---|
| Drive alone | 77.0% ±0.7% , number 804,366 ±9,952 | 69.8% ±0.1% , number 115,297,377 ±192,900 |
| Carpool | 9.4% ±0.7% , number 98,442 ±7,093 | 8.9% ±0.1% , number 14,712,170 ±97,240 |
| Public transit | 0.7% ±0.2% , number 7,663 ±2,144 | 4.3% ±<0.1% , number 7,100,386 ±63,330 |
| Walk | 2.9% ±0.3% , number 29,914 ±3,287 | 2.4% ±<0.1% , number 4,016,469 ±41,070 |
| Work from home | 8.9% ±0.5% , number 93,264 ±5,407 | 12.9% ±0.1% , number 21,288,393 ±105,700 |
| Other | 1.1% ±0.2% , number 11,327 ±1,869 | 1.7% ±<0.1% , number 2,799,658 ±41,510 |
Embed
Time spent getting to work
Source: ACS 2025 1-year, table B09001.
Show data
| Nebraska | United States | |
|---|---|---|
| Under 10 minutes | 21.5% ±0.8% , number 204,247 ±7,536 | 12.0% ±0.1% , number 17,199,225 ±93,440 |
| 10 to 19 minutes | 36.0% ±1.1% , number 342,522 ±10,800 | 27.8% ±0.1% , number 40,059,540 ±137,700 |
| 20 to 29 minutes | 21.7% ±0.9% , number 206,055 ±9,182 | 21.0% ±0.1% , number 30,221,743 ±111,100 |
| 30 to 39 minutes | 11.5% ±0.6% , number 109,161 ±5,961 | 17.1% ±0.1% , number 24,659,138 ±103,800 |
| 40 to 59 minutes | 5.8% ±0.5% , number 55,330 ±4,757 | 12.6% ±0.1% , number 18,104,709 ±97,070 |
| 60 minutes or more | 3.6% ±0.4% , number 34,397 ±3,847 | 9.5% ±0.1% , number 13,681,705 ±84,440 |
Embed
Vehicles per household
Source: ACS 2025 1-year, table A10030.
Show data
| Nebraska | United States | |
|---|---|---|
| None | 5.4% ±0.5% , number 44,588 ±3,973 | 8.8% ±0.1% , number 11,781,997 ±77,240 |
| One | 29.9% ±1.0% , number 247,292 ±8,555 | 33.1% ±0.1% , number 44,424,682 ±160,700 |
| Two | 37.5% ±1.0% , number 310,579 ±8,538 | 36.0% ±0.1% , number 48,200,889 ±176,800 |
| Three or more | 27.2% ±0.9% , number 224,790 ±7,521 | 22.1% ±0.1% , number 29,655,854 ±113,300 |
Embed
All the numbers
| Indicator | Nebraska | US | Rank among states* | Table |
|---|---|---|---|---|
| Drive to work alone | 77.0% ±0.7% , number 804,366 ±9,952 | 69.8% ±0.1% , number 115,297,377 ±192,900 | 12th | A09005 |
| Take public transit | 0.7% ±0.2% , number 7,663 ±2,144 | 4.3% ±<0.1% , number 7,100,386 ±63,330 | 43rd | A09005 |
| Work from home | 8.9% ±0.5% , number 93,264 ±5,407 | 12.9% ±0.1% , number 21,288,393 ±105,700 | 38th | A09005 |
| Commute 30 minutes or more | 20.9% ±0.9% , number 198,888 ±8,542 | 39.2% ±0.1% , number 56,445,552 ±165,300 | 46th | B09001 |
| Households with no vehicle | 5.4% ±0.5% , number 44,588 ±3,835 | 8.8% ±<0.1% , number 11,781,997 ±64,240 | 39th | A10030 |
*1 is the highest. Population is ranked among all states, and the rest among those of 1,000 people or more, whose figures can be ranked. Ranks use 5-year estimates, the only ones covering every state, so they can differ slightly from the figures here.
Places
The largest cities in Nebraska
Population, from the latest estimates available. Figures cover the whole of each place.
Largest cities
States like this one
- Georgia: 10,940,407
- North Carolina: 10,730,404
- Kansas: 2,947,197
- Idaho: 1,934,262
States at least a third this size, with the closest income, education, age, housing and origins.
Every county and place in Nebraska
Find any county, city, town, metro area, ZIP code, school district or district in Nebraska.
Counties
Each of the 93 counties with its population, from ACS 2020–2024 5-year estimates.
- Adams County31,052
- Antelope County6,305
- Arthur County484
- Banner County742
- Blaine County422
- Boone County5,356
- Box Butte County10,714
- Boyd County1,688
- Brown County2,869
- Buffalo County50,579
- Burt County6,740
- Butler County8,424
- Cass County27,161
- Cedar County8,315
- Chase County3,671
- Cherry County5,498
- Cheyenne County9,533
- Clay County6,095
- Colfax County10,641
- Cuming County8,975
- Custer County10,518
- Dakota County21,354
- Dawes County8,140
- Dawson County24,202
- Deuel County1,847
- Dixon County5,545
- Dodge County37,351
- Douglas County590,736
- Dundy County1,736
- Fillmore County5,541
- Franklin County2,846
- Frontier County2,569
- Furnas County4,568
- Gage County21,629
- Garden County1,761
- Garfield County1,718
- Gosper County2,040
- Grant County626
- Greeley County2,202
- Hall County62,536
- Hamilton County9,464
- Harlan County2,847
- Hayes County843
- Hitchcock County2,569
- Holt County10,102
- Hooker County647
- Howard County6,534
- Jefferson County7,161
- Johnson County5,261
- Kearney County6,713
- Keith County8,219
- Keya Paha County822
- Kimball County3,248
- Knox County8,363
- Lancaster County326,696
- Lincoln County33,802
- Logan County773
- Loup County578
- Madison County35,532
- McPherson County475
- Merrick County7,724
- Morrill County4,534
- Nance County3,324
- Nemaha County7,046
- Nuckolls County4,087
- Otoe County16,241
- Pawnee County2,530
- Perkins County2,821
- Phelps County9,009
- Pierce County7,325
- Platte County34,716
- Polk County5,225
- Red Willow County10,557
- Richardson County7,751
- Rock County1,319
- Saline County14,650
- Sarpy County197,389
- Saunders County23,048
- Scotts Bluff County35,843
- Seward County17,641
- Sheridan County5,014
- Sherman County2,967
- Sioux County1,171
- Stanton County5,796
- Thayer County4,901
- Thomas County564
- Thurston County6,627
- Valley County4,066
- Washington County21,106
- Wayne County9,844
- Webster County3,360
- Wheeler County847
- York County14,286
Cities, towns and other places
Each of the 583 with its population, from ACS 2020–2024 5-year estimates. Census-designated places are communities without a local government of their own, drawn by the Census Bureau so they can be counted.
- Abie59
- Adams580
- Ainsworth1,697
- Albion1,822
- Alda651
- Alexandria101
- Allen468
- Alliance8,075
- Alma1,154
- Alvo123
- Ames9
- Amherst272
- Anoka11
- Anselmo93
- Ansley563
- Arapahoe993
- Arcadia308
- Archer53
- Arlington1,467
- Arnold945
- Arthur66
- Ashland3,071
- Ashton232
- Aten136
- Atkinson1,377
- Atlanta133
- Auburn3,470
- Aurora4,664
- Avoca190
- Axtell818
- Ayr126
- Bancroft593
- Barada35
- Barneston117
- Bartlett189
- Bartley352
- Bassett580
- Battle Creek1,456
- Bayard1,531
- Bazile Mills11
- Beacon View36
- Beatrice12,225
- Beaver City547
- Beaver Crossing357
- Beaver Lake2,114
- Bee281
- Beemer775
- Belden101
- Belgrade224
- Bellevue64,510
- Bellwood492
- Belmar143
- Belvidere35
- Benedict280
- Benkelman905
- Bennet1,218
- Bennington2,366
- Berea9
- Bertrand718
- Berwyn51
- Big Springs496
- Bladen166
- Blair7,914
- Bloomfield959
- Bloomington112
- Blue Hill782
- Blue Springs328
- Bow Valley106
- Boys Town809
- Bradshaw346
- Brady470
- Brainard303
- Brewster33
- Bridgeport1,342
- Bristow55
- Broadwater106
- Brock120
- Broken Bow3,502
- Brownlee2
- Brownville102
- Brule346
- Bruning259
- Bruno104
- Brunswick196
- Buccaneer Bay1,418
- Burchard119
- Burr41
- Burwell848
- Bushnell160
- Butte273
- Byron92
- Cairo1,035
- Callaway562
- Cambridge1,082
- Campbell268
- Carleton189
- Carroll286
- Cedar Bluffs782
- Cedar Creek427
- Cedar Rapids493
- Center191
- Central City3,061
- Ceresco1,225
- Chadron5,160
- Chalco10,595
- Chambers424
- Chapman290
- Chappell915
- Cheney144
- Chester240
- Clarks330
- Clarkson600
- Clatonia326
- Clay Center802
- Clearwater312
- Clinton66
- Cody125
- Coleridge553
- Colon102
- Columbus24,488
- Comstock80
- Concord143
- Cook328
- Cordova131
- Cornlea42
- Cortland547
- Cotesfield27
- Cowles8
- Cozad3,937
- Crab Orchard20
- Craig113
- Crawford878
- Creighton1,222
- Creston170
- Crete7,527
- Crofton902
- Crookston45
- Culbertson634
- Curtis769
- Cushing112
- Dakota City2,675
- Dalton435
- Danbury70
- Dannebrog235
- Davenport257
- Davey117
- David City3,017
- Dawson166
- Daykin195
- De Witt437
- Decatur482
- Denton145
- Deshler729
- Deweese56
- Diller179
- Dix224
- Dixon78
- Dodge446
- Doniphan983
- Dorchester550
- Douglas269
- Du Bois145
- Dunbar266
- Duncan612
- Dunning78
- Dwight230
- Eagle1,259
- Eddyville125
- Edgar501
- Edison147
- Elba171
- Elgin642
- Elk Creek122
- Elm Creek1,107
- Elmwood774
- Elsie139
- Elwood534
- Elyria43
- Emerald6
- Emerson885
- Emmet20
- Enders46
- Endicott151
- Ericson157
- Eustis431
- Ewing372
- Exeter562
- Fairbury3,888
- Fairfield327
- Fairmont635
- Falls City4,077
- Farnam257
- Farwell78
- Filley110
- Firth604
- Fontanelle60
- Fordyce195
- Fort Calhoun1,173
- Foster50
- Franklin946
- Fremont27,567
- Friend1,155
- Fullerton1,346
- Funk244
- Gandy42
- Garland180
- Garrison61
- Geneva2,193
- Genoa860
- Gering8,550
- Gibbon1,763
- Gilead30
- Giltner457
- Glenvil285
- Glenwood653
- Goehner309
- Gordon1,721
- Gothenburg3,452
- Grafton160
- Grand Island52,884
- Grant1,413
- Greeley Center417
- Greenwood601
- Gresham249
- Gretna9,193
- Gross10
- Guide Rock286
- Gurley207
- Hadar264
- Haigler195
- Hallam346
- Halsey13
- Hamlet16
- Hampton653
- Harbine65
- Hardy113
- Harrisburg103
- Harrison218
- Hartington1,621
- Harvard1,008
- Hastings25,008
- Hay Springs649
- Hayes Center297
- Hazard150
- Heartwell97
- Hebron1,577
- Hemingford714
- Henderson1,049
- Hendley21
- Henry94
- Herman360
- Hershey724
- Hickman3,004
- Hildreth480
- Holbrook273
- Holdrege5,546
- Holmesville61
- Holstein185
- Homer446
- Hooper989
- Hordville221
- Hoskins250
- Howard City (Boelus)186
- Howells517
- Hubbard190
- Hubbell61
- Humboldt775
- Humphrey713
- Huntley24
- Hyannis145
- Imperial2,210
- Inavale41
- Indianola512
- Inglewood511
- Inland31
- Inman153
- Ithaca183
- Jackson273
- Jansen123
- Johnson339
- Johnstown12
- Julian42
- Juniata750
- Kearney34,246
- Kenesaw902
- Kennard425
- Kilgore135
- Kimball2,225
- King Lake101
- Kramer7
- La Vista16,563
- Lake Waconda127
- Lakeview447
- Lamar20
- Laurel1,018
- Lawrence223
- Lebanon33
- Leigh443
- Lemoyne51
- Leshara177
- Lewellen207
- Lewiston42
- Lexington10,862
- Liberty51
- Lincoln294,856
- Lindsay313
- Lindy9
- Linoma Beach99
- Linwood80
- Lisco18
- Litchfield233
- Lodgepole223
- Long Pine363
- Loomis375
- Lorenzo12
- Loretto99
- Lorton72
- Louisville1,449
- Loup City973
- Lushton28
- Lyman291
- Lynch137
- Lyons900
- Macy637
- Madison2,079
- Madrid226
- Magnet61
- Malcolm480
- Malmo95
- Manley204
- Marquette265
- Martell133
- Martin35
- Martinsburg71
- Maskell76
- Mason City189
- Max27
- Maxwell174
- Maywood266
- McCook7,314
- McCool Junction718
- McGrew67
- McLean86
- Mead607
- Meadow Grove174
- Melbeta146
- Melia22
- Memphis130
- Merna383
- Merriman117
- Milford2,565
- Miller128
- Milligan296
- Minatare712
- Minden3,108
- Mitchell1,962
- Monowi2
- Monroe252
- Moorefield40
- Morrill880
- Morse Bluff70
- Mullen478
- Murdock228
- Murray431
- Naper117
- Naponee88
- Nebraska City7,369
- Nehawka109
- Neligh1,515
- Nelson487
- Nemaha64
- Nenzel14
- Newcastle376
- Newman Grove885
- Newport46
- Nickerson552
- Niobrara353
- Nora28
- Norfolk26,054
- Norman36
- North Bend1,152
- North Loup238
- North Platte22,831
- O'Neill3,570
- Oak88
- Oakdale355
- Oakland1,552
- Obert16
- Oconto167
- Octavia153
- Odell211
- Odessa138
- Offutt AFB6,074
- Ogallala4,777
- Ohiowa105
- Omaha488,837
- Ong50
- Orchard410
- Ord2,100
- Orleans337
- Osceola896
- Oshkosh807
- Osmond647
- Otoe160
- Overland182
- Overton689
- Oxford652
- Page120
- Palisade321
- Palmer403
- Palmyra589
- Panama232
- Papillion25,244
- Parks10
- Pawnee City801
- Paxton622
- Pender1,379
- Peru653
- Petersburg397
- Phillips382
- Pickrell180
- Pierce1,956
- Pilger382
- Plainview1,281
- Platte Center318
- Plattsmouth6,731
- Pleasant Dale244
- Pleasanton556
- Plymouth397
- Polk351
- Ponca727
- Potter283
- Prague310
- Preston16
- Primrose60
- Princeton99
- Prosser76
- Ragan12
- Ralston6,472
- Randolph877
- Ravenna1,382
- Raymond187
- Red Cloud934
- Republican City92
- Reynolds41
- Richfield47
- Richland55
- Rising City256
- Riverdale307
- Riverton106
- Roca242
- Rockville169
- Rogers99
- Rosalie247
- Roscoe97
- Roseland306
- Royal35
- Rulo164
- Rushville877
- Ruskin149
- Salem102
- Santee235
- Sarben21
- Sargent534
- Saronville69
- Schuyler6,578
- Scotia428
- Scottsbluff14,376
- Scribner725
- Seneca45
- Seward7,678
- Shelby684
- Shelton1,389
- Shickley387
- Sholes14
- Shubert214
- Sidney6,419
- Silver Creek341
- Smithfield108
- Snyder293
- South Bend100
- South Sioux City13,907
- Spalding353
- Spencer312
- Sprague176
- Springfield1,595
- Springview217
- St. Edward588
- St. Helena97
- St. Libory307
- St. Paul2,758
- Stamford178
- Stanton1,702
- Staplehurst322
- Stapleton343
- Steele City62
- Steinauer73
- Stella126
- Sterling717
- Stockham19
- Stockville39
- Strang23
- Stratton342
- Stromsburg1,074
- Stuart628
- Sumner353
- Sunol123
- Superior1,879
- Surprise35
- Sutherland1,209
- Sutton1,323
- Swanton93
- Syracuse1,990
- Table Rock255
- Talmage155
- Tamora12
- Tarnov27
- Taylor142
- Tecumseh1,882
- Tekamah1,690
- Terrytown793
- Thayer32
- Thedford225
- Thurston100
- Tilden936
- Tobias61
- Trenton487
- Trumbull298
- Tryon142
- Uehling244
- Ulysses190
- Unadilla329
- Union215
- Upland118
- Utica1,015
- Valentine2,633
- Valley3,174
- Valparaiso524
- Venango182
- Venice73
- Verdel33
- Verdigre613
- Verdon185
- Virginia76
- Waco178
- Wahoo4,929
- Wakefield1,305
- Wallace266
- Walthill812
- Walton579
- Wann18
- Washington198
- Waterbury95
- Waterloo990
- Wauneta531
- Wausa698
- Waverly4,440
- Wayne6,121
- Weeping Water1,407
- Wellfleet74
- West Point3,471
- Western215
- Westerville19
- Weston256
- Whitney46
- Wilber1,936
- Wilcox336
- Wilsonville98
- Winnebago1,058
- Winnetoon68
- Winside485
- Winslow69
- Wisner1,461
- Wolbach283
- Wood Lake16
- Wood River1,494
- Woodland Hills205
- Woodland Park1,657
- Wymore1,320
- Wynot209
- Yankee Hill250
- York8,141
- Yutan1,832
Metro and micro areas
Each of the 13 that reach into Nebraska, with its whole population, from ACS 2020–2024 5-year estimates. Metro and micro areas are counties tied together by commuting, drawn by the Office of Management and Budget.
- Beatrice, NE Micro Area21,629
- Columbus, NE Micro Area45,357
- Fremont, NE Micro Area37,351
- Grand Island, NE Metro Area76,794
- Hastings, NE Micro Area40,507
- Kearney, NE Micro Area57,292
- Lexington, NE Micro Area26,242
- Lincoln, NE Metro Area344,337
- Norfolk, NE Micro Area48,653
- North Platte, NE Micro Area34,575
- Omaha, NE-IA Metro Area982,064
- Scottsbluff, NE Micro Area36,585
- Sioux City, IA-NE-SD Metro Area144,682
ZIP codes
Each of the 582 with people in it, by the town it's centered in, from ACS 2020–2024 5-year estimates. These are the Census Bureau's ZIP Code Tabulation Areas, which follow the Postal Service's ZIP codes as closely as census blocks allow.
- 68001Abie59
- 68002Arlington2,602
- 68003Ashland5,139
- 68004Bancroft922
- 68005Bellevue21,984
- 68007Bennington19,536
- 68008Blair12,823
- 68010Boys Town809
- 68014Bruno283
- 68015Cedar Bluffs1,236
- 68016Cedar Creek427
- 68017Ceresco1,979
- 68018Colon508
- 68019Craig386
- 68020Decatur644
- 68022Waterloo36,538
- 68023Fort Calhoun2,687
- 68025Fremont31,658
- 68028Gretna17,529
- 68029Herman918
- 68030Homer671
- 68031Hooper1,823
- 68033Ithaca287
- 68034Kennard627
- 68036Linwood346
- 68037Louisville2,524
- 68038Lyons1,398
- 68039Macy793
- 68040Malmo325
- 68041Mead1,005
- 68042Memphis130
- 68044Fontanelle715
- 68045Oakland2,028
- 68046Richfield35,085
- 68047Pender2,094
- 68048Plattsmouth13,435
- 68050Prague527
- 68055Rosalie315
- 68057Scribner1,379
- 68058South Bend378
- 68059Springfield3,373
- 68061Tekamah2,268
- 68062Thurston267
- 68063Uehling244
- 68064Valley4,046
- 68065Valparaiso1,449
- 68066Wahoo5,941
- 68067Walthill1,068
- 68068Washington198
- 68069Venice3,207
- 68070Weston670
- 68071Winnebago2,159
- 68072Winslow69
- 68073Yutan2,993
- 68102Omaha9,767
- 68104Omaha36,673
- 68105Omaha22,807
- 68106Omaha21,224
- 68107Omaha31,540
- 68108Omaha14,578
- 68110Omaha9,229
- 68111Omaha24,210
- 68112Fort Calhoun12,071
- 68113Offutt AFB892
- 68114Omaha17,596
- 68116Omaha34,501
- 68117Omaha8,224
- 68118Omaha9,169
- 68122Omaha13,352
- 68123Bellevue33,804
- 68124Omaha15,482
- 68127Omaha20,484
- 68128La Vista18,924
- 68130Omaha21,722
- 68131Omaha14,809
- 68132Omaha13,960
- 68133Bellevue14,729
- 68134Omaha28,823
- 68135Omaha30,523
- 68136Gretna22,163
- 68137Omaha24,277
- 68138Chalco11,713
- 68142Bennington4,505
- 68144Omaha25,732
- 68147Bellevue12,430
- 68152Fort Calhoun6,791
- 68154Omaha24,060
- 68157Bellevue5,252
- 68164Omaha28,564
- 68178Omaha2,191
- 68182Omaha749
- 68301Adams1,549
- 68303Alexandria233
- 68304Alvo414
- 68305Auburn4,351
- 68307Avoca336
- 68309Barneston117
- 68310Beatrice14,093
- 68313Beaver Crossing758
- 68314Bee361
- 68315Belvidere70
- 68316Benedict414
- 68317Bennet1,984
- 68318Blue Springs572
- 68319Bradshaw632
- 68320Brock348
- 68321Brownville480
- 68322Bruning513
- 68323Burchard244
- 68324Burr162
- 68325Byron131
- 68326Carleton339
- 68327Chester383
- 68328Clatonia493
- 68329Cook579
- 68330Cordova71
- 68331Cortland1,002
- 68332Crab Orchard93
- 68333Crete9,286
- 68335Davenport395
- 68336Davey496
- 68337Dawson326
- 68338Daykin217
- 68339Denton1,154
- 68340Deshler989
- 68341De Witt821
- 68342Diller497
- 68343Dorchester1,008
- 68344Douglas544
- 68345Du Bois245
- 68346Dunbar544
- 68347Eagle2,508
- 68348Elk Creek341
- 68349Elmwood1,224
- 68350Endicott173
- 68351Exeter834
- 68352Fairbury4,938
- 68354Fairmont863
- 68355Falls City4,860
- 68357Filley347
- 68358Firth1,701
- 68359Friend1,546
- 68360Garland504
- 68361Geneva2,338
- 68362Gilead30
- 68364Goehner309
- 68365Grafton288
- 68366Greenwood957
- 68367Gresham342
- 68368Hallam477
- 68370Hebron1,938
- 68371Henderson1,314
- 68372Hickman4,135
- 68375Hubbell69
- 68376Humboldt1,239
- 68377Harbine412
- 68378Johnson677
- 68379Julian42
- 68380Lewiston46
- 68381Liberty159
- 68382Lorton72
- 68401McCool Junction1,122
- 68402Malcolm1,459
- 68403Manley206
- 68404Sprague1,039
- 68405Milford3,575
- 68406Milligan468
- 68407Murdock878
- 68409Murray625
- 68410Nebraska City8,980
- 68413Nehawka558
- 68414Nemaha102
- 68415Odell508
- 68416Ohiowa175
- 68417Otoe273
- 68418Palmyra1,109
- 68419Panama242
- 68420Pawnee City1,255
- 68421Peru987
- 68422Pickrell818
- 68423Pleasant Dale688
- 68424Plymouth707
- 68428Raymond1,332
- 68429Reynolds59
- 68430Roca1,989
- 68431Rulo269
- 68433Salem196
- 68434Seward9,099
- 68436Shickley527
- 68437Shubert247
- 68438Sprague176
- 68439Staplehurst691
- 68440Steele City109
- 68441Steinauer133
- 68442Stella211
- 68443Sterling1,200
- 68444Strang44
- 68445Swanton161
- 68446Syracuse2,792
- 68447Table Rock520
- 68448Talmage225
- 68450Tecumseh3,124
- 68452Ong67
- 68453Tobias280
- 68454Unadilla778
- 68455Union852
- 68456Utica1,215
- 68457Verdon460
- 68458Virginia226
- 68460Waco601
- 68461Walton503
- 68462Waverly4,928
- 68463Weeping Water1,831
- 68464Western392
- 68465Wilber2,543
- 68466Barneston1,697
- 68467York9,718
- 68502Lincoln25,846
- 68503Lincoln15,867
- 68504Lincoln17,278
- 68505Lincoln18,834
- 68506Lincoln27,531
- 68507Lincoln16,029
- 68508Lincoln18,163
- 68510Lincoln19,391
- 68512Lincoln13,802
- 68514Davey420
- 68516Lincoln48,903
- 68517Waverly415
- 68520Walton2,762
- 68521Lincoln37,050
- 68522Lincoln14,836
- 68523Yankee Hill2,031
- 68524Raymond6,139
- 68526Cheney7,944
- 68527Walton2,318
- 68528Emerald7,273
- 68531Raymond186
- 68532Emerald785
- 68601Columbus30,944
- 68620Albion2,986
- 68621Ames204
- 68622Bartlett427
- 68623Belgrade356
- 68624Bellwood1,009
- 68626Brainard563
- 68627Cedar Rapids802
- 68628Clarks848
- 68629Clarkson1,336
- 68631Creston337
- 68632David City3,942
- 68633Dodge930
- 68634Duncan635
- 68635Dwight456
- 68636Elgin1,224
- 68637Ericson317
- 68638Fullerton1,664
- 68640Genoa1,212
- 68641Howells939
- 68642Humphrey1,628
- 68643Leigh1,019
- 68644Lindsay762
- 68647Monroe702
- 68648Morse Bluff349
- 68649North Bend1,748
- 68651Osceola1,364
- 68652Petersburg630
- 68653Platte Center748
- 68654Polk569
- 68655Primrose112
- 68658Rising City604
- 68659Rogers220
- 68660St. Edward893
- 68661Schuyler7,459
- 68662Shelby1,088
- 68663Silver Creek782
- 68664Snyder293
- 68665Spalding638
- 68666Stromsburg1,514
- 68667Surprise110
- 68669Ulysses493
- 68701Norfolk31,417
- 68710Allen754
- 6871160
- 68713Atkinson2,285
- 687141,139
- 68715Battle Creek1,885
- 68716Beemer942
- 68717Belden184
- 68718Lindy1,603
- 68719Gross154
- 68720Brunswick250
- 68722Butte384
- 68723Carroll678
- 68724Center276
- 68725Chambers647
- 68726Clearwater724
- 68727Coleridge685
- 68728Concord247
- 68729Creighton1,735
- 68730Crofton2,156
- 68731Dakota City3,469
- 68732Dixon153
- 68733Emerson1,101
- 68734Emmet130
- 68735828
- 68736Fordyce525
- 68739Hartington2,799
- 68740Hoskins925
- 68741Hubbard585
- 68742Inman376
- 68743Jackson814
- 68745Laurel1,737
- 68746Lynch201
- 68747McLean198
- 68748Madison2,706
- 68749Magnet61
- 68751Maskell76
- 68752Meadow Grove543
- 6875339
- 68755Naper397
- 68756Neligh1,811
- 68757Newcastle783
- 68758Newman Grove1,199
- 68759349
- 68760Lindy1,126
- 68761Oakdale442
- 68763O'Neill4,572
- 68764Orchard819
- 68765Osmond1,123
- 68766Page308
- 68767Pierce3,401
- 68768Pilger731
- 68769Plainview1,722
- 68770Ponca1,432
- 68771Randolph1,412
- 68773Royal283
- 68774St. Helena238
- 68776South Sioux City15,373
- 68777Spencer614
- 68778Springview571
- 68779Stanton2,259
- 68780Stuart991
- 68781Tilden1,324
- 68783Verdigre964
- 68784Wakefield1,740
- 68785Waterbury234
- 68786Wausa1,080
- 68787Wayne6,791
- 68788West Point4,588
- 68789Winnetoon127
- 68790Winside931
- 68791Wisner2,044
- 68792Wynot340
- 68801Grand Island30,824
- 68803Grand Island25,534
- 68810Alda862
- 68812Amherst642
- 68813Anselmo518
- 68814Ansley984
- 68815Arcadia652
- 68816Archer137
- 68817Ashton340
- 68818Aurora5,680
- 68820Howard City343
- 68821Brewster89
- 68822Broken Bow4,335
- 688231,936
- 68824Cairo1,562
- 68825Callaway995
- 68826Central City3,944
- 68827Chapman761
- 68828Comstock204
- 68831Dannebrog705
- 68832Doniphan2,126
- 68833Dunning148
- 68834Eddyville227
- 68835Cotesfield459
- 68836Elm Creek1,908
- 68837Elyria109
- 68838Farwell150
- 68840Gibbon2,624
- 68841Giltner649
- 68842Greeley Center538
- 68843Hampton1,032
- 68844Hazard328
- 68845Odessa20,536
- 68846Hordville283
- 68847Glenwood18,354
- 68849Kearney1,385
- 68850Lexington12,428
- 68852Litchfield572
- 68853Loup City1,333
- 68854Marquette708
- 68855Mason City400
- 68856Merna715
- 68858Miller328
- 68859North Loup357
- 68860Oconto301
- 68861Odessa138
- 68862Ord2,977
- 68863Overton1,410
- 68864Palmer958
- 68865Phillips941
- 68866Pleasanton1,168
- 68869Ravenna2,165
- 68870Riverdale506
- 68871Rockville268
- 68872St. Libory992
- 68873St. Paul3,785
- 68874Sargent821
- 68875Scotia716
- 68876Shelton1,910
- 68878Sumner463
- 68879377
- 68881Westerville26
- 68882Wolbach401
- 68883Wood River2,483
- 68901Hastings26,264
- 68920Alma1,452
- 68922Arapahoe1,299
- 68923Atlanta133
- 68924Axtell1,348
- 68925Ayr393
- 68926Beaver City684
- 68927Bertrand1,130
- 68928Bladen327
- 68929Bloomington167
- 68930Blue Hill1,143
- 68932Campbell355
- 68933Clay Center851
- 68934Deweese84
- 68935Edgar726
- 68936Edison183
- 68937Elwood1,831
- 68938Fairfield532
- 68939Franklin1,107
- 68940Funk518
- 68941Glenvil683
- 68942Guide Rock565
- 68943Hardy241
- 68944Harvard1,252
- 68945Heartwell156
- 68946Hendley36
- 68947Hildreth664
- 68948Holbrook335
- 68949Holdrege6,662
- 68950Holstein290
- 68952Inavale103
- 68954Inland43
- 68955Juniata2,242
- 68956Kenesaw1,140
- 68957Lawrence555
- 68958Loomis613
- 68959Minden4,048
- 68960Naponee178
- 68961Nelson633
- 68964Oak139
- 68966Orleans426
- 68967Oxford899
- 68970Red Cloud1,248
- 68971Republican City306
- 68972Riverton203
- 68973Roseland520
- 68974Ruskin262
- 68975Saronville88
- 68976Smithfield234
- 68977Stamford226
- 68978Superior2,284
- 68979Sutton1,572
- 68980Trumbull561
- 68981Upland166
- 68982Wilcox591
- 69001McCook9,054
- 69020Bartley655
- 69021Benkelman1,224
- 69022Cambridge1,575
- 69023Lamar315
- 69024Culbertson1,017
- 69025Curtis951
- 69026Danbury148
- 69027Enders57
- 69028Eustis820
- 69029Farnam361
- 69030280
- 69032Hayes Center526
- 69033Imperial2,610
- 69034Indianola895
- 69036Lebanon35
- 69037Max62
- 69038Maywood418
- 69039Moorefield122
- 69040Palisade566
- 69041Parks88
- 69042Stockville13
- 69043Stratton546
- 69044Trenton623
- 69045Wauneta801
- 69046Wilsonville194
- 69101North Platte27,198
- 69120Arnold1,208
- 69121Arthur365
- 69122Big Springs654
- 69123Brady972
- 69125Broadwater332
- 69127Brule906
- 69128Bushnell404
- 69129Chappell1,292
- 69130Cozad5,004
- 69131Dalton729
- 69132Wallace88
- 69133Dix340
- 69134Elsie327
- 6913529
- 69138Gothenburg4,316
- 69140Grant1,762
- 69141Gurley327
- 6914253
- 69143Hershey1,789
- 69144Martin145
- 69145Kimball2,511
- 69146Belmar230
- 69147706
- 6914854
- 69149Lodgepole722
- 69150Madrid344
- 69151Maxwell831
- 69152Mullen743
- 69153Ogallala5,812
- 69154Oshkosh1,095
- 69155Sarben936
- 69156Potter668
- 69157Halsey99
- 69161Seneca53
- 69162Sidney7,274
- 69163Stapleton847
- 69165Sutherland1,760
- 69166Thedford603
- 69167Tryon403
- 69168Venango288
- 69169Wallace461
- 69170Wellfleet326
- 692014,012
- 692102,191
- 69211Cody201
- 69212Crookston315
- 69214Johnstown177
- 69216Kilgore221
- 69217543
- 69218429
- 6921940
- 6922054
- 69221Wood Lake64
- 69301Alliance9,524
- 6933125
- 69333296
- 69334Bayard2,418
- 6933533
- 69336Bridgeport1,893
- 69337Chadron6,466
- 69339Crawford1,474
- 69340169
- 69341Gering10,482
- 693432,544
- 69345Harrisburg541
- 69346Harrison480
- 69347Hay Springs1,324
- 69348Hemingford1,334
- 69350Hyannis375
- 69351193
- 69352Lyman552
- 69353McGrew46
- 69354110
- 69355Melbeta146
- 69356Minatare2,114
- 693573,677
- 69358Henry2,062
- 69360Rushville1,078
- 6936117,187
- 6936517
- 69366290
- 69367Whitney89
Towns and townships
Each of the 404 with people in it, from ACS 2020–2024 5-year estimates: the county subdivisions that are governments of their own. A city, borough or village that is one too is listed with the places above.
- Adams township824
- Addison township70
- Albany township6
- Alda township848
- Alexis township895
- Algernon township313
- Alma township247
- Anderson township90
- Ansley township632
- Antelope township (Franklin County)148
- Antelope township (Harlan County)64
- Antelope township (Holt County)24
- Arcadia township395
- Arizona township236
- Arnold township1,091
- Ash Grove township106
- Ashland township3,354
- Atkinson township1,824
- Ayr township678
- Bancroft township751
- Barneston township190
- Basin township397
- Bazile township105
- Beaver township51
- Beemer township864
- Bell Creek township196
- Belle Prairie township54
- Belle township21
- Bennett township59
- Berwyn township195
- Bismark township (Cuming County)249
- Bismark township (Platte County)769
- Blackbird township756
- Blaine township (Adams County)58
- Blaine township (Antelope County)24
- Blaine township (Cuming County)129
- Blakely township229
- Blue Springs-Wymore township1,777
- Bohemia township (Knox County)20
- Bohemia township (Saunders County)11
- Bone Creek township421
- Bristow township133
- Broken Bow township520
- Bryan township71
- Bryant township447
- Burnett township205
- Burrows township224
- Bush township31
- Butler township639
- Butte township357
- Cameron township88
- Cedar township (Antelope County)47
- Cedar township (Nance County)60
- Center township (Butler County)122
- Center township (Hall County)462
- Center township (Saunders County)627
- Central township (Knox County)95
- Central township (Merrick County)47
- Chambers township535
- Chapman township (Merrick County)513
- Chapman township (Saunders County)612
- Chelsea township107
- Chester township361
- Clark township78
- Clarksville township671
- Clatonia township551
- Clear Creek township1,074
- Clearwater township403
- Cleveland township (Cuming County)200
- Cleveland township (Holt County)96
- Cleveland township (Knox County)94
- Cliff township180
- Columbia township161
- Columbus township3,313
- Comstock township124
- Concord township368
- Conley township124
- Cotterell township353
- Cottonwood township (Adams County)233
- Cottonwood township (Nance County)61
- Council Creek township13
- Craig township374
- Crawford township65
- Creighton township168
- Creston township322
- Cuming township (Cuming County)128
- Cuming township (Dodge County)188
- Custer township (Antelope County)36
- Custer township (Custer County)51
- Daily township28
- Davis Creek township17
- Dawes township327
- Decatur township708
- Delight township779
- Deloit township59
- Denver township959
- Dolphin township53
- Doniphan township1,159
- Douglas Grove township114
- Douglas township266
- Dowling township48
- East Bloomington township186
- East Newman township52
- Eastern township163
- Eden township57
- Edgar township610
- Eldorado township (Clay County)44
- Eldorado township (Harlan County)16
- Elgin township228
- Elim township85
- Elk Creek township120
- Elk township175
- Elkhorn township (Cuming County)109
- Elkhorn township (Dodge County)396
- Ellsworth township227
- Elm township (Antelope County)31
- Elm township (Gage County)122
- Elyria township164
- Emerson township (Dixon County)543
- Emerson township (Harlan County)140
- Emmet township118
- Enterprise township123
- Eureka township71
- Everett township (Burt County)1,096
- Everett township (Dodge County)297
- Ewing township449
- Exeter-Fairmont Consolidated township1,362
- Fairfield township (Clay County)458
- Fairfield township (Harlan County)9
- Fairview township113
- Filley township245
- Flournoy township256
- Francis township16
- Frankfort township88
- Franklin township (Butler County)261
- Franklin township (Fillmore County)162
- Frenchtown township186
- Fullerton township135
- Galena township192
- Garfield township (Antelope County)665
- Garfield township (Cuming County)104
- Garfield township (Custer County)136
- Geneva township1,278
- Genoa township179
- Geranium township46
- Glengary township385
- Glenvil township390
- Glenwood township188
- Golden township32
- Grafton township211
- Grand Prairie township227
- Grant township (Antelope County)25
- Grant township (Cuming County)129
- Grant township (Custer County)8
- Grant township (Franklin County)140
- Grant township (Gage County)186
- Granville township864
- Grattan township624
- Green township268
- Green Valley township92
- Hamilton township229
- Hanover township (Adams County)150
- Hanover township (Gage County)308
- Harrison township (Hall County)210
- Harrison township (Knox County)92
- Harvard township1,069
- Hayes township4
- Herrick township96
- Highland township (Adams County)288
- Highland township (Gage County)893
- Hill township459
- Holt Creek township7
- Holt township668
- Hooker township (Dixon County)227
- Hooker township (Gage County)159
- Hooper township1,471
- Humphrey township373
- Independent township21
- Inland township191
- Inman township430
- Iowa township16
- Island Grove township66
- Jackson township251
- Jefferson township56
- Joliet township143
- Juniata township897
- Kenesaw township994
- Kilfoil township669
- Lake township (Hall County)353
- Lake township (Holt County)113
- Leicester township427
- Leshara township616
- Lewis township126
- Liberty township (Fillmore County)133
- Liberty township (Gage County)188
- Liberty township (Valley County)69
- Lillian township126
- Lincoln township (Antelope County)84
- Lincoln township (Cuming County)194
- Lincoln township (Franklin County)104
- Lincoln township (Gage County)142
- Lincoln township (Knox County)817
- Linwood township328
- Little Blue township200
- Logan township (Adams County)61
- Logan township (Antelope County)772
- Logan township (Burt County)186
- Logan township (Clay County)118
- Logan township (Cuming County)167
- Logan township (Dixon County)170
- Logan township (Dodge County)364
- Logan township (Gage County)317
- Logan township (Knox County)147
- Lone Tree township (Clay County)119
- Lone Tree township (Merrick County)590
- Lost Creek township794
- Loup Ferry township79
- Loup township (Custer County)102
- Loup township (Merrick County)614
- Loup township (Platte County)182
- Lynch township152
- Lynn township61
- Macon township136
- Madison township509
- Maple township108
- Marble township519
- Marietta township937
- Marion township57
- Mariposa township293
- Marshall township45
- Martin township95
- Mayfield township642
- McClure township42
- McCulley township10
- Mead township191
- Merry township54
- Midland township (Gage County)484
- Midland township (Merrick County)181
- Milburn township76
- Miller township131
- Momence township39
- Monroe township50
- Monterey township229
- Morse Bluff township394
- Morton township (Boyd County)67
- Morton township (Knox County)130
- Mullally township122
- Mullen township5
- Myrtle township163
- Neligh township (Antelope County)203
- Neligh township (Cuming County)77
- Nemaha township438
- Newcastle township540
- Newman township103
- Nickerson township1,204
- Niobrara township397
- Noble township191
- North Cedar township879
- North Frankfort township229
- North Franklin township300
- North Loup township352
- Oak Creek township (Butler County)437
- Oak Creek township (Saunders County)978
- Oakdale township457
- Oakland township155
- Oconee township401
- Olive township159
- Omaha township995
- Ord township (Antelope County)89
- Ord township (Valley County)2,398
- Orleans township372
- Ottercreek township150
- Paddock township (Gage County)294
- Paddock township (Holt County)71
- Pebble township424
- Pender township1,623
- Peoria township210
- Perry township231
- Pershing township32
- Platte township (Butler County)182
- Platte township (Dodge County)1,828
- Pleasant Valley township51
- Pleasant View township89
- Plum Creek township79
- Pohocco township1,292
- Ponca township457
- Prairie Creek township (Hall County)266
- Prairie Creek township (Merrick County)249
- Prairie Creek township (Nance County)102
- Prairie Dog township50
- Prairie Island township57
- Quinnebaugh township19
- Raymond township132
- Read township347
- Reading township485
- Republican City township85
- Reuben township39
- Richardson township490
- Richland township1,545
- Ridgeley township214
- Riverside township (Burt County)18
- Riverside township (Gage County)315
- Rock Creek township448
- Rock Falls township72
- Rockford township368
- Roseland township577
- Royal township128
- Ryno township18
- Salem township535
- Sand Creek township24
- Sappa township223
- Saratoga township6
- Sargent township627
- Savannah township530
- Scandinavia township208
- School Creek township92
- Scott township13
- Shamrock township50
- Shell Creek township830
- Sheridan township (Clay County)7
- Sheridan township (Holt County)166
- Sherman township (Antelope County)164
- Sherman township (Cuming County)345
- Sherman township (Gage County)202
- Sherman township (Platte County)209
- Shields township68
- Sicily township250
- Silver Creek township (Burt County)59
- Silver Creek township (Merrick County)567
- Silver Lake township60
- Silvercreek township184
- Skull Creek township161
- South Branch township28
- South Cedar township299
- South Loup township831
- South Platte township966
- Spade township104
- Sparta township98
- Spencer township536
- Spring Grove township68
- Spring Ranch township84
- Springbank township584
- Springdale township75
- St. Bernard township632
- St. Charles township232
- Stanton township (Antelope County)45
- Stanton township (Fillmore County)479
- Steel Creek township24
- Stocking township174
- Stuart township794
- Summit township (Burt County)419
- Summit township (Butler County)129
- Sutton township129
- Swan township1
- Thayer township83
- Timber Creek township299
- Township 14,458
- Township 23,195
- Township 51,348
- Township 61,460
- Township 72,731
- Triumph township104
- Turkey Creek township (Franklin County)105
- Turkey Creek township (Harlan County)12
- Ulysses township251
- Union township (Butler County)130
- Union township (Dodge County)243
- Union township (Knox County)96
- Union township (Saunders County)2,563
- Valley township245
- Verdigre township740
- Verdigris township (Antelope County)171
- Verdigris township (Holt County)271
- Verona township272
- Victoria township282
- Vieregg township983
- Vinton township74
- Wahoo township331
- Wakefield township1,297
- Walker township169
- Walnut Grove township53
- Wanda township92
- Washington township (Franklin County)83
- Washington township (Hall County)1,585
- Washington township (Harlan County)32
- Washington township (Knox County)44
- Wayne township72
- Webster township766
- West Blue township (Adams County)358
- West Blue township (Fillmore County)87
- West Newman township59
- West Union township6
- Western township44
- Westerville township121
- Willow township53
- Willowdale township58
- Winnebago township2,141
- Wisner township136
- Wood River township (Custer County)298
- Wood River township (Hall County)1,896
- Woodville township85
- Wyoming township90
- Yale township70
- Zero township167
School districts
Each of the 244 with people in it, from ACS 2020–2024 5-year estimates.
- Adams Central Public Schools6,358
- Ainsworth Community Schools2,869
- Allen Consolidated Schools956
- Alliance Public Schools9,283
- Alma Public Schools1,828
- Amherst Public Schools1,250
- Anselmo-Merna Public Schools1,191
- Ansley Public Schools1,060
- Arapahoe Public Schools1,722
- Arcadia Public Schools497
- Arlington Public Schools3,641
- Arnold Public Schools1,264
- Arthur County Schools491
- Ashland-Greenwood Public Schools5,798
- Auburn Public Schools5,503
- Aurora Public Schools6,851
- Axtell Community Schools1,617
- Bancroft-Rosalie Community Schools1,192
- Banner County Public Schools717
- Battle Creek Public Schools2,957
- Bayard Public Schools2,491
- Beatrice Public Schools14,306
- Bellevue Public Schools52,329
- Bennington Public Schools18,718
- Bertrand Public Schools1,402
- Blair Community Schools13,408
- Bloomfield Community Schools1,618
- Blue Hill Public Schools1,231
- Boone Central Schools3,570
- Boyd County Schools1,743
- Brady Public Schools882
- Bridgeport Public Schools2,108
- Broken Bow Public Schools4,485
- Bruning-Davenport Unified School System1,277
- Burwell Public Schools1,726
- Callaway Public Schools1,285
- Cambridge Public Schools1,547
- Cedar Bluffs Public Schools1,521
- Centennial Public Schools2,979
- Central City Public Schools4,671
- Central Valley Public Schools2,006
- Centura Public Schools2,480
- Chadron Public Schools6,552
- Chambers Public Schools845
- Chase County Schools2,968
- Clarkson Public Schools1,167
- Cody-Kilgore Public Schools451
- Columbus Public Schools26,081
- Conestoga Public Schools4,092
- Cozad Community Schools4,902
- Crawford Public Schools1,270
- Creek Valley Schools2,024
- Creighton Community Public Schools2,076
- Crete Public Schools11,287
- Crofton Community Schools2,342
- Cross County Community Schools2,095
- David City Public Schools5,523
- Deshler Public Schools1,356
- Diller-Odell Public Schools1,405
- Doniphan-Trumbull Public Schools2,915
- Dorchester Public Schools1,030
- Douglas County West Community Schools6,836
- Dundy County Stratton Public Schools2,190
- East Butler Public Schools2,486
- Elba Public Schools458
- Elgin Public Schools1,380
- Elkhorn Public Schools58,397
- Elkhorn Valley Schools1,720
- Elm Creek Public Schools1,985
- Elmwood-Murdock Public Schools2,329
- Elwood Public Schools1,747
- Emerson-Hubbard Public Schools1,510
- Eustis-Farnam Public Schools1,201
- Exeter-Milligan Public Schools1,416
- Fairbury Public Schools5,427
- Falls City Public Schools5,764
- Fillmore Central Public Schools3,318
- Fort Calhoun Community Schools3,694
- Franklin Public Schools1,623
- Freeman Public Schools1,871
- Fremont Public Schools30,975
- Friend Public Schools1,540
- Fullerton Public Schools1,836
- Garden County Schools1,722
- Gering Public Schools10,649
- Gibbon Public Schools2,642
- Giltner Public Schools720
- Gordon-Rushville Public Schools4,205
- Gothenburg Public Schools4,333
- Grand Island Public Schools54,178
- Gretna Public Schools29,611
- Hampton Public Schools976
- Hartington Newcastle Public Schools3,760
- Harvard Public Schools1,197
- Hastings Public Schools22,504
- Hay Springs Public Schools1,137
- Hayes Center Public Schools685
- Heartland Community Schools1,993
- Hemingford Public Schools1,867
- Hershey Public Schools2,416
- High Plains Community Schools1,782
- Hitchcock County School System1,683
- Holdrege Public Schools6,860
- Homer Community Schools1,744
- Howells-Dodge Consolidated Schools1,774
- Humboldt Table Rock Steinauer Public Schools2,773
- Humphrey Public Schools2,059
- Hyannis Area Schools1,019
- Johnson County Central Public Schools4,317
- Johnson-Brock Public Schools1,428
- Kearney Public Schools39,714
- Kenesaw Public Schools1,419
- Keya Paha County Schools822
- Kimball Public Schools2,843
- Lakeview Community Schools5,422
- Laurel-Concord-Coleridge School2,902
- Leigh Community Schools1,236
- Lewiston Consolidated Schools877
- Lexington Public Schools12,529
- Leyton Public Schools1,373
- Lincoln Public Schools299,501
- Litchfield Public Schools738
- Logan View Public Schools3,152
- Loomis Public Schools849
- Louisville Public Schools3,724
- Loup City Public Schools1,962
- Loup County Public Schools578
- Lyons-Decatur Northeast Schools2,103
- Madison Public Schools2,998
- Malcolm Public Schools2,466
- Maxwell Public Schools1,021
- Maywood Public Schools795
- McCook Public Schools8,702
- McCool Junction Public Schools1,252
- McPherson County Schools454
- Mead Public Schools1,382
- Medicine Valley Public Schools1,098
- Meridian Public Schools836
- Milford Public Schools4,365
- Millard Public Schools119,613
- Minatare Public Schools845
- Minden Public Schools4,455
- Mitchell Public Schools3,324
- Morrill Public Schools2,650
- Mullen Public Schools795
- Nebraska City Public Schools9,662
- Neligh-Oakdale Schools2,236
- Newman Grove Public Schools1,329
- Niobrara Public Schools698
- Norfolk Public Schools30,612
- Norris School District 16010,305
- North Bend Central Public Schools2,455
- North Platte Public Schools26,314
- Northwest Public Schools3,643
- O'Neill Public Schools5,049
- Oakland Craig Public Schools2,174
- Ogallala Public Schools6,605
- Omaha Public Schools373,060
- Ord Public Schools3,401
- Osceola Public Schools1,446
- Osmond Community Schools1,118
- Overton Public Schools1,395
- Palmer Public Schools904
- Palmyra District OR-13,448
- Papillion-La Vista Community Schools71,064
- Pawnee City Public Schools1,594
- Paxton Consolidated Schools998
- Pender Public Schools2,241
- Perkins County Schools2,758
- Pierce Public Schools4,053
- Plainview Public Schools2,045
- Plattsmouth Community Schools10,180
- Pleasanton Public Schools1,512
- Ponca Public Schools2,105
- Potter-Dix Public Schools997
- Ralston Public Schools19,250
- Randolph Public Schools1,677
- Ravenna Public Schools2,445
- Raymond Central Public Schools4,309
- Red Cloud Community Schools1,388
- Riverside Public Schools1,682
- Rock County Public Schools1,319
- Sandhills Public Schools438
- Santee Community Schools360
- Sargent Public Schools896
- Schuyler Community Schools8,415
- Scottsbluff Public Schools18,589
- Scribner-Snyder Community Schools1,666
- Seward Public Schools11,249
- Shelby-Rising City Public Schools2,046
- Shelton Public Schools1,880
- Shickley Public Schools697
- Sidney Public Schools7,006
- Silver Lake Public Schools1,443
- Sioux County Public Schools668
- South Central Nebraska Unified 54,007
- South Platte Public Schools1,268
- South Sioux City Community Schools18,181
- Southern School District 12,423
- Southern Valley Schools2,239
- Southwest Public Schools2,004
- Springfield Platteview Community Schools7,006
- St. Edward Public Schools838
- St. Paul Public Schools4,108
- Stanton Community Schools2,262
- Stapleton Public Schools877
- Sterling Public Schools1,471
- Stuart Public Schools793
- Summerland Public Schools2,609
- Sumner-Eddyville-Miller Schools1,017
- Superior Public Schools2,899
- Sutherland Public Schools1,706
- Sutton Public Schools1,809
- Syracuse-Dunbar-Avoca Schools4,642
- Tekamah-Herman Community Schools3,107
- Thayer Central Community Schools2,625
- Thedford Public Schools540
- Tri County Public Schools2,122
- Twin River Public Schools2,790
- Umo N Ho N Nation Public Schools757
- Valentine Community Schools4,109
- Verdigre Public Schools1,105
- Wahoo Public Schools7,241
- Wakefield Public Schools1,797
- Wallace Public School District 65 R649
- Walthill Public Schools1,096
- Wauneta-Palisade Public Schools1,350
- Wausa Public Schools1,220
- Waverly School District 14511,616
- Wayne Community Schools7,351
- Weeping Water Public Schools2,160
- West Holt Public Schools2,519
- West Point Public Schools5,556
- Westside Community Schools31,893
- Wheeler Central Schools896
- Wilber-Clatonia Public Schools3,139
- Wilcox-Hildreth Public Schools1,410
- Winnebago Public Schools2,122
- Winside Public Schools1,182
- Wisner-Pilger Public Schools2,868
- Wood River Rural Schools3,156
- Wynot Public Schools711
- York Public Schools9,492
- Yutan Public Schools3,404
Congressional districts
As drawn for the 119th Congress (2025–2027).
- Congressional District 1662,376
- Congressional District 2664,272
- Congressional District 3652,059
State senate districts
The upper chamber’s districts, as drawn in 2024.
- State Senate District 138,829
- State Senate District 243,399
- State Senate District 340,535
- State Senate District 440,345
- State Senate District 542,752
- State Senate District 640,460
- State Senate District 739,747
- State Senate District 841,457
- State Senate District 939,532
- State Senate District 1042,168
- State Senate District 1140,230
- State Senate District 1236,566
- State Senate District 1340,659
- State Senate District 1440,376
- State Senate District 1542,162
- State Senate District 1638,394
- State Senate District 1739,835
- State Senate District 1843,721
- State Senate District 1939,597
- State Senate District 2043,369
- State Senate District 2140,624
- State Senate District 2238,939
- State Senate District 2340,257
- State Senate District 2439,008
- State Senate District 2542,272
- State Senate District 2641,344
- State Senate District 2741,513
- State Senate District 2839,810
- State Senate District 2938,778
- State Senate District 3041,743
- State Senate District 3140,582
- State Senate District 3239,343
- State Senate District 3340,406
- State Senate District 3437,638
- State Senate District 3538,120
- State Senate District 3644,153
- State Senate District 3740,759
- State Senate District 3840,728
- State Senate District 3947,557
- State Senate District 4039,880
- State Senate District 4139,082
- State Senate District 4237,156
- State Senate District 4338,586
- State Senate District 4439,556
- State Senate District 4538,237
- State Senate District 4638,913
- State Senate District 4738,889
- State Senate District 4839,833
- State Senate District 4940,868
PUMAs
Public Use Microdata Areas: areas of 100,000 people or more that the state draws from census tracts, for the Census Bureau’s microdata.
- Central Nebraska PUMA109,576
- Dodge, Cass, Saunders & Washington Counties PUMA108,666
- Douglas County–Omaha City (Northeast) PUMA115,188
- Douglas County–Omaha City (Northwest) PUMA204,760
- Douglas County–Omaha City (Southeast) PUMA113,612
- Douglas County–Omaha City (Southwest) PUMA157,176
- Lancaster County–Lincoln City (North) PUMA174,624
- Lancaster County–Lincoln City (South) PUMA152,072
- North Central & Northwest Nebraska PUMA104,845
- Northeast Nebraska PUMA184,758
- Sarpy County–Bellevue City PUMA197,389
- South Central Nebraska PUMA116,588
- Southeast Nebraska PUMA138,287
- Southwest Nebraska PUMA101,166
Urban areas
Each that reaches into Nebraska, with its whole population. Urban areas are the densely settled land the Census Bureau draws after each census, whatever the city lines.
- Alliance, NE7,887
- Beatrice, NE12,225
- Blair, NE7,887
- Chadron, NE4,886
- Columbus, NE25,858
- Crete, NE7,432
- Fairbury, NE3,892
- Falls City, NE4,077
- Fremont, NE28,400
- Grand Island, NE54,771
- Hastings, NE24,894
- Holdrege, NE5,497
- Kearney, NE35,051
- Lexington, NE10,406
- Lincoln, NE293,106
- McCook, NE7,341
- Nebraska City, NE6,923
- Norfolk, NE27,478
- North Platte, NE22,640
- Ogallala, NE4,690
- Omaha, NE–IA825,474
- Plattsmouth, NE6,624
- Schuyler, NE6,578
- Scottsbluff, NE24,660
- Seward, NE7,557
- Sidney, NE6,202
- Sioux City, IA–NE–SD113,986
- Wahoo, NE4,929
- Wayne, NE6,121
- York, NE8,071
Tribal areas
Each that reaches into Nebraska, with its whole population.
Turn Nebraska into your planning report.
Social Explorer Studio builds an editable profile of any place, with tables and charts beside the county and state, and exports to Word, PDF and Excel.
Questions about Nebraska
What is the population of Nebraska?
2,018,006 people, according to the ACS 2025 1-year estimates, which the Census Bureau adjusts to match its own population estimate. That’s the 37th largest of the 50 states and DC.
What is the FIPS code for Nebraska?
31. Every county’s and place’s FIPS code in Nebraska starts with it. The Census Bureau’s full geographic identifier (GEOID) is 0400000US31.
What is the largest city in Nebraska?
Omaha, with 488,813 people. Other large cities here include Lincoln, Bellevue and Grand Island.
What is the median household income in Nebraska?
$81,614 (±$1,319), according to the ACS 2025 1-year estimates, lower than the US ($84,780).
What is the median age in Nebraska?
37.9 years (±0.3), according to the ACS 2025 1-year estimates, lower than the US (39.5).
How much does housing cost in Nebraska?
Nebraska’s median home value is $279,200 (±$3,160) and its median gross rent is $1,194 (±$20) a month, according to the ACS 2025 1-year estimates. 41.7% (±2.3%) of its renters pay 30% or more of their income on rent.
Is Nebraska growing?
Nebraska’s population grew 6.4%, from 1,896,190 in 2015 to 2,018,006 in 2025, according to the ACS 1-year estimates.
Where do people who work in Nebraska live?
929,217 of its 998,142 jobs are held by people who live here. Of those who commute in, the most come from Iowa, Kansas, South Dakota.
Where does this census data come from?
The U.S. Census Bureau’s American Community Survey, through Social Explorer’s tables: the latest 1-year estimates where they exist, for the most recent numbers, and 5-year estimates otherwise. Each table lists its code, so you can find it again.
Is this data free to use?
Yes. You can read it, cite it, download the CSV and embed the charts, with no account. To map other variables, compare your own areas or build a report, see Social Explorer’s plans in a live demo.
Sources and how to cite
American Community Survey 2025 1-year estimates, or 2020–2024 5-year estimates where noted, U.S. Census Bureau, from Social Explorer’s tables A00001, A00002, A01004, A04001, A06001, A08001, A09005, A10001, A10003, A10008, A10030, A10036, A10040, A10047, A10055, A10060, A12001, A13004, A14006, A14024, A14028, A16002, A17005, A18002, A18009, A20001, B02002, B09001, B13002, B18101, C16001. Maps by census tract use 2020–2024 5-year estimates, since the 1-year survey doesn’t cover tracts. Commuting: LEHD LODES 2023. These are estimates from a sample, each with its margin of error. Data retrieved November 14, 2026. How these profiles are made.
U.S. Census Bureau, American Community Survey 2025 1-year estimates, or 2020–2024 5-year estimates where noted, via Social Explorer. “Nebraska.” https://www.socialexplorer.com/places/nebraska. Accessed November 14, 2026.