

Arkansas: Population, demographics and census data
Home to 3,114,791 people, the 33rd largest of the 50 states and DC, anchored by Little Rock. It grew 4.6% between 2015 and 2025.
- Population
- 3.11M. Census Bureau estimate · Rank 33 of the 50 states and DC
- Median household income
- $65,588 ±$976. US $84,780
- Median age
- 39.3 ±0.2. US 39.5
ACS 2025 1-year estimates, U.S. Census Bureau
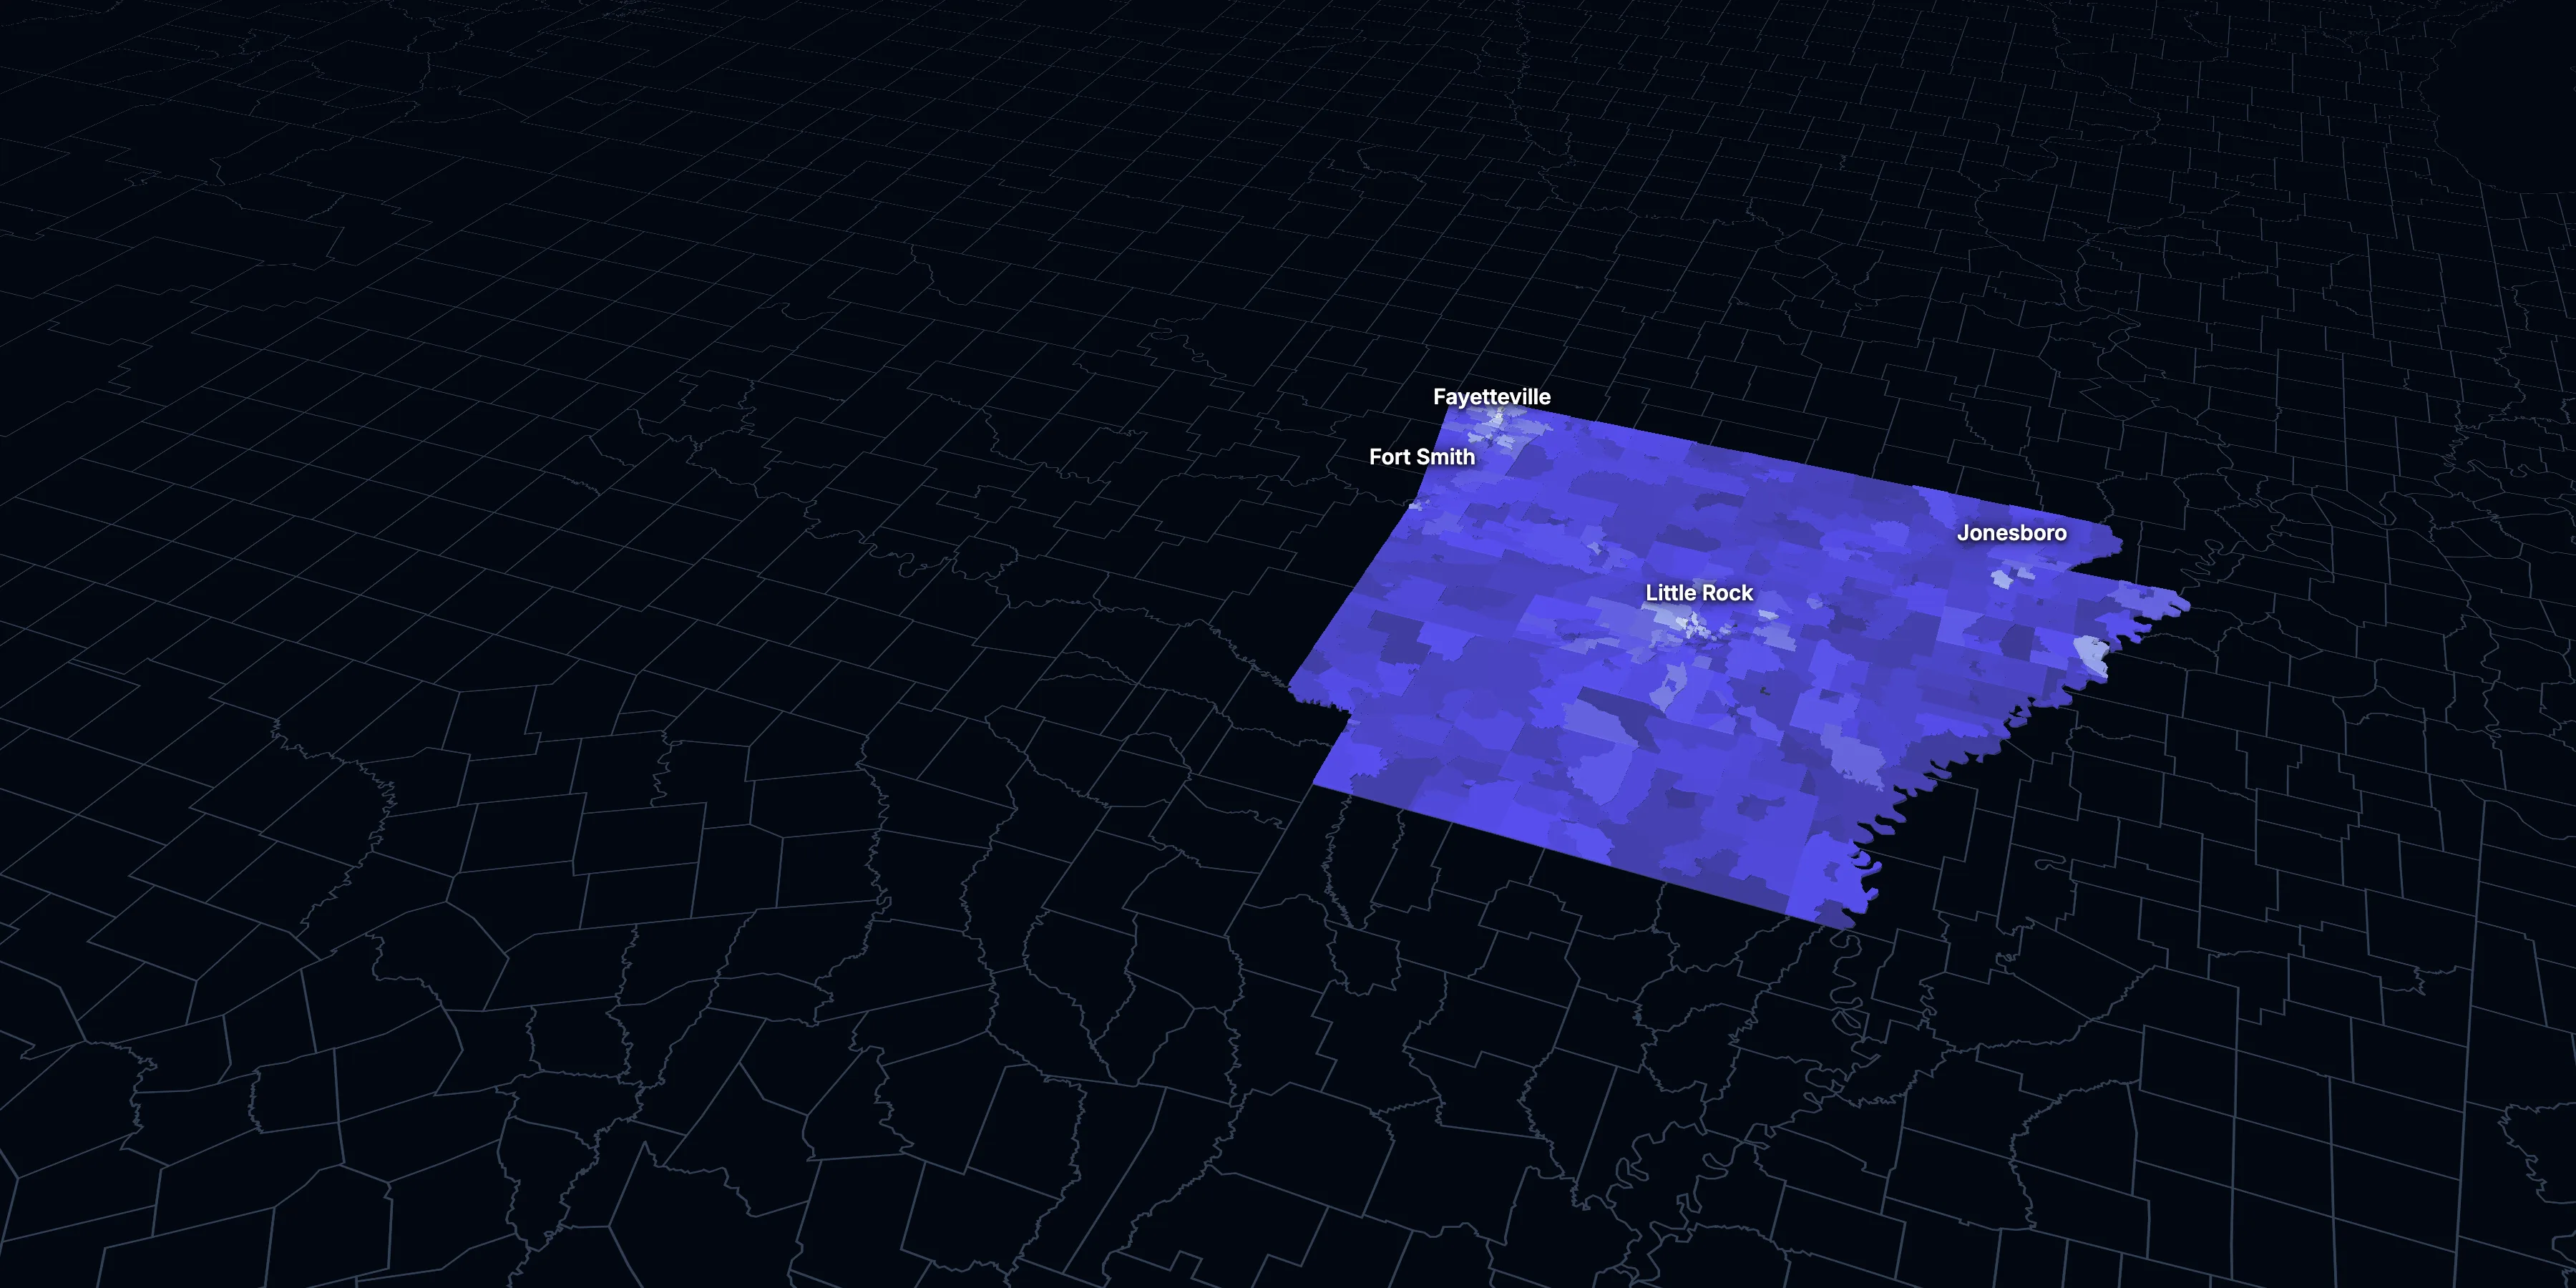
Taller, lighter tracts have higher household incomes
About Arkansas
Arkansas’s median household income is $65,588 (±$976), lower than the US ($84,780), and its median age is 39.3 (±0.2), according to the ACS 2025 1-year estimates. Its largest city is Little Rock.
± is each figure’s margin of error, at 90% confidence, and † marks one too uncertain to lean on. Under each percentage in the tables is the number it counts. How the margins are worked out.
FIPS code 05
Highlights
What stands out in Arkansas
The numbers where Arkansas sits furthest from the nation, or past a recognized policy benchmark.
Past a policy benchmark
15.0%
ElevatedLiving in poverty
That’s higher than the US (11.8%). HUD and the New Markets Tax Credit use 20% poverty to mark low-income areas. It’s the 6th highest of the 50 states and DC.
Furthest from the national picture
18.2%
2nd among statesLiving with a disability
That’s higher than the US (13.7%). It’s the 2nd highest of the 50 states and DC.
$1,055
3rd lowest among statesMedian gross rent
That’s lower than the US ($1,557). It’s the 3rd lowest of the 50 states and DC.
8.8%
Very lowSpeak a language other than English at home
That’s lower than the US (22.9%).
5.7%
Very lowBorn outside the US
That’s lower than the US (14.7%).
$65,588
Lower than the USMedian household income
That’s lower than the US ($84,780). It’s the 4th lowest of the 50 states and DC.
2015 to 2025
How Arkansas changed in ten years
The state added 136,587 people. It got older, more foreign-born and better educated, and poverty fell 4.0 points.
Population, change since 2015
+4.6% in the state and +6.3% in the US.
Source: ACS 1-year, 2015 to 2025, table A00001.
Show data
| Arkansas | United States | |
|---|---|---|
| 2015 | 0.0% | 0.0% |
| 2016 | +0.3% | +0.5% |
| 2017 | +0.9% | +1.3% |
| 2018 | +1.2% | +1.8% |
| 2019 | +1.3% | +2.1% |
| 2021 | +1.6% | +3.3% |
| 2022 | +2.3% | +3.7% |
| 2023 | +3.0% | +4.2% |
| 2024 | +3.7% | +5.8% |
| 2025 | +4.6% | +6.3% |
Embed
Median household income, in 2025 dollars
+14.0% in the state and +10.9% in the US.
Source: ACS 1-year, 2015 to 2025, table A14006.
Show data
| Arkansas | United States | |
|---|---|---|
| 2015 | $57,534 | $76,413 |
| 2016 | $59,965 | $77,931 |
| 2017 | $60,735 | $79,891 |
| 2018 | $60,832 | $80,059 |
| 2019 | $62,149 | $83,427 |
| 2021 | $62,928 | $83,521 |
| 2022 | $61,406 | $82,811 |
| 2023 | $62,450 | $82,683 |
| 2024 | $64,187 | $84,339 |
| 2025 | $65,588 | $84,780 |
Embed
Living in poverty
−4.0 points in the state and −3.0 points in the US.
Source: ACS 1-year, 2015 to 2025, table A13004.
Show data
| Arkansas | United States | |
|---|---|---|
| 2015 | 19.1% | 14.7% |
| 2016 | 17.2% | 14.0% |
| 2017 | 16.4% | 13.4% |
| 2018 | 17.2% | 13.1% |
| 2019 | 16.2% | 12.3% |
| 2021 | 16.3% | 12.8% |
| 2022 | 16.8% | 12.6% |
| 2023 | 15.7% | 12.5% |
| 2024 | 15.5% | 12.1% |
| 2025 | 15.0% | 11.8% |
Embed
Bachelor’s degree or more
+7.0 points in the state and +6.7 points in the US.
Source: ACS 1-year, 2015 to 2025, table A12001.
Show data
| Arkansas | United States | |
|---|---|---|
| 2015 | 21.8% | 30.6% |
| 2016 | 22.4% | 31.3% |
| 2017 | 23.4% | 32.0% |
| 2018 | 23.3% | 32.6% |
| 2019 | 23.3% | 33.1% |
| 2021 | 25.3% | 35.0% |
| 2022 | 25.4% | 35.7% |
| 2023 | 26.2% | 36.2% |
| 2024 | 27.1% | 36.8% |
| 2025 | 28.8% | 37.4% |
Embed
Median gross rent, in 2025 dollars
+10.8% in the state and +18.5% in the US.
Source: ACS 1-year, 2015 to 2025, table A18009.
Show data
| Arkansas | United States | |
|---|---|---|
| 2015 | $952 | $1,314 |
| 2016 | $948 | $1,327 |
| 2017 | $941 | $1,340 |
| 2018 | $945 | $1,368 |
| 2019 | $942 | $1,393 |
| 2021 | $982 | $1,427 |
| 2022 | $937 | $1,440 |
| 2023 | $993 | $1,496 |
| 2024 | $1,015 | $1,537 |
| 2025 | $1,055 | $1,557 |
Embed
Median home value, in 2025 dollars
+38.1% in the state and +39.3% in the US.
Source: ACS 1-year, 2015 to 2025, table A10036.
Show data
| Arkansas | United States | |
|---|---|---|
| 2015 | $165,361 | $266,469 |
| 2016 | $166,772 | $277,278 |
| 2017 | $170,147 | $288,124 |
| 2018 | $172,044 | $296,908 |
| 2019 | $172,918 | $305,336 |
| 2021 | $194,435 | $337,116 |
| 2022 | $199,176 | $355,481 |
| 2023 | $208,201 | $361,931 |
| 2024 | $222,826 | $372,685 |
| 2025 | $228,400 | $371,100 |
Embed
ACS 1-year estimates. The dotted stretch of each line spans 2020, when the Census Bureau released no standard 1-year estimates. Dollar values are in 2025 dollars.
| Indicator | 2015 | 2025 | Change |
|---|---|---|---|
| Population | 2,978,204 | 3,114,791 | +4.6% |
| Median age | 37.9 | 39.3 | +1.4 years |
| 65 and over | 16.1% | 19.1% | +3.0 points |
| Born outside the US | 4.8% | 5.7% | +0.9 points |
| Hispanic or Latino | 7.0% | 9.8% | +2.8 points |
| Median household income | $57,534 | $65,588 | +14.0% |
| Living in poverty | 19.1% | 15.0% | −4.0 points |
| Bachelor’s degree or more | 21.8% | 28.8% | +7.0 points |
| Households that rent | 34.8% | 32.8% | −2.0 points |
| Median gross rent | $952 | $1,055 | +10.8% |
| Median home value | $165,361 | $228,400 | +38.1% |
823 census tracts
Arkansas, tract by tract
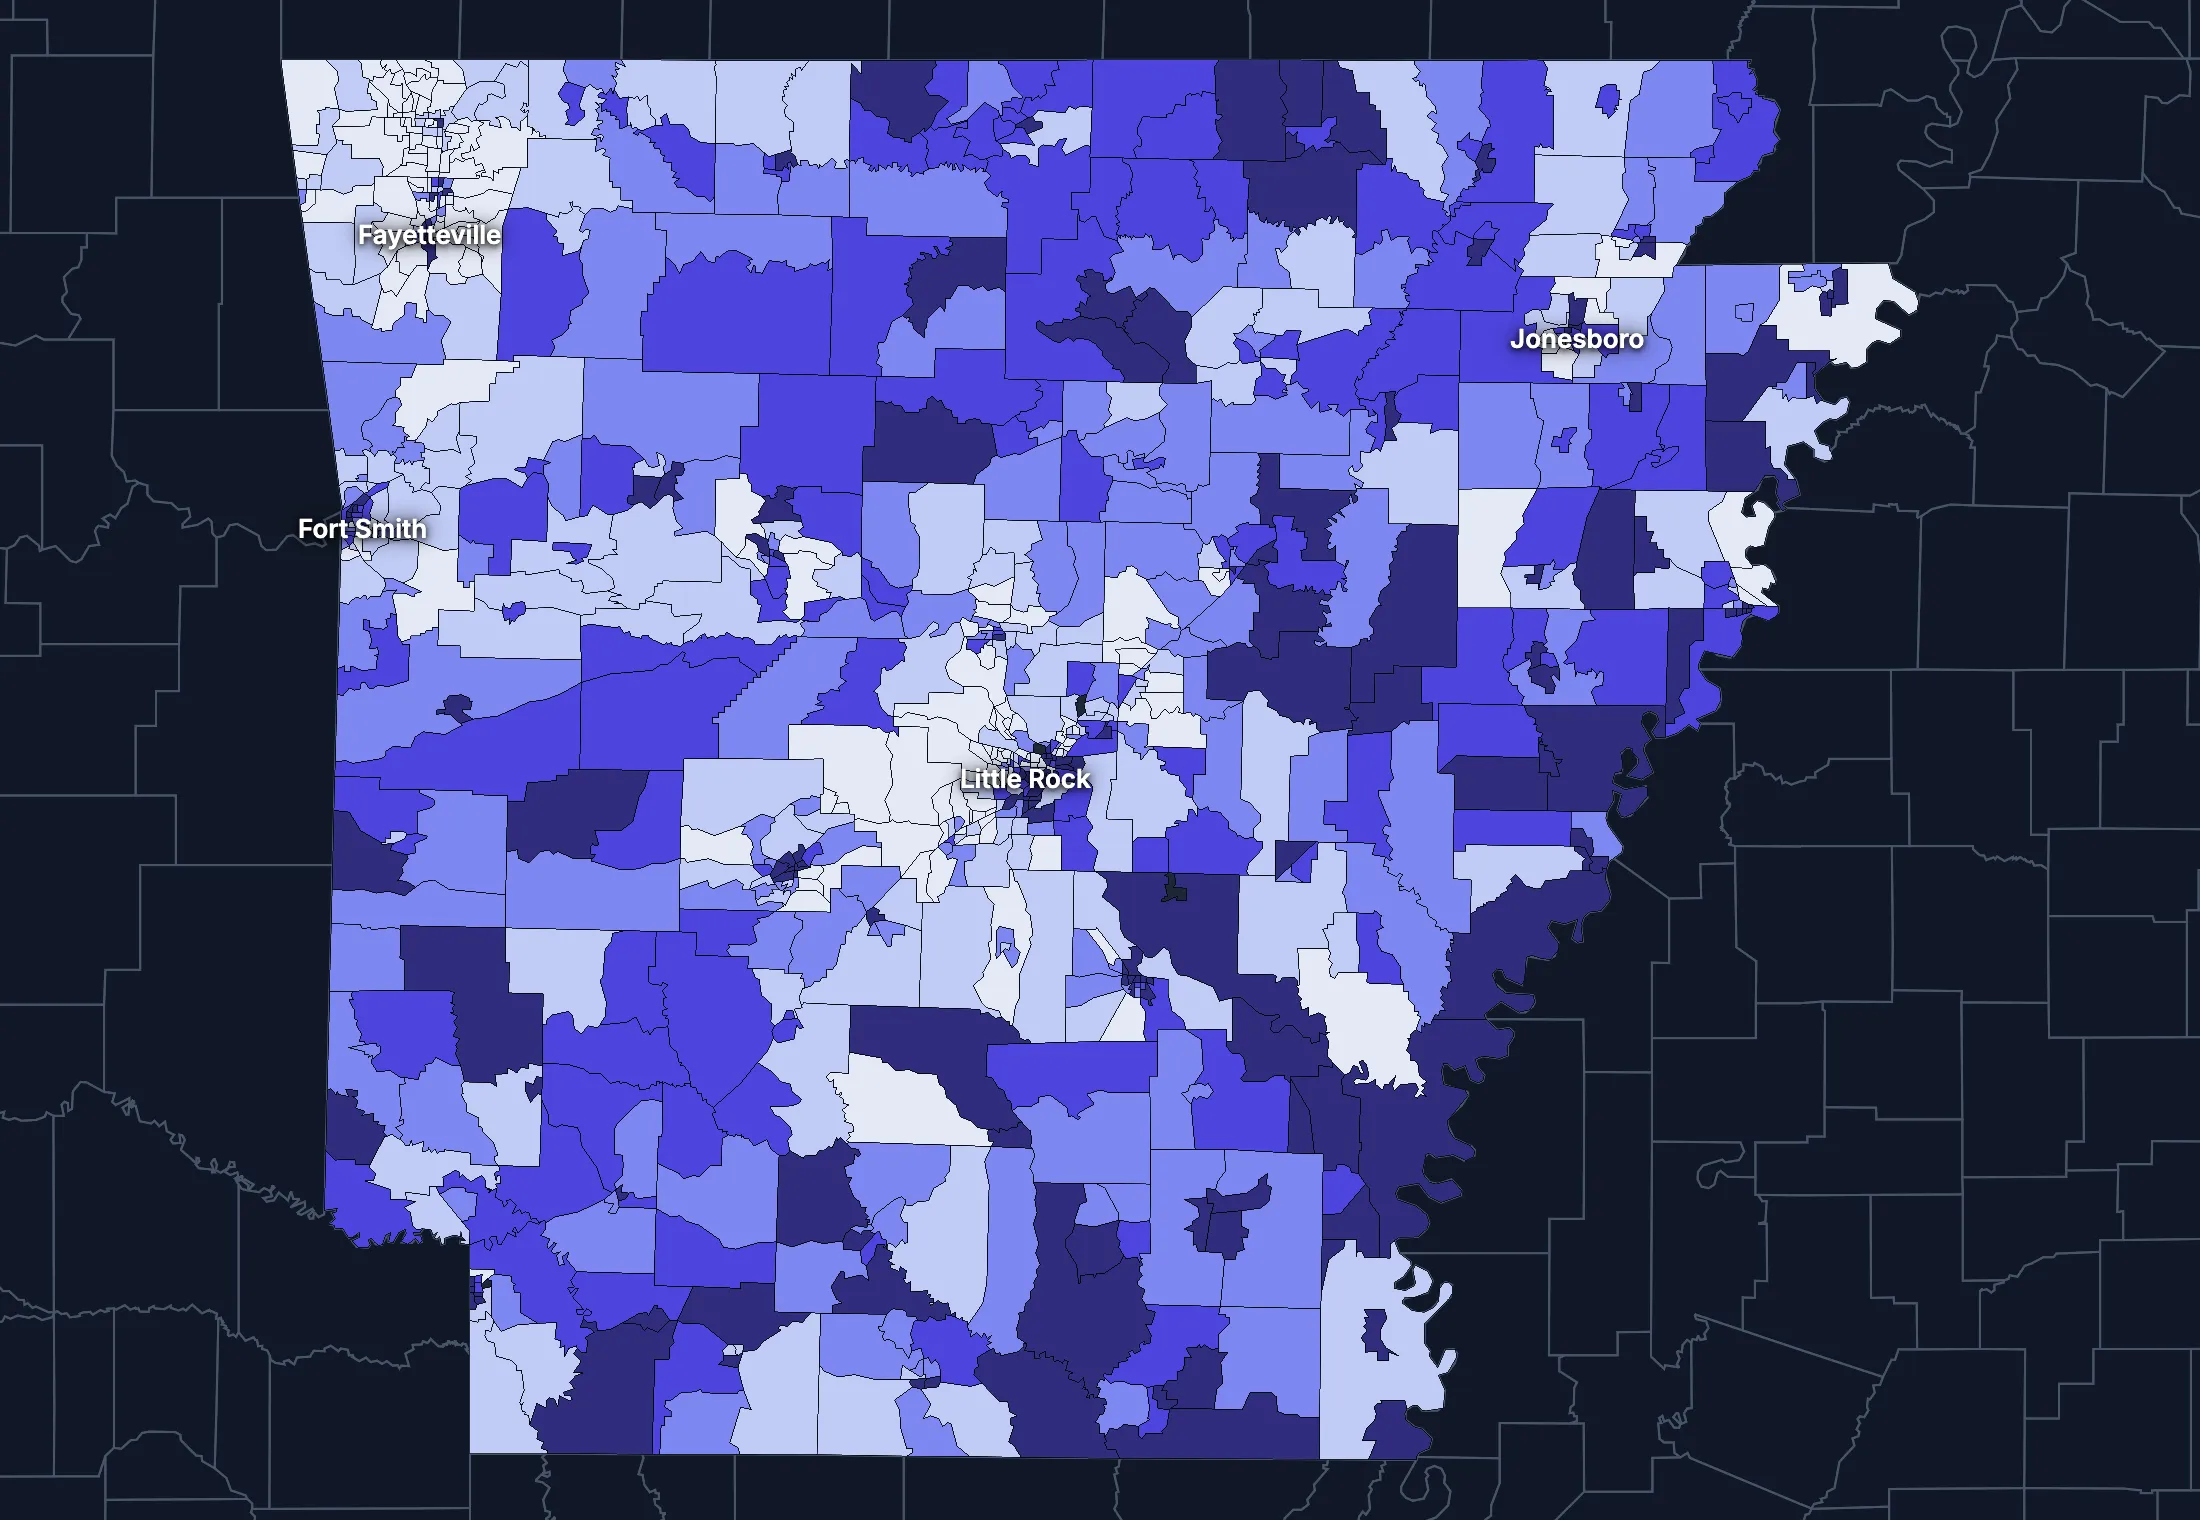
State averages hide a lot. These census tracts are the closest the census comes to neighborhoods.
Where the state’s average misleads
Each tick is one census tract, and the dark line marks the state. Hover over a tick or tap it to see the tract.
Poverty
186 of 822 tracts are at least 1.5 times the state’s overall 16.0%, and 227 are at two-thirds of it or less.
Highest: Tract 1.02, 78.2%. Lowest: Tract 9800, 0.0%.
Renters paying 30% or more of income
61 of 806 tracts are at least 1.5 times the state’s overall 39.4%, and 233 are at two-thirds of it or less.
Highest: Tract 9512.01, 100.0%. Lowest: Tract 801, 0.0%.
Adults with a bachelor’s degree
128 of 821 tracts are at least 1.5 times the state’s overall 25.7%, and 329 are at two-thirds of it or less.
Highest: Tract 49.02, 80.6%. Lowest: Tract 4805.02, 0.5%.
Median household income
107 of 819 tracts are at least 1.5 times the typical tract’s $57,031, and 108 are at two-thirds of it or less.
Highest: Tract 213.06, $195,880. Lowest: Tract 9802, $8,833.
American Community Survey 2020–2024 5-year estimates, by census tract. Income is capped at $250,000+ by the Census Bureau.
People
Who lives in Arkansas
Its median age of 39.3 is about the same as the US (39.5). 5.7% of residents were born outside the US, and 8.8% speak a language other than English at home.
Age
Source: ACS 2025 1-year, table A01001.
Show data
| Arkansas | United States | |
|---|---|---|
| Under 18 | 22.1% ±0.4% , number 687,944 ±12,690 | 21.0% ±<0.1% , number 71,689,151 ±111,800 |
| 18 to 24 | 9.5% ±0.3% , number 296,503 ±9,883 | 9.3% ±<0.1% , number 31,716,680 ±98,660 |
| 25 to 34 | 12.7% ±0.3% , number 394,393 ±7,809 | 13.6% ±<0.1% , number 46,357,354 ±55,690 |
| 35 to 44 | 12.9% ±0.3% , number 400,273 ±9,982 | 13.4% ±<0.1% , number 45,746,189 ±105,700 |
| 45 to 54 | 11.8% ±0.2% , number 368,653 ±6,895 | 11.8% ±<0.1% , number 40,257,563 ±53,540 |
| 55 to 64 | 12.0% ±0.3% , number 372,935 ±9,082 | 12.1% ±<0.1% , number 41,242,904 ±104,700 |
| 65 to 74 | 11.0% ±0.3% , number 342,792 ±8,707 | 10.8% ±<0.1% , number 36,895,650 ±91,520 |
| 75 and over | 8.1% ±0.2% , number 251,298 ±6,897 | 8.2% ±<0.1% , number 27,879,368 ±78,140 |
Embed
Race and ethnicity
Source: ACS 2025 1-year, table A04001.
Show data
| Arkansas | United States | |
|---|---|---|
| White, not Hispanic | 66.1% ±0.3% , number 2,057,625 ±7,925 | 55.0% ±<0.1% , number 187,959,031 ±58,340 |
| Hispanic or Latino | 9.8% ±0.1% , number 303,771 ±1,690 | 20.5% ±<0.1% , number 69,975,516 ±13,270 |
| Black, not Hispanic | 14.5% ±0.2% , number 451,615 ±6,976 | 11.7% ±<0.1% , number 40,096,453 ±106,200 |
| Asian, not Hispanic | 2.0% ±0.1% , number 62,068 ±3,585 | 6.5% ±<0.1% , number 22,096,709 ±58,340 |
| Other or multiracial | 7.7% ±0.4% , number 239,712 ±12,810 | 6.3% ±<0.1% , number 21,657,150 ±150,100 |
Embed
Language spoken at home
Source: ACS 2025 1-year, table C16001.
Show data
| Arkansas | United States | |
|---|---|---|
| English only | 91.2% ±0.4% , number 2,678,705 ±10,960 | 77.1% ±0.1% , number 249,390,588 ±275,300 |
| Spanish | 6.1% ±0.3% , number 179,348 ±8,611 | 13.9% ±0.1% , number 44,921,985 ±177,800 |
| Other Indo-European | 0.9% ±0.2% , number 27,244 ±4,528 | 4.0% ±<0.1% , number 12,862,980 ±113,500 |
| Asian and Pacific Island | 1.6% ±0.2% , number 45,887 ±6,105 | 3.8% ±<0.1% , number 12,288,841 ±99,740 |
| Arabic and other | 0.2% ±0.1% , number 5,885 ±2,216 | 1.3% ±<0.1% , number 4,116,949 ±71,480 |
Embed
Marital status
Source: ACS 2025 1-year, table A11001.
Show data
| Arkansas | United States | |
|---|---|---|
| Now married | 50.5% ±0.8% , number 1,289,414 ±19,960 | 47.9% ±0.1% , number 135,567,564 ±223,300 |
| Never married | 28.8% ±0.6% , number 734,897 ±14,380 | 34.8% ±0.1% , number 98,647,238 ±152,600 |
| Divorced | 12.4% ±0.4% , number 316,648 ±11,000 | 10.2% ±<0.1% , number 28,879,967 ±112,900 |
| Widowed | 6.6% ±0.3% , number 168,739 ±6,583 | 5.5% ±<0.1% , number 15,599,094 ±69,430 |
| Separated | 1.6% ±0.2% , number 41,213 ±3,953 | 1.6% ±<0.1% , number 4,441,399 ±49,160 |
Embed
Where people lived a year ago
Source: ACS 2025 1-year, table A08001.
Show data
| Arkansas | United States | |
|---|---|---|
| Same home | 87.6% ±0.5% , number 2,699,877 ±16,580 | 88.4% ±0.1% , number 298,889,697 ±214,800 |
| Same county | 6.3% ±0.5% , number 193,454 ±14,310 | 6.0% ±<0.1% , number 20,202,671 ±166,300 |
| Another county in the state | 3.5% ±0.3% , number 109,190 ±7,932 | 3.0% ±<0.1% , number 10,168,097 ±89,190 |
| Another state | 2.3% ±0.2% , number 70,037 ±6,505 | 2.1% ±<0.1% , number 7,025,589 ±81,660 |
| Another country | 0.3% ±0.1% , number 8,058 ±2,148 | 0.6% ±<0.1% , number 1,984,943 ±47,210 |
Embed
Top countries of birth, among those born abroad
Source: ACS 2020–2024 5-year, table A07001.
Show data
| Arkansas | |
|---|---|
| Mexico | 40.1% , number 66,530 |
| El Salvador | 9.6% , number 15,917 |
| India | 6.4% , number 10,651 |
| Guatemala | 4.7% , number 7,722 |
| Philippines | 3.2% , number 5,310 |
| Vietnam | 2.7% , number 4,448 |
Embed
All the numbers
| Indicator | Arkansas | US | Rank among states* | Table |
|---|---|---|---|---|
| Population | 3,114,791 | 341,784,859 | 33rd | A00001 |
| People per square mile | 60 | 97 | 36th | A00002 |
| Land area (square miles) | 51,992 | – | – | A00002 |
| Median age | 39.3 ±0.2 | 39.5 ±0.1 | 35th | A01004 |
| Under 18 | 22.1% ±0.4% , number 687,944 ±12,690 | 21.0% ±<0.1% , number 71,689,151 ±111,800 | 14th | B02002 |
| 65 and over | 19.1% ±0.4% , number 594,090 ±11,110 | 19.0% ±<0.1% , number 64,775,018 ±120,300 | 26th | B02002 |
| Born outside the US | 5.7% ±0.3% , number 177,328 ±8,525 | 14.7% ±0.1% , number 50,409,320 ±204,800 | 37th | A06001 |
| Speak a language other than English at home | 8.8% ±0.4% , number 258,364 ±11,700 | 22.9% ±0.1% , number 74,190,755 ±244,000 | 38th | C16001 |
| Veterans (adults) | 7.4% ±0.3% , number 178,260 ±7,847 | 5.9% ±<0.1% , number 15,746,228 ±85,320 | 19th | A16002 |
| Living with a disability | 18.2% ±0.4% , number 557,525 ±12,520 | 13.7% ±<0.1% , number 46,271,455 ±126,000 | 2nd | B18101 |
| Women 15–50 who had a baby in the past year | 5.8% ±0.6% , number 41,734 ±4,084 | 5.0% ±0.1% , number 4,016,759 ±44,040 | 14th | B13002 |
| Lived in the same home a year ago | 87.6% ±0.5% , number 2,699,877 ±16,580 | 88.4% ±0.1% , number 298,889,697 ±214,800 | 26th | A08001 |
| White, not Hispanic | 66.1% ±0.3% , number 2,057,625 ±7,925 | 55.0% ±<0.1% , number 187,959,031 ±58,340 | 25th | A04001 |
| Hispanic or Latino | 9.8% ±0.1% , number 303,771 ±1,690 | 20.5% ±<0.1% , number 69,975,516 ±13,270 | 29th | A04001 |
| Black, not Hispanic | 14.5% ±0.2% , number 451,615 ±6,976 | 11.7% ±<0.1% , number 40,096,453 ±106,200 | 12th | A04001 |
| Asian, not Hispanic | 2.0% ±0.1% , number 62,068 ±3,585 | 6.5% ±<0.1% , number 22,096,709 ±58,340 | 42nd | A04001 |
*1 is the highest. Population is ranked among all states, and the rest among those of 1,000 people or more, whose figures can be ranked. Ranks use 5-year estimates, the only ones covering every state, so they can differ slightly from the figures here.
Income and work
Lower incomes than the US
The median household income is $65,588, lower than the US ($84,780). 15.0% of people live in poverty, and 9.1% have no health insurance, higher than the US (8.4%).
Household income
Source: ACS 2025 1-year, table A14001.
Show data
| Arkansas | United States | |
|---|---|---|
| Under $25,000 | 18.2% ±0.7% , number 232,868 ±9,158 | 14.0% ±0.1% , number 18,727,548 ±88,990 |
| $25,000 to $49,999 | 20.4% ±0.8% , number 260,105 ±10,620 | 15.4% ±0.1% , number 20,665,585 ±101,400 |
| $50,000 to $74,999 | 17.6% ±0.7% , number 225,014 ±8,608 | 15.3% ±0.1% , number 20,513,565 ±88,500 |
| $75,000 to $99,999 | 13.2% ±0.6% , number 169,019 ±7,262 | 12.5% ±0.1% , number 16,814,245 ±87,520 |
| $100,000 to $149,999 | 15.4% ±0.7% , number 196,987 ±8,823 | 17.9% ±0.1% , number 24,018,984 ±99,670 |
| $150,000 to $199,999 | 7.0% ±0.3% , number 90,072 ±4,459 | 10.1% ±0.1% , number 13,521,827 ±70,660 |
| $200,000 or more | 8.1% ±0.4% , number 103,740 ±5,469 | 14.8% ±0.1% , number 19,801,668 ±84,120 |
Embed
What residents do for work
Source: ACS 2025 1-year, table A17004.
Show data
| Arkansas | United States | |
|---|---|---|
| Education and health care | 23.6% ±0.6% , number 338,902 ±9,706 | 24.4% ±0.1% , number 40,862,193 ±140,800 |
| Retail trade | 13.6% ±0.6% , number 194,992 ±9,340 | 10.6% ±0.1% , number 17,781,181 ±96,660 |
| Manufacturing | 12.0% ±0.6% , number 172,726 ±9,387 | 9.6% ±0.1% , number 16,064,394 ±91,270 |
| Professional and business services | 9.3% ±0.4% , number 133,584 ±6,469 | 12.8% ±0.1% , number 21,375,231 ±87,110 |
| Arts, food and lodging | 8.0% ±0.5% , number 114,530 ±7,584 | 8.9% ±0.1% , number 14,811,502 ±87,840 |
| Construction | 6.7% ±0.4% , number 95,840 ±5,944 | 6.7% ±<0.1% , number 11,254,981 ±79,620 |
| Transportation and warehousing | 6.3% ±0.4% , number 90,626 ±5,940 | 5.9% ±<0.1% , number 9,832,211 ±73,020 |
| Finance, insurance and real estate | 6.2% ±0.4% , number 88,279 ±6,328 | 6.6% ±<0.1% , number 11,025,569 ±68,570 |
Embed
Where workers come from and go
Arkansas has 1,263,416 jobs and 1,255,904 employed residents. 78,826 people commute in to work and 71,314 commute out, while 1,184,590 both live and work here. The most commuters come from Oklahoma.
Most commuters come from
- Oklahoma: 22,076
- Missouri: 17,630
- Texas: 14,047
Most residents commute to
- Texas: 19,135
- Tennessee: 14,339
- Missouri: 11,789
Show data
| Arkansas | |
|---|---|
| Live and work here | 1,184,590 |
| Work here, live elsewhere | 78,826 |
| Live here, work elsewhere | 71,314 |
Embed
All the numbers
| Indicator | Arkansas | US | Rank among states* | Table |
|---|---|---|---|---|
| Median household income | $65,588 ±$976 | $84,780 ±$215 | 48th | A14006 |
| Income per person | $37,515 ±$691 | $47,171 ±$115 | 49th | A14024 |
| Income inequality (Gini index) | 0.483 ±0.006 | 0.482 ±0.001 | 10th | A14028 |
| Living in poverty | 15.0% ±0.7% , number 454,985 ±20,480 | 11.8% ±0.1% , number 39,264,183 ±277,400 | 6th | A13004 |
| Unemployment rate | 4.3% ±0.3% , number 64,686 ±5,000 | 4.9% ±<0.1% , number 8,574,594 ±64,350 | 24th | A17005 |
| No health insurance | 9.1% ±0.4% , number 279,717 ±11,760 | 8.4% ±<0.1% , number 28,323,306 ±152,000 | 16th | A20001 |
*1 is the highest. Population is ranked among all states, and the rest among those of 1,000 people or more, whose figures can be ranked. Ranks use 5-year estimates, the only ones covering every state, so they can differ slightly from the figures here.
Education
Fewer college degrees than the US
28.8% of adults 25 and over have a bachelor’s degree or more, lower than the US (37.4%).
Highest level of education
Source: ACS 2025 1-year, table A12001.
Show data
| Arkansas | United States | |
|---|---|---|
| Less than high school | 9.3% ±0.4% , number 197,999 ±9,164 | 9.4% ±0.1% , number 22,321,002 ±120,500 |
| High school only | 32.4% ±0.6% , number 689,965 ±13,810 | 25.6% ±0.1% , number 61,096,726 ±203,400 |
| Some college | 29.5% ±0.7% , number 628,574 ±14,640 | 27.7% ±0.1% , number 65,920,977 ±173,500 |
| Bachelor’s degree | 17.5% ±0.5% , number 372,085 ±10,650 | 22.3% ±0.1% , number 53,224,312 ±196,700 |
| Graduate degree | 11.3% ±0.5% , number 241,721 ±10,060 | 15.0% ±0.1% , number 35,816,011 ±159,400 |
Embed
All the numbers
| Indicator | Arkansas | US | Rank among states* | Table |
|---|---|---|---|---|
| Bachelor’s degree or more | 28.8% ±0.7% , number 613,806 ±14,650 | 37.4% ±0.1% , number 89,040,323 ±253,200 | 49th | A12001 |
| High school graduate or more | 90.7% ±1.1% , number 1,932,345 ±24,890 | 90.6% ±0.2% , number 216,058,026 ±368,200 | 43rd | A12001 |
*1 is the highest. Population is ranked among all states, and the rest among those of 1,000 people or more, whose figures can be ranked. Ranks use 5-year estimates, the only ones covering every state, so they can differ slightly from the figures here.
Housing
Home values outran incomes
32.8% of households rent, lower than the US (34.7%). The median home is worth $228,400 and the median rent is $1,055. After inflation, home values rose 38% from 2015 to 2025, while household income rose 14%.
Housing costs and income, 2015 to 2025, after inflation
Source: ACS 1-year, table A10036, A18009, A14006.
Show data
| Arkansas | United States | |
|---|---|---|
| Median home value | +38.1% | +39.3% |
| Median rent | +10.8% | +18.5% |
| Median household income | +14.0% | +10.9% |
Embed
Types of homes
Source: ACS 2025 1-year, table A10032.
Show data
| Arkansas | United States | |
|---|---|---|
| Single-family, detached | 70.3% ±0.8% , number 1,009,247 ±11,780 | 60.9% ±0.1% , number 90,335,844 ±173,300 |
| Single-family, attached | 2.3% ±0.3% , number 33,369 ±3,907 | 6.4% ±<0.1% , number 9,527,703 ±51,230 |
| 2 to 4 units | 6.5% ±0.5% , number 93,516 ±6,520 | 7.5% ±0.1% , number 11,109,005 ±75,790 |
| 5 to 19 units | 6.6% ±0.6% , number 94,140 ±8,087 | 8.7% ±0.1% , number 12,829,882 ±97,590 |
| 20 or more units | 3.6% ±0.4% , number 51,791 ±5,813 | 11.1% ±0.1% , number 16,381,450 ±92,310 |
| Mobile homes and other | 10.7% ±0.5% , number 153,466 ±7,746 | 5.4% ±<0.1% , number 8,045,083 ±53,680 |
Embed
When homes were built
Source: ACS 2025 1-year, table A10055.
Show data
| Arkansas | United States | |
|---|---|---|
| 2010 or later | 19.8% ±0.8% , number 252,850 ±10,160 | 15.1% ±0.1% , number 20,257,912 ±101,300 |
| 2000 to 2009 | 16.1% ±0.7% , number 205,885 ±9,397 | 13.8% ±0.1% , number 18,535,840 ±92,260 |
| 1980 to 1999 | 28.5% ±0.8% , number 363,712 ±11,110 | 24.1% ±0.1% , number 32,332,570 ±118,900 |
| 1960 to 1979 | 24.3% ±0.8% , number 310,020 ±10,250 | 22.9% ±0.1% , number 30,726,302 ±110,000 |
| Before 1960 | 11.4% ±0.6% , number 145,338 ±7,610 | 24.0% ±0.1% , number 32,210,798 ±121,500 |
Embed
All the numbers
| Indicator | Arkansas | US | Rank among states* | Table |
|---|---|---|---|---|
| Housing units | 1,435,529 | – | – | A10001 |
| Households | 1,277,805 ±8,667 | – | – | A10008 |
| People per household | 2.37 ±0.02 | 2.49 ±0.01 | 22nd | A10003 |
| Households that rent | 32.8% ±0.7% , number 419,056 ±9,859 | 34.7% ±0.1% , number 46,551,688 ±193,200 | 16th | A10060 |
| Vacant homes | 11.0% ±0.6% , number 157,724 ±8,693 | 9.6% ±0.1% , number 14,165,545 ±137,100 | 10th | A10047, A10060 |
| Median gross rent | $1,055 ±$20 | $1,557 ±$4 | 49th | A18009 |
| Median home value | $228,400 ±$3,677 | $371,100 ±$646 | 49th | A10036 |
| Renters paying 30% or more of income | 39.7% ±2.4% , number 166,564 ±10,660 | 48.3% ±0.2% , number 22,486,693 ±122,100 | 48th | A18002 |
| Owners paying 30% or more of income | 19.8% ±1.0% , number 169,907 ±8,509 | 24.2% ±0.1% , number 21,201,943 ±93,050 | 48th | A10040 |
| Homes built before 1960 | 11.4% ±0.6% , number 145,338 ±7,610 | 24.0% ±0.1% , number 32,210,798 ±121,500 | 44th | A10055 |
*1 is the highest. Population is ranked among all states, and the rest among those of 1,000 people or more, whose figures can be ranked. Ranks use 5-year estimates, the only ones covering every state, so they can differ slightly from the figures here.
Getting around
A driving state with short commutes
77.1% of workers drive alone and 8.8% work from home. 30.2% of those who travel to work spend 30 minutes or more getting there, and 5.7% of households have no vehicle.
How people get to work
Source: ACS 2025 1-year, table A09005.
Show data
| Arkansas | United States | |
|---|---|---|
| Drive alone | 77.1% ±0.6% , number 1,089,390 ±13,030 | 69.8% ±0.1% , number 115,297,377 ±192,900 |
| Carpool | 10.4% ±0.7% , number 147,441 ±9,316 | 8.9% ±0.1% , number 14,712,170 ±97,240 |
| Public transit | 0.3% ±0.1% , number 4,313 ±1,449 | 4.3% ±<0.1% , number 7,100,386 ±63,330 |
| Walk | 1.7% ±0.3% , number 24,166 ±3,827 | 2.4% ±<0.1% , number 4,016,469 ±41,070 |
| Work from home | 8.8% ±0.6% , number 124,636 ±8,282 | 12.9% ±0.1% , number 21,288,393 ±105,700 |
| Other | 1.7% ±0.3% , number 23,345 ±3,580 | 1.7% ±<0.1% , number 2,799,658 ±41,510 |
Embed
Time spent getting to work
Source: ACS 2025 1-year, table B09001.
Show data
| Arkansas | United States | |
|---|---|---|
| Under 10 minutes | 17.6% ±0.8% , number 227,091 ±9,935 | 12.0% ±0.1% , number 17,199,225 ±93,440 |
| 10 to 19 minutes | 32.2% ±1.0% , number 415,248 ±13,650 | 27.8% ±0.1% , number 40,059,540 ±137,700 |
| 20 to 29 minutes | 19.9% ±0.7% , number 257,082 ±9,770 | 21.0% ±0.1% , number 30,221,743 ±111,100 |
| 30 to 39 minutes | 14.9% ±0.6% , number 192,534 ±7,818 | 17.1% ±0.1% , number 24,659,138 ±103,800 |
| 40 to 59 minutes | 9.4% ±0.5% , number 121,405 ±6,728 | 12.6% ±0.1% , number 18,104,709 ±97,070 |
| 60 minutes or more | 5.8% ±0.4% , number 75,295 ±4,726 | 9.5% ±0.1% , number 13,681,705 ±84,440 |
Embed
Vehicles per household
Source: ACS 2025 1-year, table A10030.
Show data
| Arkansas | United States | |
|---|---|---|
| None | 5.7% ±0.4% , number 72,415 ±5,661 | 8.8% ±0.1% , number 11,781,997 ±77,240 |
| One | 32.6% ±0.8% , number 416,736 ±11,210 | 33.1% ±0.1% , number 44,424,682 ±160,700 |
| Two | 37.1% ±0.9% , number 473,610 ±12,390 | 36.0% ±0.1% , number 48,200,889 ±176,800 |
| Three or more | 24.7% ±0.9% , number 315,044 ±11,250 | 22.1% ±0.1% , number 29,655,854 ±113,300 |
Embed
All the numbers
| Indicator | Arkansas | US | Rank among states* | Table |
|---|---|---|---|---|
| Drive to work alone | 77.1% ±0.6% , number 1,089,390 ±13,030 | 69.8% ±0.1% , number 115,297,377 ±192,900 | 3rd | A09005 |
| Take public transit | 0.3% ±0.1% , number 4,313 ±1,449 | 4.3% ±<0.1% , number 7,100,386 ±63,330 | 50th | A09005 |
| Work from home | 8.8% ±0.6% , number 124,636 ±8,282 | 12.9% ±0.1% , number 21,288,393 ±105,700 | 48th | A09005 |
| Commute 30 minutes or more | 30.2% ±0.8% , number 389,234 ±11,350 | 39.2% ±0.1% , number 56,445,552 ±165,300 | 39th | B09001 |
| Households with no vehicle | 5.7% ±0.4% , number 72,415 ±5,695 | 8.8% ±<0.1% , number 11,781,997 ±64,240 | 33rd | A10030 |
*1 is the highest. Population is ranked among all states, and the rest among those of 1,000 people or more, whose figures can be ranked. Ranks use 5-year estimates, the only ones covering every state, so they can differ slightly from the figures here.
Places
The largest cities in Arkansas
Population, from the latest estimates available. Figures cover the whole of each place.
Largest cities
- Little Rock: 206,424
- Fayetteville: 106,621
- Fort Smith: 90,860
- Springdale: 89,378
- Jonesboro: 83,296
- Rogers: 76,949
- Conway: 72,325
- North Little Rock: 65,130
Every county and place in Arkansas
Find any county, city, town, metro area, ZIP code, school district or district in Arkansas.
Counties
Each of the 75 counties with its population, from ACS 2020–2024 5-year estimates.
- Arkansas County16,515
- Ashley County18,429
- Baxter County42,407
- Benton County303,632
- Boone County38,138
- Bradley County10,208
- Calhoun County4,704
- Carroll County28,626
- Chicot County9,765
- Clark County21,125
- Clay County14,280
- Cleburne County25,226
- Cleveland County7,453
- Columbia County22,349
- Conway County21,054
- Craighead County113,249
- Crawford County61,139
- Crittenden County47,266
- Cross County16,543
- Dallas County6,242
- Desha County10,786
- Drew County17,046
- Faulkner County127,717
- Franklin County17,326
- Fulton County12,302
- Garland County100,035
- Grant County18,242
- Greene County46,432
- Hempstead County19,508
- Hot Spring County33,180
- Howard County12,583
- Independence County38,175
- Izard County14,009
- Jackson County16,712
- Jefferson County64,802
- Johnson County26,003
- Lafayette County6,136
- Lawrence County16,238
- Lee County8,359
- Lincoln County12,950
- Little River County11,821
- Logan County21,277
- Lonoke County75,272
- Madison County17,329
- Marion County17,228
- Miller County42,360
- Mississippi County39,126
- Monroe County6,589
- Montgomery County8,553
- Nevada County8,159
- Newton County7,112
- Ouachita County22,085
- Perry County10,101
- Phillips County15,450
- Pike County10,115
- Poinsett County22,543
- Polk County19,361
- Pope County64,131
- Prairie County8,064
- Pulaski County399,818
- Randolph County18,838
- Saline County127,479
- Scott County9,816
- Searcy County7,859
- Sebastian County128,900
- Sevier County15,712
- Sharp County17,773
- St. Francis County22,400
- Stone County12,568
- Union County37,900
- Van Buren County15,998
- Washington County256,765
- White County77,838
- Woodruff County6,026
- Yell County20,134
Cities, towns and other places
Each of the 614 with its population, from ACS 2020–2024 5-year estimates. Census-designated places are communities without a local government of their own, drawn by the Census Bureau so they can be counted.
- Acorn203
- Adona62
- Alexander3,587
- Alicia138
- Alix20
- Alleene96
- Allport102
- Alma5,906
- Almyra146
- Alpena510
- Altheimer517
- Altus827
- Amagon31
- Amity740
- Anthonyville62
- Antoine159
- Aplin287
- Appleton292
- Arkadelphia10,099
- Arkansas City456
- Armorel345
- Ash Flat1,217
- Ashdown4,164
- Atkins2,877
- Aubrey139
- Augusta1,859
- Austin3,915
- Avilla1,833
- Avoca799
- Bald Knob2,518
- Banks126
- Barling5,007
- Bassett118
- Batavia307
- Batesville11,445
- Bauxite846
- Bay2,333
- Bearden826
- Beaver121
- Bee Branch196
- Beebe8,707
- Beedeville44
- Bella Vista31,697
- Bellefonte428
- Belleville517
- Ben Lomond330
- Benton36,595
- Bentonville58,249
- Bergman542
- Berryville5,707
- Bethesda79
- Big Flat71
- Bigelow393
- Biggers428
- Birdsong35
- Bismarck41
- Black Oak179
- Black Rock853
- Black Springs101
- Blevins167
- Blue Eye33
- Blue Mountain139
- Bluff City222
- Blytheville12,790
- Board Camp69
- Bodcaw177
- Boles153
- Bonanza711
- Bono2,657
- Booneville3,798
- Bowman30
- Bradford522
- Bradley528
- Branch317
- Briarcliff257
- Brinkley2,596
- Brookland4,377
- Bryant21,504
- Buckner284
- Bull Shoals1,678
- Burdette233
- Cabot26,960
- Caddo Gap27
- Caddo Valley775
- Caldwell441
- Cale86
- Calico Rock1,771
- Calion355
- Camden10,307
- Cammack Village797
- Campbell Station311
- Caraway1,087
- Carlisle2,227
- Carthage185
- Casa206
- Cash278
- Caulksville195
- Cave City2,090
- Cave Springs6,008
- Cedarville1,760
- Center Point96
- Center Ridge211
- Centerton21,920
- Centerville211
- Central City627
- Charleston2,646
- Cherokee City369
- Cherokee Village5,046
- Cherry Valley543
- Chester76
- Chidester305
- Cincinnati278
- Clarendon1,820
- Clarkedale468
- Clarksville9,526
- Clinton2,509
- Coal Hill892
- College Station258
- Collins60
- Colt510
- Concord130
- Conway67,642
- Corinth38
- Corning3,134
- Cotter1,063
- Cotton Plant444
- Cove462
- Coy60
- Crawfordsville424
- Crossett4,639
- Crystal Springs85
- Cushman488
- Daisy138
- Damascus348
- Danville2,289
- Dardanelle4,511
- Datto67
- De Queen6,058
- De Valls Bluff553
- Decatur1,567
- Deer113
- Delaplaine85
- Delight312
- Dell176
- Dennard315
- Denning245
- Dermott2,330
- Des Arc1,591
- Desha679
- DeWitt2,933
- Diamond City672
- Diaz1,337
- Dierks728
- Donaldson377
- Dora74
- Dover1,795
- Drasco314
- Dumas3,768
- Dyer1,049
- Dyess289
- Earle1,520
- East Camden1,026
- East End6,912
- Edgemont24
- Edmondson308
- Egypt57
- El Dorado17,115
- El Paso470
- Elaine487
- Elkins3,808
- Elm Springs3,069
- Emerson239
- Emmet435
- England2,294
- Enola432
- Etowah316
- Eudora1,868
- Eureka Springs2,433
- Evansville75
- Evening Shade534
- Everton79
- Fair Oaks23
- Fairfield Bay2,515
- Fargo30
- Farmington9,094
- Fayetteville99,319
- Felsenthal40
- Fifty-Six205
- Fisher167
- Flippin1,334
- Floral194
- Floyd881
- Fordyce3,268
- Foreman1,044
- Forrest City12,646
- Fort Smith89,805
- Fouke859
- Fountain Hill81
- Fountain Lake548
- Fourche20
- Fox381
- Franklin283
- Fredonia (Biscoe)135
- Friendship168
- Fulton189
- Gamaliel15
- Garfield508
- Garland188
- Garner175
- Gassville1,850
- Gateway292
- Genoa1,113
- Gentry4,240
- Georgetown40
- Gibson4,167
- Gilbert16
- Gillett378
- Gillham147
- Gilmore293
- Glenwood1,841
- Goodwin56
- Goshen2,298
- Gosnell2,778
- Gould661
- Grady168
- Grannis691
- Gravette3,714
- Green Forest3,112
- Greenbrier6,018
- Greenland1,274
- Greenway261
- Greenwood9,616
- Greers Ferry778
- Griffithville249
- Grubbs431
- Guion61
- Gum Springs55
- Gurdon1,625
- Guy720
- Hackett1,118
- Hagarville89
- Halley10
- Hamburg2,886
- Hampton1,037
- Hardy890
- Harrell323
- Harrisburg2,216
- Harrison13,350
- Hartford496
- Hartman678
- Haskell4,100
- Hatfield544
- Hattieville41
- Havana343
- Haynes75
- Hazen1,874
- Heber Springs7,161
- Hector334
- Helena-West Helena8,935
- Henderson415
- Hensley26
- Hermitage327
- Hickory Ridge259
- Higden182
- Higginson1,055
- Highfill2,191
- Highland1,354
- Hindsville146
- Holiday Island2,480
- Holland623
- Holly Grove495
- Hope8,671
- Horatio1,196
- Horseshoe Bend2,555
- Horseshoe Lake414
- Hot Springs37,920
- Hot Springs Village16,327
- Houston299
- Hoxie2,618
- Hughes886
- Humnoke122
- Humphrey220
- Hunter100
- Huntington468
- Huntsville3,202
- Huttig401
- Imboden621
- Ivan50
- Jacksonport115
- Jacksonville29,221
- Jasper453
- Jennette86
- Jericho119
- Jerome50
- Jerusalem57
- Johnson3,656
- Joiner454
- Jones Mills230
- Jonesboro80,137
- Judsonia2,052
- Junction City564
- Keiser774
- Kensett1,937
- Keo322
- Kibler1,085
- Kingsland406
- Kingston19
- Kirby579
- Knobel158
- Knoxville663
- Lacey746
- Lafe478
- LaGrange53
- Lake City2,531
- Lake Hamilton2,127
- Lake View357
- Lake Village2,144
- Lakeview851
- Lamar1,783
- Landmark3,948
- Lavaca2,489
- Lawson86
- Leachville1,852
- Lead Hill320
- Leola414
- Lepanto2,025
- Leslie444
- Letona213
- Lewisville903
- Lexa138
- Lincoln2,794
- Little Flock3,056
- Little Rock203,436
- Lockesburg873
- London1,217
- Lonoke4,267
- Lonsdale211
- Lost Bridge Village303
- Louann119
- Lowell10,849
- Luxora741
- Lynn299
- Madison476
- Magazine986
- Magness238
- Magnet Cove889
- Magnolia10,894
- Malvern10,953
- Mammoth Spring1,226
- Manila3,691
- Mansfield1,204
- Marianna3,417
- Marie50
- Marion13,623
- Marked Tree2,249
- Marmaduke1,240
- Marshall1,196
- Marvell1,160
- Maumelle19,373
- Mayflower2,861
- Maynard303
- Maysville110
- McAlmont1,088
- McCaskill46
- McCrory1,850
- McDougal116
- McGehee3,666
- McNab73
- McNeil419
- McRae623
- Melbourne2,263
- Mena5,582
- Menifee409
- Midland262
- Midway CDP1,279
- Midway town728
- Mineral Springs1,358
- Minturn91
- Mitchellville320
- Monette1,251
- Monroe11
- Monticello8,257
- Montrose170
- Moorefield120
- Moro264
- Morrilton7,080
- Morrison Bluff91
- Morrow182
- Mount Holly18
- Mount Ida1,376
- Mount Judea61
- Mount Pleasant345
- Mount Vernon182
- Mountain Home13,108
- Mountain Pine555
- Mountain View2,913
- Mountainburg566
- Mulberry1,646
- Murfreesboro1,819
- Nashville4,063
- Natural Steps683
- New Blaine533
- New Edinburg182
- Newark1,637
- Newhope88
- Newport8,024
- Nimmons22
- Norfork690
- Norman339
- Norphlet1,003
- North Crossett2,556
- North Little Rock64,538
- O'Kean196
- Oak Grove CDP91
- Oak Grove Heights1,164
- Oak Grove town285
- Oakhaven34
- Oakland146
- Oark18
- Oden347
- Ogden140
- Oil Trough259
- Okolona287
- Ola914
- Omaha174
- Oppelo1,118
- Osceola6,688
- Oxford820
- Ozan43
- Ozark3,551
- Ozark Acres670
- Ozone194
- Palestine800
- Pangburn515
- Paragould30,215
- Paris3,284
- Parkdale67
- Parkin694
- Patmos38
- Patterson364
- Payneway133
- Pea Ridge8,108
- Peach Orchard86
- Pearcy363
- Pencil Bluff51
- Perla141
- Perry356
- Perrytown251
- Perryville1,390
- Piggott3,555
- Pindall198
- Pine Bluff39,743
- Pineville306
- Piney4,458
- Plainview550
- Pleasant Grove186
- Pleasant Plains376
- Plumerville1,128
- Pocahontas7,538
- Pollard143
- Ponca73
- Poplar Grove255
- Portia453
- Portland444
- Pottsville3,229
- Powhatan173
- Poyen441
- Prairie Creek2,493
- Prairie Grove7,798
- Prattsville428
- Prescott3,032
- Princeton3
- Pyatt135
- Quitman805
- Ratcliff97
- Ravenden390
- Ravenden Springs164
- Reader43
- Rector1,750
- Redfield1,734
- Reed156
- Reyno310
- Rison1,019
- Rivervale32
- Rockport800
- Rockwell3,986
- Roe129
- Rogers72,981
- Roland1,147
- Rondo111
- Rose Bud656
- Rosston391
- Rover142
- Rudy178
- Russell218
- Russellville29,162
- Rye223
- Salado507
- Salem CDP2,642
- Salem city1,620
- Salesville515
- Saratoga18
- Sardis890
- Scott46
- Scranton220
- Searcy23,340
- Sedgwick165
- Shannon Hills4,641
- Sheridan5,165
- Sherrill41
- Sherwood33,070
- Shirley269
- Sidney175
- Siloam Springs18,699
- Smackover2,419
- Smithville88
- South Lead Hill69
- Southside4,246
- Sparkman430
- Springdale88,160
- Springfield438
- Springtown109
- St. Charles250
- St. Francis177
- St. Joe136
- St. Paul136
- Stamps1,404
- Star City2,405
- Staves155
- Stephens1,099
- Strawberry285
- Strong434
- Stuttgart7,903
- Subiaco405
- Success92
- Sulphur Rock1,014
- Sulphur Springs CDP564
- Sulphur Springs city499
- Summers267
- Summit706
- Sunset153
- Sweet Home939
- Swifton1,101
- Taylor593
- Texarkana29,177
- Thornton292
- Tillar119
- Tinsman18
- Tollette204
- Tontitown6,425
- Traskwood552
- Trumann7,410
- Tucker73
- Tuckerman1,442
- Tull596
- Tumbling Shoals689
- Tupelo86
- Turrell496
- Twin Groves258
- Tyronza627
- Ulm174
- Uniontown168
- Urbana147
- Valley Springs121
- Van Buren23,763
- Vandervoort202
- Vanndale356
- Vilonia4,498
- Viola384
- Wabbaseka360
- Walcott315
- Waldenburg63
- Waldo1,144
- Waldron3,344
- Walnut Ridge5,434
- Ward6,573
- Warm Springs87
- Warren5,353
- Washington93
- Watson214
- Wayton187
- Weiner680
- Weldon136
- Wesley233
- West Crossett1,413
- West Fork3,095
- West Memphis23,929
- West Point93
- Western Grove438
- Wheatley374
- Whelen Springs52
- White Hall5,512
- Wickes694
- Widener238
- Wiederkehr Village18
- Wilburn173
- Williford71
- Willisville246
- Wilmar523
- Wilmot408
- Wilson1,023
- Wilton305
- Winchester122
- Winslow291
- Winthrop93
- Witts Springs77
- Woodlawn197
- Woodson619
- Wooster1,023
- Wrightsville1,484
- Wynne8,120
- Yarborough Landing380
- Yellville1,223
- Zinc45
Metro and micro areas
Each of the 21 that reach into Arkansas, with its whole population, from ACS 2020–2024 5-year estimates. Metro and micro areas are counties tied together by commuting, drawn by the Office of Management and Budget.
- Arkadelphia, AR Micro Area21,125
- Batesville, AR Micro Area38,175
- Blytheville, AR Micro Area39,126
- Camden, AR Micro Area26,789
- El Dorado, AR Micro Area37,900
- Fayetteville-Springdale-Rogers, AR Metro Area577,726
- Forrest City, AR Micro Area22,400
- Fort Smith, AR-OK Metro Area229,899
- Harrison, AR Micro Area45,250
- Hot Springs, AR Metro Area100,035
- Jonesboro, AR Metro Area135,792
- Little Rock-North Little Rock-Conway, AR Metro Area758,629
- Magnolia, AR Micro Area22,349
- Malvern, AR Micro Area33,180
- Memphis, TN-MS-AR Metro Area1.34M
- Mountain Home, AR Micro Area42,407
- Paragould, AR Micro Area46,432
- Pine Bluff, AR Micro Area72,255
- Russellville, AR Micro Area84,265
- Searcy, AR Micro Area77,838
- Texarkana, TX-AR Metro Area146,296
ZIP codes
Each of the 600 with people in it, by the town it's centered in, from ACS 2020–2024 5-year estimates. These are the Census Bureau's ZIP Code Tabulation Areas, which follow the Postal Service's ZIP codes as closely as census blocks allow.
- 71601Pine Bluff13,367
- 71602White Hall14,990
- 71603Sulphur Springs CDP29,578
- 71630Arkansas City456
- 71631Banks313
- 71635West Crossett10,295
- 71638Dermott2,874
- 71639Mitchellville5,077
- 71640Eudora2,265
- 71642Fountain Hill759
- 71643Gould5,129
- 71644Grady462
- 71646Hamburg6,563
- 71647Hermitage1,574
- 7165141
- 71652Kingsland993
- 71653Lake Village4,813
- 71654McGehee4,216
- 71655Monticello14,022
- 71658Montrose387
- 71659Grady12
- 71660New Edinburg836
- 71661Parkdale110
- 71662Winchester100
- 71663Portland571
- 71665Rison4,964
- 7166610
- 71667Star City7,059
- 71670Tillar983
- 71671Warren8,601
- 71674Watson631
- 71675Wilmar1,785
- 71676Wilmot529
- 71677Winchester122
- 71678Star City33
- 71701Camden16,847
- 71720Bearden2,523
- 71722Bluff City61
- 71724Calion147
- 71725Carthage264
- 71726Chidester1,108
- 71728Gum Springs32
- 71730El Dorado29,760
- 71740Emerson2,100
- 71742Fordyce4,333
- 71743Gurdon2,913
- 71744Hampton2,963
- 71745Harrell147
- 71747Huttig655
- 71748Ivan44
- 71749Junction City2,787
- 71751Louann573
- 71752McNeil649
- 71753Magnolia15,474
- 71758Mount Holly150
- 71759Norphlet243
- 71762Smackover2,929
- 71763Sparkman1,607
- 71764Stephens1,688
- 71765Strong1,742
- 71766Thornton690
- 71770Waldo3,307
- 71772Whelen Springs18
- 71801Hope14,883
- 71820Alleene149
- 71822Ashdown7,675
- 71823Ben Lomond144
- 71825Blevins391
- 71826Bradley962
- 71827Buckner822
- 71831Saratoga101
- 71832De Queen10,147
- 71833Dierks1,862
- 718341,807
- 71835Emmet1,156
- 71836Foreman3,166
- 71837Fouke4,424
- 71838McNab1,006
- 71839Garland409
- 71841Gillham589
- 71842Horatio1,955
- 71845Lewisville1,663
- 71846Lockesburg2,944
- 71847McCaskill210
- 71851Mineral Springs2,196
- 71852Nashville9,340
- 71853Ogden231
- 71854Genoa35,720
- 71855Ozan352
- 71857Prescott5,818
- 71858Rosston1,495
- 71859Saratoga146
- 71860Stamps1,847
- 71861Taylor2,093
- 71862Washington639
- 71864Willisville90
- 71865Wilton210
- 71866Winthrop390
- 71901Hot Springs28,937
- 71909Hot Springs Village18,449
- 71913Hot Springs47,477
- 71921Amity3,427
- 71922Antoine159
- 71923Arkadelphia14,875
- 71929Bismarck4,627
- 71933Pearcy1,057
- 71935Black Springs866
- 71937Vandervoort2,098
- 71940Delight1,125
- 71941Midway town2,203
- 71942Friendship123
- 71943Glenwood3,731
- 71944Grannis1,119
- 71945Hatfield1,469
- 71949Mountain Pine1,160
- 71950Daisy1,007
- 71952Newhope43
- 71953Acorn13,415
- 71956Mountain Pine1,407
- 71957Mount Ida3,105
- 71958Murfreesboro2,494
- 71959Newhope628
- 71960Norman1,144
- 71961Oden1,120
- 71962Antoine744
- 71964Pearcy4,572
- 71965Pencil Bluff298
- 71968Crystal Springs4,437
- 71969Pencil Bluff223
- 71970526
- 71971719
- 71972Vandervoort416
- 71973Wickes994
- 71998Arkadelphia669
- 71999Arkadelphia450
- 72001Adona391
- 72002Salem CDP21,495
- 72003Almyra623
- 72004Wabbaseka661
- 72005Amagon66
- 72006Augusta2,004
- 72007Austin10,579
- 72010Bald Knob5,204
- 72011Sardis4,648
- 72012Beebe13,502
- 72013Bee Branch1,573
- 72014Beedeville38
- 72015Tull28,712
- 72016Bigelow2,727
- 72017Fredonia203
- 72019Avilla30,055
- 72020Bradford3,100
- 72021Brinkley3,491
- 72022Bryant18,808
- 72023Cabot37,452
- 72024Carlisle3,998
- 72025Casa834
- 72026Roe201
- 72027Center Ridge1,437
- 72028Clinton14
- 72029Clarendon1,918
- 72030Center Ridge650
- 72031Clinton6,607
- 72032Conway34,469
- 72034Conway50,285
- 72035Conway2,151
- 72036Cotton Plant598
- 72038St. Charles76
- 72039Damascus1,983
- 72040Des Arc2,421
- 72041De Valls Bluff1,175
- 72042DeWitt4,993
- 72044Edgemont1,071
- 72045El Paso1,110
- 72046England3,876
- 72047Enola894
- 7204859
- 72051Fox659
- 72052Garner119
- 72053College Station21
- 72055Gillett472
- 72057Staves1,231
- 72058Greenbrier18,880
- 72060Griffithville539
- 72061Guy207
- 72063Hattieville1,673
- 72064Hazen2,781
- 72065East End5,457
- 72066259
- 72067Greers Ferry2,870
- 72068Garner838
- 72069Holly Grove815
- 72070Houston2,295
- 72072Humnoke260
- 72073Humphrey826
- 72074Hunter100
- 72075Jacksonport10
- 72076Jacksonville38,437
- 72079Redfield385
- 72080Jerusalem558
- 72081Bald Knob7,436
- 72082Kensett1,956
- 72083Keo310
- 72084Leola1,047
- 72085Letona210
- 72086Lonoke11,718
- 72087Lonsdale1,732
- 72088Fairfield Bay2,542
- 72099Jacksonville629
- 72101McCrory3,019
- 72102McRae2,620
- 72103Shannon Hills15,736
- 72104Malvern23,624
- 72106Roland6,213
- 72107Menifee92
- 72110Morrilton11,293
- 72111Mount Vernon1,283
- 72112Newport11,161
- 72113Maumelle25,596
- 72114North Little Rock10,093
- 72116North Little Rock22,464
- 72117North Little Rock13,438
- 72118Cammack Village22,913
- 72120Gibson34,365
- 72121Pangburn3,631
- 721221,471
- 72123Patterson364
- 72125Perry837
- 72126Aplin3,241
- 72127Plumerville2,565
- 72128Poyen918
- 72129Prattsville1,506
- 72130Drasco302
- 72131Quitman4,605
- 72132Redfield3,640
- 72134Roe355
- 72135Roland3,239
- 72136Floyd3,209
- 72137Rose Bud2,267
- 72139Russell218
- 72140St. Charles321
- 72141660
- 72142Scott2,557
- 72143Searcy35,000
- 72150Sheridan12,337
- 72152Sherrill320
- 72153Shirley4,191
- 72156Hattieville811
- 72157Springfield1,483
- 72160Stuttgart9,071
- 72165Oil Trough40
- 72166264
- 72167Traskwood1,261
- 72168Tucker1,803
- 72169Tupelo93
- 72170Ulm174
- 72173Vilonia9,990
- 72175Wabbaseka396
- 72176Ward8,678
- 72178West Point44
- 72179Wilburn399
- 72180Woodson89
- 72181Wooster37
- 72182Redfield23
- 72183Wrightsville904
- 72199North Little Rock18
- 72201Little Rock795
- 72202Little Rock9,704
- 72204Little Rock30,525
- 72205Little Rock23,043
- 72206Wrightsville22,667
- 72207Little Rock10,631
- 72209Little Rock31,607
- 72210Avilla15,621
- 72211Little Rock22,335
- 72212Little Rock13,698
- 72223Little Rock26,986
- 72227Little Rock11,284
- 72301West Memphis23,959
- 72311Aubrey80
- 72315Blytheville19,890
- 723201,604
- 72322Caldwell56
- 72324Cherry Valley2,051
- 72325Turrell19
- 72326Colt1,929
- 72327Crawfordsville1,297
- 7232873
- 72330Dyess464
- 72331Earle2,316
- 72332Edmondson135
- 72333Elaine311
- 72335Madison16,372
- 72338Joiner8
- 72339Gilmore252
- 72340Goodwin43
- 72341Haynes156
- 72342Helena-West Helena4,070
- 72346Jennette513
- 72347Hickory Ridge719
- 72348Hughes2,135
- 72350Joiner988
- 72351Keiser828
- 72352LaGrange13
- 72353Elaine47
- 72354Lepanto2,403
- 72355Lake View1,780
- 72358Luxora1,338
- 72359Madison154
- 72360Marianna5,048
- 72364Marion16,034
- 72365Marked Tree2,618
- 72366Marvell1,893
- 72368Moro1,212
- 72370Keiser7,301
- 72372Palestine1,604
- 72373Parkin832
- 72374Poplar Grove562
- 72376Edmondson1,463
- 72377Rivervale32
- 7237934
- 72383Marvell45
- 72384Turrell695
- 72386Tyronza1,304
- 72389Elaine287
- 72390Helena-West Helena6,577
- 72391Etowah44
- 72392Wheatley422
- 72394Widener451
- 72395Wilson1,058
- 72396Wynne12,766
- 72401Bowman42,602
- 72404Jonesboro29,968
- 72405Brookland18,675
- 72410Alicia400
- 72411Bay2,997
- 72412Walcott351
- 72413Biggers540
- 72414Black Oak227
- 72415Powhatan1,376
- 72416Bono5,642
- 72417Brookland5,940
- 72419Caraway1,394
- 72421Cash618
- 72422Corning4,324
- 72424Datto67
- 72425Delaplaine445
- 72426Dell168
- 72427Egypt46
- 72428Etowah115
- 72429Fisher247
- 72430Greenway684
- 72431Grubbs431
- 72432Harrisburg6,283
- 72433Minturn2,723
- 72434Imboden1,880
- 72435Knobel224
- 72436Lafe885
- 72437Lake City3,134
- 72438Leachville2,274
- 72440Lynn269
- 72441McDougal51
- 72442Manila4,584
- 72443Marmaduke2,649
- 72444Maynard1,600
- 72445Minturn91
- 72447Monette1,835
- 72449O'Kean193
- 72450Paragould40,807
- 72453Peach Orchard175
- 72454Piggott4,833
- 72455Pocahontas13,442
- 72456Pollard433
- 72457Portia143
- 72458Powhatan567
- 72459Ravenden1,348
- 72460Ravenden Springs1,016
- 72461Rector3,643
- 72462Datto298
- 72464St. Francis10
- 72466Smithville1,461
- 72467Jonesboro948
- 72469Strawberry1,050
- 72470Success278
- 72471Swifton1,383
- 72472Payneway8,708
- 72473Tuckerman1,852
- 72476Walnut Ridge7,334
- 72478Warm Springs323
- 72479Weiner1,152
- 72482Williford1,226
- 72501Batesville26,218
- 72512Horseshoe Bend2,506
- 72513Ash Flat2,888
- 72517Oxford86
- 72519Calico Rock2,945
- 72520Salem city307
- 72521Cave City4,910
- 72522Sulphur Rock191
- 72523Concord961
- 72524Strawberry163
- 72526Cushman158
- 72527Desha636
- 72528Pineville292
- 72529Cherokee Village5,059
- 72530Drasco1,755
- 72531Henderson870
- 72532Evening Shade1,618
- 72533Fifty-Six334
- 72534Floral1,368
- 72536Franklin460
- 72537Gamaliel535
- 72538Viola672
- 72539Salem city123
- 72540Guion99
- 72542Hardy4,072
- 72543Heber Springs12,350
- 72544Henderson952
- 72550Concord643
- 72553Magness112
- 72554Mammoth Spring2,817
- 72555Pleasant Grove256
- 72556Melbourne3,765
- 72560Mountain View7,634
- 72561Mount Pleasant972
- 72562Newark2,913
- 72564Oil Trough455
- 72565Oxford1,357
- 72566Pineville656
- 72567Pleasant Grove222
- 72568Pleasant Plains2,110
- 72569Smithville279
- 72571Salado427
- 72572Strawberry360
- 72573Melbourne389
- 72576Salem city4,181
- 72577Sidney815
- 72578Salem city117
- 72579Sulphur Rock1,407
- 72581Tumbling Shoals735
- 72583Viola1,272
- 72584Franklin322
- 72585Pineville187
- 72601Harrison31,370
- 72611Alpena1,534
- 72615Bergman41
- 72616Berryville10,907
- 72617Big Flat444
- 72619Bull Shoals1,675
- 72623Gamaliel565
- 72624Ponca272
- 72626Cotter1,294
- 72628Deer737
- 72629Dennard223
- 72630Diamond City117
- 72631Holiday Island4,361
- 72632Eureka Springs5,169
- 72633Everton1,512
- 72634Flippin4,977
- 72635Gassville3,426
- 72636Gilbert16
- 72638Green Forest6,912
- 72639Big Flat775
- 72640Mount Judea607
- 72641Jasper1,784
- 72642Lakeview1,664
- 72644Lead Hill2,369
- 72645Leslie1,306
- 72648Jasper580
- 72650Marshall4,741
- 72651Midway CDP1,304
- 72653Mountain Home29,564
- 72655Mount Judea420
- 72658Norfork1,804
- 72660Blue Eye424
- 72661Oakland777
- 72662Omaha2,967
- 72663Fifty-Six594
- 72666Wayton354
- 72668Diamond City763
- 72669Pindall186
- 72670Ponca153
- 72672Pyatt227
- 72675St. Joe1,047
- 72677Summit896
- 72679Witts Springs97
- 72680Fox1,109
- 72682Yellville226
- 72683Mount Judea334
- 72685Western Grove1,398
- 7268683
- 72687Summit6,238
- 72701Elkins49,835
- 72703Goshen35,896
- 72704Tontitown32,497
- 72712Bentonville38,690
- 72713Highfill28,999
- 72714Bella Vista14,350
- 72715Bella Vista17,288
- 72717Morrow1,068
- 72718Cave Springs5,806
- 72719Centerton19,701
- 72721St. Paul851
- 72722Decatur2,876
- 72727Wesley6,703
- 72729Evansville154
- 72730Farmington11,570
- 72732Garfield5,392
- 72734Springtown8,694
- 72736Gravette7,886
- 72738Hindsville2,688
- 72739Gravette463
- 72740Huntsville10,179
- 72742Kingston400
- 72744Lincoln5,520
- 72745Lowell15,447
- 72747Maysville135
- 72749Morrow296
- 72751Pea Ridge9,997
- 72752Oark409
- 72753Prairie Grove10,744
- 72756Prairie Creek41,791
- 72758Rogers48,233
- 72760St. Paul300
- 72761Siloam Springs24,745
- 72762Tontitown46,092
- 72764Springdale58,719
- 72768Sulphur Springs city1,026
- 72769Cincinnati907
- 72773Wesley1,381
- 72774West Fork7,082
- 72776St. Paul520
- 72801Russellville19,019
- 72802Russellville23,283
- 72821Alix1,972
- 72823Atkins6,023
- 72824Belleville2,473
- 72826Blue Mountain10
- 7282778
- 72828Rover123
- 72830Clarksville15,757
- 72832Coal Hill649
- 72833Corinth3,620
- 72834Centerville9,482
- 72835New Blaine727
- 72837Hector8,499
- 72838203
- 72839328
- 72840Hartman2,448
- 72841316
- 72842Havana1,112
- 72843Hector1,984
- 72845Knoxville1,063
- 72846Hagarville3,853
- 72847London3,040
- 72851New Blaine829
- 72852Oark189
- 72853Ola2,002
- 72854Ozone791
- 72855Subiaco6,167
- 72856446
- 72857Rover1,190
- 72858Pottsville3,030
- 72860Rover269
- 72863Morrison Bluff1,856
- 72865Scranton1,040
- 72901Fort Smith19,819
- 72903Fort Smith27,242
- 72904Fort Smith21,296
- 72908Fort Smith14,288
- 72916Fort Smith11,711
- 72921Alma12,888
- 72923Fort Smith4,956
- 72926Boles587
- 72927Booneville7,944
- 72928Branch522
- 72930Dyer207
- 72932Cedarville1,696
- 72933Charleston5,087
- 72934Chester1,147
- 72935Dyer521
- 72936Greenwood14,070
- 72937Midland4,075
- 72938Hartford933
- 72940Huntington1,829
- 72941Lavaca5,140
- 72943Magazine2,708
- 72944Mansfield2,599
- 72945Midland475
- 72946Mountainburg3,844
- 72947Mulberry4,493
- 72948Evansville334
- 72949Ozark9,477
- 72950Boles517
- 72951Ratcliff729
- 72952Cedarville2,101
- 72955Uniontown719
- 72956Van Buren34,546
- 72958Waldron6,948
- 72959Winslow2,972
Towns and townships
Each of the 117 with people in it, from ACS 2020–2024 5-year estimates: the county subdivisions that are governments of their own. A city, borough or village that is one too is listed with the places above.
- Arbana township643
- Arden township147
- Bayliss township667
- Bayou township340
- Big Flat township422
- Black Fork township14
- Blansett township113
- Blue Mountain township4,086
- Bowie township2,650
- Bryan township470
- Buckhorn township1,199
- Buford township1,037
- Burke township313
- Burnett township303
- Caney township122
- Carlton township4,704
- Cauthron township295
- Cedar township88
- Center township479
- Clark township4,358
- Clay township291
- Cleveland township797
- Coal township45
- Convenience township1,392
- Denton township332
- Dover township5,974
- Eagle township73
- Farris township591
- Flag township13
- Franklin township (Little River County)986
- Franklin township (Stone County)438
- Freeman township96
- Galla township4,667
- Greenwood township199
- Griffin township495
- Grover township2,272
- Gum Log township1,390
- Harris township698
- Hickman township4,315
- Hon township133
- Hunt township34
- Illinois township31,190
- Independence township1,417
- Jackson township (Little River County)1,528
- Jackson township (Pope County)732
- James township72
- Jeff Davis township517
- Jefferson township4,614
- Johnson township319
- Jones township (Scott County)117
- Jones township (Stone County)94
- Keener township70
- La Fave township212
- Lafayette township154
- Lamb township461
- Lewis township1,125
- Liberty township (Pope County)1,210
- Liberty township (Stone County)371
- Lick Creek township550
- Little River township206
- Locust Grove township153
- Logan township1,820
- Lone Rock township133
- Marcella township253
- Marion township315
- Martin township1,748
- Matney township241
- Mill Creek township427
- Mill township2,420
- Moreland township959
- Moro township16
- Mount Pleasant township750
- Mountain Home township20,838
- Mountain township309
- North Fork township1,712
- Northwest township278
- Optimus township224
- Ouachita township178
- Palestine township246
- Parks township359
- Pennington township8,114
- Phoenix township221
- Red River township (Little River County)643
- Red River township (Stone County)214
- Red Stripe township244
- Richwoods township395
- River township40
- Roasting Ear township191
- Smart township172
- Smyrna township70
- Sumpter township12
- Sylamore township751
- Timbo township293
- Tomlinson township391
- Township 15,343
- Township 24,557
- Township 34,710
- Township 45,299
- Township 53,906
- Township 64,673
- Township 74,775
- Township 84,667
- Township 95,284
- Township 103,088
- Township 114,328
- Township 125,153
- Township 135,356
- Turkey Creek township932
- Union township (Baxter County)2,020
- Union township (Stone County)747
- Valley township3,853
- Wallace township816
- Washington township (Bradley County)923
- Washington township (Stone County)143
- Whiteville township4,608
- Wilson township (Pope County)4,327
- Wilson township (Stone County)174
School districts
Each of the 234 with people in it, from ACS 2020–2024 5-year estimates.
- Alma School District14,340
- Alpena School District2,890
- Arkadelphia School District15,445
- Armorel School District1,621
- Ashdown School District8,607
- Atkins Public Schools6,775
- Augusta School District2,589
- Bald Knob School District5,756
- Barton-Lexa School District2,284
- Batesville School District20,315
- Bauxite School District7,572
- Bay School District2,853
- Bearden School District3,498
- Beebe School District18,686
- Benton School District32,262
- Bentonville Public Schools122,052
- Bergman School District4,766
- Berryville Public Schools11,565
- Bismarck Public Schools6,239
- Blevins School District3,488
- Blytheville School District14,066
- Booneville School District6,775
- Bradford School District2,330
- Brinkley School District3,448
- Brookland School District15,015
- Bryant Public Schools60,201
- Buffalo Island Central School District4,375
- Cabot Public Schools55,515
- Caddo Hills School District3,346
- Calico Rock School District3,627
- Camden Fairview School District16,366
- Carlisle School District3,765
- Cave City School District8,097
- Cedar Ridge School District5,291
- Cedarville School District5,136
- Centerpoint School District4,462
- Charleston School District5,085
- Clarendon School District3,254
- Clarksville School District14,977
- Cleveland County School District4,477
- Clinton School District7,848
- Concord Public Schools3,741
- Conway Public Schools79,595
- Corning Public Schools6,135
- Cossatot River School District5,436
- Cotter School District3,910
- County Line School District3,237
- Cross County School District3,393
- Crossett School District10,241
- Cutter-Morning Star School District3,819
- Danville School District3,742
- Dardanelle Public Schools9,706
- De Queen School District12,078
- Decatur School District2,864
- Deer/Mount Judea School District2,267
- Dermott School District2,943
- Des Arc Public Schools3,383
- DeWitt School District7,826
- Dierks School District2,280
- Dover School District8,499
- Drew Central School District6,837
- Dumas School District10,592
- Earle School District2,295
- East End School District4,186
- East Poinsett County School District3,425
- El Dorado School District23,061
- Elkins School District5,838
- Emerson-Taylor-Bradley School District5,357
- England School District3,574
- Eureka Springs School District9,401
- Farmington School District14,820
- Fayetteville School District104,528
- Flippin School District7,467
- Fordyce School District4,172
- Foreman School District2,650
- Forrest City School District18,851
- Fort Smith Public Schools91,610
- Fouke School District5,856
- Fountain Lake School District15,511
- Genoa Central School District4,261
- Gentry Public Schools8,797
- Glen Rose School District5,193
- Gosnell School District4,679
- Gravette School District16,673
- Green Forest School District6,857
- Greenbrier School District17,659
- Greene County Technical School District19,227
- Greenland Public Schools6,863
- Greenwood School District21,673
- Gurdon School District3,834
- Guy-Perkins Schools2,588
- Hackett Public Schools5,916
- Hamburg School District8,051
- Hampton School District3,564
- Harmony Grove School District (Clark, Dallas, and Ouachita Counties)4,543
- Harmony Grove School District (Saline County)5,731
- Harrisburg School District6,927
- Harrison School District21,554
- Hazen School District4,589
- Heber Springs School District11,795
- Hector School District2,981
- Helena-West Helena School District10,157
- Hermitage School District2,022
- Highland School District13,049
- Hillcrest School District3,975
- Hope School District13,348
- Horatio School District3,889
- Hot Springs School District30,830
- Hoxie School District3,517
- Huntsville School District16,056
- Izard Cty Consolidated Schools4,875
- Jackson County School District4,423
- Jacksonville North Pulaski School District39,219
- Jasper School District4,950
- Jessieville School District7,334
- Jonesboro Public Schools38,325
- Junction City School District3,258
- Kirby School District2,770
- Lafayette County School District4,555
- Lake Hamilton School District27,498
- Lakeside School District (Ashley and Chicot Counties)7,268
- Lakeside School District (Garland County)18,356
- Lamar School District6,650
- Lavaca Public Schools4,991
- Lawrence County School District8,000
- Lead Hill School District2,693
- Lee County School District8,359
- Lincoln School District7,201
- Little Rock School District180,881
- Lonoke School District10,628
- Magazine Schools2,591
- Magnet Cove School District2,654
- Magnolia School District19,027
- Malvern Special School District18,460
- Mammoth Spring Schools2,905
- Manila School District5,092
- Mansfield School District5,348
- Marion School District21,062
- Marked Tree School District2,803
- Marmaduke School District3,676
- Marvell School District3,062
- Mayflower School District7,074
- Maynard School District2,987
- McCrory School District3,287
- McGehee School District5,946
- Melbourne School District5,528
- Mena Public Schools12,133
- Midland School District4,854
- Mineral Springs School District3,050
- Monticello School District9,683
- Mount Ida School District3,629
- Mount Vernon-Enola School District3,141
- Mountain Home School District33,771
- Mountain Pine School District3,546
- Mountain View School District12,590
- Mountainburg Schools5,298
- Mulberry School District3,857
- Nashville School District8,543
- Nemo Vista School District2,682
- Nettleton School District28,454
- Nevada School District2,714
- Newport School District10,928
- Norfork Schools4,314
- North Little Rock School District53,929
- Omaha School District2,731
- Osceola School District6,707
- Ouachita River School District4,188
- Ouachita School District2,059
- Ozark Mountain School District4,520
- Ozark School District10,795
- Palestine-Wheatley School District2,084
- Pangburn School District3,826
- Paragould School District24,164
- Paris School District6,692
- Parkers Chapel School District3,126
- Pea Ridge School District10,839
- Perryville School District4,696
- Piggott School District4,969
- Pine Bluff School District34,844
- Pocahontas School District12,652
- Pottsville Public Schools5,841
- Poyen School District1,486
- Prairie Grove School District13,363
- Prescott School District4,845
- Pulaski County Special School District131,665
- Quitman School District4,799
- Rector School District3,974
- Rivercrest School District4,818
- Riverside School District4,021
- Riverview School District8,158
- Rogers Public Schools102,662
- Rose Bud School District4,801
- Russellville Schools39,992
- Salem School District4,725
- Scranton School District2,478
- Searcy County School District6,670
- Searcy School District32,998
- Sheridan School District26,558
- Shirley School District5,073
- Siloam Springs Schools25,260
- Sloan-Hendrix School District4,181
- Smackover-Norphlet School District6,245
- South Conway County School District15,270
- South Pike County School District4,560
- South Side-Bee Branch School District2,974
- Southside School District5,692
- Spring Hill School District1,775
- Springdale School District113,018
- Star City School District7,721
- Strong School District2,741
- Stuttgart School District8,876
- Texarkana School District31,807
- Trumann Schools9,227
- Two Rivers School District6,185
- Valley Springs School District4,745
- Valley View School District13,537
- Van Buren School District33,928
- Vilonia School District15,993
- Viola School District3,273
- Waldron School District8,176
- Warren School District8,186
- Watson Chapel School District15,763
- West Fork School District5,619
- West Memphis School District25,417
- West Side School District4,993
- Western Yell County School District2,571
- Westside Consolidated School District8,758
- Westside School District3,835
- White County Central School District3,747
- White Hall School District14,008
- Wonderview School District2,978
- Woodlawn School District2,617
- Wynne Public Schools13,175
- Yellville-Summit School District6,886
Congressional districts
As drawn for the 119th Congress (2025–2027).
- Congressional District 1752,719
- Congressional District 2761,775
- Congressional District 3786,435
- Congressional District 4748,462
State senate districts
The upper chamber’s districts, as drawn in 2024.
- State Senate District 181,414
- State Senate District 282,755
- State Senate District 382,996
- State Senate District 484,714
- State Senate District 584,662
- State Senate District 687,590
- State Senate District 787,197
- State Senate District 882,320
- State Senate District 983,161
- State Senate District 1085,524
- State Senate District 1189,696
- State Senate District 1286,173
- State Senate District 1388,127
- State Senate District 1488,563
- State Senate District 1588,730
- State Senate District 1691,784
- State Senate District 1794,369
- State Senate District 1888,496
- State Senate District 1984,866
- State Senate District 2089,364
- State Senate District 2186,983
- State Senate District 2285,699
- State Senate District 2387,555
- State Senate District 2487,855
- State Senate District 2589,180
- State Senate District 2687,630
- State Senate District 2785,053
- State Senate District 2885,399
- State Senate District 2987,055
- State Senate District 3088,295
- State Senate District 3188,150
- State Senate District 3287,768
- State Senate District 3390,099
- State Senate District 3491,676
- State Senate District 3588,493
State house districts
The lower chamber’s districts, as drawn in 2024.
- State House District 130,773
- State House District 231,901
- State House District 331,627
- State House District 430,072
- State House District 531,225
- State House District 630,223
- State House District 731,247
- State House District 831,919
- State House District 931,001
- State House District 1032,310
- State House District 1130,136
- State House District 1230,798
- State House District 1332,437
- State House District 1436,923
- State House District 1529,536
- State House District 1631,547
- State House District 1731,382
- State House District 1831,857
- State House District 1931,070
- State House District 2032,067
- State House District 2130,889
- State House District 2231,181
- State House District 2330,817
- State House District 2429,167
- State House District 2530,221
- State House District 2631,704
- State House District 2731,436
- State House District 2829,494
- State House District 2930,283
- State House District 3032,088
- State House District 3131,638
- State House District 3231,243
- State House District 3329,542
- State House District 3429,139
- State House District 3529,824
- State House District 3631,785
- State House District 3730,291
- State House District 3831,614
- State House District 3930,452
- State House District 4031,680
- State House District 4131,623
- State House District 4230,172
- State House District 4330,621
- State House District 4428,320
- State House District 4531,706
- State House District 4629,761
- State House District 4729,987
- State House District 4830,265
- State House District 4928,181
- State House District 5029,849
- State House District 5133,210
- State House District 5229,791
- State House District 5329,797
- State House District 5428,898
- State House District 5533,000
- State House District 5631,603
- State House District 5730,021
- State House District 5832,475
- State House District 5929,968
- State House District 6032,418
- State House District 6129,506
- State House District 6227,745
- State House District 6329,323
- State House District 6428,658
- State House District 6529,712
- State House District 6627,572
- State House District 6733,911
- State House District 6831,381
- State House District 6930,480
- State House District 7030,121
- State House District 7128,615
- State House District 7229,538
- State House District 7331,758
- State House District 7430,330
- State House District 7529,290
- State House District 7627,427
- State House District 7731,599
- State House District 7829,708
- State House District 7932,072
- State House District 8029,612
- State House District 8132,613
- State House District 8230,014
- State House District 8332,156
- State House District 8429,048
- State House District 8528,857
- State House District 8630,558
- State House District 8728,493
- State House District 8829,715
- State House District 8928,381
- State House District 9030,425
- State House District 9131,052
- State House District 9230,229
- State House District 9328,527
- State House District 9429,649
- State House District 9528,194
- State House District 9629,201
- State House District 9729,025
- State House District 9829,865
- State House District 9928,847
- State House District 10029,979
PUMAs
Public Use Microdata Areas: areas of 100,000 people or more that the state draws from census tracts, for the Census Bureau’s microdata.
- Baxter, Boone & Carroll Counties PUMA158,699
- Benton County (Central)–Bentonville & Rogers Cities PUMA119,820
- Benton County (Outer) PUMA183,812
- Craighead & Poinsett Counties PUMA135,792
- East Arkansas PUMA149,144
- Faulkner & Lonoke Counties PUMA202,989
- Independence, Cleburne & Van Buren Counties PUMA118,278
- Northeast Arkansas PUMA113,561
- Pope, Johnson & Conway Counties PUMA131,322
- Pulaski County (Central)–Little Rock City PUMA198,678
- Pulaski County (Outer)–North Little Rock, Sherwood & Jacksonville Cities PUMA201,140
- Saline, Grant & Perry Counties PUMA155,822
- Sebastian, Crawford & Franklin Counties PUMA207,365
- Southeast Arkansas PUMA167,954
- Southwest Arkansas PUMA127,083
- Washington County (Central)–Fayetteville City PUMA112,388
- Washington County (Outer)–Springdale City PUMA144,377
- West Arkansas PUMA132,930
- West Central Arkansas PUMA173,008
- White, Lonoke & Woodruff Counties PUMA115,229
Urban areas
Each that reaches into Arkansas, with its whole population. Urban areas are the densely settled land the Census Bureau draws after each census, whatever the city lines.
- Arkadelphia, AR9,876
- Batesville, AR11,613
- Beebe, AR6,973
- Berryville, AR5,114
- Blytheville, AR15,442
- Camden, AR9,627
- Clarksville, AR8,060
- Conway, AR69,581
- Crossett, AR6,916
- De Queen, AR5,869
- Dumas, AR4,088
- El Dorado, AR17,964
- Fayetteville–Springdale–Rogers, AR–MO391,814
- Forrest City, AR8,506
- Fort Smith, AR–OK127,240
- Greenwood, AR9,209
- Harrison, AR14,247
- Heber Springs, AR7,097
- Helena-West Helena, AR7,634
- Hope, AR8,639
- Hot Springs Village, AR13,778
- Hot Springs, AR58,193
- Jonesboro, AR75,020
- Little Rock, AR464,108
- Magnolia, AR10,103
- Malvern, AR8,955
- Memphis, TN–MS–AR1.05M
- Mena, AR5,513
- Monticello, AR8,377
- Morrilton, AR6,700
- Mountain Home, AR17,479
- Newport, AR5,676
- Osceola, AR5,508
- Paragould, AR25,949
- Pea Ridge, AR7,333
- Pine Bluff, AR45,456
- Pocahontas, AR7,004
- Prairie Grove, AR6,013
- Russellville, AR32,766
- Searcy, AR28,159
- Sheridan, AR4,827
- Siloam Springs, AR–OK19,776
- Stuttgart, AR7,887
- Texarkana, TX–AR78,248
- Trumann, AR7,126
- Walnut Ridge, AR6,850
- Warren, AR5,204
- Wynne, AR7,555
Turn Arkansas into your planning report.
Social Explorer Studio builds an editable profile of any place, with tables and charts beside the county and state, and exports to Word, PDF and Excel.
Questions about Arkansas
What is the population of Arkansas?
3,114,791 people, according to the ACS 2025 1-year estimates, which the Census Bureau adjusts to match its own population estimate. That’s the 33rd largest of the 50 states and DC.
What is the FIPS code for Arkansas?
05. Every county’s and place’s FIPS code in Arkansas starts with it. The Census Bureau’s full geographic identifier (GEOID) is 0400000US05.
What is the largest city in Arkansas?
Little Rock, with 206,424 people. Other large cities here include Fayetteville, Fort Smith and Springdale.
What is the median household income in Arkansas?
$65,588 (±$976), according to the ACS 2025 1-year estimates, lower than the US ($84,780).
What is the median age in Arkansas?
39.3 years (±0.2), according to the ACS 2025 1-year estimates, about the same as the US (39.5).
How much does housing cost in Arkansas?
Arkansas’s median home value is $228,400 (±$3,677) and its median gross rent is $1,055 (±$20) a month, according to the ACS 2025 1-year estimates. 39.7% (±2.4%) of its renters pay 30% or more of their income on rent.
Is Arkansas growing?
Arkansas’s population grew 4.6%, from 2,978,204 in 2015 to 3,114,791 in 2025, according to the ACS 1-year estimates.
Where do people who work in Arkansas live?
1,184,590 of its 1,263,416 jobs are held by people who live here. Of those who commute in, the most come from Oklahoma, Missouri, Texas.
Where does this census data come from?
The U.S. Census Bureau’s American Community Survey, through Social Explorer’s tables: the latest 1-year estimates where they exist, for the most recent numbers, and 5-year estimates otherwise. Each table lists its code, so you can find it again.
Is this data free to use?
Yes. You can read it, cite it, download the CSV and embed the charts, with no account. To map other variables, compare your own areas or build a report, see Social Explorer’s plans in a live demo.
Sources and how to cite
American Community Survey 2025 1-year estimates, or 2020–2024 5-year estimates where noted, U.S. Census Bureau, from Social Explorer’s tables A00001, A00002, A01004, A04001, A06001, A08001, A09005, A10001, A10003, A10008, A10030, A10036, A10040, A10047, A10055, A10060, A12001, A13004, A14006, A14024, A14028, A16002, A17005, A18002, A18009, A20001, B02002, B09001, B13002, B18101, C16001. Maps by census tract use 2020–2024 5-year estimates, since the 1-year survey doesn’t cover tracts. Commuting: LEHD LODES 2023. These are estimates from a sample, each with its margin of error. Data retrieved November 14, 2026. How these profiles are made.
U.S. Census Bureau, American Community Survey 2025 1-year estimates, or 2020–2024 5-year estimates where noted, via Social Explorer. “Arkansas.” https://www.socialexplorer.com/places/arkansas. Accessed November 14, 2026.