

Data Navigator Premium
AI tools for research data analysis: One question away.
Data Navigator is Social Explorer’s AI research assistant. Ask a question in plain language, and it works the problem like an analyst: it finds the right tables in Social Explorer’s data, pulls the numbers for the places you name, runs the math in code and answers with a map, chart or table, sources attached. It comes with Premium and Platinum.
What it gives back
Ask for a map, a chart, a table or an analysis.
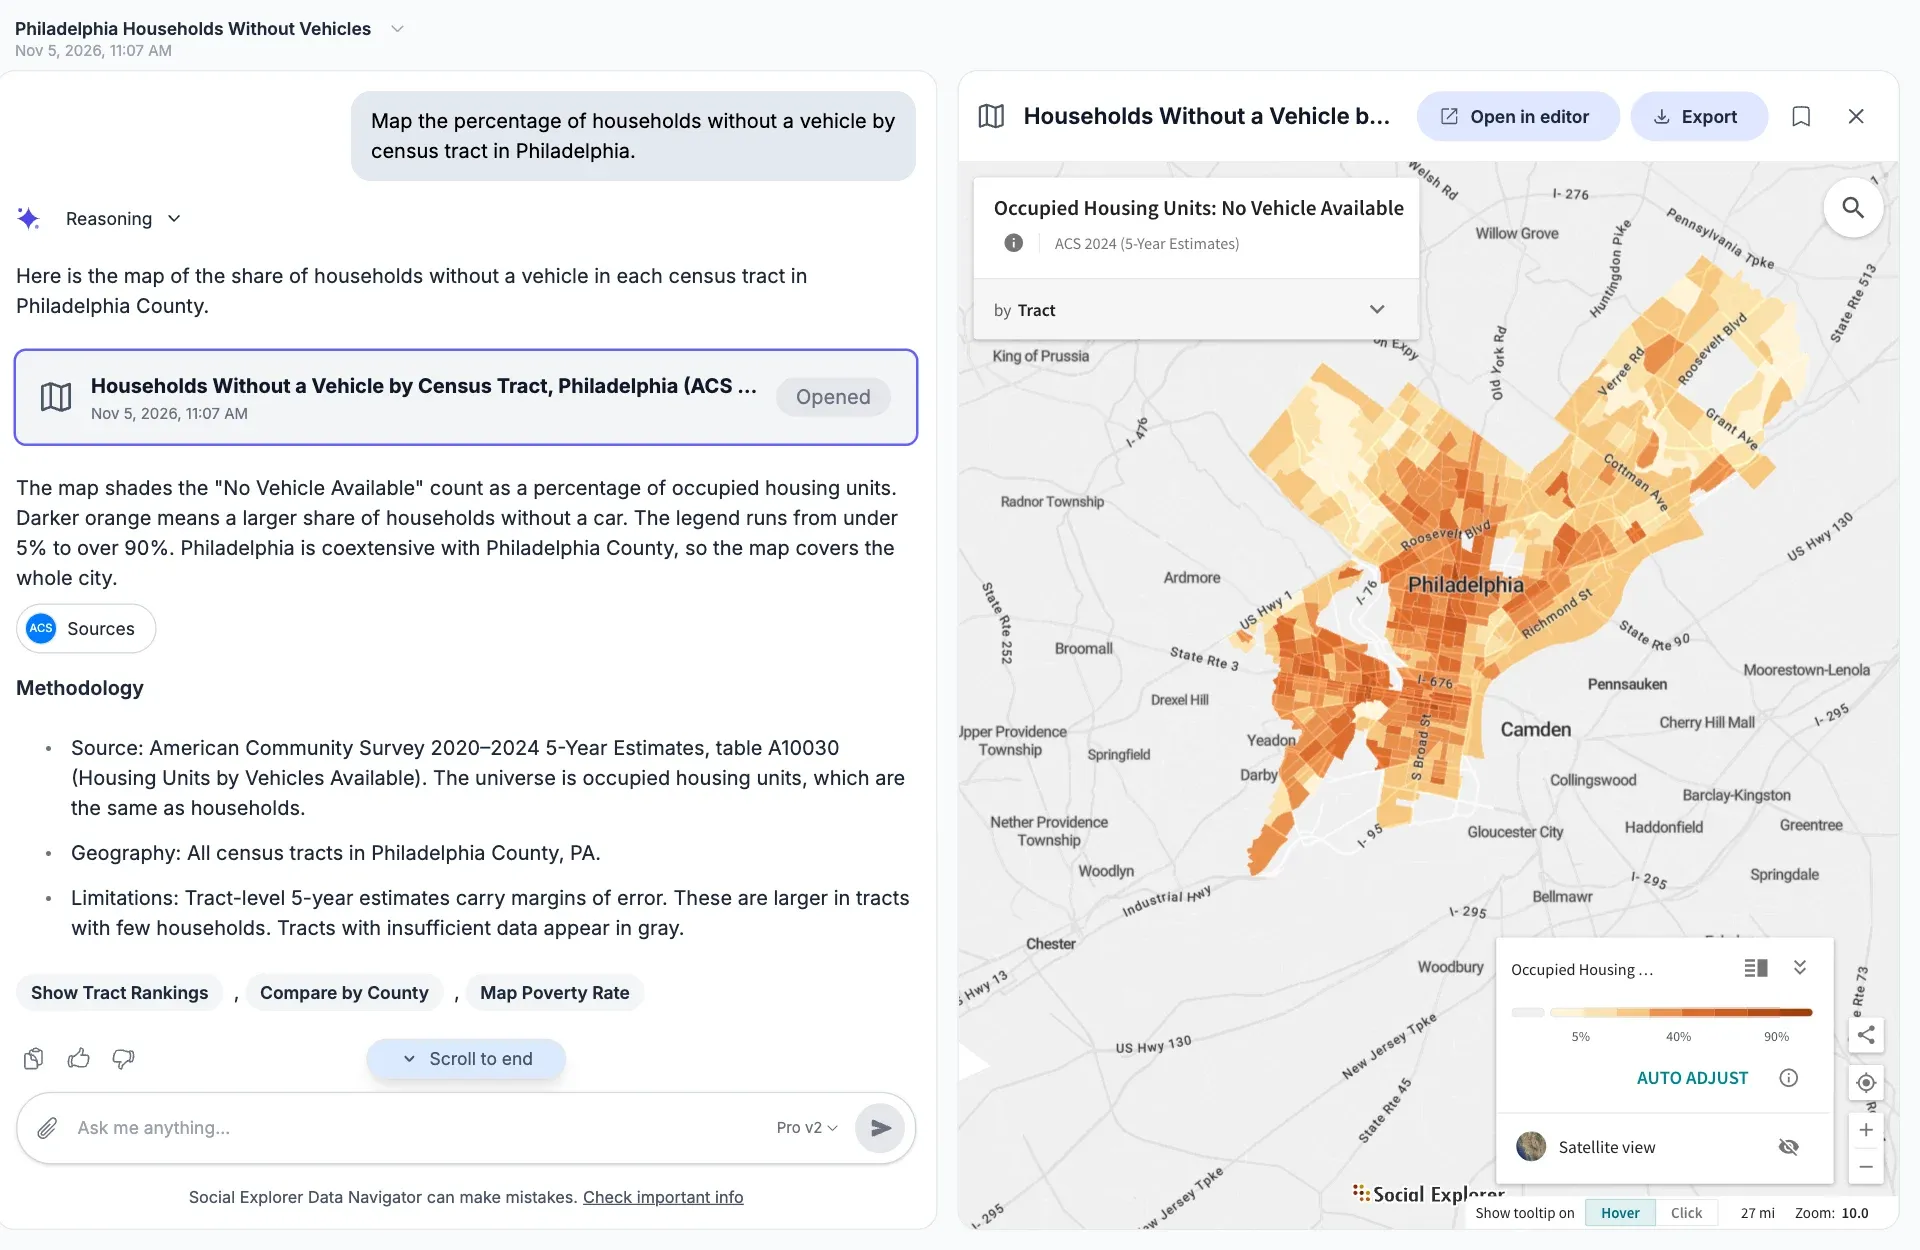
Say what you want to see, or let Data Navigator choose. Maps, charts and large tables open beside the conversation, ready to export or share.
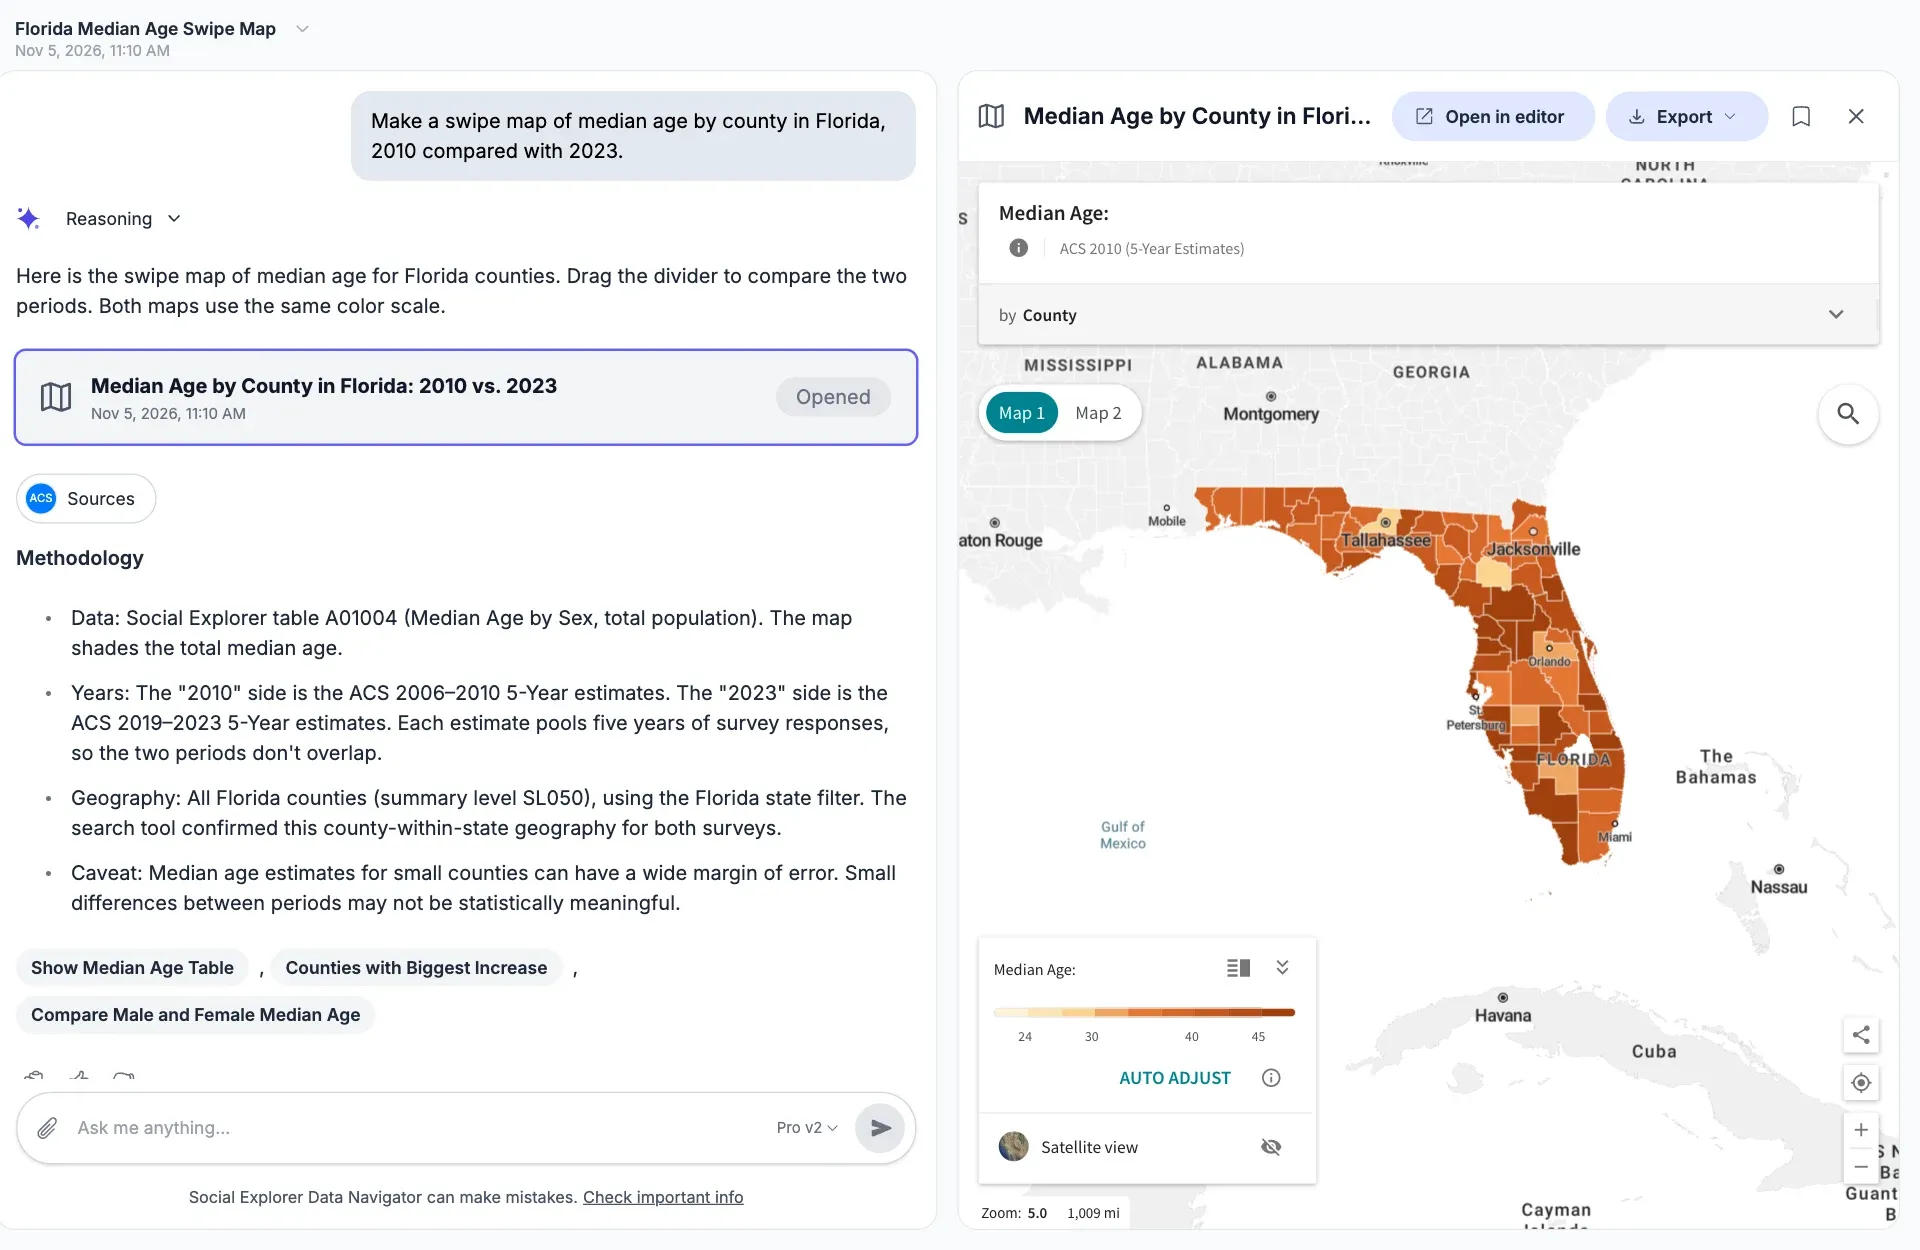
Maps by state, county, tract or block group, one at a time or two to compare on the same color scale. Here, median age in every Florida county, 2010 against 2023.
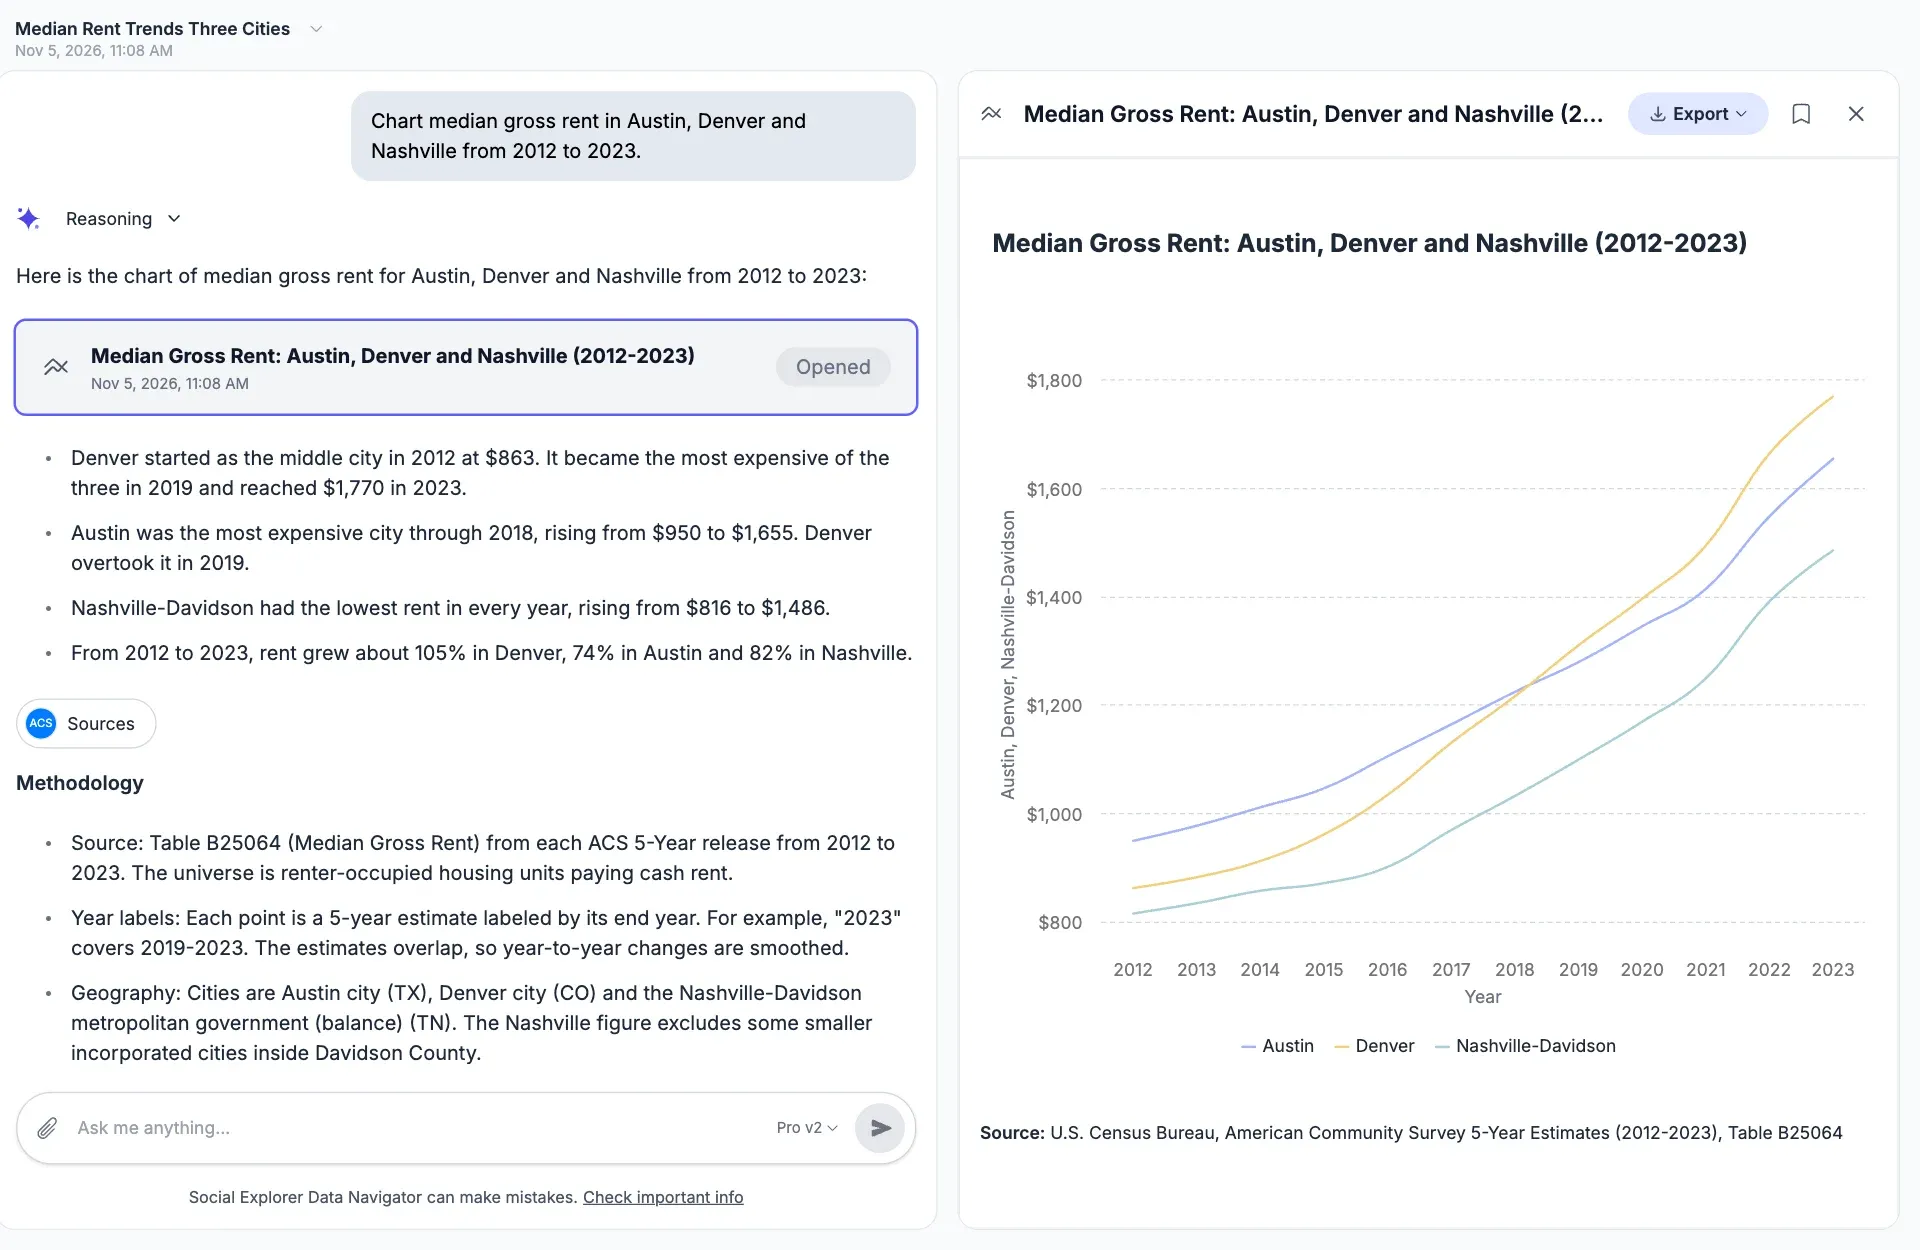
Line, bar, area and pie charts. Here, median gross rent in Austin, Denver and Nashville from 2012 to 2023, with a note that overlapping 5-year estimates smooth the changes.
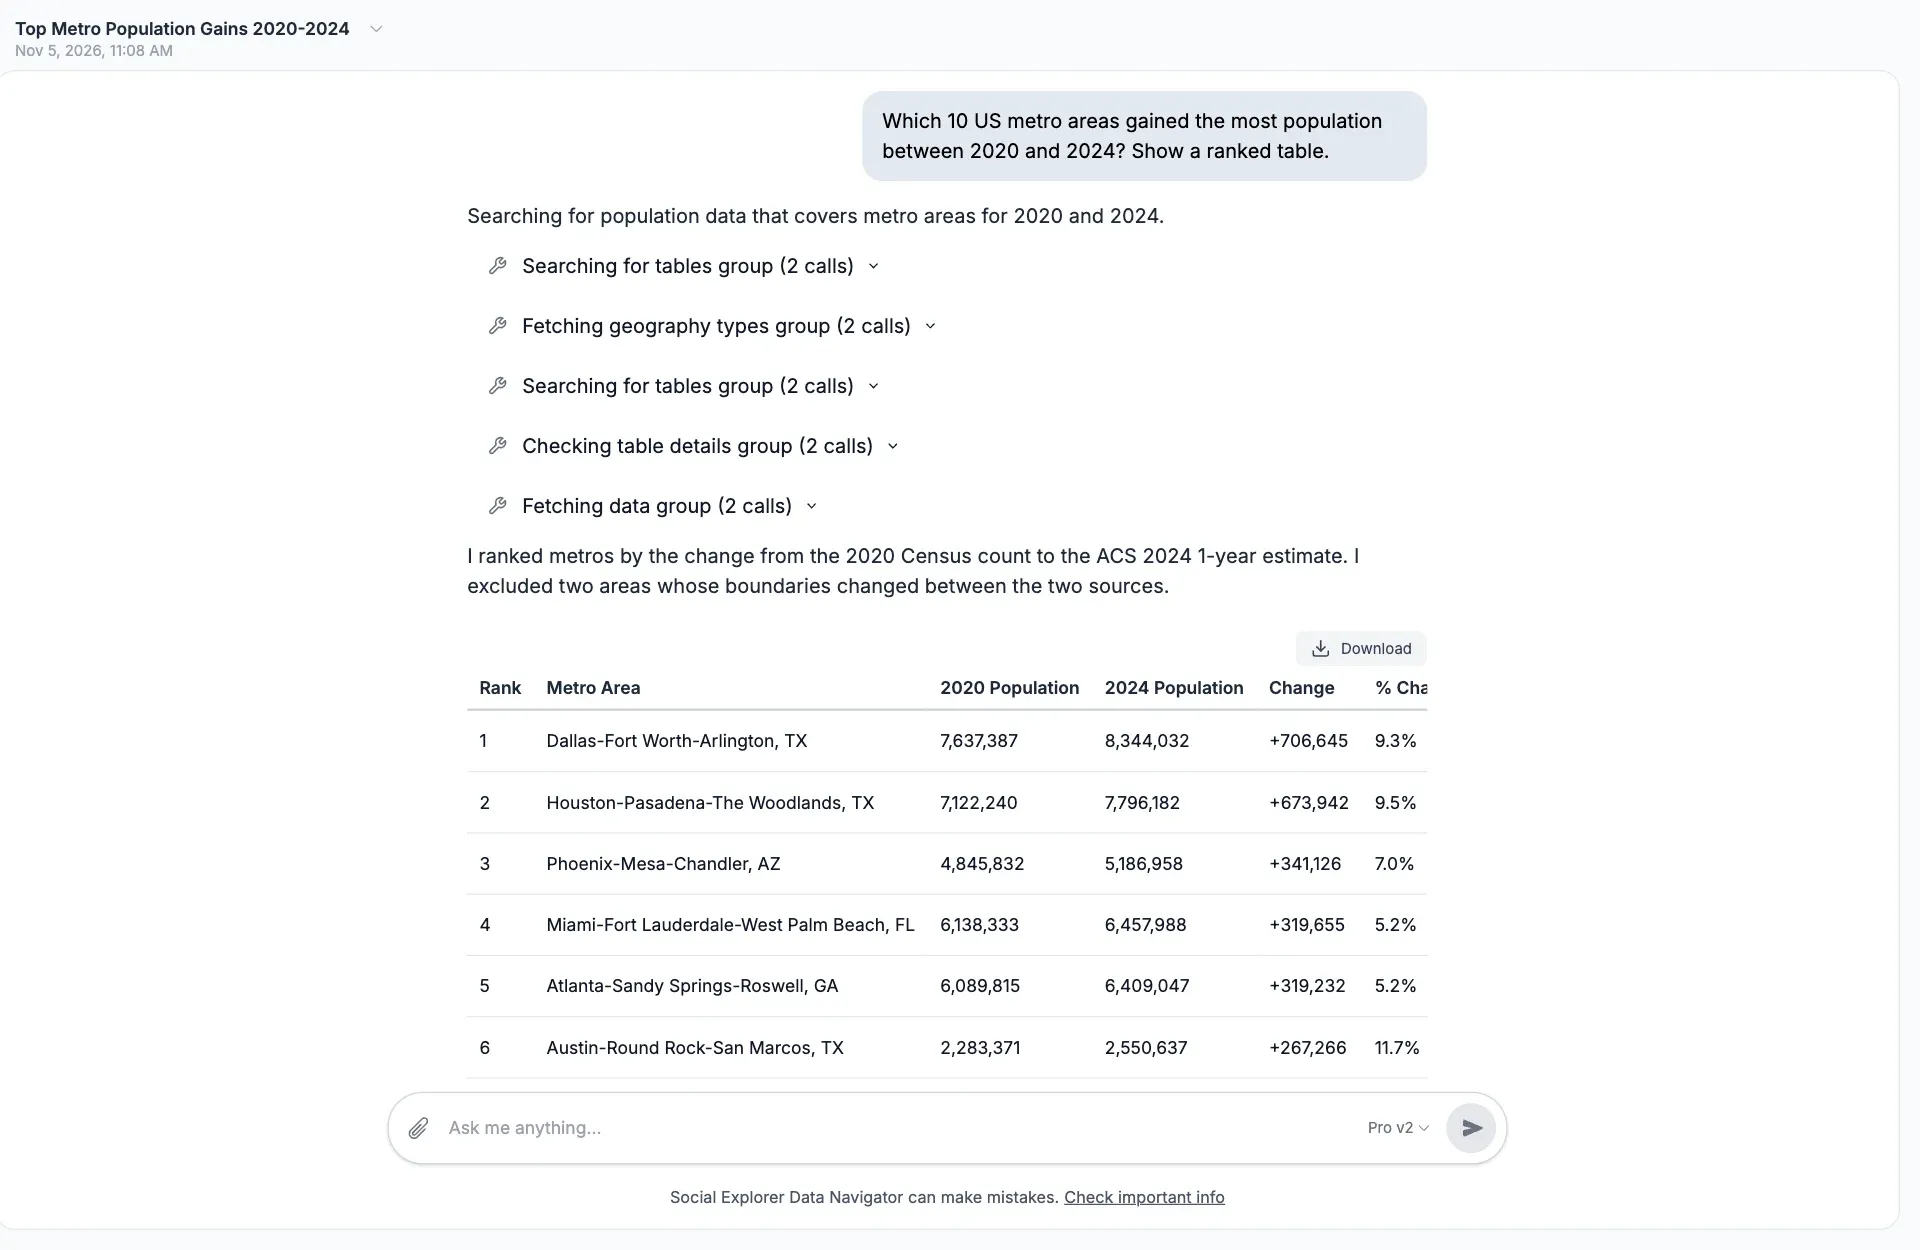
Ranked tables for any measure, with each search and fetch shown as it happens. Here, the ten metro areas that gained the most people between the 2020 Census and 2024.
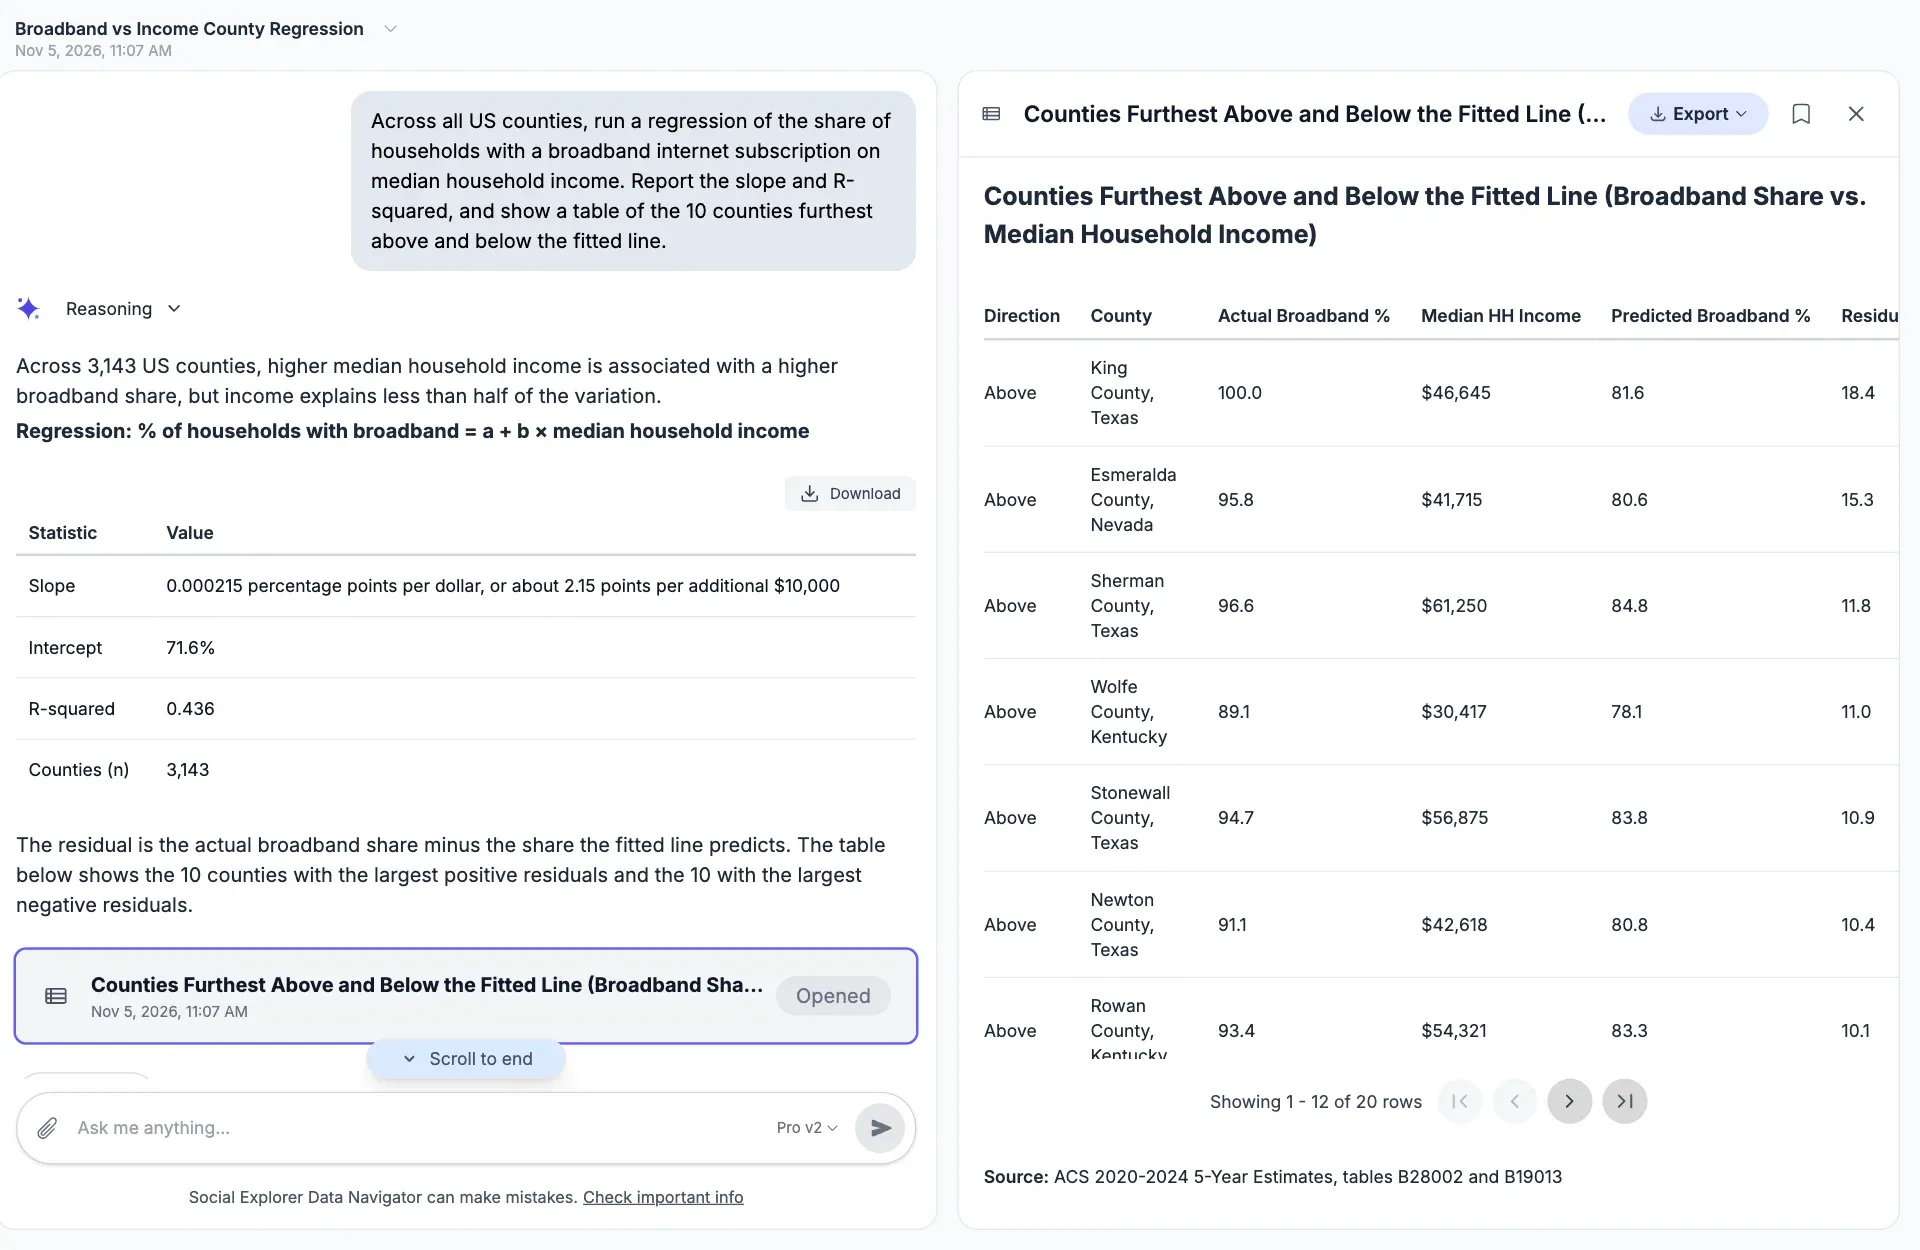
Regressions and correlations, calculated in Python. Here, broadband subscription against median household income across 3,143 counties, with the counties furthest from the line.
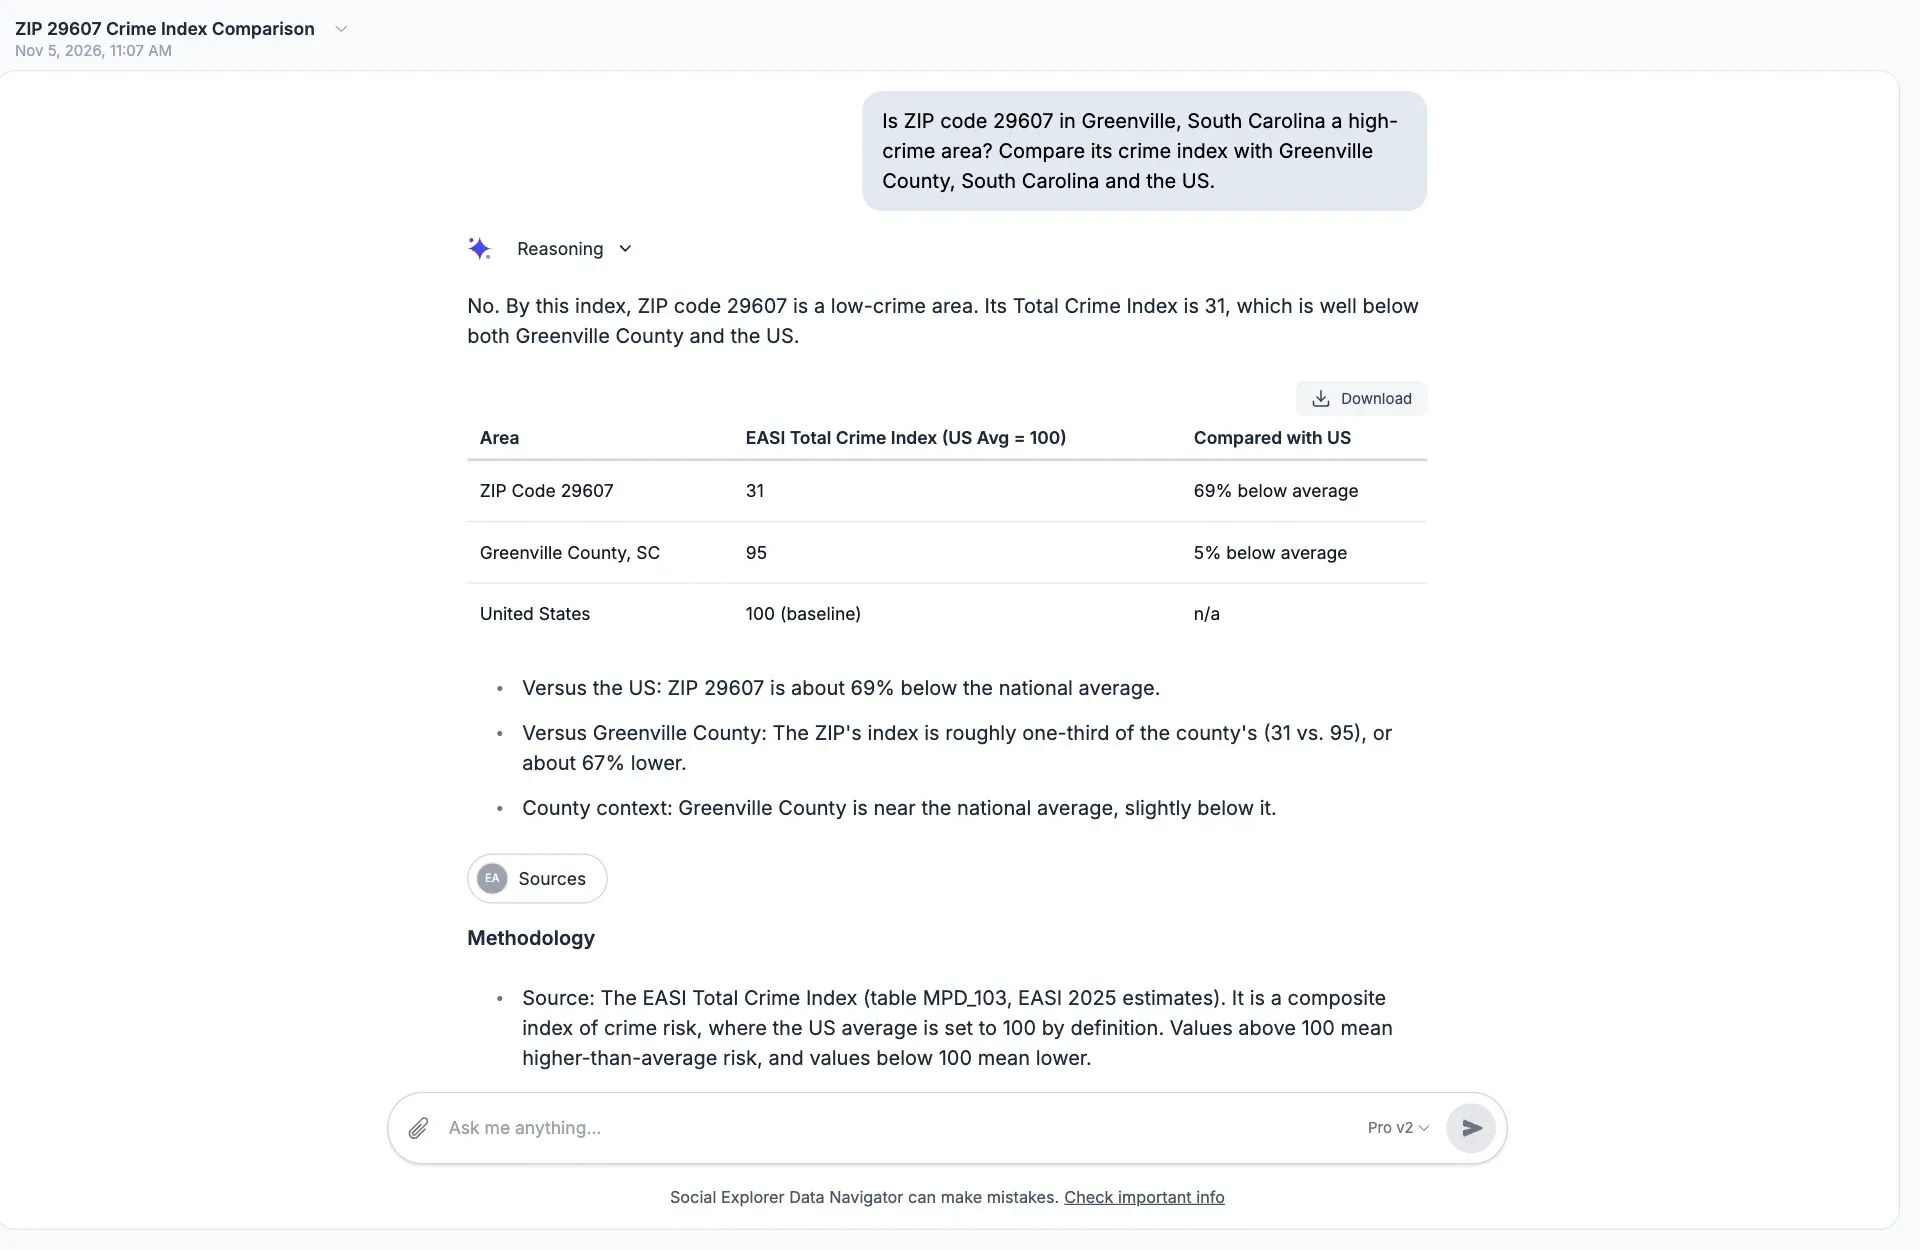
A place beside its county, state or the nation, with the measure explained. Here, the EASI crime index for a ZIP code in Greenville, South Carolina, beside the county and the US.
How it works
Research data analysis, step by step.
Data Navigator is an agent, not a search box. It plans the work, chooses its own tools and checks what it finds before it answers, and you can watch each step as it happens.
-
1
Reads the question
Places, measures, years and what you want to see, with room for typos, nicknames and regions like a council of governments, plus any files you attach.
-
2
Finds the data
Searches Social Explorer’s catalog for the tables and places that fit, and picks the survey that publishes them at that geography.
-
3
Pulls the numbers
Fetches the values for every place you named from Social Explorer’s data service, and adjusts dollars for inflation with the Consumer Price Index.
-
4
Runs the analysis
Calculates rates, changes, rankings and regressions in Python, on Social Explorer’s data and your own, so the arithmetic is exact rather than estimated by the model.
-
5
Shows the answer
A map, a chart or a table opens beside the conversation, with the tables it used and a citation in Chicago, MLA or APA style.
-
6
Suggests what’s next
Follow-up questions to compare another place, go back in time or map what the table shows.
- Up to 20 steps
- of searching, fetching and calculating on a single question
- Data from 29 publishers
- in Social Explorer’s library, from the census to the FBI
- Every calculation done in code
- so rates, changes and totals add up
- Answers as maps, charts, tables
- with the tables and citations behind them
Use cases
What teams ask Data Navigator.
Six questions from the kinds of people who use it every week, and what they came away with.
Economic development
Answering a “high-crime area” objection
The question Compare the crime index around the interchange with the rest of the county and the state.
An economic development director in a fast-growing county was working to land a 24-hour restaurant at a highway interchange. At the planning hearing, neighbors called the area high-crime. Before the next meeting she asked Data Navigator, which pulled the crime index for the block groups around the site and set them beside the county and the state. The interchange came in below the county average for both violent and property crime. She brought the map and its cited table to the council, and the project went ahead.
- Map of the area around the site
- Table beside the county and state
- Citations for the hearing record
Public health
Finding the tracts a mobile clinic should reach first
The question Which census tracts in our county have the highest share of adults without health insurance? Rank the top ten and map them.
A county health department epidemiologist needed target neighborhoods for a mobile clinic before a grant deadline. Data Navigator ranked every tract in the county by its uninsured rate from the American Community Survey, mapped the top ten with the rest of the county masked out, and flagged the tracts whose margins of error were wide. The ranked table went into the application with its citation.
- Top-ten table
- Masked tract map
- Margins of error noted
Universities and libraries
A research consultation in one conversation
The question How has median rent in our county changed since 2010, in today’s dollars? Compare it with the state.
A reference librarian at a public university uses Data Navigator in research consultations. A student’s question about rent became a chart before the session was over: rent adjusted for inflation with the Consumer Price Index, the county beside the state, and an APA citation the student pasted into the paper. Then the librarian opened the same data in Social Explorer Maps to show the student where to go next.
- Inflation-adjusted chart
- APA citation
- Opened in Social Explorer Maps
Newsrooms
A deadline story, checked twice
The question Which ten counties in the state grew fastest between 2014 and 2024? Show the change as a percentage.
A data reporter at a regional newspaper had two hours to back a story about growth at the edge of the metro. Data Navigator ranked every county by population change and showed the table and survey behind each number. The reporter checked the top results against the Census Bureau’s own release, and the table ran with the story.
- Ranked table
- Percentage change
- Source for every number
Research
Testing a hunch with a regression
The question Across U.S. counties, how closely does broadband access track median household income? Run a regression.
A graduate student studying the digital divide wanted a quick test before building a full model. Data Navigator pulled both measures for all 3,143 counties from the American Community Survey and fitted the line in Python: about two more points of broadband for every $10,000 of income, with an R² of 0.436. It showed that leaving out Puerto Rico barely changed the result, warned that the biggest outliers were tiny counties with wide margins of error, and pointed to counties with large Amish communities, and in the Mississippi Delta, that sat well below the line. Income explained less than half the variation, which told her where the full model needed to look.
- Slope, intercept and R²
- Counties furthest from the line
- Caveats on small counties
Nonprofits
Making the case for a food pantry
The question Here are our pantry visits by county. How do they compare with the share of households receiving SNAP, now and ten years ago?
A food bank’s development director writes a dozen grant applications a year. She attaches the food bank’s own spreadsheet of visits by county, and Data Navigator sets it beside SNAP participation and poverty from the American Community Survey, then and now. She gets a table and a chart she can drop into each proposal, every number with its source.
- Her own data beside the census
- Then-and-now table
- Chart of the change
Sources and methods
Answers you can check.
Data Navigator takes its numbers from Social Explorer’s published datasets and the files you give it, nothing else. It doesn’t search the web, and it doesn’t guess at numbers.
-
Social Explorer data, plus yours
Every number comes from the same published tables you can open in Social Explorer, or from files you attach, never from the web or the model’s memory.
-
Math done in code
Rates, changes, rankings and regressions run in Python, so the arithmetic is exact and repeatable.
-
Sources on every answer
The Data Sources panel names each survey, table and variable, with a citation in Chicago, MLA or APA style and a link to its metadata.
-
Honest about limits
It shows margins of error and says when a request would mislead. Asked for a swipe map of income adjusted for inflation, it explained that maps shade published values and offered an inflation-adjusted table or chart instead. Like any AI tool it can make mistakes, so every answer shows its work.
“The AI was extremely clear about what it was able to do and what it wasn’t.”
Alexandra H. Teaching Assistant, University of Iowa
“The AI was able to process most of my requests and create a map quicker than having to filter manually through the data myself.”
David C. Marketing Intelligence Specialist, Pinellas County Government
The data
Ask across the data library.
Data Navigator can reach the surveys and datasets in Social Explorer’s library, including:
- American Community Survey
- Decennial Census
- County and ZIP Business Patterns
- Local Area Unemployment Statistics
- Quarterly Census of Employment and Wages
- LEHD workforce data
- Small Area Income and Poverty Estimates
- Current Population Survey
- CDC Social Vulnerability Index
- HUD CHAS housing data
- EPA EJSCREEN
- FBI crime data
- FHFA House Price Index
- NOAA climate data
- EASI Market Profile data
Take the answer further.
-
Open it in Maps
Turn any map answer into a full Social Explorer Maps project, to restyle, analyze further or add to a story.
-
Share and embed
Share an answer with a link, or embed it in a page, a course site or a report.
-
Export the data
Download charts as CSV, JSON, PNG or JPG, and tables as CSV or JSON.
-
Use your own AI assistant
The Model Context Protocol (MCP) is an open standard that lets AI assistants use outside tools. With the MCP server, also part of Premium and Platinum, an assistant that supports MCP can work with Social Explorer data.
Questions about Data Navigator
What are Social Explorer’s AI tools for research data analysis?
Social Explorer’s AI tools all come with Premium and Platinum: Data Navigator, an MCP server, and AI section summaries and an AI Assistant in Studio. Data Navigator answers questions about places in plain language with a map, chart or table from published datasets. The MCP server lets AI assistants that support MCP work with Social Explorer data.
How do I use AI for data analysis in Data Navigator?
Type a question in plain language that names a place and a topic, such as median household income in your county. Data Navigator finds the tables, pulls the data, does the math and answers with a map, chart or table, then suggests follow-ups. Check the tables behind the answer, then export it or open it in Maps.
Can Data Navigator run a regression?
Yes. Ask for a regression or a correlation in plain language, and Data Navigator pulls both measures and fits a linear regression in Python, reporting the slope, intercept and R². Asked about broadband and income across all 3,143 US counties, it found an R² of 0.436 and listed the counties furthest from the line.
Can I trust Data Navigator’s answers?
Data Navigator answers from Social Explorer’s published datasets and the files you attach, never from the web, and runs every calculation in code. Each answer names the survey, table and variable it used, with methodology notes and, for survey estimates, margins of error. Like any AI tool it can make mistakes, so check the sources it shows.
Can Data Navigator analyze my own data?
Yes. Attach up to five files to a message, each up to 5 MB: CSV or Excel (.xlsx) spreadsheets, or PDF, Word, Markdown or text documents. Spreadsheets become tables Data Navigator can query and calculate on, and it reads documents as text, so you can compare your own numbers with Social Explorer’s data.
Who can use Data Navigator?
Data Navigator and the MCP server come with Premium and Platinum, for one person, a team of up to 10, or everyone at a university, library or agency on a site license. Enterprise includes them too. Platinum has five times the AI credits of Premium. To see Data Navigator answer your own questions, plan an evaluation or ask Social Explorer’s team for a live demo.
Put it to work.
The rest of the platform.
Bring Data Navigator to your organization
Data Navigator and MCP come with Premium and Platinum, for one person, a team or a whole institution. Enterprise includes them too.
Screenshots show real Data Navigator answers, captured on November 5, 2026, from Social Explorer’s data library.