

Maryland: Population, demographics and census data
Home to 6,265,347 people, the 18th largest of the 50 states and DC, anchored by Baltimore. It grew 4.3% between 2015 and 2025.
- Population
- 6.27M. Census Bureau estimate · Rank 18 of the 50 states and DC
- Median household income
- $107,700 ±$1,661. US $84,780
- Median age
- 39.9 ±0.2. US 39.5
ACS 2025 1-year estimates, U.S. Census Bureau
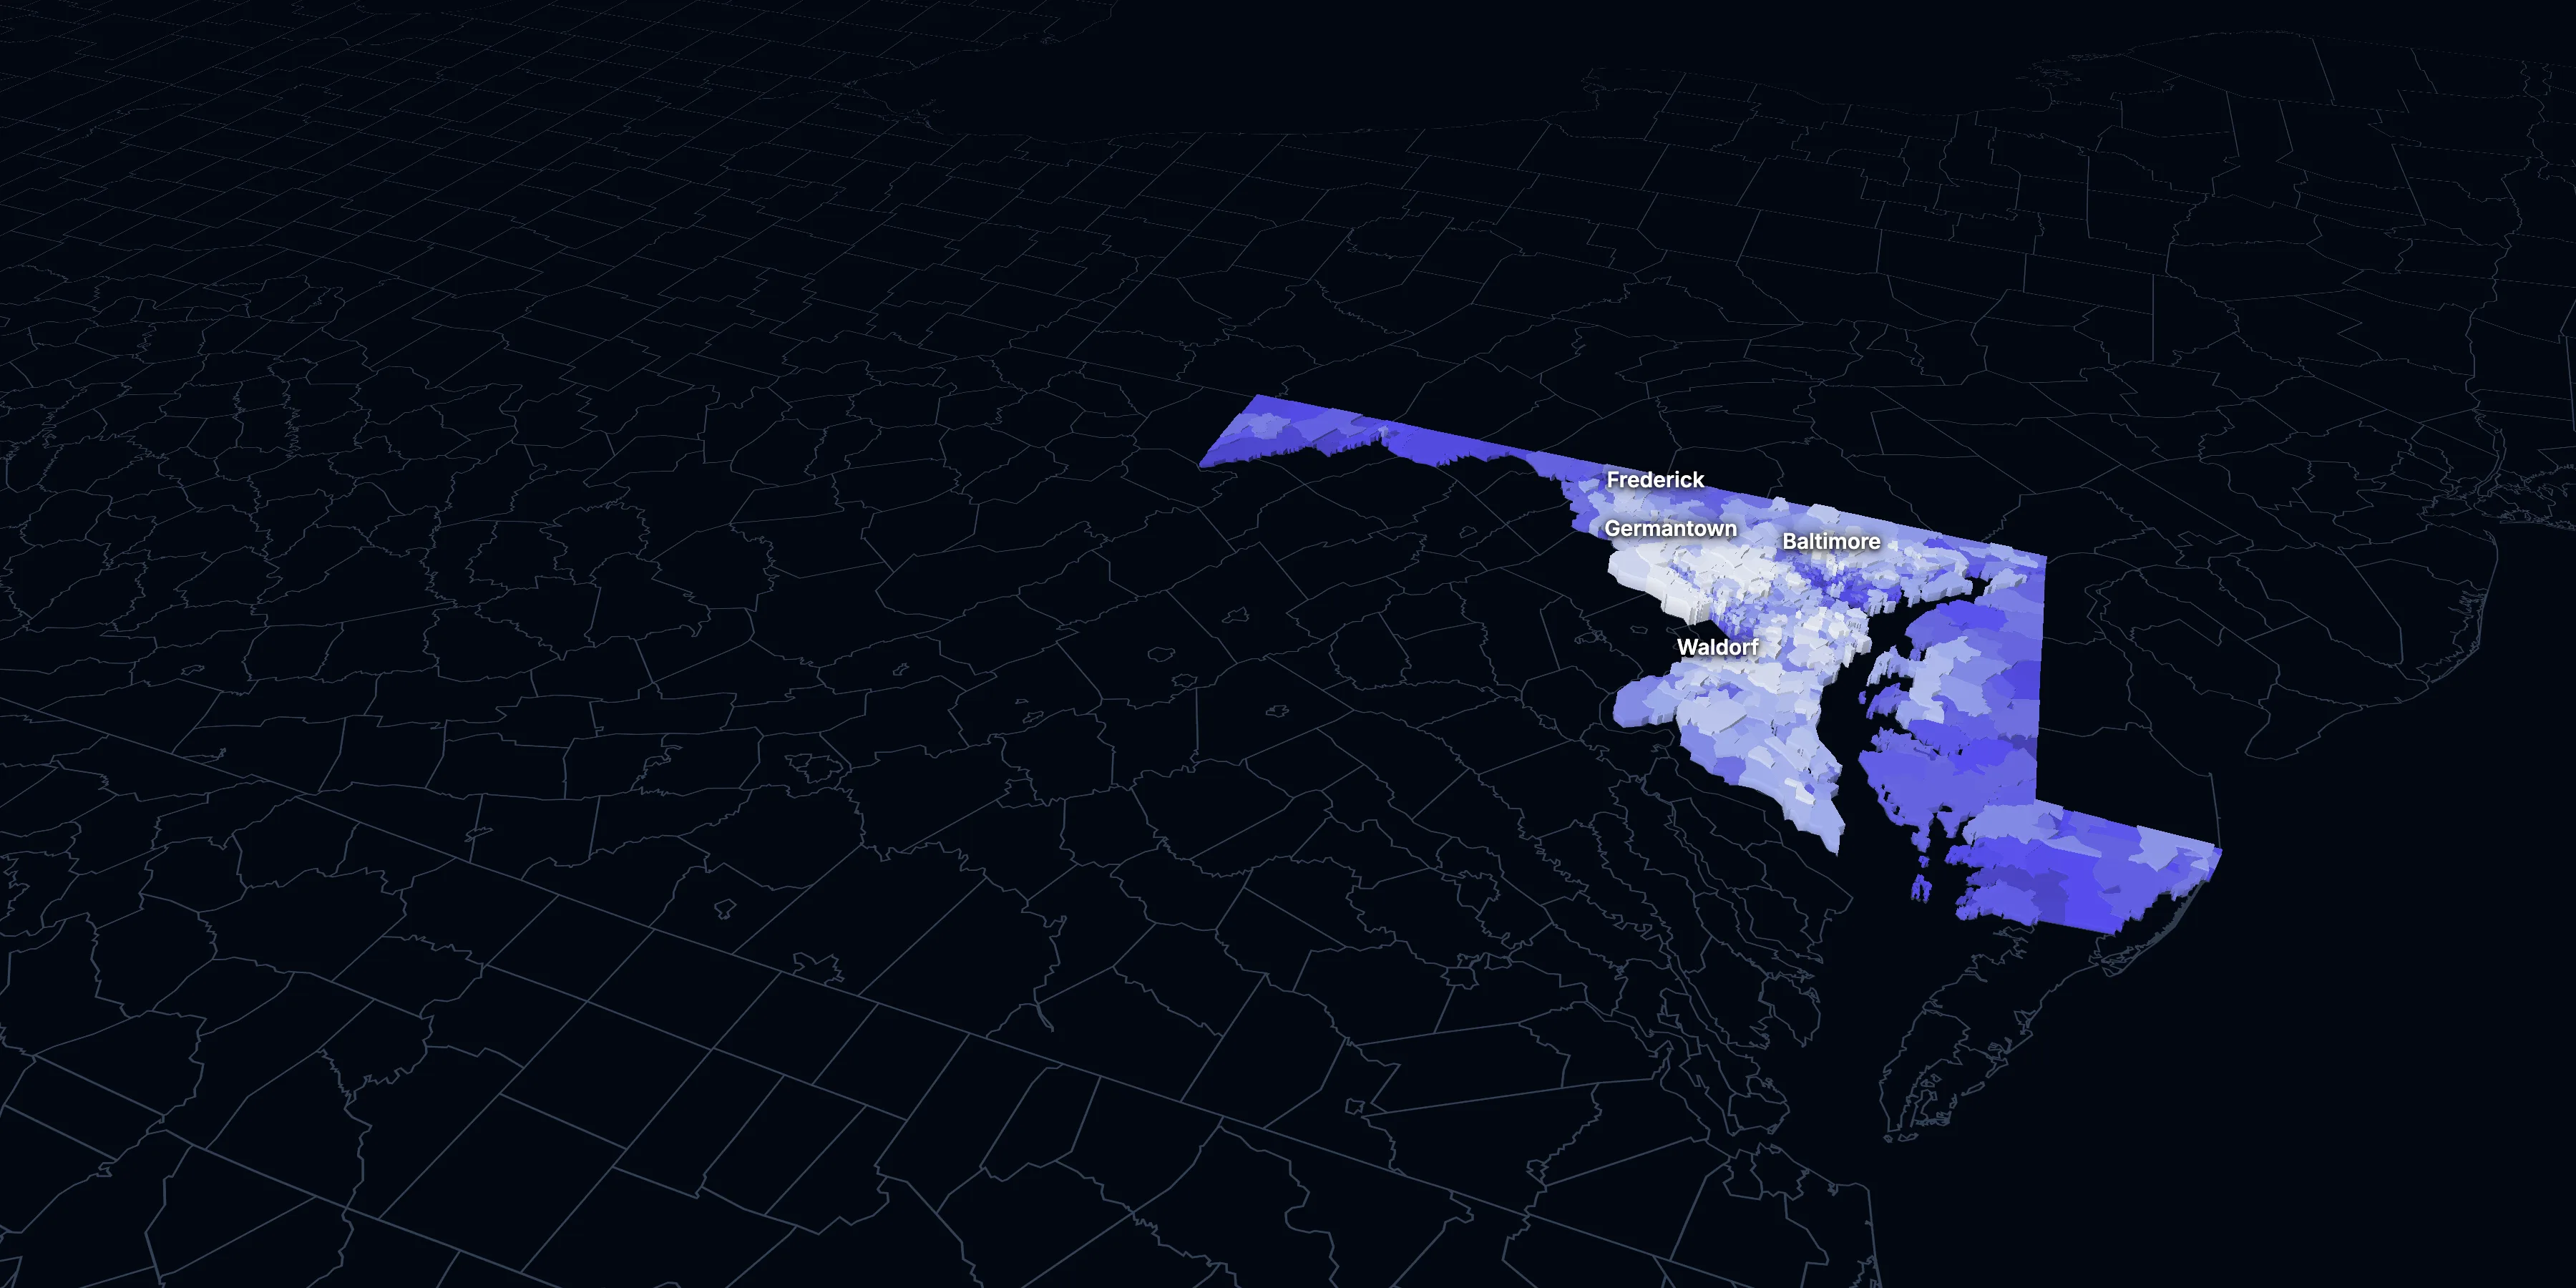
Taller, lighter tracts have higher household incomes
About Maryland
Maryland’s median household income is $107,700 (±$1,661), higher than the US ($84,780), and its median age is 39.9 (±0.2), according to the ACS 2025 1-year estimates. Its largest city is Baltimore.
± is each figure’s margin of error, at 90% confidence, and † marks one too uncertain to lean on. Under each percentage in the tables is the number it counts. How the margins are worked out.
FIPS code 24
Highlights
What stands out in Maryland
The numbers where Maryland sits furthest from the nation, or past a recognized policy benchmark.
Furthest from the national picture
$107,700
3rd among statesMedian household income
That’s higher than the US ($84,780). It’s the 3rd highest of the 50 states and DC.
28.8%
2.5× the USBlack, not Hispanic
That’s higher than the US (11.7%). It’s the 5th highest of the 50 states and DC.
52.7%
3rd among statesCommute 30 minutes or more
That’s higher than the US (39.2%). It’s the 3rd highest of the 50 states and DC.
45.5%
Higher than the USBachelor’s degree or more
That’s higher than the US (37.4%). It’s the 6th highest of the 50 states and DC.
$1,822
Higher than the USMedian gross rent
That’s higher than the US ($1,557).
9.6%
Lower than the USLiving in poverty
That’s lower than the US (11.8%). It’s the 5th lowest of the 50 states and DC.
2015 to 2025
How Maryland changed in ten years
The state added 258,946 people. It got older, more foreign-born and better educated, and poverty fell 0.1 points.
Population, change since 2015
+4.3% in the state and +6.3% in the US.
Source: ACS 1-year, 2015 to 2025, table A00001.
Show data
| Maryland | United States | |
|---|---|---|
| 2015 | 0.0% | 0.0% |
| 2016 | +0.2% | +0.5% |
| 2017 | +0.8% | +1.3% |
| 2018 | +0.6% | +1.8% |
| 2019 | +0.7% | +2.1% |
| 2021 | +2.6% | +3.3% |
| 2022 | +2.6% | +3.7% |
| 2023 | +2.9% | +4.2% |
| 2024 | +4.3% | +5.8% |
| 2025 | +4.3% | +6.3% |
Embed
Median household income, in 2025 dollars
+3.6% in the state and +10.9% in the US.
Source: ACS 1-year, 2015 to 2025, table A14006.
Show data
| Maryland | United States | |
|---|---|---|
| 2015 | $103,912 | $76,413 |
| 2016 | $106,779 | $77,931 |
| 2017 | $106,955 | $79,891 |
| 2018 | $107,598 | $80,059 |
| 2019 | $110,122 | $83,427 |
| 2021 | $108,063 | $83,521 |
| 2022 | $105,228 | $82,811 |
| 2023 | $104,981 | $82,683 |
| 2024 | $106,354 | $84,339 |
| 2025 | $107,700 | $84,780 |
Embed
Living in poverty
−0.1 points in the state and −3.0 points in the US.
Source: ACS 1-year, 2015 to 2025, table A13004.
Show data
| Maryland | United States | |
|---|---|---|
| 2015 | 9.7% | 14.7% |
| 2016 | 9.7% | 14.0% |
| 2017 | 9.3% | 13.4% |
| 2018 | 9.0% | 13.1% |
| 2019 | 9.0% | 12.3% |
| 2021 | 10.3% | 12.8% |
| 2022 | 9.6% | 12.6% |
| 2023 | 9.5% | 12.5% |
| 2024 | 9.1% | 12.1% |
| 2025 | 9.6% | 11.8% |
Embed
Bachelor’s degree or more
+6.7 points in the state and +6.7 points in the US.
Source: ACS 1-year, 2015 to 2025, table A12001.
Show data
| Maryland | United States | |
|---|---|---|
| 2015 | 38.8% | 30.6% |
| 2016 | 39.3% | 31.3% |
| 2017 | 39.7% | 32.0% |
| 2018 | 40.8% | 32.6% |
| 2019 | 40.9% | 33.1% |
| 2021 | 42.5% | 35.0% |
| 2022 | 43.8% | 35.7% |
| 2023 | 43.7% | 36.2% |
| 2024 | 44.7% | 36.8% |
| 2025 | 45.5% | 37.4% |
Embed
Median gross rent, in 2025 dollars
+4.1% in the state and +18.5% in the US.
Source: ACS 1-year, 2015 to 2025, table A18009.
Show data
| Maryland | United States | |
|---|---|---|
| 2015 | $1,751 | $1,314 |
| 2016 | $1,777 | $1,327 |
| 2017 | $1,770 | $1,340 |
| 2018 | $1,772 | $1,368 |
| 2019 | $1,779 | $1,393 |
| 2021 | $1,765 | $1,427 |
| 2022 | $1,717 | $1,440 |
| 2023 | $1,756 | $1,496 |
| 2024 | $1,779 | $1,537 |
| 2025 | $1,822 | $1,557 |
Embed
Median home value, in 2025 dollars
+8.5% in the state and +39.3% in the US.
Source: ACS 1-year, 2015 to 2025, table A10036.
Show data
| Maryland | United States | |
|---|---|---|
| 2015 | $410,732 | $266,469 |
| 2016 | $415,105 | $277,278 |
| 2017 | $413,781 | $288,124 |
| 2018 | $419,833 | $296,908 |
| 2019 | $422,138 | $305,336 |
| 2021 | $444,217 | $337,116 |
| 2022 | $441,001 | $355,481 |
| 2023 | $440,020 | $361,931 |
| 2024 | $450,922 | $372,685 |
| 2025 | $445,800 | $371,100 |
Embed
ACS 1-year estimates. The dotted stretch of each line spans 2020, when the Census Bureau released no standard 1-year estimates. Dollar values are in 2025 dollars.
| Indicator | 2015 | 2025 | Change |
|---|---|---|---|
| Population | 6,006,401 | 6,265,347 | +4.3% |
| Median age | 38.3 | 39.9 | +1.6 years |
| 65 and over | 14.1% | 18.4% | +4.3 points |
| Born outside the US | 15.2% | 17.7% | +2.5 points |
| Hispanic or Latino | 9.5% | 13.7% | +4.2 points |
| Median household income | $103,912 | $107,700 | +3.6% |
| Living in poverty | 9.7% | 9.6% | −0.1 points |
| Bachelor’s degree or more | 38.8% | 45.5% | +6.7 points |
| Households that rent | 34.1% | 32.7% | −1.4 points |
| Median gross rent | $1,751 | $1,822 | +4.1% |
| Median home value | $410,732 | $445,800 | +8.5% |
1475 census tracts
Maryland, tract by tract
State averages hide a lot. These census tracts are the closest the census comes to neighborhoods.
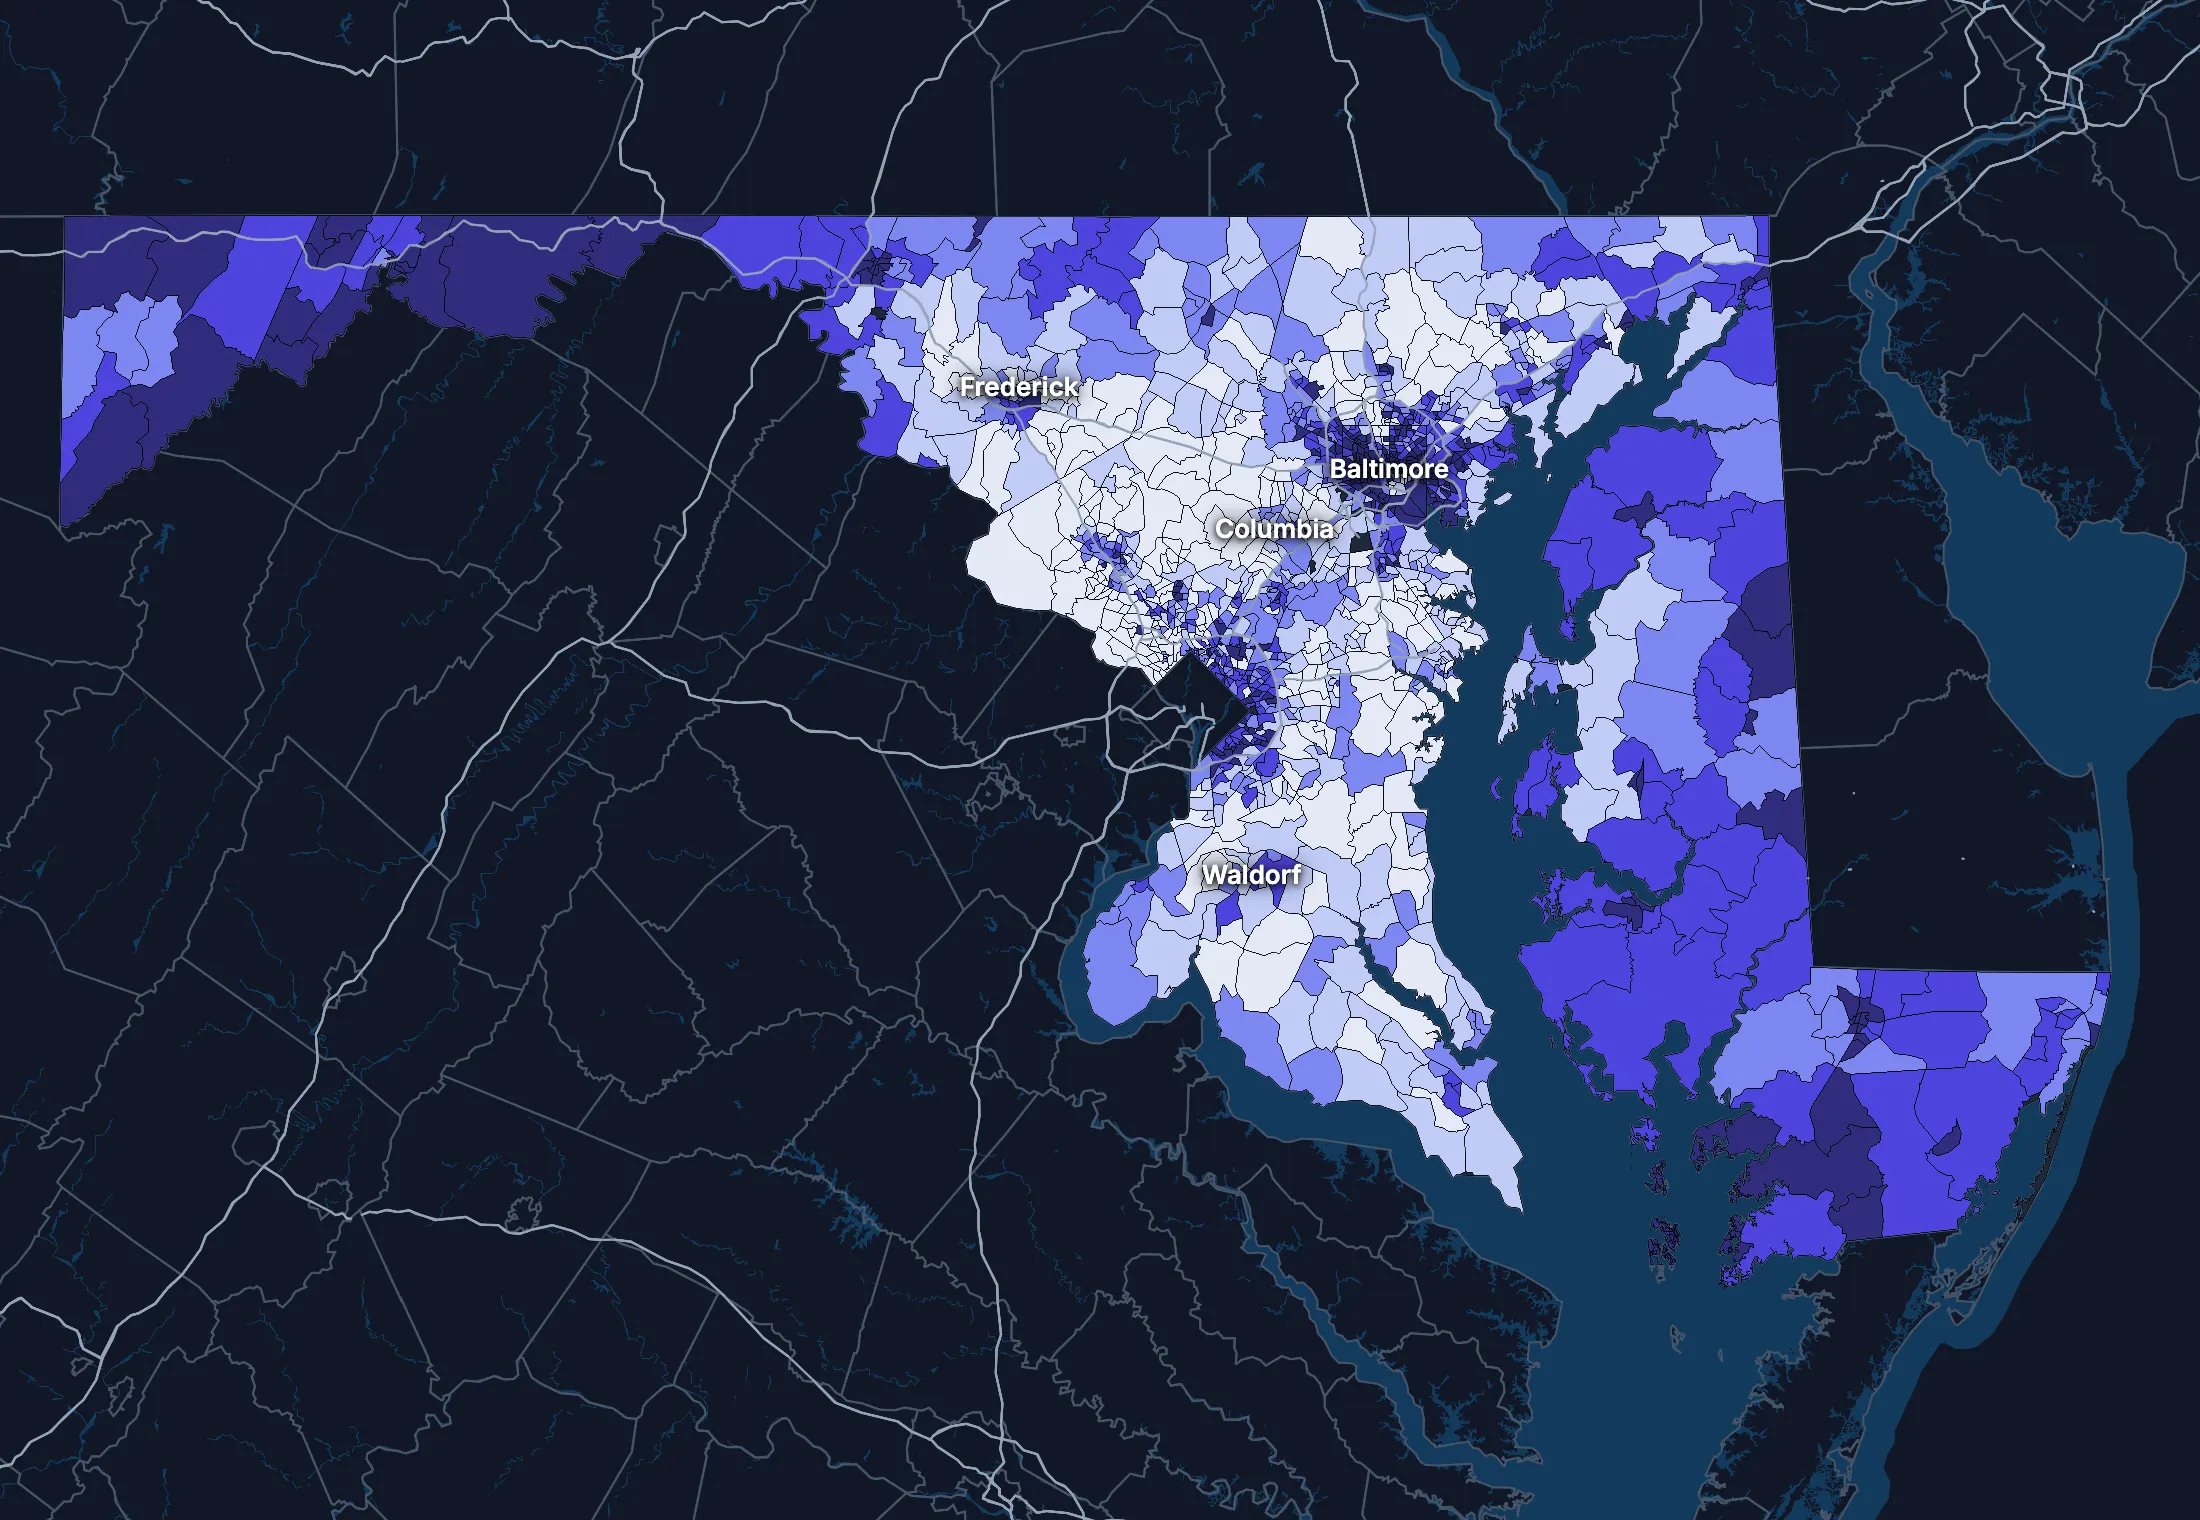
Where the state’s average misleads
Each tick is one census tract, and the dark line marks the state. Hover over a tick or tap it to see the tract.
Poverty
340 of 1455 tracts are at least 1.5 times the state’s overall 9.4%, and 409 are at two-thirds of it or less.
Highest: Tract 4906.05, 85.6%. Lowest: Tract 7407.03, 0.0%.
Renters paying 30% or more of income
97 of 1382 tracts are at least 1.5 times the state’s overall 48.7%, and 318 are at two-thirds of it or less.
Highest: Tract 8006.08, 100.0%. Lowest: Tract 7013.02, 0.0%.
Adults with a bachelor’s degree
231 of 1458 tracts are at least 1.5 times the state’s overall 43.4%, and 451 are at two-thirds of it or less.
Highest: Tract 7060.08, 95.7%. Lowest: Tract 1502, 1.6%.
Median household income
250 of 1452 tracts are at least 1.5 times the typical tract’s $103,192, and 285 are at two-thirds of it or less.
Highest: Tract 4038.02, $250,000 or more. Lowest: Tract 4906.05, under $2,500.
American Community Survey 2020–2024 5-year estimates, by census tract. Income is capped at $250,000+ by the Census Bureau.
People
Who lives in Maryland
Its median age of 39.9 is higher than the US (39.5). 17.7% of residents were born outside the US, and 22.2% speak a language other than English at home.
Age
Source: ACS 2025 1-year, table A01001.
Show data
| Maryland | United States | |
|---|---|---|
| Under 18 | 21.3% ±0.3% , number 1,335,441 ±16,340 | 21.0% ±<0.1% , number 71,689,151 ±111,800 |
| 18 to 24 | 8.7% ±0.2% , number 547,457 ±12,630 | 9.3% ±<0.1% , number 31,716,680 ±98,660 |
| 25 to 34 | 13.0% ±0.1% , number 816,831 ±6,706 | 13.6% ±<0.1% , number 46,357,354 ±55,690 |
| 35 to 44 | 13.9% ±0.2% , number 869,304 ±15,100 | 13.4% ±<0.1% , number 45,746,189 ±105,700 |
| 45 to 54 | 12.1% ±0.1% , number 756,624 ±6,521 | 11.8% ±<0.1% , number 40,257,563 ±53,540 |
| 55 to 64 | 12.5% ±0.2% , number 784,878 ±13,670 | 12.1% ±<0.1% , number 41,242,904 ±104,700 |
| 65 to 74 | 10.6% ±0.2% , number 662,104 ±13,090 | 10.8% ±<0.1% , number 36,895,650 ±91,520 |
| 75 and over | 7.9% ±0.2% , number 492,708 ±10,340 | 8.2% ±<0.1% , number 27,879,368 ±78,140 |
Embed
Race and ethnicity
Source: ACS 2025 1-year, table A04001.
Show data
| Maryland | United States | |
|---|---|---|
| White, not Hispanic | 44.2% ±0.1% , number 2,769,520 ±7,041 | 55.0% ±<0.1% , number 187,959,031 ±58,340 |
| Hispanic or Latino | 13.7% ±<0.1% , number 860,170 ±805 | 20.5% ±<0.1% , number 69,975,516 ±13,270 |
| Black, not Hispanic | 28.8% ±0.3% , number 1,804,560 ±16,300 | 11.7% ±<0.1% , number 40,096,453 ±106,200 |
| Asian, not Hispanic | 7.3% ±0.1% , number 456,164 ±7,242 | 6.5% ±<0.1% , number 22,096,709 ±58,340 |
| Other or multiracial | 6.0% ±0.3% , number 374,933 ±19,360 | 6.3% ±<0.1% , number 21,657,150 ±150,100 |
Embed
Language spoken at home
Source: ACS 2025 1-year, table C16001.
Show data
| Maryland | United States | |
|---|---|---|
| English only | 77.8% ±0.5% , number 4,610,528 ±28,280 | 77.1% ±0.1% , number 249,390,588 ±275,300 |
| Spanish | 10.3% ±0.2% , number 613,292 ±14,340 | 13.9% ±0.1% , number 44,921,985 ±177,800 |
| Other Indo-European | 4.9% ±0.3% , number 291,738 ±16,470 | 4.0% ±<0.1% , number 12,862,980 ±113,500 |
| Asian and Pacific Island | 3.9% ±0.2% , number 233,706 ±13,110 | 3.8% ±<0.1% , number 12,288,841 ±99,740 |
| Arabic and other | 3.0% ±0.3% , number 177,329 ±15,890 | 1.3% ±<0.1% , number 4,116,949 ±71,480 |
Embed
Marital status
Source: ACS 2025 1-year, table A11001.
Show data
| Maryland | United States | |
|---|---|---|
| Now married | 46.9% ±0.5% , number 2,426,952 ±26,510 | 47.9% ±0.1% , number 135,567,564 ±223,300 |
| Never married | 36.9% ±0.4% , number 1,908,116 ±21,970 | 34.8% ±0.1% , number 98,647,238 ±152,600 |
| Divorced | 9.4% ±0.3% , number 485,977 ±14,850 | 10.2% ±<0.1% , number 28,879,967 ±112,900 |
| Widowed | 5.2% ±0.2% , number 271,403 ±8,768 | 5.5% ±<0.1% , number 15,599,094 ±69,430 |
| Separated | 1.5% ±0.1% , number 79,772 ±7,004 | 1.6% ±<0.1% , number 4,441,399 ±49,160 |
Embed
Where people lived a year ago
Source: ACS 2025 1-year, table A08001.
Show data
| Maryland | United States | |
|---|---|---|
| Same home | 90.0% ±0.4% , number 5,580,794 ±22,660 | 88.4% ±0.1% , number 298,889,697 ±214,800 |
| Same county | 4.5% ±0.3% , number 281,067 ±18,770 | 6.0% ±<0.1% , number 20,202,671 ±166,300 |
| Another county in the state | 2.6% ±0.2% , number 162,984 ±13,630 | 3.0% ±<0.1% , number 10,168,097 ±89,190 |
| Another state | 2.2% ±0.2% , number 136,862 ±10,950 | 2.1% ±<0.1% , number 7,025,589 ±81,660 |
| Another country | 0.6% ±0.1% , number 39,560 ±6,306 | 0.6% ±<0.1% , number 1,984,943 ±47,210 |
Embed
Top countries of birth, among those born abroad
Source: ACS 2025 1-year, table A07001.
Show data
| Maryland | |
|---|---|
| El Salvador | 11.3% , number 125,932 |
| India | 6.2% , number 68,391 |
| Guatemala | 5.6% , number 62,015 |
| China, Excluding Hong Kong and Taiwan | 4.2% , number 46,626 |
| Philippines | 4.1% , number 46,075 |
| Ethiopia | 4.1% , number 45,186 |
Embed
All the numbers
| Indicator | Maryland | US | Rank among states* | Table |
|---|---|---|---|---|
| Population | 6,265,347 | 341,784,859 | 18th | A00001 |
| People per square mile | 645 | 97 | 6th | A00002 |
| Land area (square miles) | 9,711 | – | – | A00002 |
| Median age | 39.9 ±0.2 | 39.5 ±0.1 | 20th | A01004 |
| Under 18 | 21.3% ±0.3% , number 1,335,441 ±16,340 | 21.0% ±<0.1% , number 71,689,151 ±111,800 | 21st | B02002 |
| 65 and over | 18.4% ±0.3% , number 1,154,812 ±16,690 | 19.0% ±<0.1% , number 64,775,018 ±120,300 | 41st | B02002 |
| Born outside the US | 17.7% ±0.4% , number 1,110,323 ±27,640 | 14.7% ±0.1% , number 50,409,320 ±204,800 | 9th | A06001 |
| Speak a language other than English at home | 22.2% ±0.5% , number 1,316,065 ±30,020 | 22.9% ±0.1% , number 74,190,755 ±244,000 | 15th | C16001 |
| Veterans (adults) | 6.6% ±0.2% , number 321,975 ±9,965 | 5.9% ±<0.1% , number 15,746,228 ±85,320 | 29th | A16002 |
| Living with a disability | 12.6% ±0.3% , number 776,163 ±18,020 | 13.7% ±<0.1% , number 46,271,455 ±126,000 | 46th | B18101 |
| Women 15–50 who had a baby in the past year | 4.4% ±0.4% , number 66,324 ±6,358 | 5.0% ±0.1% , number 4,016,759 ±44,040 | 28th | B13002 |
| Lived in the same home a year ago | 90.0% ±0.4% , number 5,580,794 ±22,660 | 88.4% ±0.1% , number 298,889,697 ±214,800 | 14th | A08001 |
| White, not Hispanic | 44.2% ±0.1% , number 2,769,520 ±7,041 | 55.0% ±<0.1% , number 187,959,031 ±58,340 | 45th | A04001 |
| Hispanic or Latino | 13.7% ±<0.1% , number 860,170 ±805 | 20.5% ±<0.1% , number 69,975,516 ±13,270 | 21st | A04001 |
| Black, not Hispanic | 28.8% ±0.3% , number 1,804,560 ±16,300 | 11.7% ±<0.1% , number 40,096,453 ±106,200 | 5th | A04001 |
| Asian, not Hispanic | 7.3% ±0.1% , number 456,164 ±7,242 | 6.5% ±<0.1% , number 22,096,709 ±58,340 | 9th | A04001 |
*1 is the highest. Population is ranked among all states, and the rest among those of 1,000 people or more, whose figures can be ranked. Ranks use 5-year estimates, the only ones covering every state, so they can differ slightly from the figures here.
Income and work
Higher incomes than the US
The median household income is $107,700, higher than the US ($84,780). 9.6% of people live in poverty, and 6.6% have no health insurance, lower than the US (8.4%).
Household income
Source: ACS 2025 1-year, table A14001.
Show data
| Maryland | United States | |
|---|---|---|
| Under $25,000 | 11.9% ±0.5% , number 288,645 ±12,920 | 14.0% ±0.1% , number 18,727,548 ±88,990 |
| $25,000 to $49,999 | 10.8% ±0.4% , number 262,297 ±10,950 | 15.4% ±0.1% , number 20,665,585 ±101,400 |
| $50,000 to $74,999 | 12.5% ±0.5% , number 302,578 ±11,480 | 15.3% ±0.1% , number 20,513,565 ±88,500 |
| $75,000 to $99,999 | 11.5% ±0.4% , number 279,390 ±9,986 | 12.5% ±0.1% , number 16,814,245 ±87,520 |
| $100,000 to $149,999 | 18.0% ±0.6% , number 438,329 ±14,610 | 17.9% ±0.1% , number 24,018,984 ±99,670 |
| $150,000 to $199,999 | 12.9% ±0.4% , number 313,314 ±10,450 | 10.1% ±0.1% , number 13,521,827 ±70,660 |
| $200,000 or more | 22.4% ±0.4% , number 544,290 ±10,900 | 14.8% ±0.1% , number 19,801,668 ±84,120 |
Embed
What residents do for work
Source: ACS 2025 1-year, table A17004.
Show data
| Maryland | United States | |
|---|---|---|
| Education and health care | 24.7% ±0.5% , number 793,210 ±17,040 | 24.4% ±0.1% , number 40,862,193 ±140,800 |
| Professional and business services | 16.1% ±0.5% , number 518,224 ±15,520 | 12.8% ±0.1% , number 21,375,231 ±87,110 |
| Public administration | 11.3% ±0.3% , number 362,903 ±11,290 | 4.7% ±<0.1% , number 7,944,601 ±69,540 |
| Retail trade | 8.7% ±0.4% , number 279,522 ±12,750 | 10.6% ±0.1% , number 17,781,181 ±96,660 |
| Arts, food and lodging | 7.3% ±0.3% , number 235,379 ±10,130 | 8.9% ±0.1% , number 14,811,502 ±87,840 |
| Construction | 7.2% ±0.3% , number 230,356 ±10,650 | 6.7% ±<0.1% , number 11,254,981 ±79,620 |
| Finance, insurance and real estate | 5.7% ±0.3% , number 184,377 ±9,145 | 6.6% ±<0.1% , number 11,025,569 ±68,570 |
| Other services | 5.4% ±0.3% , number 174,931 ±9,441 | 4.8% ±<0.1% , number 7,958,726 ±65,120 |
Embed
Where workers come from and go
Maryland has 2,613,215 jobs and 2,815,098 employed residents. 308,894 people commute in to work and 510,777 commute out, while 2,304,321 both live and work here. The most commuters come from Virginia.
Most commuters come from
- Virginia: 97,904
- Pennsylvania: 70,391
- District of Columbia: 50,030
Most residents commute to
- District of Columbia: 259,035
- Virginia: 147,012
- Pennsylvania: 30,302
Show data
| Maryland | |
|---|---|
| Live and work here | 2,304,321 |
| Work here, live elsewhere | 308,894 |
| Live here, work elsewhere | 510,777 |
Embed
All the numbers
| Indicator | Maryland | US | Rank among states* | Table |
|---|---|---|---|---|
| Median household income | $107,700 ±$1,661 | $84,780 ±$215 | 3rd | A14006 |
| Income per person | $55,725 ±$642 | $47,171 ±$115 | 6th | A14024 |
| Income inequality (Gini index) | 0.459 ±0.004 | 0.482 ±0.001 | 36th | A14028 |
| Living in poverty | 9.6% ±0.4% , number 590,631 ±24,530 | 11.8% ±0.1% , number 39,264,183 ±277,400 | 47th | A13004 |
| Unemployment rate | 4.8% ±0.3% , number 162,740 ±9,786 | 4.9% ±<0.1% , number 8,574,594 ±64,350 | 26th | A17005 |
| No health insurance | 6.6% ±0.3% , number 407,267 ±16,220 | 8.4% ±<0.1% , number 28,323,306 ±152,000 | 34th | A20001 |
*1 is the highest. Population is ranked among all states, and the rest among those of 1,000 people or more, whose figures can be ranked. Ranks use 5-year estimates, the only ones covering every state, so they can differ slightly from the figures here.
Education
More college degrees than the US
45.5% of adults 25 and over have a bachelor’s degree or more, higher than the US (37.4%).
Highest level of education
Source: ACS 2025 1-year, table A12001.
Show data
| Maryland | United States | |
|---|---|---|
| Less than high school | 8.1% ±0.4% , number 353,442 ±15,600 | 9.4% ±0.1% , number 22,321,002 ±120,500 |
| High school only | 23.5% ±0.5% , number 1,031,071 ±20,280 | 25.6% ±0.1% , number 61,096,726 ±203,400 |
| Some college | 22.9% ±0.5% , number 1,005,298 ±21,640 | 27.7% ±0.1% , number 65,920,977 ±173,500 |
| Bachelor’s degree | 23.6% ±0.4% , number 1,036,383 ±19,620 | 22.3% ±0.1% , number 53,224,312 ±196,700 |
| Graduate degree | 21.8% ±0.4% , number 956,255 ±18,760 | 15.0% ±0.1% , number 35,816,011 ±159,400 |
Embed
All the numbers
| Indicator | Maryland | US | Rank among states* | Table |
|---|---|---|---|---|
| Bachelor’s degree or more | 45.5% ±0.6% , number 1,992,638 ±27,140 | 37.4% ±0.1% , number 89,040,323 ±253,200 | 6th | A12001 |
| High school graduate or more | 91.9% ±0.9% , number 4,029,007 ±40,200 | 90.6% ±0.2% , number 216,058,026 ±368,200 | 29th | A12001 |
*1 is the highest. Population is ranked among all states, and the rest among those of 1,000 people or more, whose figures can be ranked. Ranks use 5-year estimates, the only ones covering every state, so they can differ slightly from the figures here.
Housing
Home values kept pace with incomes
32.7% of households rent, lower than the US (34.7%). The median home is worth $445,800 and the median rent is $1,822. After inflation, home values rose 9% from 2015 to 2025, while household income rose 4%.
Housing costs and income, 2015 to 2025, after inflation
Source: ACS 1-year, table A10036, A18009, A14006.
Show data
| Maryland | United States | |
|---|---|---|
| Median home value | +8.5% | +39.3% |
| Median rent | +4.1% | +18.5% |
| Median household income | +3.6% | +10.9% |
Embed
Types of homes
Source: ACS 2025 1-year, table A10032.
Show data
| Maryland | United States | |
|---|---|---|
| Single-family, detached | 49.9% ±0.6% , number 1,305,177 ±15,220 | 60.9% ±0.1% , number 90,335,844 ±173,300 |
| Single-family, attached | 21.9% ±0.5% , number 573,643 ±13,800 | 6.4% ±<0.1% , number 9,527,703 ±51,230 |
| 2 to 4 units | 3.2% ±0.3% , number 84,569 ±6,712 | 7.5% ±0.1% , number 11,109,005 ±75,790 |
| 5 to 19 units | 12.3% ±0.5% , number 321,560 ±12,880 | 8.7% ±0.1% , number 12,829,882 ±97,590 |
| 20 or more units | 11.3% ±0.4% , number 295,264 ±11,060 | 11.1% ±0.1% , number 16,381,450 ±92,310 |
| Mobile homes and other | 1.3% ±0.1% , number 33,685 ±3,599 | 5.4% ±<0.1% , number 8,045,083 ±53,680 |
Embed
When homes were built
Source: ACS 2025 1-year, table A10055.
Show data
| Maryland | United States | |
|---|---|---|
| 2010 or later | 12.1% ±0.5% , number 293,168 ±11,460 | 15.1% ±0.1% , number 20,257,912 ±101,300 |
| 2000 to 2009 | 12.2% ±0.5% , number 295,908 ±11,100 | 13.8% ±0.1% , number 18,535,840 ±92,260 |
| 1980 to 1999 | 27.2% ±0.7% , number 659,989 ±17,300 | 24.1% ±0.1% , number 32,332,570 ±118,900 |
| 1960 to 1979 | 24.1% ±0.6% , number 586,025 ±14,820 | 22.9% ±0.1% , number 30,726,302 ±110,000 |
| Before 1960 | 24.4% ±0.6% , number 593,753 ±14,120 | 24.0% ±0.1% , number 32,210,798 ±121,500 |
Embed
All the numbers
| Indicator | Maryland | US | Rank among states* | Table |
|---|---|---|---|---|
| Housing units | 2,613,898 | – | – | A10001 |
| Households | 2,428,843 ±9,986 | – | – | A10008 |
| People per household | 2.53 ±0.01 | 2.49 ±0.01 | 10th | A10003 |
| Households that rent | 32.7% ±0.5% , number 793,554 ±13,560 | 34.7% ±0.1% , number 46,551,688 ±193,200 | 28th | A10060 |
| Vacant homes | 7.1% ±0.4% , number 185,055 ±10,020 | 9.6% ±0.1% , number 14,165,545 ±137,100 | 44th | A10047, A10060 |
| Median gross rent | $1,822 ±$22 | $1,557 ±$4 | 8th | A18009 |
| Median home value | $445,800 ±$3,662 | $371,100 ±$646 | 12th | A10036 |
| Renters paying 30% or more of income | 48.8% ±1.6% , number 387,411 ±14,460 | 48.3% ±0.2% , number 22,486,693 ±122,100 | 11th | A18002 |
| Owners paying 30% or more of income | 23.9% ±0.7% , number 390,735 ±12,770 | 24.2% ±0.1% , number 21,201,943 ±93,050 | 15th | A10040 |
| Homes built before 1960 | 24.4% ±0.6% , number 593,753 ±14,120 | 24.0% ±0.1% , number 32,210,798 ±121,500 | 24th | A10055 |
*1 is the highest. Population is ranked among all states, and the rest among those of 1,000 people or more, whose figures can be ranked. Ranks use 5-year estimates, the only ones covering every state, so they can differ slightly from the figures here.
Getting around
How people get around
68.2% of workers drive alone and 13.7% work from home. 52.7% of those who travel to work spend 30 minutes or more getting there, and 9.3% of households have no vehicle.
How people get to work
Source: ACS 2025 1-year, table A09005.
Show data
| Maryland | United States | |
|---|---|---|
| Drive alone | 68.2% ±0.6% , number 2,167,856 ±23,760 | 69.8% ±0.1% , number 115,297,377 ±192,900 |
| Carpool | 8.2% ±0.4% , number 261,685 ±14,380 | 8.9% ±0.1% , number 14,712,170 ±97,240 |
| Public transit | 6.5% ±0.4% , number 207,298 ±11,850 | 4.3% ±<0.1% , number 7,100,386 ±63,330 |
| Walk | 2.0% ±0.2% , number 63,419 ±5,896 | 2.4% ±<0.1% , number 4,016,469 ±41,070 |
| Work from home | 13.7% ±0.4% , number 435,692 ±12,710 | 12.9% ±0.1% , number 21,288,393 ±105,700 |
| Other | 1.4% ±0.2% , number 43,987 ±5,238 | 1.7% ±<0.1% , number 2,799,658 ±41,510 |
Embed
Time spent getting to work
Source: ACS 2025 1-year, table B09001.
Show data
| Maryland | United States | |
|---|---|---|
| Under 10 minutes | 7.3% ±0.4% , number 200,699 ±10,710 | 12.0% ±0.1% , number 17,199,225 ±93,440 |
| 10 to 19 minutes | 21.4% ±0.6% , number 586,236 ±17,250 | 27.8% ±0.1% , number 40,059,540 ±137,700 |
| 20 to 29 minutes | 18.6% ±0.6% , number 511,682 ±16,680 | 21.0% ±0.1% , number 30,221,743 ±111,100 |
| 30 to 39 minutes | 19.0% ±0.6% , number 522,216 ±17,030 | 17.1% ±0.1% , number 24,659,138 ±103,800 |
| 40 to 59 minutes | 18.0% ±0.6% , number 493,095 ±17,230 | 12.6% ±0.1% , number 18,104,709 ±97,070 |
| 60 minutes or more | 15.7% ±0.5% , number 430,317 ±14,650 | 9.5% ±0.1% , number 13,681,705 ±84,440 |
Embed
Vehicles per household
Source: ACS 2025 1-year, table A10030.
Show data
| Maryland | United States | |
|---|---|---|
| None | 9.3% ±0.4% , number 225,555 ±9,856 | 8.8% ±0.1% , number 11,781,997 ±77,240 |
| One | 33.8% ±0.7% , number 819,939 ±16,810 | 33.1% ±0.1% , number 44,424,682 ±160,700 |
| Two | 35.1% ±0.7% , number 852,977 ±16,550 | 36.0% ±0.1% , number 48,200,889 ±176,800 |
| Three or more | 21.8% ±0.6% , number 530,372 ±14,370 | 22.1% ±0.1% , number 29,655,854 ±113,300 |
Embed
All the numbers
| Indicator | Maryland | US | Rank among states* | Table |
|---|---|---|---|---|
| Drive to work alone | 68.2% ±0.6% , number 2,167,856 ±23,760 | 69.8% ±0.1% , number 115,297,377 ±192,900 | 45th | A09005 |
| Take public transit | 6.5% ±0.4% , number 207,298 ±11,850 | 4.3% ±<0.1% , number 7,100,386 ±63,330 | 6th | A09005 |
| Work from home | 13.7% ±0.4% , number 435,692 ±12,710 | 12.9% ±0.1% , number 21,288,393 ±105,700 | 4th | A09005 |
| Commute 30 minutes or more | 52.7% ±0.9% , number 1,445,628 ±28,310 | 39.2% ±0.1% , number 56,445,552 ±165,300 | 3rd | B09001 |
| Households with no vehicle | 9.3% ±0.3% , number 225,555 ±8,273 | 8.8% ±<0.1% , number 11,781,997 ±64,240 | 9th | A10030 |
*1 is the highest. Population is ranked among all states, and the rest among those of 1,000 people or more, whose figures can be ranked. Ranks use 5-year estimates, the only ones covering every state, so they can differ slightly from the figures here.
Places
The largest cities in Maryland
Population, from the latest estimates available. Figures cover the whole of each place.
Largest places
- Baltimore: 569,997
- Columbia: 105,799
- Frederick: 92,045
- Silver Spring: 89,977
- Germantown: 85,326
- Waldorf: 84,488
- Ellicott City: 72,344
- Glen Burnie: 67,231
States like this one
- Virginia: 8,705,170
- Washington: 7,816,116
- Massachusetts: 7,044,056
- Connecticut: 3,624,508
States at least a third this size, with the closest income, education, age, housing and origins.
Every county and place in Maryland
Find any county, city, town, metro area, ZIP code, school district or district in Maryland.
Counties and equivalents
Each of the 24 counties and equivalents with its population, from ACS 2020–2024 5-year estimates.
- Allegany County67,452
- Anne Arundel County598,166
- Baltimore city573,243
- Baltimore County850,796
- Calvert County94,313
- Caroline County33,669
- Carroll County175,321
- Cecil County104,960
- Charles County170,527
- Dorchester County32,754
- Frederick County287,048
- Garrett County28,615
- Harford County263,757
- Howard County336,328
- Kent County19,346
- Montgomery County1.07M
- Prince George's County959,754
- Queen Anne's County51,825
- Somerset County24,822
- St. Mary's County115,126
- Talbot County37,917
- Washington County155,709
- Wicomico County104,914
- Worcester County53,700
Cities, towns and other places
Each of the 527 with its population, from ACS 2020–2024 5-year estimates. Census-designated places are communities without a local government of their own, drawn by the Census Bureau so they can be counted.
- Aberdeen17,298
- Aberdeen Proving Ground2,193
- Abingdon5,019
- Accident351
- Accokeek14,362
- Adamstown2,025
- Adelphi17,395
- Algonquin1,074
- Allen55
- Andrews AFB3,130
- Annapolis40,720
- Annapolis Neck12,032
- Antietam50
- Aquasco719
- Arbutus22,507
- Arden on the Severn1,761
- Arnold24,303
- Ashton-Sandy Spring5,630
- Aspen Hill53,279
- Baden2,325
- Bagtown310
- Ballenger Creek26,390
- Baltimore573,243
- Baltimore Highlands8,206
- Barclay225
- Barnesville208
- Barrelville71
- Barton663
- Bartonsville3,282
- Beaver Creek439
- Bel Air CDP1,837
- Bel Air North31,302
- Bel Air South58,137
- Bel Air town10,585
- Beltsville19,176
- Benedict148
- Bensville15,848
- Berlin5,232
- Berwyn Heights3,318
- Bethesda69,397
- Betterton391
- Bier118
- Big Pool41
- Big Spring21
- Bishopville516
- Bivalve175
- Bladensburg9,583
- Bloomington150
- Boonsboro3,809
- Bowie57,926
- Bowleys Quarters7,006
- Bowling Green966
- Bowmans Addition1,102
- Braddock Heights2,892
- Brandywine12,160
- Breathedsville147
- Brentwood3,777
- Brock Hall13,615
- Brookeville161
- Brooklyn Park16,067
- Brookmont3,671
- Brookview33
- Broomes Island460
- Brown Station3,451
- Brownsville20
- Brunswick8,450
- Bryans Road9,371
- Bryantown325
- Buckeystown1,192
- Burkittsville135
- Burnt Mills3,751
- Burtonsville10,203
- Butlertown511
- Cabin John2,179
- California13,136
- Callaway930
- Calvert Beach1,074
- Calverton17,624
- Cambridge13,152
- Camp Springs22,544
- Cape St. Claire9,236
- Capitol Heights4,020
- Carlos43
- Carney28,343
- Catonsville43,368
- Cavetown858
- Cearfoss86
- Cecilton820
- Cedar Heights2,213
- Cedarville730
- Centreville4,761
- Chance230
- Charlestown1,999
- Charlotte Hall1,172
- Chesapeake Beach6,456
- Chesapeake City810
- Chesapeake Landing509
- Chesapeake Ranch Estates9,241
- Chester4,797
- Chestertown5,594
- Cheverly6,096
- Chevy Chase CDP9,445
- Chevy Chase Section Five803
- Chevy Chase Section Three887
- Chevy Chase town2,906
- Chevy Chase View1,063
- Chevy Chase Village1,903
- Chewsville314
- Chillum34,871
- Choptank186
- Church Creek135
- Church Hill1,060
- Clarksburg30,487
- Clarysville13
- Clear Spring342
- Clinton38,376
- Cloverly16,646
- Cobb Island916
- Cockeysville23,962
- Colesville14,519
- College Park34,540
- Colmar Manor1,566
- Columbia104,338
- Coral Hills9,756
- Cordova448
- Corriganville622
- Cottage City1,158
- Crellin165
- Cresaptown5,121
- Crisfield2,499
- Crofton29,549
- Croom2,418
- Crownsville1,756
- Crumpton248
- Cumberland18,804
- Damascus17,640
- Dames Quarter226
- Danville341
- Dargan135
- Darlington353
- Darnestown7,051
- Dawson180
- Deal Island341
- Deale5,333
- Deer Park288
- Delmar4,261
- Denton4,936
- Derwood1,984
- Detmold116
- District Heights5,891
- Downsville958
- Drum Point3,589
- Dundalk65,969
- Dunkirk2,166
- Eagle Harbor72
- East New Market246
- East Riverdale18,336
- Easton17,308
- Eckhart Mines670
- Eden1,053
- Edesville34
- Edgemere9,061
- Edgemont107
- Edgewater8,519
- Edgewood24,922
- Edmonston1,307
- Eldersburg31,695
- Eldorado30
- Elkridge26,283
- Elkton15,910
- Ellerslie514
- Ellicott City75,257
- Elliott10
- Emmitsburg2,845
- Essex40,580
- Fairland26,231
- Fairlee299
- Fairmount440
- Fairmount Heights1,416
- Fairplay511
- Fairwood7,526
- Fallston10,013
- Federalsburg2,837
- Ferndale17,529
- Finzel740
- Fishing Creek207
- Flintstone8
- Flower Hill13,794
- Forest Glen6,840
- Forest Heights2,642
- Forestville10,495
- Fort Meade11,225
- Fort Washington25,134
- Fountainhead-Orchard Hills6,567
- Four Corners8,150
- Franklin373
- Frederick83,395
- Frenchtown-Rumbly52
- Friendly11,119
- Friendship278
- Friendship Heights Village4,002
- Friendsville416
- Frostburg6,977
- Fruitland5,801
- Fulton5,677
- Funkstown1,076
- Gaithersburg69,825
- Galena728
- Galestown114
- Galesville1,062
- Gambrills2,830
- Gapland26
- Garrett Park932
- Garretts Mill244
- Garrison9,469
- Georgetown8
- Germantown90,719
- Gilmore288
- Girdletree77
- Glassmanor16,981
- Glen Burnie72,590
- Glen Echo276
- Glenarden6,344
- Glenmont17,208
- Glenn Dale13,772
- Golden Beach3,830
- Goldsboro248
- Gorman100
- Graceham121
- Grahamtown537
- Grantsville1,013
- Grasonville3,564
- Green Valley13,602
- Greenbelt24,678
- Greensboro2,634
- Greensburg314
- Hagerstown43,665
- Halfway10,849
- Hampstead6,251
- Hampton5,372
- Hancock1,625
- Havre de Grace14,994
- Hebron1,566
- Henderson132
- Herald Harbor2,430
- Highfield-Cascade1,089
- Highland972
- Highland Beach107
- Hillandale5,060
- Hillcrest Heights16,063
- Hillsboro127
- Honeygo12,250
- Hughesville2,098
- Huntingtown2,689
- Hurlock2,819
- Hutton157
- Hyattsville20,966
- Ilchester28,364
- Indian Head4,055
- Indian Springs61
- Jarrettsville2,560
- Jefferson3,314
- Jennings16
- Jessup9,931
- Jesterville42
- Joppatowne14,237
- Jugtown97
- Keedysville1,183
- Kemp Mill13,042
- Kemps Mill49
- Kennedyville205
- Kensington2,369
- Kent Narrows507
- Kettering14,014
- Kingstown1,713
- Kingsville4,687
- Kitzmiller264
- Klondike54
- Konterra3,641
- La Plata10,683
- La Vale4,196
- Lake Arbor14,335
- Lake Shore18,249
- Landover24,514
- Landover Hills2,031
- Langley Park21,508
- Lanham11,433
- Lansdowne7,876
- Largo12,229
- Laurel29,798
- Layhill5,497
- Laytonsville677
- Leisure World8,882
- Leitersburg498
- Leonardtown4,808
- Lewistown362
- Lexington Park13,252
- Libertytown1,346
- Linganore14,444
- Linthicum11,313
- Lisbon126
- Little Orleans68
- Loch Lynn Heights480
- Lochearn27,074
- Lonaconing889
- Long Beach1,849
- Luke89
- Lusby2,595
- Lutherville6,574
- Madison133
- Manchester5,439
- Mapleville365
- Mardela Springs493
- Marlboro Meadows3,929
- Marlboro Village9,382
- Marlow Heights5,456
- Marlton10,222
- Martin's Additions1,012
- Marydel149
- Maryland City19,186
- Maryland Park839
- Maugansville3,624
- Mayo8,694
- Mays Chapel16,066
- McCoole373
- Mechanicsville1,395
- Melwood3,401
- Mercersville220
- Middle River31,712
- Middletown5,014
- Midland589
- Midlothian377
- Milford Mill30,829
- Millington469
- Mitchellville11,359
- Monrovia3,568
- Montgomery Village34,110
- Morningside976
- Moscow176
- Mount Aetna637
- Mount Airy9,805
- Mount Briar201
- Mount Lena391
- Mount Rainier8,245
- Mount Savage514
- Mount Vernon1,067
- Mountain Lake Park2,167
- Myersville2,358
- Nanticoke434
- Nanticoke Acres142
- National64
- National Harbor4,454
- Naval Academy3,006
- New Carrollton13,564
- New Market1,603
- New Windsor1,400
- Newark244
- Nikep194
- North Beach2,296
- North Bethesda49,677
- North Brentwood624
- North Chevy Chase746
- North East4,134
- North Kensington8,954
- North Laurel25,563
- North Potomac23,922
- Oakland2,254
- Ocean18
- Ocean City6,903
- Ocean Pines12,351
- Odenton45,002
- Oldtown112
- Olney35,797
- Overlea13,035
- Owings2,643
- Owings Mills37,245
- Oxford706
- Oxon Hill17,893
- Paramount-Long Meadow2,569
- Parkville30,549
- Parole17,229
- Parsonsburg166
- Pasadena34,309
- Pecktonville179
- Peppermill Village5,238
- Perry Hall29,105
- Perryman2,174
- Perryville4,447
- Pikesville33,524
- Pinesburg409
- Piney Point1,274
- Pittsville1,950
- Pleasant Grove252
- Pleasant Hills3,836
- Pocomoke City4,405
- Point of Rocks2,462
- Pomfret747
- Pondsville102
- Poolesville5,764
- Port Deposit491
- Port Tobacco Village4
- Potomac45,902
- Potomac Heights1,351
- Potomac Park978
- Powellville230
- Preston852
- Prince Frederick2,955
- Princess Anne3,569
- Pylesville933
- Quantico126
- Queen Anne CDP1,443
- Queen Anne town210
- Queensland2,168
- Queenstown907
- Randallstown35,957
- Rawlings476
- Redland18,665
- Reid120
- Reisterstown25,582
- Ridgely1,772
- Ringgold153
- Rising Sun2,764
- Riva4,976
- Riverdale Park7,270
- Riverside6,585
- Riviera Beach12,192
- Robinwood8,042
- Rock Hall1,215
- Rock Point244
- Rockville67,671
- Rohrersville141
- Romancoke2,064
- Rosaryville12,883
- Rosedale20,002
- Rosemont310
- Rossville16,059
- Sabillasville556
- Salisbury33,285
- San Mar306
- Sandy Hook165
- Savage8,239
- Scaggsville10,564
- Seabrook18,317
- Seat Pleasant4,489
- Secretary635
- Severn58,402
- Severna Park40,228
- Shady Side4,727
- Shaft285
- Sharpsburg585
- Sharptown874
- Silver Hill5,193
- Silver Spring81,462
- Smith Island345
- Smithsburg3,115
- Snow Hill2,659
- Solomons2,440
- Somerset1,088
- South Kensington8,148
- South Laurel29,272
- Spencerville1,028
- Spring Gap49
- Spring Ridge5,922
- Springdale5,226
- St. George Island277
- St. James4,824
- St. Leonard726
- St. Michaels1,240
- Stevensville8,802
- Still Pond102
- Stockton110
- Sudlersville347
- Suitland23,793
- Summerfield15,065
- Sykesville4,491
- Takoma Park17,632
- Tall Timbers391
- Taneytown7,932
- Taylors Island127
- Temple Hills8,969
- Templeville63
- Ten Mile Creek1,184
- Thurmont6,254
- Tilghman Island741
- Tilghmanton282
- Timonium10,304
- Tolchester379
- Towson58,679
- Trappe1,055
- Travilah11,721
- Trego-Rohrersville Station209
- Tyaskin155
- Union Bridge1,055
- University Park2,698
- Upper Marlboro683
- Urbana14,260
- Vale Summit92
- Vienna382
- Waldorf82,943
- Walker Mill10,931
- Walkersville6,414
- Washington Grove577
- West Denton48
- West Laurel4,428
- West Ocean City5,198
- West Pocomoke548
- Westernport1,588
- Westminster20,445
- Westphalia13,228
- Whaleyville198
- Wheaton52,926
- White Marsh10,932
- White Oak17,329
- Whitehaven80
- Wildewood7,552
- Willards1,280
- Williamsport1,949
- Williston391
- Wilson-Conococheague1,663
- Woodland42
- Woodlawn (Baltimore County)40,379
- Woodlawn (Prince George's County)7,750
- Woodmore4,613
- Woodsboro1,540
- Worton126
- Yarrowsburg83
- Zihlman306
Metro and micro areas
Each of the 10 that reach into Maryland, with its whole population, from ACS 2020–2024 5-year estimates. Metro and micro areas are counties tied together by commuting, drawn by the Office of Management and Budget.
- Baltimore-Columbia-Towson, MD Metro Area2.85M
- Cambridge, MD Micro Area32,754
- Cumberland, MD-WV Micro Area94,306
- Easton, MD Micro Area37,917
- Hagerstown-Martinsburg, MD-WV Metro Area302,649
- Lexington Park, MD Metro Area209,439
- Ocean Pines, MD Micro Area53,700
- Philadelphia-Camden-Wilmington, PA-NJ-DE-MD Metro Area6.27M
- Salisbury, MD Metro Area129,736
- Washington-Arlington-Alexandria, DC-VA-MD-WV Metro Area6.32M
ZIP codes
Each of the 470 with people in it, by the town it's centered in, from ACS 2020–2024 5-year estimates. These are the Census Bureau's ZIP Code Tabulation Areas, which follow the Postal Service's ZIP codes as closely as census blocks allow.
- 20601Waldorf26,945
- 20602Waldorf28,331
- 20603Bensville31,844
- 20606Rock Point291
- 20607Accokeek13,750
- 20608Aquasco693
- 20609Rock Point714
- 20611Port Tobacco Village1,219
- 20612Benedict148
- 20613Cedarville17,590
- 20615Broomes Island460
- 20616Bryans Road8,057
- 20617Bryantown334
- 20618Rock Point1,705
- 20619Wildewood14,212
- 20620Callaway1,115
- 20621Rock Point958
- 20622Charlotte Hall5,185
- 20623Rosaryville2,761
- 20624Leonardtown796
- 20625Cobb Island849
- 20626Cobb Island284
- 20628St. George Island503
- 20629Solomons1,150
- 20630Piney Point559
- 20632Port Tobacco Village485
- 20634Callaway7,088
- 20636Wildewood10,486
- 20637Hughesville6,133
- 20639Huntingtown15,544
- 20640Indian Head10,685
- 20645Rock Point814
- 20646Port Tobacco Village21,400
- 20650Leonardtown16,094
- 20653Lexington Park26,852
- 20656Leonardtown87
- 20657Lusby20,699
- 20658Indian Head866
- 20659Mechanicsville24,324
- 20660Mechanicsville14
- 206622,129
- 20664Rock Point3,138
- 20667Lexington Park150
- 20670Lexington Park2,046
- 20674Tall Timbers769
- 20675Pomfret1,796
- 20676St. Leonard3,218
- 20677Port Tobacco Village2,088
- 20678Prince Frederick12,752
- 20680St. George Island663
- 20684St. George Island802
- 20685Broomes Island6,866
- 20686Lexington Park971
- 20687St. George Island415
- 20688Solomons1,290
- 20689Chesapeake Beach1,809
- 20690Tall Timbers1,077
- 20692Tall Timbers505
- 20693Port Tobacco Village1,496
- 20695Bensville16,407
- 20701Jessup513
- 20705Beltsville28,713
- 20706Lanham42,612
- 20707Konterra37,278
- 20708South Laurel27,593
- 20710Bladensburg9,801
- 20711Marlboro Meadows7,731
- 20712Mount Rainier9,563
- 20714North Beach4,525
- 20715Bowie26,915
- 20716Queen Anne CDP22,362
- 20720Bowie25,015
- 20721Woodmore31,032
- 20722Colmar Manor6,264
- 20723North Laurel36,866
- 20724Maryland City19,369
- 20732Chesapeake Beach10,722
- 20733Deale2,669
- 20735Clinton37,464
- 20736Owings9,960
- 20737East Riverdale24,489
- 20740College Park36,847
- 20742College Park4,350
- 20743Walker Mill41,093
- 20744Fort Washington54,441
- 20745Forest Heights28,605
- 20746Suitland27,156
- 20747Forestville38,301
- 20748Temple Hills40,338
- 20751Deale2,851
- 20754Dunkirk7,545
- 20755Fort Meade11,225
- 20758Friendship714
- 20759Fulton6,624
- 20762Andrews AFB3,130
- 20763Savage2,601
- 20764Shady Side2,993
- 20765Galesville668
- 20769Glenn Dale6,947
- 20770Greenbelt28,384
- 20772Croom54,319
- 20774Brock Hall51,816
- 20776Galesville3,315
- 20777Highland3,221
- 20778Galesville2,211
- 20779Friendship883
- 20781Hyattsville13,352
- 20782Hyattsville34,293
- 20783Adelphi50,333
- 20784Woodlawn33,831
- 20785Landover40,066
- 20794Jessup16,814
- 20812Brookmont276
- 20814Bethesda32,795
- 20815Chevy Chase town30,505
- 20816Bethesda18,140
- 20817Bethesda37,454
- 20818Cabin John1,539
- 20832Olney25,553
- 20833Brookeville7,860
- 20837Poolesville6,699
- 20838Barnesville306
- 20839Poolesville158
- 20841Ten Mile Creek9,969
- 20842Barnesville2,369
- 20850Rockville50,353
- 20851Rockville14,946
- 20852North Bethesda48,180
- 20853Aspen Hill31,851
- 20854Travilah50,498
- 20855Redland17,279
- 20860Ashton-Sandy Spring2,035
- 20861Ashton-Sandy Spring2,890
- 20862Brookeville430
- 20866Burtonsville15,986
- 20868Burtonsville198
- 20871Clarksburg30,182
- 20872Damascus13,983
- 20874Darnestown62,738
- 20876Germantown26,406
- 20877Gaithersburg38,546
- 20878North Potomac66,115
- 20879Flower Hill25,264
- 20880Washington Grove577
- 20882Laytonsville13,751
- 20886Montgomery Village34,718
- 20889Bethesda584
- 20895Kensington19,184
- 20896Garrett Park932
- 20899Gaithersburg57
- 20901Four Corners36,435
- 20902Wheaton54,261
- 20903Hillandale24,815
- 20904Colesville58,646
- 20905Spencerville19,004
- 20906Aspen Hill70,595
- 20910Silver Spring45,943
- 20912Takoma Park25,749
- 21001Aberdeen27,168
- 21005Aberdeen Proving Ground2,202
- 21009Bel Air South33,679
- 21010Edgewood239
- 21012Arnold22,570
- 21013Fallston5,610
- 21014Bel Air town38,707
- 21015Bel Air South30,013
- 21017Riverside6,648
- 21023Reisterstown66
- 21028Darlington3,103
- 21029Highland13,607
- 21030Cockeysville25,827
- 21031Cockeysville26
- 21032Crownsville8,850
- 21034Darlington2,846
- 21035Riva7,879
- 21036Highland2,569
- 21037Mayo20,854
- 21040Edgewood24,960
- 21042Ellicott City43,327
- 21043Ellicott City48,525
- 21044Columbia44,114
- 21045Columbia40,034
- 21046Columbia15,608
- 21047Fallston13,852
- 21048Reisterstown10,481
- 21050Bel Air North17,466
- 21051Kingsville172
- 21052Edgemere409
- 210532,929
- 21054Odenton16,386
- 21056Cape St. Claire291
- 21057Carney4,386
- 21060Pasadena39,730
- 21061Glen Burnie57,230
- 21071Reisterstown404
- 21074Hampstead14,777
- 21075Elkridge37,363
- 21076Elkridge24,268
- 21077Severn63
- 21078Havre de Grace20,030
- 21082Kingsville626
- 21084Jarrettsville7,070
- 21085Joppatowne17,307
- 21087Kingsville5,537
- 21090Linthicum10,652
- 21093Mays Chapel39,100
- 21102Manchester12,162
- 21104Sykesville6,052
- 2110536
- 21108Severna Park18,643
- 21111Jarrettsville4,714
- 21113Odenton36,705
- 21114Crofton25,590
- 21117Owings Mills62,816
- 211207,440
- 21122Lake Shore61,566
- 21128Honeygo15,501
- 21130Perryman112
- 21131Cockeysville7,141
- 21132Pylesville3,160
- 21133Randallstown31,398
- 21136Reisterstown32,088
- 21140Riva4,417
- 21144Severn37,118
- 21146Severna Park28,591
- 21152Cockeysville6,459
- 21153Pikesville456
- 21154Pylesville6,544
- 21155Hampstead3,313
- 21156Kingsville204
- 21157Westminster38,984
- 21158Westminster22,083
- 21160Pylesville2,441
- 21161Jarrettsville5,221
- 21162Honeygo4,639
- 21163Randallstown7,539
- 21201Baltimore18,307
- 21202Baltimore20,683
- 21204Towson19,845
- 21205Baltimore13,013
- 21206Baltimore48,902
- 21207Woodlawn47,099
- 21208Pikesville37,276
- 21209Pikesville30,126
- 21210Baltimore14,134
- 21211Baltimore14,969
- 21212Baltimore33,974
- 21213Baltimore28,058
- 21214Baltimore21,092
- 21215Baltimore52,229
- 21216Baltimore29,426
- 21217Baltimore30,792
- 21218Baltimore44,014
- 21219Edgemere9,565
- 21220Middle River42,824
- 21221Essex43,487
- 21222Dundalk59,407
- 21223Baltimore19,572
- 21224Baltimore47,465
- 21225Brooklyn Park34,062
- 21226Baltimore6,674
- 21227Arbutus34,907
- 21228Catonsville50,492
- 21229Baltimore46,679
- 21230Baltimore32,977
- 21231Baltimore14,969
- 21234Carney66,334
- 21236Perry Hall39,514
- 21237Rosedale31,425
- 21239Baltimore27,346
- 21244Milford Mill38,208
- 21250Catonsville2,834
- 21251Baltimore191
- 21252Towson4,865
- 21285Towson3
- 21286Hampton21,853
- 21401Parole38,629
- 21402Naval Academy4,303
- 21403Annapolis Neck32,681
- 21405Arnold495
- 21409Cape St. Claire20,289
- 21502Cumberland41,015
- 21520Accident1,918
- 21521Barton1,400
- 21523Bloomington150
- 21524Corriganville710
- 21529Ellerslie514
- 21530Flintstone1,404
- 21531Friendsville2,487
- 21532Midlothian13,647
- 21536Jennings3,833
- 21538Kitzmiller678
- 21539Lonaconing1,975
- 21540Luke89
- 21541Accident1,335
- 21542Midland84
- 21543Midlothian185
- 21545Barrelville1,694
- 21550Mountain Lake Park13,691
- 21555Oldtown1,470
- 21557Danville1,481
- 21560Spring Gap9
- 21561Bloomington2,412
- 21562Franklin3,032
- 21601Easton24,671
- 21607Barclay597
- 21610Betterton391
- 21612St. Michaels470
- 21613Cambridge17,926
- 21617Centreville10,428
- 21619Chester6,152
- 21620Chestertown13,810
- 21622Church Creek420
- 21623Church Hill2,669
- 21624St. Michaels162
- 21625Cordova1,766
- 21626Elliott256
- 21627Elliott26
- 21628Crumpton248
- 21629Denton10,252
- 21631East New Market2,429
- 21632Federalsburg6,436
- 21634Fishing Creek465
- 21635Galena2,085
- 21636Goldsboro1,097
- 21638Grasonville5,420
- 21639Greensboro4,682
- 21640Henderson1,163
- 21641Hillsboro127
- 21643Hurlock5,392
- 21644Barclay81
- 21645Kennedyville959
- 21647St. Michaels320
- 21648Madison172
- 21649Templeville1,890
- 21650Millington265
- 21651Millington2,290
- 21652Tilghman Island155
- 21653St. Michaels84
- 21654Oxford1,179
- 21655Preston5,053
- 21657Queen Anne town1,354
- 21658Grasonville3,632
- 21659Brookview1,601
- 21660Ridgely4,132
- 21661Rock Hall2,613
- 21662Oxford546
- 21663St. Michaels3,764
- 21664Secretary635
- 21665Tilghman Island229
- 21666Romancoke14,394
- 21667Still Pond291
- 21668Sudlersville2,011
- 21669Taylors Island160
- 21671Tilghman Island727
- 21672Elliott161
- 21673Trappe2,843
- 21675Elliott38
- 21676St. Michaels439
- 21677Church Creek436
- 21678Butlertown1,658
- 21679Cordova306
- 21701Walkersville43,048
- 21702Frederick49,605
- 21703Ballenger Creek41,960
- 21704Bartonsville20,006
- 21705Frederick6
- 21710Buckeystown4,661
- 21711Pecktonville929
- 21713Boonsboro9,846
- 21714Braddock Heights95
- 21715Brownsville20
- 21716Brunswick7,200
- 21717Buckeystown245
- 21718Burkittsville134
- 21719Highfield-Cascade1,178
- 21722Clear Spring6,721
- 21723Sykesville669
- 21727Emmitsburg6,052
- 21733Fairplay1,275
- 21734Funkstown1,076
- 21737Brookeville2,474
- 21738Lisbon3,696
- 21740Hagerstown64,792
- 21742Leitersburg34,069
- 21746Breathedsville2,361
- 21750Hancock3,417
- 21754Urbana8,156
- 21755Jefferson5,909
- 21756Mount Briar3,640
- 21757Union Bridge2,671
- 21758Garretts Mill4,409
- 21762Libertytown139
- 21766Little Orleans854
- 21767Maugansville1,031
- 21769Middletown11,965
- 21770Green Valley8,751
- 21771Mount Airy33,031
- 21773Myersville5,826
- 21774Linganore17,134
- 21776New Windsor6,261
- 21777Point of Rocks2,462
- 21778Graceham745
- 21779Rohrersville1,311
- 21780Sabillasville2,159
- 21781St. James25
- 21782Sharpsburg3,704
- 21783Smithsburg9,910
- 21784Eldersburg39,258
- 21787Taneytown11,645
- 21788Thurmont11,654
- 21790Point of Rocks170
- 21791Union Bridge5,340
- 21793Walkersville10,719
- 21794Sykesville2,192
- 21795Williamsport10,144
- 21797Lisbon8,643
- 21798Woodsboro2,928
- 21801Fruitland30,088
- 21804Salisbury40,430
- 21810Allen55
- 21811Berlin24,377
- 21813Bishopville2,999
- 21814Jesterville217
- 21817Crisfield4,417
- 21821Dames Quarter797
- 21822Eden2,926
- 21824Smith Island264
- 21826Fruitland5,451
- 21829Girdletree396
- 21830Quantico5,200
- 21835East New Market312
- 21837Mardela Springs2,891
- 21838Crisfield1,873
- 21840Nanticoke Acres576
- 21841Newark793
- 21842Ocean City11,226
- 21849Parsonsburg3,388
- 21850Pittsville3,850
- 21851Pocomoke City7,297
- 21853Princess Anne10,537
- 21856Quantico1,037
- 21861Sharptown920
- 21862Bishopville30
- 21863Snow Hill5,281
- 21864Stockton606
- 21865Whitehaven320
- 21866Smith Island81
- 21867Fairmount60
- 21869Tyaskin827
- 21871Fairmount1,764
- 21872Whaleyville661
- 21874Willards1,693
- 21875Delmar7,646
- 21890Princess Anne3,289
- 21901Charlestown19,514
- 21902Perryville340
- 21903Perryville5,692
- 21904Port Deposit6,233
- 21911Rising Sun10,551
- 21912Cecilton1,536
- 21913Cecilton820
- 21914Charlestown810
- 21915Chesapeake City2,471
- 21917Rising Sun2,233
- 21918Darlington4,169
- 21919Cecilton3,626
- 21920Elkton1,413
- 21921Elkton45,527
- 21930Galena25
School districts
Each of the 24 with people in it, from ACS 2020–2024 5-year estimates.
- Allegany County Public Schools67,452
- Anne Arundel County Public Schools598,166
- Baltimore City Public Schools573,243
- Baltimore County Public Schools850,796
- Calvert County Public Schools94,313
- Caroline County Public Schools33,669
- Carroll County Public Schools175,321
- Cecil County Public Schools104,960
- Charles County Public Schools170,527
- Dorchester County Public Schools32,754
- Frederick County Public Schools287,048
- Garrett County Public Schools28,615
- Harford County Public Schools263,757
- Howard County Public Schools336,328
- Kent County Public Schools19,346
- Montgomery County Public Schools1.07M
- Prince George's County Public Schools959,754
- Queen Annes County Public Schools51,825
- Somerset County Public Schools24,822
- St. Marys County Public Schools115,126
- Talbot County Public Schools37,917
- Washington County Public Schools155,709
- Wicomico County Public Schools104,914
- Worcester County Public Schools53,700
Congressional districts
As drawn for the 119th Congress (2025–2027).
- Congressional District 1781,616
- Congressional District 2771,118
- Congressional District 3781,479
- Congressional District 4758,679
- Congressional District 5791,419
- Congressional District 6796,669
- Congressional District 7753,868
- Congressional District 8771,163
State senate districts
The upper chamber’s districts, as drawn in 2024.
- State Senate District 1133,079
- State Senate District 2133,526
- State Senate District 3134,118
- State Senate District 4134,559
- State Senate District 5136,808
- State Senate District 6128,961
- State Senate District 7128,416
- State Senate District 8125,186
- State Senate District 9130,906
- State Senate District 10127,106
- State Senate District 11129,348
- State Senate District 12129,731
- State Senate District 13137,189
- State Senate District 14130,818
- State Senate District 15132,835
- State Senate District 16129,870
- State Senate District 17135,976
- State Senate District 18127,841
- State Senate District 19129,117
- State Senate District 20131,080
- State Senate District 21133,026
- State Senate District 22133,790
- State Senate District 23136,328
- State Senate District 24131,229
- State Senate District 25131,140
- State Senate District 26137,604
- State Senate District 27136,795
- State Senate District 28141,112
- State Senate District 29137,397
- State Senate District 30128,294
- State Senate District 31131,163
- State Senate District 32141,900
- State Senate District 33135,614
- State Senate District 34135,178
- State Senate District 35133,462
- State Senate District 36138,541
- State Senate District 37133,152
- State Senate District 38141,793
- State Senate District 39131,858
- State Senate District 40122,406
- State Senate District 41128,740
- State Senate District 42124,024
- State Senate District 43125,770
- State Senate District 44132,814
- State Senate District 45122,129
- State Senate District 46116,732
- State Senate District 47137,550
State legislative districts
The lower chamber’s districts, as drawn in 2024.
- State Legislative District 3134,118
- State Legislative District 4134,559
- State Legislative District 5136,808
- State Legislative District 6128,961
- State Legislative District 8125,186
- State Legislative District 10127,106
- State Legislative District 13137,189
- State Legislative District 14130,818
- State Legislative District 15132,835
- State Legislative District 16129,870
- State Legislative District 17135,976
- State Legislative District 18127,841
- State Legislative District 19129,117
- State Legislative District 20131,080
- State Legislative District 21133,026
- State Legislative District 22133,790
- State Legislative District 23136,328
- State Legislative District 24131,229
- State Legislative District 25131,140
- State Legislative District 26137,604
- State Legislative District 28141,112
- State Legislative District 31131,163
- State Legislative District 32141,900
- State Legislative District 36138,541
- State Legislative District 39131,858
- State Legislative District 40122,406
- State Legislative District 41128,740
- State Legislative District 45122,129
- State Legislative District 46116,732
- State Legislative Subdistrict 1A42,433
- State Legislative Subdistrict 1B46,762
- State Legislative Subdistrict 1C43,884
- State Legislative Subdistrict 2A89,565
- State Legislative Subdistrict 2B43,961
- State Legislative Subdistrict 7A82,878
- State Legislative Subdistrict 7B45,538
- State Legislative Subdistrict 9A87,826
- State Legislative Subdistrict 9B43,080
- State Legislative Subdistrict 11A42,775
- State Legislative Subdistrict 11B86,573
- State Legislative Subdistrict 12A84,787
- State Legislative Subdistrict 12B44,944
- State Legislative Subdistrict 27A43,191
- State Legislative Subdistrict 27B48,211
- State Legislative Subdistrict 27C45,393
- State Legislative Subdistrict 29A44,394
- State Legislative Subdistrict 29B45,910
- State Legislative Subdistrict 29C47,093
- State Legislative Subdistrict 30A86,245
- State Legislative Subdistrict 30B42,049
- State Legislative Subdistrict 33A43,155
- State Legislative Subdistrict 33B46,675
- State Legislative Subdistrict 33C45,784
- State Legislative Subdistrict 34A89,965
- State Legislative Subdistrict 34B45,213
- State Legislative Subdistrict 35A88,087
- State Legislative Subdistrict 35B45,375
- State Legislative Subdistrict 37A40,459
- State Legislative Subdistrict 37B92,693
- State Legislative Subdistrict 38A49,729
- State Legislative Subdistrict 38B45,579
- State Legislative Subdistrict 38C46,485
- State Legislative Subdistrict 42A41,856
- State Legislative Subdistrict 42B40,113
- State Legislative Subdistrict 42C42,055
- State Legislative Subdistrict 43A83,236
- State Legislative Subdistrict 43B42,534
- State Legislative Subdistrict 44A44,499
- State Legislative Subdistrict 44B88,315
- State Legislative Subdistrict 47A91,809
- State Legislative Subdistrict 47B45,741
PUMAs
Public Use Microdata Areas: areas of 100,000 people or more that the state draws from census tracts, for the Census Bureau’s microdata.
- Allegany, Garrett & West Washington Counties–Hancock & Clear Spring PUMA110,844
- Calvert & Southeast St. Mary's Counties–Chesapeake Beach & California PUMA105,547
- Carroll County–Westminster City PUMA175,321
- Cecil County–Elkton PUMA104,960
- Central Anne Arundel County PUMA113,830
- Central Frederick County–Frederick City PUMA146,466
- Central Howard County–Columbia PUMA103,920
- Central Montgomery County–Gaithersburg & Rockville PUMA167,290
- Central Prince George's County–Seat Pleasant City, Capitol Heights Town & Landover PUMA116,524
- Central St. Mary's County–Lexington Park City & Leonardtown PUMA103,892
- Central Washington County–Hagerstown City PUMA140,932
- Charles County–La Plata Town & Waldorf City PUMA170,527
- East Anne Arundel County–Severna Park, Arnold & Lake Shore PUMA110,432
- East Baltimore City–Inner Harbor, Canton & Bayview PUMA97,419
- East Central Baltimore County–Towson, Parkville & Carney PUMA106,719
- East Central Montgomery County–Wheaton, Aspen Hill & Glenmont PUMA147,505
- East Howard County–Ellicott City (Southeast), North Laurel & Elkridge PUMA109,025
- East Montgomery County–Fairland, Colesville & White Oak PUMA122,837
- East Prince George's County–Bowie City, Kettering & Largo PUMA196,488
- Inner East Baltimore County–Middle River, Rosedale & White Marsh PUMA104,757
- Inner Northeast Prince George's County–New Carrollton & Hyattsville PUMA120,587
- Inner Northwest Prince George's County–College Park City & Langley Park PUMA129,371
- Inner West Baltimore County–Randallstown, Owings Mills & Milford Mill PUMA163,415
- North Anne Arundel County–Glen Burnie, Pasadena, Ferndale & Brooklyn Park PUMA124,449
- North Central Baltimore City–Guilford, Roland Park & Druid Lake PUMA108,991
- North Central Montgomery County–Germantown, Clarksburg & Montgomery Village PUMA167,828
- North Harford County–Bel Air Town, Fallston & Jarrettsville PUMA141,249
- North Montgomery County–Olney, Damascus & Darnestown PUMA115,713
- North Prince George's County–Laurel, Greenbelt & Beltsville PUMA145,892
- Northeast Baltimore City–Frankford, Belair-Edison & Loch Raven PUMA119,805
- Northwest Anne Arundel County–Severn, Odenton & Crofton PUMA130,055
- Northwest Baltimore City–Sandtown, Winchester, Ashburton & Mount Washington PUMA137,247
- Outer Baltimore County PUMA108,153
- Outer Frederick County PUMA140,582
- Queen Anne's, Talbot, Caroline, Dorchester & Kent Counties PUMA175,511
- South Harford County–Aberdeen, Havre de Grace Cities PUMA122,508
- South Montgomery County–South Bethesda & Chevy Chase PUMA102,228
- South Prince George's County–Clinton, Fort Washington & Rosaryville PUMA136,335
- Southeast Anne Arundel County–Annapolis City, Parole & Annapolis Neck PUMA119,400
- Southeast Baltimore County–Dundalk, Essex, Edgemere PUMA137,087
- Southeast Montgomery County–Takoma Park City & Silver Spring PUMA118,958
- Southwest Baltimore City–Irvington, Ten Hills & Cherry Hill PUMA109,781
- Southwest Baltimore County–Catonsville, Woodlawn & Arbutus PUMA121,791
- Southwest Montgomery County–North Bethesda & Potomac PUMA123,590
- Southwest Prince George's County–Oxon Hill, Hillcrest Heights & Temple Hills PUMA114,557
- West Central Baltimore County–Pikesville, Towson & Cockeysville PUMA108,874
- West Howard County–Ellicott City (North & West), Fulton & Highland PUMA123,383
- Wicomico, Worcester & Somerset Counties–Salisbury City PUMA183,436
Urban areas
Each that reaches into Maryland, with its whole population. Urban areas are the densely settled land the Census Bureau draws after each census, whatever the city lines.
- Baltimore, MD2.21M
- Bel Air–Aberdeen, MD217,891
- Brunswick, MD8,684
- Cambridge, MD14,934
- Chesapeake Beach, MD18,251
- Chestertown, MD7,402
- Crisfield, MD3,595
- Cumberland, MD–WV–PA45,480
- Denton, MD5,102
- Easton, MD18,499
- Eldersburg, MD29,544
- Frederick, MD188,291
- Hagerstown, MD–WV–PA–VA201,864
- Hampstead–Manchester, MD14,086
- Indian Head, MD6,257
- Keyser, WV–MD5,661
- La Plata, MD10,943
- Leonardtown, MD5,768
- Lexington Park–California–Chesapeake Ranch Estates, MD63,449
- Mountain Lake Park, MD4,861
- Ocean Pines–Ocean City, MD–DE38,730
- Philadelphia, PA–NJ–DE–MD5.73M
- Poolesville, MD5,680
- Princess Anne, MD6,528
- Rising Sun, MD5,600
- Salisbury, MD–DE77,783
- Stevensville–Chester–Romancoke, MD19,992
- Taneytown, MD7,842
- Thurmont, MD6,569
- Urbana, MD12,903
- Waldorf, MD121,596
- Washington–Arlington, DC–VA–MD5.17M
- Waynesboro, PA–MD23,403
- Westminster, MD41,008
Turn Maryland into your planning report.
Social Explorer Studio builds an editable profile of any place, with tables and charts beside the county and state, and exports to Word, PDF and Excel.
Questions about Maryland
What is the population of Maryland?
6,265,347 people, according to the ACS 2025 1-year estimates, which the Census Bureau adjusts to match its own population estimate. That’s the 18th largest of the 50 states and DC.
What is the FIPS code for Maryland?
24. Every county’s and place’s FIPS code in Maryland starts with it. The Census Bureau’s full geographic identifier (GEOID) is 0400000US24.
What is the largest city in Maryland?
Baltimore, with 569,997 people. Other large places here include Columbia, Frederick and Silver Spring.
What is the median household income in Maryland?
$107,700 (±$1,661), according to the ACS 2025 1-year estimates, higher than the US ($84,780).
What is the median age in Maryland?
39.9 years (±0.2), according to the ACS 2025 1-year estimates, higher than the US (39.5).
How much does housing cost in Maryland?
Maryland’s median home value is $445,800 (±$3,662) and its median gross rent is $1,822 (±$22) a month, according to the ACS 2025 1-year estimates. 48.8% (±1.6%) of its renters pay 30% or more of their income on rent.
Is Maryland growing?
Maryland’s population grew 4.3%, from 6,006,401 in 2015 to 6,265,347 in 2025, according to the ACS 1-year estimates.
Where do people who work in Maryland live?
2,304,321 of its 2,613,215 jobs are held by people who live here. Of those who commute in, the most come from Virginia, Pennsylvania, District of Columbia.
Where does this census data come from?
The U.S. Census Bureau’s American Community Survey, through Social Explorer’s tables: the latest 1-year estimates where they exist, for the most recent numbers, and 5-year estimates otherwise. Each table lists its code, so you can find it again.
Is this data free to use?
Yes. You can read it, cite it, download the CSV and embed the charts, with no account. To map other variables, compare your own areas or build a report, see Social Explorer’s plans in a live demo.
Sources and how to cite
American Community Survey 2025 1-year estimates, or 2020–2024 5-year estimates where noted, U.S. Census Bureau, from Social Explorer’s tables A00001, A00002, A01004, A04001, A06001, A08001, A09005, A10001, A10003, A10008, A10030, A10036, A10040, A10047, A10055, A10060, A12001, A13004, A14006, A14024, A14028, A16002, A17005, A18002, A18009, A20001, B02002, B09001, B13002, B18101, C16001. Maps by census tract use 2020–2024 5-year estimates, since the 1-year survey doesn’t cover tracts. Commuting: LEHD LODES 2023. These are estimates from a sample, each with its margin of error. Data retrieved November 14, 2026. How these profiles are made.
U.S. Census Bureau, American Community Survey 2025 1-year estimates, or 2020–2024 5-year estimates where noted, via Social Explorer. “Maryland.” https://www.socialexplorer.com/places/maryland. Accessed November 14, 2026.