

Louisiana: Population, demographics and census data
Home to 4,618,189 people, the 25th largest of the 50 states and DC, anchored by New Orleans. It fell 1.1% between 2015 and 2025.
- Population
- 4.62M. Census Bureau estimate · Rank 25 of the 50 states and DC
- Median household income
- $65,139 ±$1,183. US $84,780
- Median age
- 39.4 ±0.3. US 39.5
ACS 2025 1-year estimates, U.S. Census Bureau
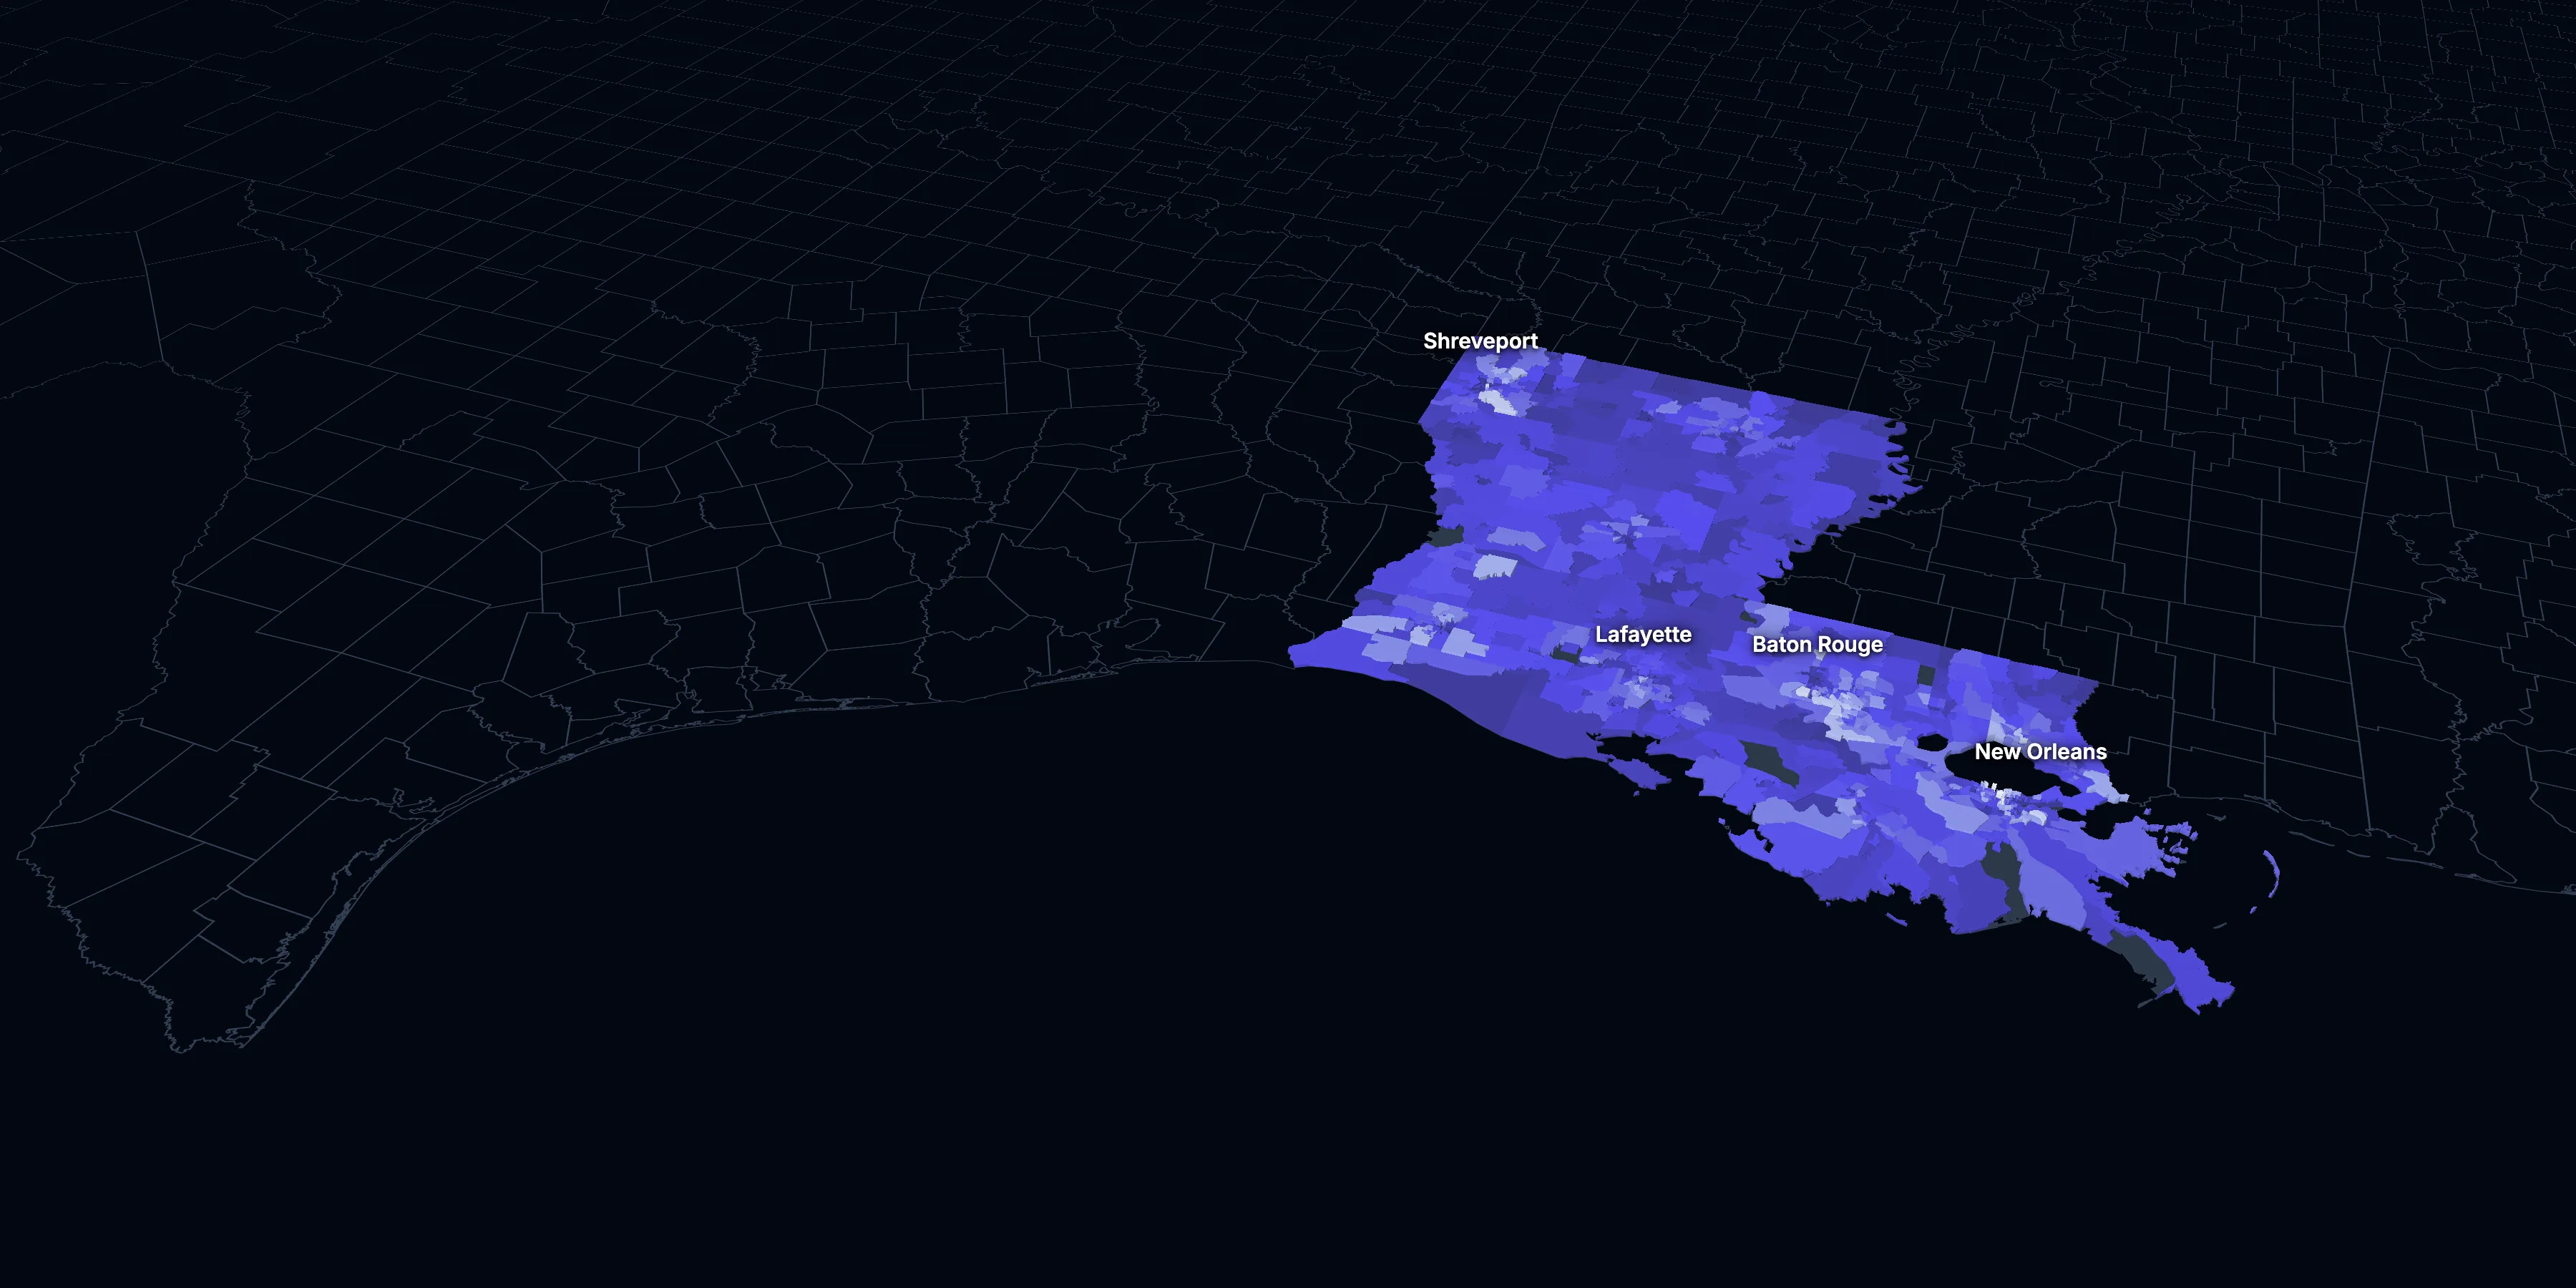
Taller, lighter tracts have higher household incomes
About Louisiana
Louisiana’s median household income is $65,139 (±$1,183), lower than the US ($84,780), and its median age is 39.4 (±0.3), according to the ACS 2025 1-year estimates. Its largest city is New Orleans.
± is each figure’s margin of error, at 90% confidence, and † marks one too uncertain to lean on. Under each percentage in the tables is the number it counts. How the margins are worked out.
FIPS code 22
Highlights
What stands out in Louisiana
The numbers where Louisiana sits furthest from the nation, or past a recognized policy benchmark.
Past a policy benchmark
18.1%
ElevatedLiving in poverty
That’s higher than the US (11.8%). HUD and the New Markets Tax Credit use 20% poverty to mark low-income areas. It’s the highest of the 50 states and DC.
Furthest from the national picture
30.5%
2.5× the USBlack, not Hispanic
That’s higher than the US (11.7%). It’s the 4th highest of the 50 states and DC.
17.3%
Higher than the USLiving with a disability
That’s higher than the US (13.7%).
5.0%
Very lowBorn outside the US
That’s lower than the US (14.7%).
8.4%
Very lowSpeak a language other than English at home
That’s lower than the US (22.9%).
$65,139
3rd lowest among statesMedian household income
That’s lower than the US ($84,780). It’s the 3rd lowest of the 50 states and DC.
2015 to 2025
How Louisiana changed in ten years
The state lost 52,535 people. It got older, more foreign-born and better educated, and poverty fell 1.5 points.
Population, change since 2015
−1.1% in the state and +6.3% in the US.
Source: ACS 1-year, 2015 to 2025, table A00001.
Show data
| Louisiana | United States | |
|---|---|---|
| 2015 | 0.0% | 0.0% |
| 2016 | +0.2% | +0.5% |
| 2017 | +0.3% | +1.3% |
| 2018 | −0.2% | +1.8% |
| 2019 | −0.5% | +2.1% |
| 2021 | −1.0% | +3.3% |
| 2022 | −1.7% | +3.7% |
| 2023 | −2.1% | +4.2% |
| 2024 | −1.6% | +5.8% |
| 2025 | −1.1% | +6.3% |
Embed
Median household income, in 2025 dollars
+4.0% in the state and +10.9% in the US.
Source: ACS 1-year, 2015 to 2025, table A14006.
Show data
| Louisiana | United States | |
|---|---|---|
| 2015 | $62,647 | $76,413 |
| 2016 | $61,063 | $77,931 |
| 2017 | $61,101 | $79,891 |
| 2018 | $61,922 | $80,059 |
| 2019 | $64,842 | $83,427 |
| 2021 | $62,400 | $83,521 |
| 2022 | $61,388 | $82,811 |
| 2023 | $61,949 | $82,683 |
| 2024 | $63,030 | $84,339 |
| 2025 | $65,139 | $84,780 |
Embed
Living in poverty
−1.5 points in the state and −3.0 points in the US.
Source: ACS 1-year, 2015 to 2025, table A13004.
Show data
| Louisiana | United States | |
|---|---|---|
| 2015 | 19.6% | 14.7% |
| 2016 | 20.2% | 14.0% |
| 2017 | 19.7% | 13.4% |
| 2018 | 18.6% | 13.1% |
| 2019 | 19.0% | 12.3% |
| 2021 | 19.6% | 12.8% |
| 2022 | 18.6% | 12.6% |
| 2023 | 18.9% | 12.5% |
| 2024 | 18.7% | 12.1% |
| 2025 | 18.1% | 11.8% |
Embed
Bachelor’s degree or more
+5.1 points in the state and +6.7 points in the US.
Source: ACS 1-year, 2015 to 2025, table A12001.
Show data
| Louisiana | United States | |
|---|---|---|
| 2015 | 23.2% | 30.6% |
| 2016 | 23.4% | 31.3% |
| 2017 | 23.8% | 32.0% |
| 2018 | 24.3% | 32.6% |
| 2019 | 25.0% | 33.1% |
| 2021 | 26.4% | 35.0% |
| 2022 | 27.1% | 35.7% |
| 2023 | 27.0% | 36.2% |
| 2024 | 27.8% | 36.8% |
| 2025 | 28.3% | 37.4% |
Embed
Median gross rent, in 2025 dollars
+0.8% in the state and +18.5% in the US.
Source: ACS 1-year, 2015 to 2025, table A18009.
Show data
| Louisiana | United States | |
|---|---|---|
| 2015 | $1,096 | $1,314 |
| 2016 | $1,093 | $1,327 |
| 2017 | $1,107 | $1,340 |
| 2018 | $1,104 | $1,368 |
| 2019 | $1,099 | $1,393 |
| 2021 | $1,107 | $1,427 |
| 2022 | $1,090 | $1,440 |
| 2023 | $1,085 | $1,496 |
| 2024 | $1,100 | $1,537 |
| 2025 | $1,105 | $1,557 |
Embed
Median home value, in 2025 dollars
+8.7% in the state and +39.3% in the US.
Source: ACS 1-year, 2015 to 2025, table A10036.
Show data
| Louisiana | United States | |
|---|---|---|
| 2015 | $213,175 | $266,469 |
| 2016 | $213,707 | $277,278 |
| 2017 | $215,166 | $288,124 |
| 2018 | $216,250 | $296,908 |
| 2019 | $218,496 | $305,336 |
| 2021 | $230,973 | $337,116 |
| 2022 | $231,744 | $355,481 |
| 2023 | $229,372 | $361,931 |
| 2024 | $230,680 | $372,685 |
| 2025 | $231,800 | $371,100 |
Embed
ACS 1-year estimates. The dotted stretch of each line spans 2020, when the Census Bureau released no standard 1-year estimates. Dollar values are in 2025 dollars.
| Indicator | 2015 | 2025 | Change |
|---|---|---|---|
| Population | 4,670,724 | 4,618,189 | −1.1% |
| Median age | 36.4 | 39.4 | +3.0 years |
| 65 and over | 14.0% | 19.0% | +5.0 points |
| Born outside the US | 4.0% | 5.0% | +1.0 points |
| Hispanic or Latino | 4.9% | 8.1% | +3.3 points |
| Median household income | $62,647 | $65,139 | +4.0% |
| Living in poverty | 19.6% | 18.1% | −1.5 points |
| Bachelor’s degree or more | 23.2% | 28.3% | +5.1 points |
| Households that rent | 35.4% | 32.0% | −3.4 points |
| Median gross rent | $1,096 | $1,105 | +0.8% |
| Median home value | $213,175 | $231,800 | +8.7% |
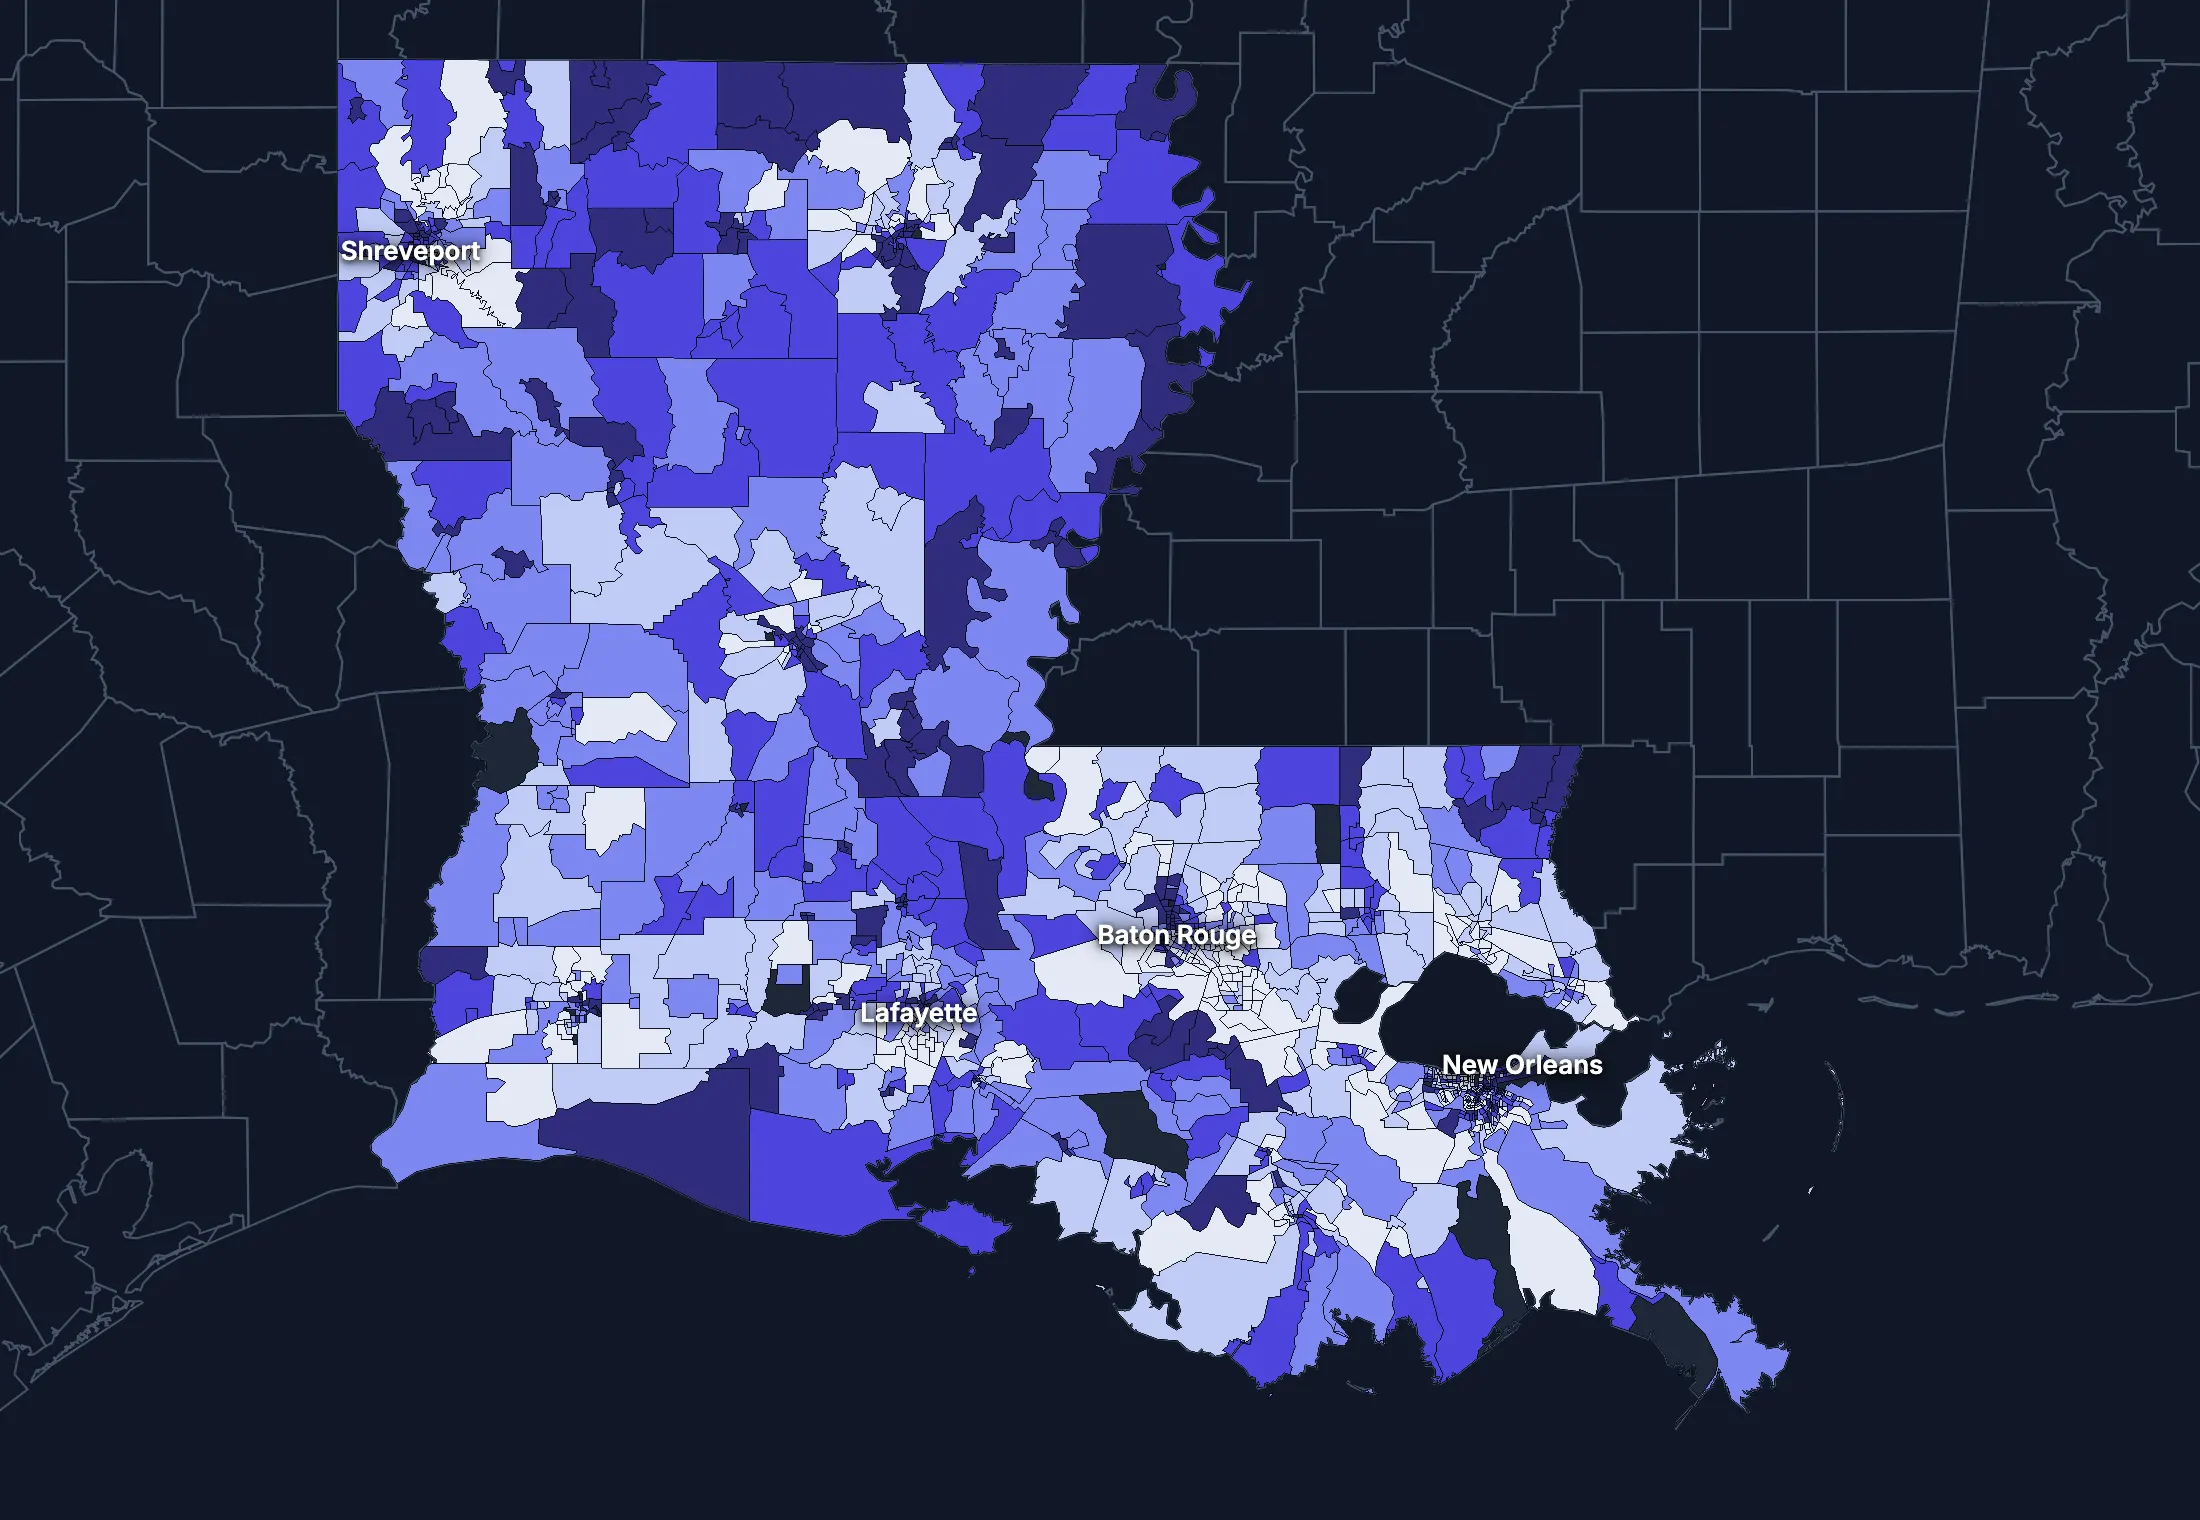
1388 census tracts
Louisiana, tract by tract
State averages hide a lot. These census tracts are the closest the census comes to neighborhoods.
Where the state’s average misleads
Each tick is one census tract, and the dark line marks the state. Hover over a tick or tap it to see the tract.
Poverty
326 of 1363 tracts are at least 1.5 times the state’s overall 18.9%, and 432 are at two-thirds of it or less.
Highest: Tract 44.02, 84.2%. Lowest: Tract 303.04, 0.2%.
Renters paying 30% or more of income
105 of 1314 tracts are at least 1.5 times the state’s overall 47.8%, and 358 are at two-thirds of it or less.
Highest: Tract 303.02, 100.0%. Lowest: Tract 9603, 0.0%.
Adults with a bachelor’s degree
263 of 1365 tracts are at least 1.5 times the state’s overall 27.0%, and 551 are at two-thirds of it or less.
Highest: Tract 121.02, 89.6%. Lowest: Tract 234.01, 0.8%.
Median household income
234 of 1343 tracts are at least 1.5 times the typical tract’s $58,750, and 278 are at two-thirds of it or less.
Highest: Tract 116, $222,917. Lowest: Tract 17.51, $11,473.
American Community Survey 2020–2024 5-year estimates, by census tract. Income is capped at $250,000+ by the Census Bureau.
People
Who lives in Louisiana
Its median age of 39.4 is about the same as the US (39.5). 5.0% of residents were born outside the US, and 8.4% speak a language other than English at home.
Age
Source: ACS 2025 1-year, table A01001.
Show data
| Louisiana | United States | |
|---|---|---|
| Under 18 | 22.6% ±0.4% , number 1,044,487 ±16,350 | 21.0% ±<0.1% , number 71,689,151 ±111,800 |
| 18 to 24 | 9.2% ±0.3% , number 424,137 ±13,770 | 9.3% ±<0.1% , number 31,716,680 ±98,660 |
| 25 to 34 | 12.5% ±0.2% , number 578,634 ±9,855 | 13.6% ±<0.1% , number 46,357,354 ±55,690 |
| 35 to 44 | 13.3% ±0.3% , number 616,262 ±15,000 | 13.4% ±<0.1% , number 45,746,189 ±105,700 |
| 45 to 54 | 11.4% ±0.2% , number 527,532 ±9,740 | 11.8% ±<0.1% , number 40,257,563 ±53,540 |
| 55 to 64 | 11.9% ±0.3% , number 548,797 ±11,750 | 12.1% ±<0.1% , number 41,242,904 ±104,700 |
| 65 to 74 | 11.3% ±0.2% , number 520,235 ±10,820 | 10.8% ±<0.1% , number 36,895,650 ±91,520 |
| 75 and over | 7.8% ±0.2% , number 358,105 ±8,522 | 8.2% ±<0.1% , number 27,879,368 ±78,140 |
Embed
Race and ethnicity
Source: ACS 2025 1-year, table A04001.
Show data
| Louisiana | United States | |
|---|---|---|
| White, not Hispanic | 53.8% ±0.1% , number 2,482,919 ±6,655 | 55.0% ±<0.1% , number 187,959,031 ±58,340 |
| Hispanic or Latino | 8.1% ±0.1% , number 376,295 ±3,221 | 20.5% ±<0.1% , number 69,975,516 ±13,270 |
| Black, not Hispanic | 30.5% ±0.3% , number 1,408,896 ±12,160 | 11.7% ±<0.1% , number 40,096,453 ±106,200 |
| Asian, not Hispanic | 2.0% ±0.1% , number 91,946 ±3,665 | 6.5% ±<0.1% , number 22,096,709 ±58,340 |
| Other or multiracial | 5.6% ±0.3% , number 258,133 ±15,210 | 6.3% ±<0.1% , number 21,657,150 ±150,100 |
Embed
Language spoken at home
Source: ACS 2025 1-year, table C16001.
Show data
| Louisiana | United States | |
|---|---|---|
| English only | 91.6% ±0.3% , number 3,982,835 ±14,310 | 77.1% ±0.1% , number 249,390,588 ±275,300 |
| Spanish | 4.9% ±0.3% , number 214,796 ±12,300 | 13.9% ±0.1% , number 44,921,985 ±177,800 |
| Other Indo-European | 1.8% ±0.1% , number 79,906 ±6,304 | 4.0% ±<0.1% , number 12,862,980 ±113,500 |
| Asian and Pacific Island | 1.4% ±0.1% , number 58,796 ±6,290 | 3.8% ±<0.1% , number 12,288,841 ±99,740 |
| Arabic and other | 0.2% ±0.1% , number 10,629 ±3,091 | 1.3% ±<0.1% , number 4,116,949 ±71,480 |
Embed
Marital status
Source: ACS 2025 1-year, table A11001.
Show data
| Louisiana | United States | |
|---|---|---|
| Now married | 44.6% ±0.6% , number 1,673,600 ±21,410 | 47.9% ±0.1% , number 135,567,564 ±223,300 |
| Never married | 36.3% ±0.5% , number 1,362,719 ±17,280 | 34.8% ±0.1% , number 98,647,238 ±152,600 |
| Divorced | 10.9% ±0.3% , number 409,166 ±12,700 | 10.2% ±<0.1% , number 28,879,967 ±112,900 |
| Widowed | 6.4% ±0.2% , number 239,537 ±8,639 | 5.5% ±<0.1% , number 15,599,094 ±69,430 |
| Separated | 1.9% ±0.2% , number 71,155 ±6,345 | 1.6% ±<0.1% , number 4,441,399 ±49,160 |
Embed
Where people lived a year ago
Source: ACS 2025 1-year, table A08001.
Show data
| Louisiana | United States | |
|---|---|---|
| Same home | 89.4% ±0.6% , number 4,082,184 ±26,130 | 88.4% ±0.1% , number 298,889,697 ±214,800 |
| Same county | 5.9% ±0.4% , number 267,358 ±19,570 | 6.0% ±<0.1% , number 20,202,671 ±166,300 |
| Another county in the state | 2.8% ±0.3% , number 126,919 ±11,850 | 3.0% ±<0.1% , number 10,168,097 ±89,190 |
| Another state | 1.5% ±0.2% , number 68,408 ±8,567 | 2.1% ±<0.1% , number 7,025,589 ±81,660 |
| Another country | 0.5% ±0.1% , number 20,607 ±6,194 | 0.6% ±<0.1% , number 1,984,943 ±47,210 |
Embed
Top countries of birth, among those born abroad
Source: ACS 2020–2024 5-year, table A07001.
Show data
| Louisiana | |
|---|---|
| Honduras | 22.8% , number 51,209 |
| Mexico | 12.7% , number 28,414 |
| Vietnam | 7.5% , number 16,891 |
| Guatemala | 3.5% , number 7,864 |
| India | 3.4% , number 7,632 |
| Cuba | 3.3% , number 7,510 |
Embed
All the numbers
| Indicator | Louisiana | US | Rank among states* | Table |
|---|---|---|---|---|
| Population | 4,618,189 | 341,784,859 | 25th | A00001 |
| People per square mile | 107 | 97 | 27th | A00002 |
| Land area (square miles) | 43,215 | – | – | A00002 |
| Median age | 39.4 ±0.3 | 39.5 ±0.1 | 38th | A01004 |
| Under 18 | 22.6% ±0.4% , number 1,044,487 ±16,350 | 21.0% ±<0.1% , number 71,689,151 ±111,800 | 10th | B02002 |
| 65 and over | 19.0% ±0.3% , number 878,340 ±13,780 | 19.0% ±<0.1% , number 64,775,018 ±120,300 | 38th | B02002 |
| Born outside the US | 5.0% ±0.2% , number 230,207 ±10,940 | 14.7% ±0.1% , number 50,409,320 ±204,800 | 40th | A06001 |
| Speak a language other than English at home | 8.4% ±0.3% , number 364,127 ±15,500 | 22.9% ±0.1% , number 74,190,755 ±244,000 | 36th | C16001 |
| Veterans (adults) | 6.1% ±0.2% , number 215,419 ±8,628 | 5.9% ±<0.1% , number 15,746,228 ±85,320 | 40th | A16002 |
| Living with a disability | 17.3% ±0.4% , number 783,397 ±17,000 | 13.7% ±<0.1% , number 46,271,455 ±126,000 | 8th | B18101 |
| Women 15–50 who had a baby in the past year | 5.3% ±0.5% , number 57,998 ±5,584 | 5.0% ±0.1% , number 4,016,759 ±44,040 | 11th | B13002 |
| Lived in the same home a year ago | 89.4% ±0.6% , number 4,082,184 ±26,130 | 88.4% ±0.1% , number 298,889,697 ±214,800 | 15th | A08001 |
| White, not Hispanic | 53.8% ±0.1% , number 2,482,919 ±6,655 | 55.0% ±<0.1% , number 187,959,031 ±58,340 | 38th | A04001 |
| Hispanic or Latino | 8.1% ±0.1% , number 376,295 ±3,221 | 20.5% ±<0.1% , number 69,975,516 ±13,270 | 37th | A04001 |
| Black, not Hispanic | 30.5% ±0.3% , number 1,408,896 ±12,160 | 11.7% ±<0.1% , number 40,096,453 ±106,200 | 4th | A04001 |
| Asian, not Hispanic | 2.0% ±0.1% , number 91,946 ±3,665 | 6.5% ±<0.1% , number 22,096,709 ±58,340 | 39th | A04001 |
*1 is the highest. Population is ranked among all states, and the rest among those of 1,000 people or more, whose figures can be ranked. Ranks use 5-year estimates, the only ones covering every state, so they can differ slightly from the figures here.
Income and work
Lower incomes than the US
The median household income is $65,139, lower than the US ($84,780). 18.1% of people live in poverty, and 8.1% have no health insurance, about the same as the US (8.4%).
Household income
Source: ACS 2025 1-year, table A14001.
Show data
| Louisiana | United States | |
|---|---|---|
| Under $25,000 | 21.1% ±0.7% , number 391,862 ±12,910 | 14.0% ±0.1% , number 18,727,548 ±88,990 |
| $25,000 to $49,999 | 18.6% ±0.7% , number 345,347 ±12,480 | 15.4% ±0.1% , number 20,665,585 ±101,400 |
| $50,000 to $74,999 | 16.2% ±0.6% , number 300,731 ±11,430 | 15.3% ±0.1% , number 20,513,565 ±88,500 |
| $75,000 to $99,999 | 11.9% ±0.5% , number 221,163 ±9,442 | 12.5% ±0.1% , number 16,814,245 ±87,520 |
| $100,000 to $149,999 | 15.3% ±0.6% , number 283,780 ±11,020 | 17.9% ±0.1% , number 24,018,984 ±99,670 |
| $150,000 to $199,999 | 8.2% ±0.5% , number 151,448 ±8,944 | 10.1% ±0.1% , number 13,521,827 ±70,660 |
| $200,000 or more | 8.7% ±0.4% , number 161,516 ±7,559 | 14.8% ±0.1% , number 19,801,668 ±84,120 |
Embed
What residents do for work
Source: ACS 2025 1-year, table A17004.
Show data
| Louisiana | United States | |
|---|---|---|
| Education and health care | 25.7% ±0.6% , number 535,179 ±12,790 | 24.4% ±0.1% , number 40,862,193 ±140,800 |
| Retail trade | 10.7% ±0.5% , number 223,543 ±10,720 | 10.6% ±0.1% , number 17,781,181 ±96,660 |
| Professional and business services | 10.5% ±0.5% , number 219,244 ±10,030 | 12.8% ±0.1% , number 21,375,231 ±87,110 |
| Arts, food and lodging | 10.0% ±0.6% , number 208,894 ±12,350 | 8.9% ±0.1% , number 14,811,502 ±87,840 |
| Manufacturing | 8.4% ±0.5% , number 175,636 ±9,969 | 9.6% ±0.1% , number 16,064,394 ±91,270 |
| Construction | 7.6% ±0.4% , number 158,826 ±8,840 | 6.7% ±<0.1% , number 11,254,981 ±79,620 |
| Transportation and warehousing | 5.7% ±0.3% , number 119,746 ±6,931 | 5.9% ±<0.1% , number 9,832,211 ±73,020 |
| Other services | 5.4% ±0.4% , number 113,534 ±7,910 | 4.8% ±<0.1% , number 7,958,726 ±65,120 |
Embed
Where workers come from and go
Louisiana has 1,895,919 jobs and 1,881,792 employed residents. 80,784 people commute in to work and 66,657 commute out, while 1,815,135 both live and work here. The most commuters come from Mississippi.
Most commuters come from
- Mississippi: 31,696
- Texas: 29,165
- Arkansas: 3,997
Most residents commute to
- Texas: 32,912
- Mississippi: 12,799
- Arkansas: 5,086
Show data
| Louisiana | |
|---|---|
| Live and work here | 1,815,135 |
| Work here, live elsewhere | 80,784 |
| Live here, work elsewhere | 66,657 |
Embed
All the numbers
| Indicator | Louisiana | US | Rank among states* | Table |
|---|---|---|---|---|
| Median household income | $65,139 ±$1,183 | $84,780 ±$215 | 49th | A14006 |
| Income per person | $37,160 ±$518 | $47,171 ±$115 | 48th | A14024 |
| Income inequality (Gini index) | 0.490 ±0.006 | 0.482 ±0.001 | 4th | A14028 |
| Living in poverty | 18.1% ±0.8% , number 812,681 ±37,570 | 11.8% ±0.1% , number 39,264,183 ±277,400 | 1st | A13004 |
| Unemployment rate | 4.6% ±0.3% , number 101,574 ±7,207 | 4.9% ±<0.1% , number 8,574,594 ±64,350 | 6th | A17005 |
| No health insurance | 8.1% ±0.4% , number 365,662 ±16,490 | 8.4% ±<0.1% , number 28,323,306 ±152,000 | 22nd | A20001 |
*1 is the highest. Population is ranked among all states, and the rest among those of 1,000 people or more, whose figures can be ranked. Ranks use 5-year estimates, the only ones covering every state, so they can differ slightly from the figures here.
Education
Fewer college degrees than the US
28.3% of adults 25 and over have a bachelor’s degree or more, lower than the US (37.4%).
Highest level of education
Source: ACS 2025 1-year, table A12001.
Show data
| Louisiana | United States | |
|---|---|---|
| Less than high school | 11.7% ±0.4% , number 369,155 ±13,080 | 9.4% ±0.1% , number 22,321,002 ±120,500 |
| High school only | 32.2% ±0.6% , number 1,015,626 ±20,540 | 25.6% ±0.1% , number 61,096,726 ±203,400 |
| Some college | 27.7% ±0.6% , number 873,110 ±19,280 | 27.7% ±0.1% , number 65,920,977 ±173,500 |
| Bachelor’s degree | 17.9% ±0.4% , number 564,914 ±12,730 | 22.3% ±0.1% , number 53,224,312 ±196,700 |
| Graduate degree | 10.4% ±0.4% , number 326,760 ±12,000 | 15.0% ±0.1% , number 35,816,011 ±159,400 |
Embed
All the numbers
| Indicator | Louisiana | US | Rank among states* | Table |
|---|---|---|---|---|
| Bachelor’s degree or more | 28.3% ±0.6% , number 891,674 ±17,490 | 37.4% ±0.1% , number 89,040,323 ±253,200 | 48th | A12001 |
| High school graduate or more | 88.3% ±1.0% , number 2,780,410 ±33,160 | 90.6% ±0.2% , number 216,058,026 ±368,200 | 48th | A12001 |
*1 is the highest. Population is ranked among all states, and the rest among those of 1,000 people or more, whose figures can be ranked. Ranks use 5-year estimates, the only ones covering every state, so they can differ slightly from the figures here.
Housing
Home values kept pace with incomes
32.0% of households rent, lower than the US (34.7%). The median home is worth $231,800 and the median rent is $1,105. After inflation, home values rose 9% from 2015 to 2025, while household income rose 4%.
Housing costs and income, 2015 to 2025, after inflation
Source: ACS 1-year, table A10036, A18009, A14006.
Show data
| Louisiana | United States | |
|---|---|---|
| Median home value | +8.7% | +39.3% |
| Median rent | +0.8% | +18.5% |
| Median household income | +4.0% | +10.9% |
Embed
Types of homes
Source: ACS 2025 1-year, table A10032.
Show data
| Louisiana | United States | |
|---|---|---|
| Single-family, detached | 65.7% ±0.7% , number 1,416,240 ±15,050 | 60.9% ±0.1% , number 90,335,844 ±173,300 |
| Single-family, attached | 2.7% ±0.2% , number 58,778 ±5,201 | 6.4% ±<0.1% , number 9,527,703 ±51,230 |
| 2 to 4 units | 8.0% ±0.4% , number 172,504 ±8,311 | 7.5% ±0.1% , number 11,109,005 ±75,790 |
| 5 to 19 units | 6.4% ±0.4% , number 138,353 ±9,151 | 8.7% ±0.1% , number 12,829,882 ±97,590 |
| 20 or more units | 4.9% ±0.4% , number 106,665 ±7,647 | 11.1% ±0.1% , number 16,381,450 ±92,310 |
| Mobile homes and other | 12.2% ±0.5% , number 263,974 ±9,766 | 5.4% ±<0.1% , number 8,045,083 ±53,680 |
Embed
When homes were built
Source: ACS 2025 1-year, table A10055.
Show data
| Louisiana | United States | |
|---|---|---|
| 2010 or later | 16.7% ±0.6% , number 310,557 ±10,810 | 15.1% ±0.1% , number 20,257,912 ±101,300 |
| 2000 to 2009 | 14.8% ±0.5% , number 275,307 ±9,374 | 13.8% ±0.1% , number 18,535,840 ±92,260 |
| 1980 to 1999 | 25.5% ±0.7% , number 473,499 ±14,150 | 24.1% ±0.1% , number 32,332,570 ±118,900 |
| 1960 to 1979 | 27.1% ±0.7% , number 502,094 ±14,200 | 22.9% ±0.1% , number 30,726,302 ±110,000 |
| Before 1960 | 15.9% ±0.5% , number 294,390 ±10,090 | 24.0% ±0.1% , number 32,210,798 ±121,500 |
Embed
All the numbers
| Indicator | Louisiana | US | Rank among states* | Table |
|---|---|---|---|---|
| Housing units | 2,156,514 | – | – | A10001 |
| Households | 1,855,847 ±11,110 | – | – | A10008 |
| People per household | 2.42 ±0.01 | 2.49 ±0.01 | 16th | A10003 |
| Households that rent | 32.0% ±0.7% , number 594,118 ±14,060 | 34.7% ±0.1% , number 46,551,688 ±193,200 | 27th | A10060 |
| Vacant homes | 13.9% ±0.5% , number 300,667 ±11,180 | 9.6% ±0.1% , number 14,165,545 ±137,100 | 8th | A10047, A10060 |
| Median gross rent | $1,105 ±$15 | $1,557 ±$4 | 37th | A18009 |
| Median home value | $231,800 ±$2,979 | $371,100 ±$646 | 43rd | A10036 |
| Renters paying 30% or more of income | 47.1% ±1.8% , number 279,905 ±12,710 | 48.3% ±0.2% , number 22,486,693 ±122,100 | 15th | A18002 |
| Owners paying 30% or more of income | 21.9% ±0.9% , number 276,560 ±11,420 | 24.2% ±0.1% , number 21,201,943 ±93,050 | 28th | A10040 |
| Homes built before 1960 | 15.9% ±0.5% , number 294,390 ±10,090 | 24.0% ±0.1% , number 32,210,798 ±121,500 | 34th | A10055 |
*1 is the highest. Population is ranked among all states, and the rest among those of 1,000 people or more, whose figures can be ranked. Ranks use 5-year estimates, the only ones covering every state, so they can differ slightly from the figures here.
Getting around
A driving state with short commutes
79.1% of workers drive alone and 7.4% work from home. 34.2% of those who travel to work spend 30 minutes or more getting there, and 8.4% of households have no vehicle.
How people get to work
Source: ACS 2025 1-year, table A09005.
Show data
| Louisiana | United States | |
|---|---|---|
| Drive alone | 79.1% ±0.8% , number 1,631,888 ±21,430 | 69.8% ±0.1% , number 115,297,377 ±192,900 |
| Carpool | 8.9% ±0.5% , number 183,993 ±10,510 | 8.9% ±0.1% , number 14,712,170 ±97,240 |
| Public transit | 1.2% ±0.2% , number 24,966 ±4,570 | 4.3% ±<0.1% , number 7,100,386 ±63,330 |
| Walk | 1.7% ±0.2% , number 35,017 ±3,661 | 2.4% ±<0.1% , number 4,016,469 ±41,070 |
| Work from home | 7.4% ±0.4% , number 153,567 ±8,199 | 12.9% ±0.1% , number 21,288,393 ±105,700 |
| Other | 1.7% ±0.2% , number 34,632 ±4,227 | 1.7% ±<0.1% , number 2,799,658 ±41,510 |
Embed
Time spent getting to work
Source: ACS 2025 1-year, table B09001.
Show data
| Louisiana | United States | |
|---|---|---|
| Under 10 minutes | 13.0% ±0.6% , number 249,054 ±11,430 | 12.0% ±0.1% , number 17,199,225 ±93,440 |
| 10 to 19 minutes | 31.9% ±0.7% , number 608,941 ±15,580 | 27.8% ±0.1% , number 40,059,540 ±137,700 |
| 20 to 29 minutes | 20.9% ±0.8% , number 399,441 ±15,090 | 21.0% ±0.1% , number 30,221,743 ±111,100 |
| 30 to 39 minutes | 16.0% ±0.7% , number 304,737 ±13,200 | 17.1% ±0.1% , number 24,659,138 ±103,800 |
| 40 to 59 minutes | 10.2% ±0.5% , number 195,599 ±10,310 | 12.6% ±0.1% , number 18,104,709 ±97,070 |
| 60 minutes or more | 8.0% ±0.5% , number 152,724 ±9,327 | 9.5% ±0.1% , number 13,681,705 ±84,440 |
Embed
Vehicles per household
Source: ACS 2025 1-year, table A10030.
Show data
| Louisiana | United States | |
|---|---|---|
| None | 8.4% ±0.4% , number 155,244 ±7,702 | 8.8% ±0.1% , number 11,781,997 ±77,240 |
| One | 36.2% ±0.8% , number 671,160 ±15,890 | 33.1% ±0.1% , number 44,424,682 ±160,700 |
| Two | 37.0% ±0.8% , number 686,895 ±15,980 | 36.0% ±0.1% , number 48,200,889 ±176,800 |
| Three or more | 18.5% ±0.6% , number 342,548 ±11,860 | 22.1% ±0.1% , number 29,655,854 ±113,300 |
Embed
All the numbers
| Indicator | Louisiana | US | Rank among states* | Table |
|---|---|---|---|---|
| Drive to work alone | 79.1% ±0.8% , number 1,631,888 ±21,430 | 69.8% ±0.1% , number 115,297,377 ±192,900 | 4th | A09005 |
| Take public transit | 1.2% ±0.2% , number 24,966 ±4,570 | 4.3% ±<0.1% , number 7,100,386 ±63,330 | 27th | A09005 |
| Work from home | 7.4% ±0.4% , number 153,567 ±8,199 | 12.9% ±0.1% , number 21,288,393 ±105,700 | 50th | A09005 |
| Commute 30 minutes or more | 34.2% ±0.9% , number 653,060 ±19,170 | 39.2% ±0.1% , number 56,445,552 ±165,300 | 28th | B09001 |
| Households with no vehicle | 8.4% ±0.4% , number 155,244 ±8,106 | 8.8% ±<0.1% , number 11,781,997 ±64,240 | 11th | A10030 |
*1 is the highest. Population is ranked among all states, and the rest among those of 1,000 people or more, whose figures can be ranked. Ranks use 5-year estimates, the only ones covering every state, so they can differ slightly from the figures here.
Places
The largest cities in Louisiana
Population, from the latest estimates available. Figures cover the whole of each place.
Largest places
- New Orleans: 362,154
- Baton Rouge: 222,780
- Shreveport: 179,213
- Metairie: 138,263
- Lafayette: 123,307
- Lake Charles: 82,672
- Kenner: 65,126
- Bossier City: 62,901
States like this one
- Alabama: 5,086,768
- Kentucky: 4,534,824
- Arkansas: 3,049,391
- Mississippi: 2,946,779
States at least a third this size, with the closest income, education, age, housing and origins.
Every parish and place in Louisiana
Find any county, city, town, metro area, ZIP code, school district or district in Louisiana.
Parishes
Each of the 64 parishes with its population, from ACS 2020–2024 5-year estimates.
- Acadia Parish56,955
- Allen Parish22,477
- Ascension Parish130,314
- Assumption Parish20,484
- Avoyelles Parish38,905
- Beauregard Parish36,676
- Bienville Parish12,638
- Bossier Parish129,789
- Caddo Parish230,004
- Calcasieu Parish207,088
- Caldwell Parish9,500
- Cameron Parish5,015
- Catahoula Parish8,583
- Claiborne Parish13,833
- Concordia Parish18,174
- De Soto Parish27,026
- East Baton Rouge Parish452,938
- East Carroll Parish7,072
- East Feliciana Parish19,271
- Evangeline Parish32,060
- Franklin Parish19,408
- Grant Parish22,095
- Iberia Parish68,599
- Iberville Parish29,815
- Jackson Parish14,884
- Jefferson Davis Parish31,924
- Jefferson Parish430,920
- Lafayette Parish247,997
- Lafourche Parish96,252
- LaSalle Parish14,789
- Lincoln Parish48,174
- Livingston Parish148,115
- Madison Parish9,513
- Morehouse Parish24,551
- Natchitoches Parish36,693
- Orleans Parish371,853
- Ouachita Parish158,480
- Plaquemines Parish22,803
- Pointe Coupee Parish20,217
- Rapides Parish127,527
- Red River Parish7,443
- Richland Parish19,822
- Sabine Parish21,977
- St. Bernard Parish44,419
- St. Charles Parish51,396
- St. Helena Parish10,858
- St. James Parish19,528
- St. John the Baptist Parish40,743
- St. Landry Parish81,670
- St. Martin Parish51,353
- St. Mary Parish47,828
- St. Tammany Parish272,421
- Tangipahoa Parish136,738
- Tensas Parish3,935
- Terrebonne Parish106,186
- Union Parish20,821
- Vermilion Parish57,123
- Vernon Parish47,117
- Washington Parish45,120
- Webster Parish35,820
- West Baton Rouge Parish27,974
- West Carroll Parish9,464
- West Feliciana Parish15,327
- Winn Parish13,467
Cities, towns and other places
Each of the 488 with its population, from ACS 2020–2024 5-year estimates. Census-designated places are communities without a local government of their own, drawn by the Census Bureau so they can be counted.
- Abbeville11,003
- Abita Springs2,699
- Addis7,252
- Albany991
- Alexandria44,060
- Ama1,483
- Amelia1,712
- Amite City4,048
- Anacoco889
- Angie313
- Arabi4,625
- Arcadia2,635
- Arnaudville1,239
- Ashland151
- Athens358
- Atlanta190
- Avondale4,608
- Baker12,253
- Baldwin1,962
- Ball3,869
- Banks Springs1,406
- Barataria544
- Basile1,790
- Baskin143
- Bastrop9,232
- Baton Rouge222,771
- Bawcomville2,804
- Bayou Blue12,218
- Bayou Cane21,253
- Bayou Corne183
- Bayou Country Club1,497
- Bayou Gauche1,908
- Bayou Goula208
- Bayou L'Ourse2,132
- Bayou Vista3,842
- Belcher204
- Belle Chasse10,934
- Belle Rose1,400
- Belmont161
- Benton2,548
- Bernice1,355
- Berwick4,607
- Bienville134
- Blanchard3,437
- Bogalusa10,468
- Bonita164
- Boothville586
- Bordelonville150
- Bossier City62,901
- Bourg2,239
- Boutte2,027
- Boyce1,037
- Branch268
- Breaux Bridge7,501
- Bridge City7,297
- Broussard14,322
- Brownfields4,261
- Brownsville4,357
- Brusly2,593
- Bryceland139
- Bunkie3,253
- Buras607
- Cade1,710
- Calhoun420
- Calvin169
- Cameron169
- Campti1,047
- Cankton514
- Carencro11,619
- Carlyss4,412
- Castor325
- Catahoula594
- Cecilia1,742
- Center Point580
- Centerville685
- Central29,783
- Chackbay5,436
- Chalmette22,616
- Charenton1,440
- Chataignier367
- Chatham534
- Chauvin2,502
- Cheneyville559
- Choctaw268
- Choudrant1,319
- Church Point4,096
- Claiborne13,308
- Clarence317
- Clarks770
- Clayton272
- Clinton1,136
- Colfax1,240
- Collinston347
- Columbia345
- Convent637
- Converse455
- Cotton Valley701
- Cottonport1,858
- Coushatta1,938
- Covington11,658
- Creola221
- Crescent376
- Crowley11,422
- Cullen758
- Cut Off5,398
- Darrow183
- Delacroix17
- Delcambre2,552
- Delhi2,573
- Delta174
- Denham Springs9,323
- DeQuincy2,931
- DeRidder9,763
- Des Allemands2,382
- Destrehan11,619
- Deville1,572
- Dixie Inn300
- Dodson389
- Donaldsonville6,831
- Dorseyville307
- Downsville223
- Doyline725
- Dry Prong369
- Dubach709
- Dubberly339
- Dulac517
- Duson1,282
- East Hodge273
- Eastwood4,440
- Echo552
- Eden Isle7,683
- Edgard1,482
- Edgefield203
- Egan1,015
- Elizabeth373
- Elmwood6,077
- Elton862
- Empire988
- Epps467
- Erath1,907
- Eros206
- Erwinville2,420
- Estelle16,341
- Estherwood622
- Eunice9,239
- Evergreen297
- Farmerville3,407
- Fenton207
- Ferriday3,098
- Fifth Ward1,277
- Fisher176
- Florien714
- Folsom709
- Fordoche934
- Forest486
- Forest Hill727
- Fort Jesup286
- Fort Polk North2,401
- Fort Polk South7,869
- Franklin6,461
- Franklinton3,602
- French Settlement1,295
- Frierson78
- Galliano5,906
- Gardere12,223
- Garyville2,119
- Georgetown340
- Gibsland681
- Gilbert294
- Gilliam117
- Gillis667
- Glencoe144
- Glenmora1,284
- Gloster105
- Golden Meadow1,854
- Goldonna404
- Gonzales13,108
- Good Pine791
- Grambling5,287
- Gramercy2,814
- Grand Cane227
- Grand Coteau959
- Grand Isle623
- Grand Point2,341
- Gray5,154
- Grayson613
- Greensburg994
- Greenwood3,110
- Gretna17,389
- Grosse Tete293
- Gueydan1,464
- Hackberry899
- Hahnville3,520
- Hall Summit222
- Hammond21,539
- Harahan8,904
- Harrisonburg287
- Harvey20,915
- Haughton4,485
- Hayes690
- Haynesville2,515
- Heflin139
- Henderson1,779
- Hessmer828
- Hester654
- Hodge597
- Homer2,654
- Hornbeck412
- Hosston333
- Houma32,392
- Ida254
- Independence2,207
- Inniswold6,357
- Iota1,481
- Iowa3,200
- Jackson3,958
- Jamestown165
- Jean Lafitte2,266
- Jeanerette4,655
- Jefferson9,703
- Jena4,160
- Jennings9,553
- Jonesboro4,063
- Jonesville1,288
- Jordan Hill280
- Joyce189
- Junction City525
- Kaplan4,238
- Keachi168
- Kenner64,904
- Kentwood2,087
- Kilbourne384
- Killian1,694
- Killona188
- Kinder2,317
- Kraemer1,065
- Krotz Springs831
- Labadieville1,408
- Lacassine218
- Lacombe6,310
- Lafayette121,715
- Lafitte488
- Lafourche Crossing2,790
- Lake Arthur2,585
- Lake Charles81,143
- Lake Providence3,349
- Lakeshore3,437
- Lakeview781
- Laplace28,343
- Larose5,515
- Lawtell1,171
- Lebeau126
- Lecompte592
- Leesville5,495
- Lemannville841
- Leonville1,395
- Lewisburg484
- Lillie133
- Lisbon251
- Livingston1,747
- Livonia1,097
- Lockport2,618
- Lockport Heights1,481
- Logansport1,439
- Longstreet160
- Longville454
- Loreauville833
- Lucky196
- Luling13,960
- Lutcher2,991
- Lydia713
- Madisonville869
- Mamou2,864
- Mandeville12,946
- Mangham638
- Mansfield4,619
- Mansura1,263
- Many2,166
- Maringouin752
- Marion539
- Marksville4,905
- Marrero32,540
- Marthaville41
- Martin667
- Mathews1,598
- Maurice2,584
- McNary248
- Melville589
- Mer Rouge437
- Meraux7,918
- Mermentau627
- Merrydale9,490
- Merryville1,004
- Metairie139,729
- Midland203
- Midway937
- Milton2,793
- Minden11,455
- Minorca1,430
- Monroe47,004
- Montegut1,266
- Monterey326
- Montgomery941
- Monticello3,999
- Montpelier206
- Montz2,074
- Moonshine261
- Mooringsport688
- Moreauville773
- Morgan City11,064
- Morganza600
- Morrow153
- Morse1,099
- Moss Bluff12,482
- Mound67
- Mount Lebanon143
- Napoleonville511
- Natalbany2,416
- Natchez351
- Natchitoches17,577
- New Iberia27,571
- New Llano2,144
- New Orleans371,853
- New Orleans Station2,307
- New Roads4,404
- New Sarpy1,247
- Newellton997
- Noble445
- Norco2,781
- North Hodge493
- North Vacherie1,905
- Norwood340
- Oak Grove1,264
- Oak Hills Place9,038
- Oak Ridge63
- Oakdale6,546
- Oberlin1,809
- Oil City1,184
- Old Jefferson7,860
- Olla1,179
- Opelousas15,495
- Oretta733
- Ossun2,271
- Paincourtville1,008
- Palmetto119
- Paradis552
- Parks963
- Patterson5,744
- Paulina1,785
- Pearl River2,614
- Perry1,424
- Pierre Part2,308
- Pine Prairie934
- Pineville14,160
- Pioneer487
- Pitkin489
- Plain Dealing929
- Plaquemine6,075
- Plaucheville193
- Pleasant Hill605
- Pleasure Bend217
- Point Place476
- Pointe a la Hache288
- Pollock460
- Ponchatoula7,808
- Port Allen4,942
- Port Barre2,275
- Port Sulphur1,593
- Port Vincent673
- Powhatan35
- Poydras2,260
- Prairieville35,238
- Presquille2,062
- Prien7,119
- Prospect378
- Provencal564
- Quitman321
- Raceland9,585
- Rayne7,105
- Rayville3,261
- Red Chute6,526
- Reddell653
- Reeves223
- Reserve7,791
- Richmond447
- Richwood3,839
- Ridgecrest1,007
- Ringgold1,405
- Rio219
- River Ridge13,312
- Roanoke482
- Robeline110
- Rock Hill438
- Rodessa173
- Romeville26
- Rosedale1,034
- Roseland1,070
- Rosepine1,702
- Ruston22,284
- Saline188
- Sarepta724
- Schriever6,690
- Scott8,609
- Shenandoah17,998
- Shongaloo85
- Shreveport180,982
- Sibley1,376
- Sicily Island336
- Sikes279
- Simmesport1,625
- Simpson395
- Simsboro851
- Singer347
- Siracusaville515
- Slaughter1,250
- Slidell28,561
- Sorrel564
- Sorrento2,203
- South Mansfield475
- South Vacherie2,954
- Spearsville93
- Spokane442
- Springfield382
- Springhill4,599
- St. Francisville1,805
- St. Gabriel6,639
- St. James431
- St. Joseph603
- St. Martinville5,297
- St. Maurice274
- St. Rose7,644
- Stanley136
- Starks314
- Start852
- Sterlington2,229
- Stonewall2,392
- Sulphur20,775
- Sun381
- Sunset3,074
- Supreme803
- Swartz4,110
- Taft112
- Tallulah5,969
- Tangipahoa522
- Terrytown24,726
- Thibodaux15,732
- Tickfaw857
- Timberlane10,886
- Triumph120
- Trout42
- Tullos226
- Turkey Creek449
- Union526
- Urania1,240
- Varnado425
- Venice259
- Ventress1,166
- Vidalia3,928
- Vienna587
- Vienna Bend1,502
- Village St. George8,273
- Ville Platte6,253
- Vinton3,176
- Violet4,122
- Vivian2,975
- Waggaman11,330
- Walker6,390
- Wallace791
- Wallace Ridge628
- Washington564
- Waterproof576
- Watson1,357
- Welcome796
- Welsh3,313
- West Monroe12,729
- Westlake4,743
- Westminster2,559
- Westwego8,335
- White Castle2,237
- Wilson838
- Winnfield4,021
- Winnsboro4,725
- Wisner965
- Woodmere11,879
- Woodworth2,432
- Youngsville17,427
- Zachary19,952
- Zwolle1,796
Metro and micro areas
Each of the 19 that reach into Louisiana, with its whole population, from ACS 2020–2024 5-year estimates. Metro and micro areas are counties tied together by commuting, drawn by the Office of Management and Budget.
- Alexandria, LA Metro Area149,622
- Baton Rouge, LA Metro Area875,313
- Bogalusa, LA Micro Area45,120
- DeRidder, LA Micro Area36,676
- Hammond, LA Metro Area136,738
- Houma-Bayou Cane-Thibodaux, LA Metro Area202,438
- Lafayette, LA Metro Area413,428
- Lake Charles, LA Metro Area244,027
- Minden, LA Micro Area35,820
- Monroe, LA Metro Area223,674
- Morgan City, LA Micro Area47,828
- Natchez, MS-LA Micro Area54,045
- Natchitoches, LA Micro Area36,693
- New Iberia, LA Micro Area68,599
- New Orleans-Metairie, LA Metro Area981,662
- Opelousas, LA Micro Area81,670
- Ruston, LA Micro Area48,174
- Shreveport-Bossier City, LA Metro Area386,819
- Slidell-Mandeville-Covington, LA Metro Area272,421
ZIP codes
Each of the 524 with people in it, by the town it's centered in, from ACS 2020–2024 5-year estimates. These are the Census Bureau's ZIP Code Tabulation Areas, which follow the Postal Service's ZIP codes as closely as census blocks allow.
- 70001Metairie38,950
- 70002Metairie19,426
- 70003Metairie39,344
- 70005Metairie24,088
- 70006Metairie16,170
- 70030Bayou Gauche4,290
- 70031Ama1,483
- 70032Arabi4,625
- 70036Barataria544
- 70037Lafitte16,639
- 70038Boothville125
- 70039Boutte1,993
- 70040Delacroix1,056
- 70041Triumph1,747
- 70043Chalmette22,638
- 70047Destrehan13,220
- 70049Edgard1,482
- 70051Garyville1,878
- 70052Gramercy3,171
- 70053Gretna16,621
- 70056Terrytown40,348
- 70057Taft4,122
- 70058Harvey39,578
- 70062Kenner17,771
- 70065Kenner48,936
- 70067Lafitte2,754
- 70068Laplace32,720
- 70070Luling13,960
- 70071Lutcher3,018
- 70072Estelle55,693
- 70075Meraux5,392
- 70076Garyville100
- 70079Norco2,757
- 70080Paradis586
- 70082Pointe a la Hache674
- 70083Pointe a la Hache2,317
- 70084Reserve5,629
- 70085Delacroix4,736
- 70086St. James1,793
- 70087St. Rose7,314
- 70090South Vacherie6,447
- 70091337
- 70092Violet6,936
- 70094Avondale32,130
- 70112New Orleans3,490
- 70113New Orleans9,387
- 70114New Orleans22,659
- 70115New Orleans31,183
- 70116New Orleans10,404
- 70117New Orleans25,652
- 70118New Orleans36,072
- 70119New Orleans37,253
- 70121Jefferson10,558
- 70122New Orleans35,253
- 70123Harahan27,386
- 70124New Orleans21,778
- 70125New Orleans17,821
- 70126New Orleans27,047
- 70127New Orleans23,107
- 70128New Orleans22,986
- 70129New Orleans9,769
- 70130New Orleans12,560
- 70131New Orleans25,151
- 70148New Orleans281
- 70301Choctaw50,095
- 70310Thibodaux327
- 70339Pierre Part4,848
- 70341Belle Rose3,690
- 70342Berwick4,607
- 70343Bourg5,280
- 70344Dulac4,724
- 70345Cut Off8,344
- 70346Donaldsonville9,927
- 70352Schriever167
- 70353Dulac442
- 70354Galliano3,404
- 70355Lockport957
- 70356Bayou L'Ourse1,495
- 703572,351
- 70358Grand Isle623
- 70359Gray10,038
- 70360Bayou Cane28,574
- 70363Houma24,127
- 70364Bayou Blue28,716
- 70372Labadieville1,968
- 70373Larose5,539
- 70374Lockport5,872
- 70375Mathews178
- 70377Montegut3,056
- 70380Bayou L'Ourse20,529
- 70390Supreme7,160
- 70392Patterson8,173
- 70393Paincourtville117
- 70394Raceland13,395
- 70395Schriever4,420
- 70397Dulac971
- 70401Hammond21,221
- 70402Hammond1,850
- 70403Hammond30,173
- 70420Abita Springs7,950
- 70422Amite City15,399
- 70426Varnado6,090
- 70427Bogalusa17,596
- 70431Sun5,769
- 70433Covington41,876
- 70435Covington22,475
- 70436Tangipahoa104
- 70437Folsom8,030
- 70438Franklinton19,349
- 70441Greensburg5,685
- 70442196
- 70443Independence9,006
- 70444Tangipahoa8,687
- 70445Lacombe9,288
- 70446Tickfaw7,173
- 70447Madisonville17,897
- 70448Lewisburg26,338
- 70449Killian3,092
- 704502,921
- 70451Natalbany65
- 70452Pearl River12,650
- 70453Montpelier1,162
- 70454Ponchatoula34,564
- 70455Hammond2,181
- 70456Roseland3,193
- 70457Covington143
- 70458Slidell39,034
- 70460Slidell21,669
- 70461Slidell34,808
- 70462Killian5,593
- 70463Sun99
- 70464Sun109
- 70465Tangipahoa522
- 70466Tickfaw10,148
- 70471Mandeville24,199
- 70501Lafayette26,465
- 70503Lafayette28,643
- 70506Lafayette42,318
- 70507Carencro20,096
- 70508Lafayette40,592
- 70510Perry24,107
- 70512Arnaudville10,740
- 70513Delcambre69
- 70514Baldwin1,914
- 70515Basile3,978
- 70516Branch1,267
- 70517Henderson26,024
- 70518Broussard17,263
- 70519Cade71
- 70520Carencro20,390
- 70522Centerville495
- 70523Charenton476
- 70524Chataignier243
- 70525Church Point14,687
- 70526Crowley16,566
- 70528Delcambre2,745
- 70529Duson12,949
- 70531Egan1,477
- 70532Elton2,434
- 70533Erath7,099
- 70534Estherwood622
- 70535Eunice18,466
- 70537Egan381
- 70538Franklin12,464
- 70541Grand Coteau858
- 70542Gueydan3,186
- 70543Iota4,082
- 70544Jeanerette10,269
- 70546Jennings15,242
- 705488,780
- 70549Hayes3,874
- 70550Lawtell34
- 70551Leonville570
- 70552Loreauville1,193
- 70554Mamou4,728
- 70555Maurice8,759
- 70556Mermentau627
- 70558Milton24
- 70559Morse2,699
- 70560Lydia36,996
- 70563Loreauville20,165
- 70570Opelousas37,565
- 70575Perry74
- 70576Pine Prairie908
- 70577Port Barre3,939
- 70578Rayne16,432
- 70580Reddell340
- 70581Roanoke958
- 70582St. Martinville19,209
- 70583Scott8,386
- 70584Cankton7,481
- 70585Turkey Creek293
- 70586Pine Prairie19,320
- 70589Washington2,875
- 70591Welsh5,983
- 70592Youngsville32,167
- 70601Lake Charles30,872
- 70605Prien40,482
- 70607Prien27,080
- 70609Lake Charles357
- 70611Gillis22,124
- 70615Iowa12,980
- 706301,478
- 70631370
- 70632131
- 70633DeQuincy8,486
- 70634DeRidder25,194
- 70637825
- 70638Elizabeth792
- 70639367
- 70640Fenton196
- 7064387
- 70644190
- 70645Hackberry899
- 70646Hayes877
- 70647Iowa12,736
- 70648Kinder7,104
- 70650Lacassine218
- 70651Reeves302
- 70652Longville2,149
- 70653Merryville3,184
- 70654Oberlin1
- 70655Oberlin3,047
- 70656Pitkin4,015
- 70657Reeves5,254
- 70658Reeves914
- 70659Rosepine1,387
- 70660Oretta1,996
- 70661Starks1,861
- 70662488
- 70663Sulphur27,799
- 70665Carlyss13,222
- 70668Vinton6,169
- 70669Westlake9,552
- 70706Watson21,833
- 70710Addis7,252
- 70711Albany5,612
- 707124,802
- 70714Baker17,433
- 70715Morganza802
- 70719Addis4,856
- 70721St. Gabriel447
- 70722Clinton4,233
- 70723Romeville1,189
- 70725Darrow943
- 70726Walker63,575
- 70729Erwinville1,004
- 70730Clinton3,990
- 70732Fordoche1,035
- 70733French Settlement1,715
- 70734Gonzales9,213
- 70736Ventress376
- 70737Gonzales49,084
- 70739Watson14,877
- 70740Grosse Tete975
- 70743Hester654
- 70744Albany6,070
- 70747599
- 70748Jackson6,909
- 70749Ventress1,701
- 70750Krotz Springs1,117
- 70752Erwinville437
- 70753Fordoche671
- 70754French Settlement11,641
- 70755Livonia1,617
- 70756Fordoche780
- 70757Grosse Tete2,356
- 70759Morganza934
- 70760New Roads6,314
- 70761Norwood732
- 70762Livonia895
- 70763Paulina4,264
- 70764Crescent14,757
- 70767Erwinville14,900
- 70769Prairieville49,278
- 70770Watson3,787
- 70772Rosedale1,020
- 70773Erwinville57
- 70774Sorrento10,041
- 70775St. Francisville9,945
- 70776St. Gabriel7,100
- 70777Slaughter4,406
- 70778Sorrento2,742
- 70780Plaquemine487
- 70782105
- 70783Ventress2,804
- 70785Walker23,921
- 70787440
- 70788White Castle3,830
- 70789Wilson917
- 70791Zachary30,385
- 70801Baton Rouge192
- 70802Baton Rouge25,118
- 70803Baton Rouge3,562
- 70805Baton Rouge23,288
- 70806Baton Rouge28,302
- 70807Baker15,300
- 70808Baton Rouge35,843
- 70809Gardere25,732
- 70810Gardere42,659
- 70811Brownfields12,154
- 70812Merrydale11,007
- 70813Baton Rouge1,668
- 70814Baton Rouge11,921
- 70815Baton Rouge31,024
- 70816Baton Rouge45,718
- 70817Prairieville33,482
- 70818Central9,370
- 70819Baton Rouge4,322
- 70820Baton Rouge23,377
- 70836Baton Rouge501
- 71001Arcadia3,747
- 71002Ashland151
- 71003Athens792
- 71004Belcher335
- 71006Benton16,454
- 71007Greenwood1,354
- 71008Bienville315
- 71009Blanchard47
- 71016Castor1,852
- 71018Cotton Valley1,260
- 71019Edgefield7,207
- 71021Cullen511
- 71023Doyline3,381
- 71024Heflin910
- 71027Frierson1,031
- 71028Mount Lebanon1,472
- 71029Gilliam142
- 71030Gloster1,878
- 71031Goldonna803
- 71032Grand Cane2,330
- 71033Greenwood3,297
- 71034Hall Summit222
- 71037Haughton21,192
- 71038Haynesville3,796
- 71039Heflin1,281
- 71040Homer7,767
- 71043Hosston470
- 71044Ida826
- 71045Jamestown503
- 71046Keachi1,033
- 71047Stonewall10,069
- 71048Lisbon114
- 71049Logansport3,175
- 710512,321
- 71052Mansfield9,102
- 71055Minden17,772
- 71060Mooringsport2,400
- 71061Oil City1,977
- 71063Pleasant Hill724
- 71064Plain Dealing4,350
- 71065Pleasant Hill976
- 71067Haughton2,406
- 71068Ringgold3,482
- 71069Rodessa474
- 71070Saline1,721
- 71071Sarepta2,159
- 71072Shongaloo1,348
- 71073Sibley2,654
- 71075Springhill5,412
- 71078Stonewall7,653
- 71079Junction City263
- 71082Vivian3,666
- 71101Shreveport6,415
- 71103Shreveport6,332
- 71104Shreveport12,975
- 71105Shreveport20,179
- 71106Shreveport34,117
- 71107Blanchard31,734
- 71108Shreveport18,072
- 71109Shreveport17,412
- 71110Bossier City2,626
- 71111Bossier City43,925
- 71112Bossier City33,587
- 71115Frierson14,413
- 71118Shreveport23,219
- 71119Greenwood10,003
- 71129Greenwood12,845
- 71201Monroe21,782
- 71202Richwood25,444
- 71203Swartz38,354
- 71209Monroe1,264
- 71219Mangham1,212
- 71220Bastrop20,398
- 71222Bernice2,871
- 71223Bonita298
- 71225Calhoun6,354
- 71226Chatham1,559
- 71227Choudrant3,783
- 71229Collinston1,331
- 71232Delhi5,768
- 71233Delta174
- 71234Downsville5,396
- 71235Dubach4,034
- 71237Epps1,028
- 71238Eros2,374
- 71241Farmerville8,485
- 71242Forest100
- 71243Wisner152
- 71245Grambling4,439
- 71247Hodge1,133
- 71250Bonita65
- 71251Jonesboro8,026
- 71253Kilbourne376
- 71254Lake Providence6,397
- 71256Lillie678
- 71259Mangham2,010
- 71260Marion3,151
- 71261Mer Rouge1,171
- 71263Oak Grove6,410
- 71264Oak Ridge1,130
- 71266Pioneer1,673
- 71268Quitman2,437
- 71269Rayville12,318
- 71270Ruston32,885
- 71272Ruston1,969
- 71275Simsboro2,363
- 71276135
- 71277Spearsville1,263
- 71279Start50
- 71280Sterlington5,269
- 71282Richmond8,828
- 71286503
- 71291Claiborne35,269
- 71292Bawcomville22,935
- 71295Winnsboro13,992
- 71301Alexandria17,035
- 71302Lecompte13,579
- 71303Alexandria25,138
- 7131644
- 71320Bordelonville134
- 71322Bunkie5,356
- 71323Center Point1,027
- 71325Cheneyville1,273
- 71326Clayton852
- 71327Cottonport5,941
- 71328Deville7,614
- 71330Echo87
- 71331Deville714
- 71333Evergreen381
- 71334Ferriday9,156
- 71336Gilbert1,391
- 71340Harrisonburg1,760
- 71341Hessmer2,943
- 71342Midway7,735
- 71343Jonesville6,764
- 71345Lebeau34
- 71346Lecompte2,555
- 71350Mansura4,774
- 71351Bordelonville11,499
- 71353Melville1,399
- 71354Monterey1,394
- 71355Bordelonville1,706
- 71356Morrow596
- 71357Newellton1,458
- 71358Palmetto867
- 71359Pineville219
- 71360Pineville34,653
- 71362Plaucheville2,233
- 71366St. Joseph1,369
- 71367Turkey Creek1,776
- 71368Sicily Island1,245
- 71369Simmesport2,518
- 71371Trout2,033
- 71373Monterey5,652
- 71375Waterproof1,108
- 71378Wisner2,163
- 71401Harrisonburg18
- 71403Anacoco3,962
- 71404Atlanta656
- 71405Ball5,361
- 71406Belmont12
- 71407Pollock1,178
- 71409Boyce6,135
- 71410Calvin84
- 71411Campti2,604
- 71414Clarence211
- 71415Clarks366
- 71416Montgomery544
- 71417Colfax4,940
- 71418Columbia5,233
- 71419Converse1,936
- 71422Dodson1,868
- 71423Dry Prong4,962
- 714241,439
- 71425Harrisonburg78
- 71426Fisher142
- 71427172
- 71429Florien2,849
- 71430Forest Hill2,757
- 71432Georgetown768
- 71433McNary4,084
- 7143474
- 71435Clarks3,499
- 714381,073
- 71439Hornbeck1,961
- 71441Clarks784
- 71446Leesville21,275
- 71447Boyce1,010
- 71449Many9,029
- 71450Marthaville842
- 71452Montgomery69
- 71454Montgomery2,553
- 71455318
- 71456Montgomery952
- 71457Natchitoches24,370
- 71459New Llano10,270
- 71461Leesville2,046
- 71462Noble1,637
- 71463Oakdale8,559
- 71465Olla3,086
- 71466209
- 71467Pollock8,228
- 71468501
- 71469Robeline3,020
- 7147271
- 71473Sikes573
- 71474Simpson348
- 71479Tullos510
- 71480Urania1,240
- 71483Winnfield9,243
- 71485Woodworth2,890
- 71486Zwolle4,748
- 71497Natchitoches2,074
School districts
Each of the 69 with people in it, from ACS 2020–2024 5-year estimates.
- Acadia Parish School District56,955
- Allen Parish School District22,477
- Ascension Parish School District130,314
- Assumption Parish School District20,484
- Avoyelles Parish School District38,905
- Baker City School District12,124
- Beauregard Parish School District36,676
- Bienville Parish School District12,638
- Bogalusa City School District15,052
- Bossier Parish School District129,789
- Caddo Parish School District230,004
- Calcasieu Parish School District207,088
- Caldwell Parish School District9,500
- Cameron Parish School District5,015
- Catahoula Parish School District8,583
- Central Community School District30,811
- Claiborne Parish School District13,833
- Concordia Parish School District18,174
- De Soto Parish School District27,026
- East Baton Rouge Parish School District381,672
- East Carroll Parish School District7,072
- East Feliciana Parish School District19,271
- Evangeline Parish School District32,060
- Franklin Parish School District19,408
- Grant Parish School District22,095
- Iberia Parish School District68,599
- Iberville Parish School District29,815
- Jackson Parish School District14,884
- Jefferson Davis Parish School District31,924
- Jefferson Parish School District430,920
- La Salle Parish School District14,789
- Lafayette Parish School District247,997
- Lafourche Parish School District96,252
- Lincoln Parish School District48,174
- Livingston Parish School District148,115
- Madison Parish School District9,513
- Monroe City School District47,004
- Morehouse Parish School District24,551
- Natchitoches Parish School District36,693
- Orleans Parish School District371,853
- Ouachita Parish School District111,476
- Plaquemines Parish School District22,803
- Pointe Coupee Parish School District20,217
- Rapides Parish School District127,527
- Red River Parish School District7,443
- Richland Parish School District19,822
- Sabine Parish School District21,977
- St. Bernard Parish School District44,419
- St. Charles Parish School District51,396
- St. Helena Parish School District10,858
- St. James Parish School District19,528
- St. John the Baptist Parish School District40,743
- St. Landry Parish School District81,670
- St. Martin Parish School District51,353
- St. Mary Parish School District47,828
- St. Tammany Parish School District272,421
- Tangipahoa Parish School District136,738
- Tensas Parish School District3,935
- Terrebonne Parish School District106,186
- Union Parish School District20,821
- Vermilion Parish School District57,123
- Vernon Parish School District47,117
- Washington Parish School District30,068
- Webster Parish School District35,820
- West Baton Rouge Parish School District27,974
- West Carroll Parish School District9,464
- West Feliciana Parish School District15,327
- Winn Parish School District13,467
- Zachary Community School District28,331
Congressional districts
As drawn for the 119th Congress (2025–2027).
- Congressional District 1771,652
- Congressional District 2763,550
- Congressional District 3770,787
- Congressional District 4769,520
- Congressional District 5778,598
- Congressional District 6757,854
State senate districts
The upper chamber’s districts, as drawn in 2024.
- State Senate District 1119,925
- State Senate District 2118,896
- State Senate District 3118,530
- State Senate District 4112,368
- State Senate District 5121,606
- State Senate District 6116,478
- State Senate District 7119,975
- State Senate District 8117,390
- State Senate District 9120,415
- State Senate District 10120,942
- State Senate District 11114,889
- State Senate District 12115,411
- State Senate District 13120,073
- State Senate District 14117,023
- State Senate District 15111,482
- State Senate District 16124,057
- State Senate District 17110,521
- State Senate District 18121,734
- State Senate District 19120,513
- State Senate District 20117,274
- State Senate District 21115,971
- State Senate District 22125,543
- State Senate District 23129,943
- State Senate District 24124,807
- State Senate District 25118,499
- State Senate District 26124,063
- State Senate District 27111,648
- State Senate District 28114,763
- State Senate District 29117,256
- State Senate District 30111,271
- State Senate District 31120,119
- State Senate District 32112,427
- State Senate District 33115,662
- State Senate District 34109,841
- State Senate District 35115,205
- State Senate District 36124,734
- State Senate District 37118,399
- State Senate District 38122,031
- State Senate District 39120,277
State house districts
The lower chamber’s districts, as drawn in 2024.
- State House District 145,272
- State House District 243,388
- State House District 344,234
- State House District 444,742
- State House District 547,626
- State House District 641,155
- State House District 743,667
- State House District 846,190
- State House District 942,418
- State House District 1042,967
- State House District 1141,915
- State House District 1245,431
- State House District 1343,697
- State House District 1444,754
- State House District 1543,325
- State House District 1642,309
- State House District 1740,826
- State House District 1846,400
- State House District 1942,322
- State House District 2042,649
- State House District 2142,008
- State House District 2241,564
- State House District 2344,110
- State House District 2441,135
- State House District 2543,734
- State House District 2642,882
- State House District 2742,952
- State House District 2841,979
- State House District 2944,572
- State House District 3041,572
- State House District 3146,956
- State House District 3242,132
- State House District 3342,291
- State House District 3442,039
- State House District 3544,479
- State House District 3643,906
- State House District 3743,887
- State House District 3841,040
- State House District 3941,994
- State House District 4045,020
- State House District 4146,538
- State House District 4245,794
- State House District 4342,561
- State House District 4440,536
- State House District 4547,730
- State House District 4642,161
- State House District 4746,144
- State House District 4846,576
- State House District 4948,321
- State House District 5042,855
- State House District 5145,351
- State House District 5245,228
- State House District 5339,346
- State House District 5437,731
- State House District 5546,180
- State House District 5646,469
- State House District 5740,292
- State House District 5844,672
- State House District 5948,240
- State House District 6044,890
- State House District 6139,335
- State House District 6241,264
- State House District 6345,183
- State House District 6447,605
- State House District 6542,985
- State House District 6639,042
- State House District 6742,054
- State House District 6845,982
- State House District 6948,220
- State House District 7049,386
- State House District 7145,926
- State House District 7244,090
- State House District 7348,358
- State House District 7445,892
- State House District 7545,120
- State House District 7647,791
- State House District 7746,813
- State House District 7845,343
- State House District 7943,256
- State House District 8044,452
- State House District 8146,945
- State House District 8244,151
- State House District 8346,257
- State House District 8440,448
- State House District 8543,351
- State House District 8647,179
- State House District 8743,145
- State House District 8841,570
- State House District 8946,181
- State House District 9041,044
- State House District 9141,604
- State House District 9245,000
- State House District 9339,249
- State House District 9443,954
- State House District 9541,743
- State House District 9642,158
- State House District 9743,735
- State House District 9842,665
- State House District 9941,983
- State House District 10047,170
- State House District 10146,979
- State House District 10243,283
- State House District 10344,419
- State House District 10444,700
- State House District 10541,797
PUMAs
Public Use Microdata Areas: areas of 100,000 people or more that the state draws from census tracts, for the Census Bureau’s microdata.
- Acadiana Regional Development District 1–St. Landry & Evangeline Parishes PUMA113,730
- Acadiana Regional Development District 2–Acadia & Vermilion Parishes PUMA114,329
- Acadiana Regional Development District 3–Lafayette Parish (North) PUMA117,789
- Acadiana Regional Development District 4–Lafayette Parish (South) PUMA130,208
- Acadiana Regional Development District 5–Iberia & St. Martin Parishes PUMA119,701
- Capital Region Planning Commission 1–Baton Rouge Metropolitan Area (West) PUMA112,604
- Capital Region Planning Commission 2–East Baton Rouge Parish (South) PUMA105,132
- Capital Region Planning Commission 3–Baton Rouge City (North) PUMA99,143
- Capital Region Planning Commission 4–East Baton Rouge Parish (North) PUMA103,200
- Capital Region Planning Commission 5–Ascension Parish PUMA130,314
- Capital Region Planning Commission 6–Livingston & St. Helena Parishes PUMA158,973
- Capital Region Planning Commission 7–Tangipahoa & Washington Parishes PUMA181,858
- Capital Region Planning Commission 8–Baton Rouge City (South) PUMA145,463
- Coordinating & Development Corporation 1–Shreveport City (North) PUMA113,280
- Coordinating & Development Corporation 2–Shreveport City (South) PUMA116,724
- Coordinating & Development Corporation 3–Bossier & Webster Parishes PUMA165,609
- Coordinating & Development Corporation 4–Northwest Louisiana PUMA167,784
- Imperial Calcasieu Regional Planning & Development District 1 (North) PUMA146,904
- Imperial Calcasieu Regional Planning & Development District 2 (South) PUMA156,276
- Kisatchie Delta Regional Planning & Development District 1 PUMA116,013
- Kisatchie Delta Regional Planning & Development District 2–Rapides & Vernon Parishes PUMA174,644
- North Delta Regional Planning & Development District 1–Ouachita Parish PUMA158,480
- North Delta Regional Planning & Development District 2–Northeast Louisiana PUMA138,970
- Regional Planning Commission 1–St. Tammany Parish (Northwest) PUMA149,535
- Regional Planning Commission 2–St. Tammany Parish (Southeast) PUMA122,886
- Regional Planning Commission 3–Jefferson Parish (North) PUMA102,900
- Regional Planning Commission 4–Jefferson Parish (Central) PUMA139,729
- Regional Planning Commission 5–Jefferson Parish (West Bank) PUMA134,437
- Regional Planning Commission 6–New Orleans City (Northeast) PUMA144,044
- Regional Planning Commission 7–New Orleans City (Central) PUMA114,187
- Regional Planning Commission 8–New Orleans City (South) PUMA113,622
- Regional Planning Commission 9–St. Bernard, Jefferson (South) & Plaquemines Parishes PUMA121,076
- South Central Planning & Development Commission 1–River Parishes PUMA111,667
- South Central Planning & Development Commission 2–Lafourche & Assumption Parishes PUMA116,736
- South Central Planning & Development Commission 3–Terrebonne & St. Mary Parishes PUMA154,014
Urban areas
Each that reaches into Louisiana, with its whole population. Urban areas are the densely settled land the Census Bureau draws after each census, whatever the city lines.
- Abbeville, LA17,851
- Alexandria, LA76,121
- Bastrop, LA11,986
- Baton Rouge, LA638,240
- Benton, LA4,516
- Bogalusa, LA10,733
- Breaux Bridge, LA17,755
- Crowley, LA12,626
- DeRidder, LA11,766
- Donaldsonville, LA12,440
- Eunice, LA11,538
- Ferriday, LA5,453
- Fort Polk South, LA9,367
- Franklin, LA9,798
- Galliano–Larose–Cut Off, LA17,973
- Hammond, LA75,021
- Houma, LA147,621
- Jeanerette, LA5,133
- Jennings, LA9,476
- Jonesboro, LA5,616
- Kaplan, LA4,406
- Lafayette, LA229,960
- Lake Charles, LA150,857
- Leesville, LA7,983
- Mandeville–Covington, LA116,154
- Mansfield, LA5,344
- Marksville, LA6,679
- Minden, LA12,740
- Monroe, LA119,868
- Morgan City, LA28,690
- Natchez, MS–LA25,142
- Natchitoches, LA18,316
- New Iberia, LA36,611
- New Orleans, LA941,816
- New Roads, LA6,191
- Oakdale, LA6,537
- Opelousas, LA22,820
- Rayne, LA8,266
- Ruston, LA27,770
- Shreveport, LA281,383
- Slidell, LA95,890
- Springhill, LA5,411
- St. Martinville, LA6,336
- Tallulah, LA6,445
- Vicksburg, MS–LA24,931
- Ville Platte, LA7,286
- Winnfield, LA4,228
- Winnsboro, LA4,794
- Zachary, LA16,242
Tribal areas
Each that reaches into Louisiana, with its whole population.
- Adai Caddo SDTSA, LA2,478
- Apache Choctaw SDTSA, LA5,772
- Bayou Lafourche SDTSA, LA12,840
- Chitimacha Reservation, LA878
- Clifton Choctaw SDTSA, LA385
- Coushatta Reservation and Off-Reservation Trust Land, LA110
- Four Winds Cherokee SDTSA, LA28,868
- Grand Caillou/Dulac SDTSA, LA7,536
- Isle de Jean Charles SDTSA, LA537
- Jena Band of Choctaw Reservation, LA18
- Natchitoches SDTSA, LA26,232
- Pointe-au-Chien SDTSA, LA3,818
- Tunica-Biloxi Reservation and Off-Reservation Trust Land, LA182
- United Houma Nation SDTSA, LA186,351
Turn Louisiana into your planning report.
Social Explorer Studio builds an editable profile of any place, with tables and charts beside the county and state, and exports to Word, PDF and Excel.
Questions about Louisiana
What is the population of Louisiana?
4,618,189 people, according to the ACS 2025 1-year estimates, which the Census Bureau adjusts to match its own population estimate. That’s the 25th largest of the 50 states and DC.
What is the FIPS code for Louisiana?
22. Every county’s and place’s FIPS code in Louisiana starts with it. The Census Bureau’s full geographic identifier (GEOID) is 0400000US22.
What is the largest city in Louisiana?
New Orleans, with 362,154 people. Other large places here include Baton Rouge, Shreveport and Metairie.
What is the median household income in Louisiana?
$65,139 (±$1,183), according to the ACS 2025 1-year estimates, lower than the US ($84,780).
What is the median age in Louisiana?
39.4 years (±0.3), according to the ACS 2025 1-year estimates, about the same as the US (39.5).
How much does housing cost in Louisiana?
Louisiana’s median home value is $231,800 (±$2,979) and its median gross rent is $1,105 (±$15) a month, according to the ACS 2025 1-year estimates. 47.1% (±1.8%) of its renters pay 30% or more of their income on rent.
Is Louisiana growing?
Louisiana’s population fell 1.1%, from 4,670,724 in 2015 to 4,618,189 in 2025, according to the ACS 1-year estimates.
Where do people who work in Louisiana live?
1,815,135 of its 1,895,919 jobs are held by people who live here. Of those who commute in, the most come from Mississippi, Texas, Arkansas.
Where does this census data come from?
The U.S. Census Bureau’s American Community Survey, through Social Explorer’s tables: the latest 1-year estimates where they exist, for the most recent numbers, and 5-year estimates otherwise. Each table lists its code, so you can find it again.
Is this data free to use?
Yes. You can read it, cite it, download the CSV and embed the charts, with no account. To map other variables, compare your own areas or build a report, see Social Explorer’s plans in a live demo.
Sources and how to cite
American Community Survey 2025 1-year estimates, or 2020–2024 5-year estimates where noted, U.S. Census Bureau, from Social Explorer’s tables A00001, A00002, A01004, A04001, A06001, A08001, A09005, A10001, A10003, A10008, A10030, A10036, A10040, A10047, A10055, A10060, A12001, A13004, A14006, A14024, A14028, A16002, A17005, A18002, A18009, A20001, B02002, B09001, B13002, B18101, C16001. Maps by census tract use 2020–2024 5-year estimates, since the 1-year survey doesn’t cover tracts. Commuting: LEHD LODES 2023. These are estimates from a sample, each with its margin of error. Data retrieved November 14, 2026. How these profiles are made.
U.S. Census Bureau, American Community Survey 2025 1-year estimates, or 2020–2024 5-year estimates where noted, via Social Explorer. “Louisiana.” https://www.socialexplorer.com/places/louisiana. Accessed November 14, 2026.