

Tennessee: Population, demographics and census data
Home to 7,315,076 people, the 15th largest of the 50 states and DC, anchored by Nashville-Davidson and Memphis. It grew 10.8% between 2015 and 2025.
- Population
- 7.32M. Census Bureau estimate · Rank 15 of the 50 states and DC
- Median household income
- $75,875 ±$816. US $84,780
- Median age
- 39.5 ±0.2. US 39.5
ACS 2025 1-year estimates, U.S. Census Bureau
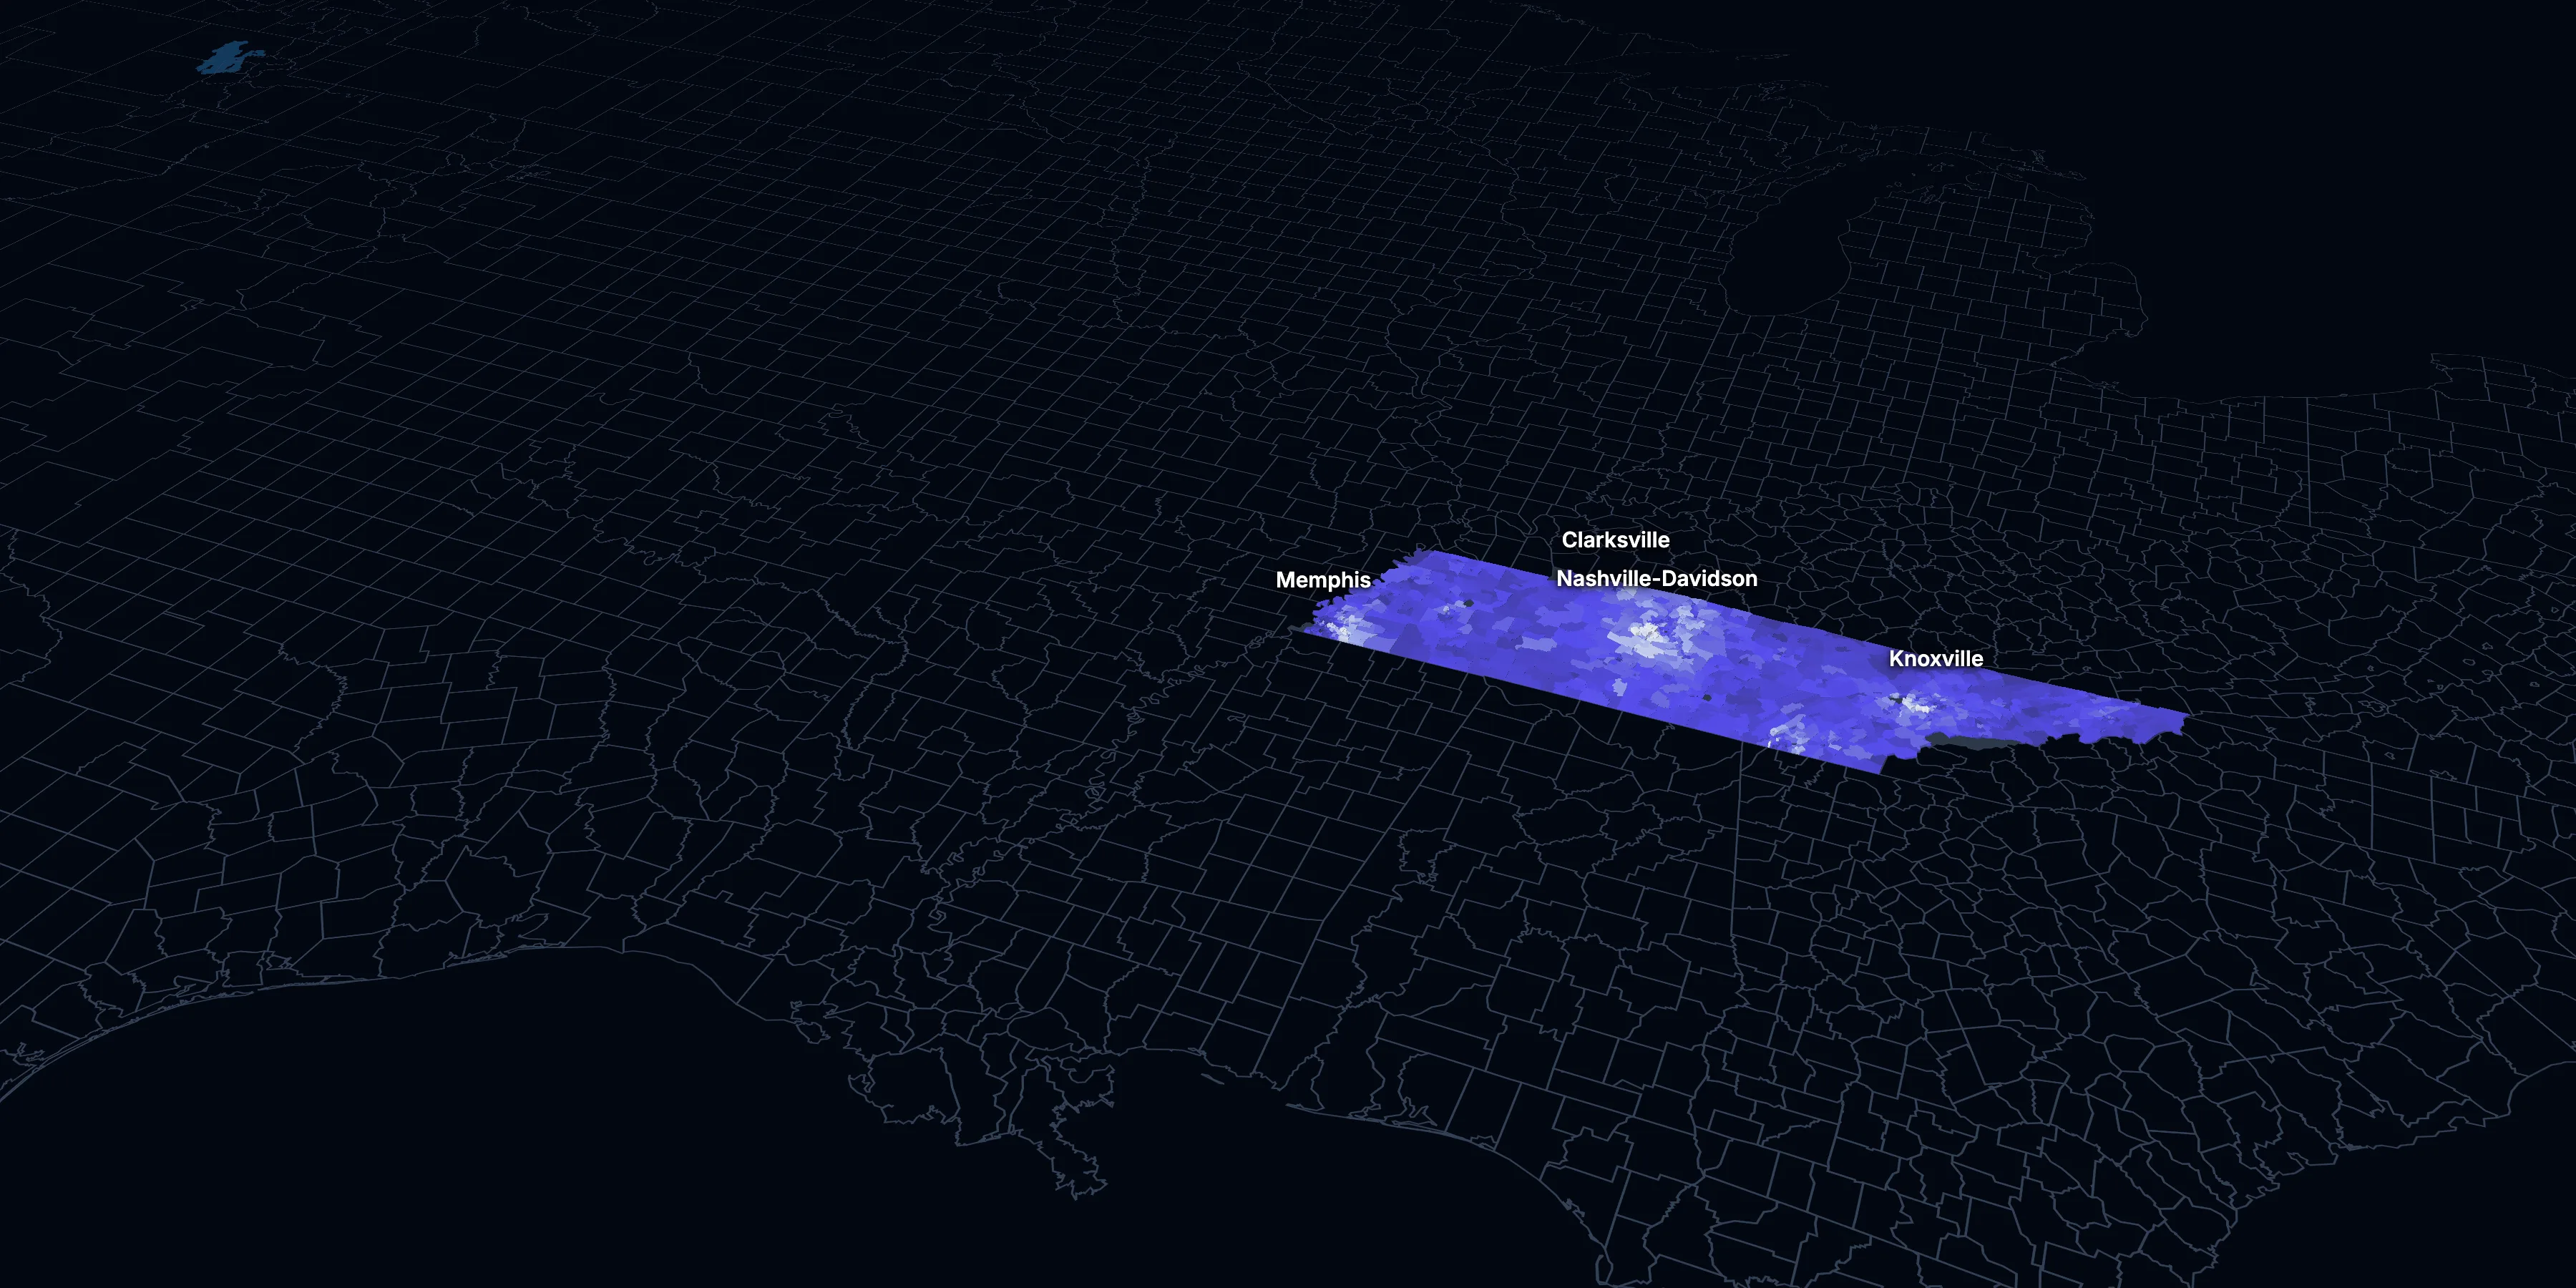
Taller, lighter tracts have higher household incomes
About Tennessee
Tennessee’s median household income is $75,875 (±$816), lower than the US ($84,780), and its median age is 39.5 (±0.2), according to the ACS 2025 1-year estimates. Its largest community is Nashville-Davidson.
± is each figure’s margin of error, at 90% confidence, and † marks one too uncertain to lean on. Under each percentage in the tables is the number it counts. How the margins are worked out.
FIPS code 47
Highlights
What stands out in Tennessee
The numbers where Tennessee sits furthest from the nation, or past a recognized policy benchmark.
Past a policy benchmark
+9 points
ElevatedRent growth ahead of income
After inflation, rent grew 26% from 2015 to 2025, and household income 17%. The dots show rent growth.
Furthest from the national picture
9.6%
Very lowSpeak a language other than English at home
That’s lower than the US (22.9%).
6.8%
Very lowBorn outside the US
That’s lower than the US (14.7%).
0.9%
Very lowTake public transit
That’s lower than the US (4.3%). It’s the 6th lowest of the 50 states and DC.
2.2%
Very lowAsian, not Hispanic
That’s lower than the US (6.5%).
32.8%
Lower than the USBachelor’s degree or more
That’s lower than the US (37.4%).
2015 to 2025
How Tennessee changed in ten years
The state added 714,777 people. It got older, more foreign-born and better educated, and poverty fell 4.1 points.
Population, change since 2015
+10.8% in the state and +6.3% in the US.
Source: ACS 1-year, 2015 to 2025, table A00001.
Show data
| Tennessee | United States | |
|---|---|---|
| 2015 | 0.0% | 0.0% |
| 2016 | +0.8% | +0.5% |
| 2017 | +1.8% | +1.3% |
| 2018 | +2.6% | +1.8% |
| 2019 | +3.5% | +2.1% |
| 2021 | +5.7% | +3.3% |
| 2022 | +6.8% | +3.7% |
| 2023 | +8.0% | +4.2% |
| 2024 | +9.5% | +5.8% |
| 2025 | +10.8% | +6.3% |
Embed
Median household income, in 2025 dollars
+17.1% in the state and +10.9% in the US.
Source: ACS 1-year, 2015 to 2025, table A14006.
Show data
| Tennessee | United States | |
|---|---|---|
| 2015 | $64,768 | $76,413 |
| 2016 | $65,663 | $77,931 |
| 2017 | $67,979 | $79,891 |
| 2018 | $67,699 | $80,059 |
| 2019 | $71,187 | $83,427 |
| 2021 | $71,514 | $83,521 |
| 2022 | $72,286 | $82,811 |
| 2023 | $71,951 | $82,683 |
| 2024 | $74,410 | $84,339 |
| 2025 | $75,875 | $84,780 |
Embed
Living in poverty
−4.1 points in the state and −3.0 points in the US.
Source: ACS 1-year, 2015 to 2025, table A13004.
Show data
| Tennessee | United States | |
|---|---|---|
| 2015 | 16.7% | 14.7% |
| 2016 | 15.8% | 14.0% |
| 2017 | 15.0% | 13.4% |
| 2018 | 15.3% | 13.1% |
| 2019 | 13.9% | 12.3% |
| 2021 | 13.6% | 12.8% |
| 2022 | 13.3% | 12.6% |
| 2023 | 14.0% | 12.5% |
| 2024 | 13.5% | 12.1% |
| 2025 | 12.6% | 11.8% |
Embed
Bachelor’s degree or more
+7.1 points in the state and +6.7 points in the US.
Source: ACS 1-year, 2015 to 2025, table A12001.
Show data
| Tennessee | United States | |
|---|---|---|
| 2015 | 25.7% | 30.6% |
| 2016 | 26.1% | 31.3% |
| 2017 | 27.3% | 32.0% |
| 2018 | 27.5% | 32.6% |
| 2019 | 28.7% | 33.1% |
| 2021 | 30.5% | 35.0% |
| 2022 | 31.1% | 35.7% |
| 2023 | 31.7% | 36.2% |
| 2024 | 32.4% | 36.8% |
| 2025 | 32.8% | 37.4% |
Embed
Median gross rent, in 2025 dollars
+26.1% in the state and +18.5% in the US.
Source: ACS 1-year, 2015 to 2025, table A18009.
Show data
| Tennessee | United States | |
|---|---|---|
| 2015 | $1,075 | $1,314 |
| 2016 | $1,090 | $1,327 |
| 2017 | $1,103 | $1,340 |
| 2018 | $1,113 | $1,368 |
| 2019 | $1,148 | $1,393 |
| 2021 | $1,175 | $1,427 |
| 2022 | $1,214 | $1,440 |
| 2023 | $1,292 | $1,496 |
| 2024 | $1,327 | $1,537 |
| 2025 | $1,356 | $1,557 |
Embed
Median home value, in 2025 dollars
+65.4% in the state and +39.3% in the US.
Source: ACS 1-year, 2015 to 2025, table A10036.
Show data
| Tennessee | United States | |
|---|---|---|
| 2015 | $206,325 | $266,469 |
| 2016 | $213,301 | $277,278 |
| 2017 | $221,787 | $288,124 |
| 2018 | $229,435 | $296,908 |
| 2019 | $243,634 | $305,336 |
| 2021 | $281,768 | $337,116 |
| 2022 | $315,491 | $355,481 |
| 2023 | $326,929 | $361,931 |
| 2024 | $343,747 | $372,685 |
| 2025 | $341,200 | $371,100 |
Embed
ACS 1-year estimates. The dotted stretch of each line spans 2020, when the Census Bureau released no standard 1-year estimates. Dollar values are in 2025 dollars.
| Indicator | 2015 | 2025 | Change |
|---|---|---|---|
| Population | 6,600,299 | 7,315,076 | +10.8% |
| Median age | 38.7 | 39.5 | +0.8 years |
| 65 and over | 15.4% | 18.6% | +3.2 points |
| Born outside the US | 5.0% | 6.8% | +1.7 points |
| Hispanic or Latino | 5.1% | 8.5% | +3.4 points |
| Median household income | $64,768 | $75,875 | +17.1% |
| Living in poverty | 16.7% | 12.6% | −4.1 points |
| Bachelor’s degree or more | 25.7% | 32.8% | +7.1 points |
| Households that rent | 34.2% | 32.3% | −1.8 points |
| Median gross rent | $1,075 | $1,356 | +26.1% |
| Median home value | $206,325 | $341,200 | +65.4% |
1701 census tracts
Tennessee, tract by tract
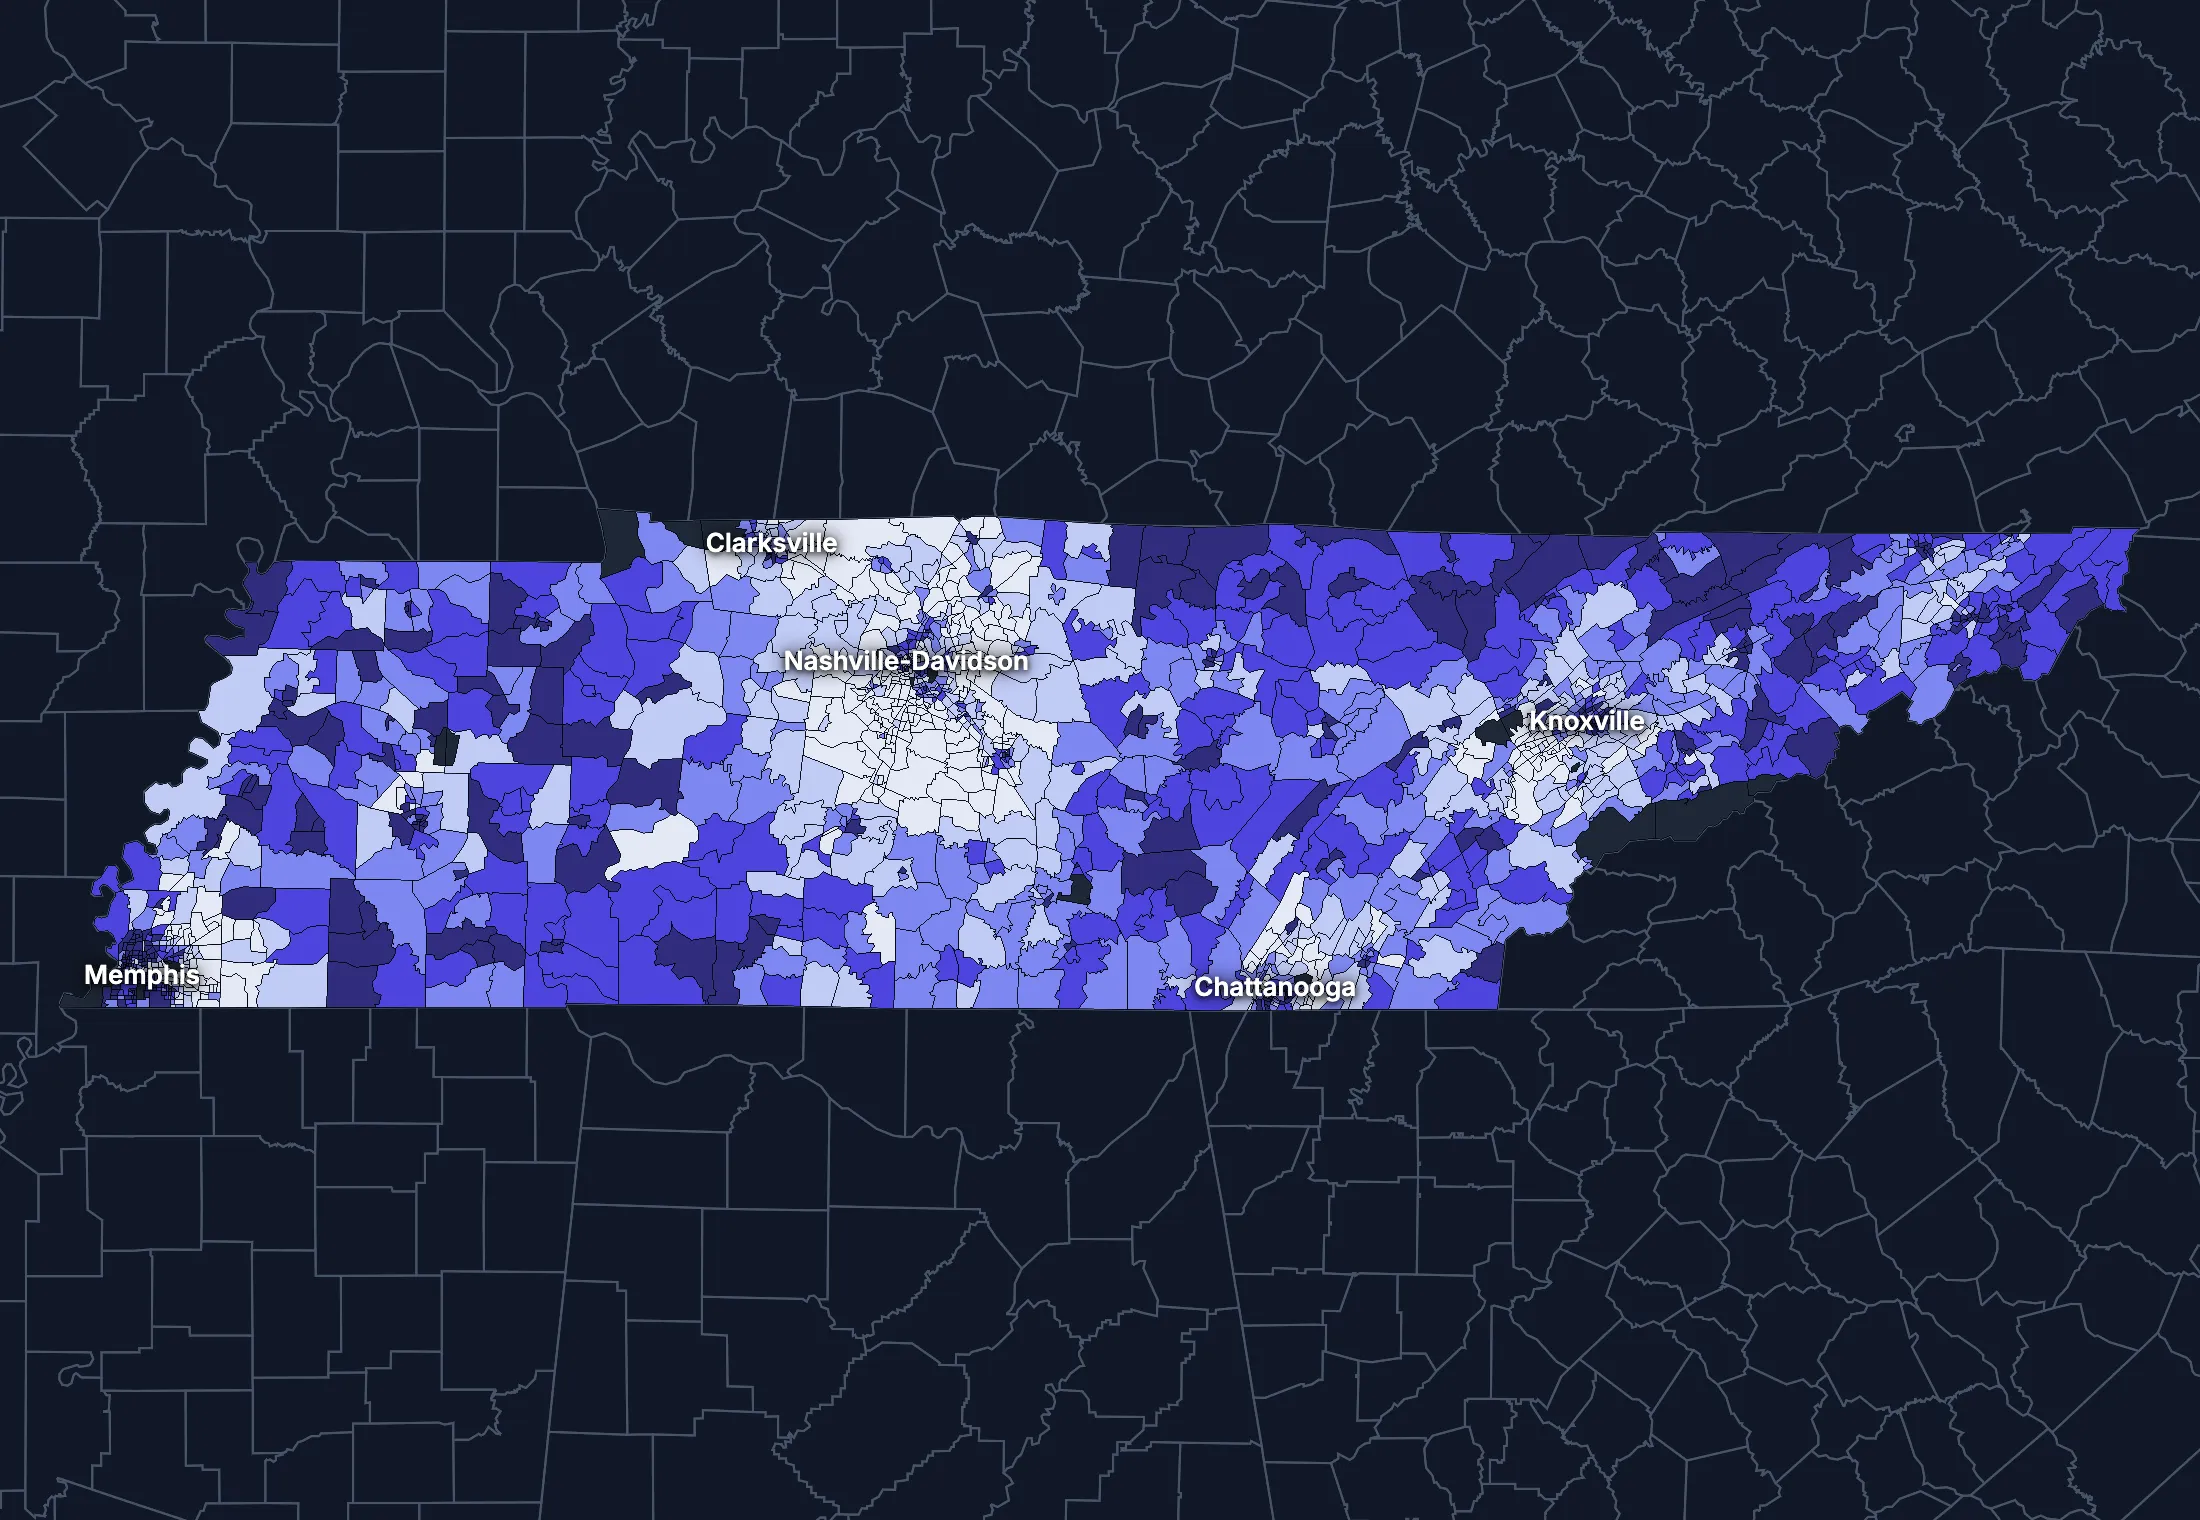
State averages hide a lot. These census tracts are the closest the census comes to neighborhoods.
Where the state’s average misleads
Each tick is one census tract, and the dark line marks the state. Hover over a tick or tap it to see the tract.
Poverty
388 of 1675 tracts are at least 1.5 times the state’s overall 13.8%, and 546 are at two-thirds of it or less.
Highest: Tract 148, 91.3%. Lowest: Tract 213.56, 0.0%.
Renters paying 30% or more of income
91 of 1645 tracts are at least 1.5 times the state’s overall 44.4%, and 466 are at two-thirds of it or less.
Highest: Tract 210.21, 100.0%. Lowest: Tract 206, 0.0%.
Adults with a bachelor’s degree
300 of 1679 tracts are at least 1.5 times the state’s overall 31.1%, and 714 are at two-thirds of it or less.
Highest: Tract 171, 88.4%. Lowest: Tract 148, 0.0%.
Median household income
272 of 1674 tracts are at least 1.5 times the typical tract’s $65,299, and 234 are at two-thirds of it or less.
Highest: Tract 186.01, $250,000 or more. Lowest: Tract 9.02, under $2,500.
American Community Survey 2020–2024 5-year estimates, by census tract. Income is capped at $250,000+ by the Census Bureau.
People
Who lives in Tennessee
Its median age of 39.5 is about the same as the US (39.5). 6.8% of residents were born outside the US, and 9.6% speak a language other than English at home.
Age
Source: ACS 2025 1-year, table A01001.
Show data
| Tennessee | United States | |
|---|---|---|
| Under 18 | 21.4% ±0.2% , number 1,565,471 ±18,220 | 21.0% ±<0.1% , number 71,689,151 ±111,800 |
| 18 to 24 | 9.2% ±0.2% , number 675,407 ±15,200 | 9.3% ±<0.1% , number 31,716,680 ±98,660 |
| 25 to 34 | 13.6% ±0.1% , number 991,960 ±10,040 | 13.6% ±<0.1% , number 46,357,354 ±55,690 |
| 35 to 44 | 12.9% ±0.2% , number 942,623 ±16,490 | 13.4% ±<0.1% , number 45,746,189 ±105,700 |
| 45 to 54 | 11.9% ±0.1% , number 870,123 ±7,606 | 11.8% ±<0.1% , number 40,257,563 ±53,540 |
| 55 to 64 | 12.4% ±0.2% , number 907,732 ±16,290 | 12.1% ±<0.1% , number 41,242,904 ±104,700 |
| 65 to 74 | 10.8% ±0.2% , number 786,508 ±14,880 | 10.8% ±<0.1% , number 36,895,650 ±91,520 |
| 75 and over | 7.9% ±0.2% , number 575,252 ±11,220 | 8.2% ±<0.1% , number 27,879,368 ±78,140 |
Embed
Race and ethnicity
Source: ACS 2025 1-year, table A04001.
Show data
| Tennessee | United States | |
|---|---|---|
| White, not Hispanic | 69.1% ±0.1% , number 5,057,604 ±6,433 | 55.0% ±<0.1% , number 187,959,031 ±58,340 |
| Hispanic or Latino | 8.5% ±0.1% , number 620,571 ±3,935 | 20.5% ±<0.1% , number 69,975,516 ±13,270 |
| Black, not Hispanic | 14.8% ±0.1% , number 1,080,185 ±10,880 | 11.7% ±<0.1% , number 40,096,453 ±106,200 |
| Asian, not Hispanic | 2.2% ±0.1% , number 161,025 ±4,769 | 6.5% ±<0.1% , number 22,096,709 ±58,340 |
| Other or multiracial | 5.4% ±0.2% , number 395,691 ±13,250 | 6.3% ±<0.1% , number 21,657,150 ±150,100 |
Embed
Language spoken at home
Source: ACS 2025 1-year, table C16001.
Show data
| Tennessee | United States | |
|---|---|---|
| English only | 90.4% ±0.3% , number 6,241,760 ±22,530 | 77.1% ±0.1% , number 249,390,588 ±275,300 |
| Spanish | 5.8% ±0.2% , number 400,774 ±13,470 | 13.9% ±0.1% , number 44,921,985 ±177,800 |
| Other Indo-European | 1.4% ±0.1% , number 100,009 ±8,729 | 4.0% ±<0.1% , number 12,862,980 ±113,500 |
| Asian and Pacific Island | 1.3% ±0.1% , number 89,935 ±8,118 | 3.8% ±<0.1% , number 12,288,841 ±99,740 |
| Arabic and other | 1.0% ±0.2% , number 70,770 ±15,530 | 1.3% ±<0.1% , number 4,116,949 ±71,480 |
Embed
Marital status
Source: ACS 2025 1-year, table A11001.
Show data
| Tennessee | United States | |
|---|---|---|
| Now married | 49.6% ±0.4% , number 2,986,543 ±25,640 | 47.9% ±0.1% , number 135,567,564 ±223,300 |
| Never married | 31.5% ±0.3% , number 1,895,877 ±19,020 | 34.8% ±0.1% , number 98,647,238 ±152,600 |
| Divorced | 11.2% ±0.3% , number 676,215 ±16,860 | 10.2% ±<0.1% , number 28,879,967 ±112,900 |
| Widowed | 6.1% ±0.2% , number 369,380 ±9,443 | 5.5% ±<0.1% , number 15,599,094 ±69,430 |
| Separated | 1.6% ±0.1% , number 98,985 ±7,064 | 1.6% ±<0.1% , number 4,441,399 ±49,160 |
Embed
Where people lived a year ago
Source: ACS 2025 1-year, table A08001.
Show data
| Tennessee | United States | |
|---|---|---|
| Same home | 87.5% ±0.4% , number 6,335,771 ±30,380 | 88.4% ±0.1% , number 298,889,697 ±214,800 |
| Same county | 6.4% ±0.3% , number 460,333 ±24,440 | 6.0% ±<0.1% , number 20,202,671 ±166,300 |
| Another county in the state | 3.0% ±0.2% , number 220,430 ±13,050 | 3.0% ±<0.1% , number 10,168,097 ±89,190 |
| Another state | 2.7% ±0.2% , number 195,243 ±13,700 | 2.1% ±<0.1% , number 7,025,589 ±81,660 |
| Another country | 0.3% ±0.1% , number 25,043 ±4,582 | 0.6% ±<0.1% , number 1,984,943 ±47,210 |
Embed
Top countries of birth, among those born abroad
Source: ACS 2025 1-year, table A07001.
Show data
| Tennessee | |
|---|---|
| Mexico | 20.3% , number 100,481 |
| India | 7.9% , number 39,140 |
| Guatemala | 6.4% , number 31,465 |
| Venezuela | 4.2% , number 20,849 |
| Honduras | 3.9% , number 19,416 |
| El Salvador | 2.8% , number 13,654 |
Embed
All the numbers
| Indicator | Tennessee | US | Rank among states* | Table |
|---|---|---|---|---|
| Population | 7,315,076 | 341,784,859 | 15th | A00001 |
| People per square mile | 177 | 97 | 21st | A00002 |
| Land area (square miles) | 41,225 | – | – | A00002 |
| Median age | 39.5 ±0.2 | 39.5 ±0.1 | 31st | A01004 |
| Under 18 | 21.4% ±0.2% , number 1,565,471 ±18,220 | 21.0% ±<0.1% , number 71,689,151 ±111,800 | 22nd | B02002 |
| 65 and over | 18.6% ±0.3% , number 1,361,760 ±18,640 | 19.0% ±<0.1% , number 64,775,018 ±120,300 | 32nd | B02002 |
| Born outside the US | 6.8% ±0.3% , number 494,649 ±19,140 | 14.7% ±0.1% , number 50,409,320 ±204,800 | 33rd | A06001 |
| Speak a language other than English at home | 9.6% ±0.3% , number 661,488 ±23,760 | 22.9% ±0.1% , number 74,190,755 ±244,000 | 35th | C16001 |
| Veterans (adults) | 6.5% ±0.2% , number 375,004 ±10,160 | 5.9% ±<0.1% , number 15,746,228 ±85,320 | 23rd | A16002 |
| Living with a disability | 14.8% ±0.3% , number 1,070,059 ±19,120 | 13.7% ±<0.1% , number 46,271,455 ±126,000 | 11th | B18101 |
| Women 15–50 who had a baby in the past year | 5.1% ±0.4% , number 87,201 ±7,149 | 5.0% ±0.1% , number 4,016,759 ±44,040 | 23rd | B13002 |
| Lived in the same home a year ago | 87.5% ±0.4% , number 6,335,771 ±30,380 | 88.4% ±0.1% , number 298,889,697 ±214,800 | 31st | A08001 |
| White, not Hispanic | 69.1% ±0.1% , number 5,057,604 ±6,433 | 55.0% ±<0.1% , number 187,959,031 ±58,340 | 23rd | A04001 |
| Hispanic or Latino | 8.5% ±0.1% , number 620,571 ±3,935 | 20.5% ±<0.1% , number 69,975,516 ±13,270 | 33rd | A04001 |
| Black, not Hispanic | 14.8% ±0.1% , number 1,080,185 ±10,880 | 11.7% ±<0.1% , number 40,096,453 ±106,200 | 11th | A04001 |
| Asian, not Hispanic | 2.2% ±0.1% , number 161,025 ±4,769 | 6.5% ±<0.1% , number 22,096,709 ±58,340 | 36th | A04001 |
*1 is the highest. Population is ranked among all states, and the rest among those of 1,000 people or more, whose figures can be ranked. Ranks use 5-year estimates, the only ones covering every state, so they can differ slightly from the figures here.
Income and work
Lower incomes than the US
The median household income is $75,875, lower than the US ($84,780). 12.6% of people live in poverty, and 10.0% have no health insurance, higher than the US (8.4%).
Household income
Source: ACS 2025 1-year, table A14001.
Show data
| Tennessee | United States | |
|---|---|---|
| Under $25,000 | 14.9% ±0.5% , number 440,029 ±13,740 | 14.0% ±0.1% , number 18,727,548 ±88,990 |
| $25,000 to $49,999 | 18.2% ±0.6% , number 537,507 ±16,740 | 15.4% ±0.1% , number 20,665,585 ±101,400 |
| $50,000 to $74,999 | 16.3% ±0.5% , number 482,182 ±14,320 | 15.3% ±0.1% , number 20,513,565 ±88,500 |
| $75,000 to $99,999 | 13.3% ±0.4% , number 394,040 ±11,250 | 12.5% ±0.1% , number 16,814,245 ±87,520 |
| $100,000 to $149,999 | 17.8% ±0.5% , number 526,952 ±13,720 | 17.9% ±0.1% , number 24,018,984 ±99,670 |
| $150,000 to $199,999 | 8.5% ±0.3% , number 251,785 ±10,270 | 10.1% ±0.1% , number 13,521,827 ±70,660 |
| $200,000 or more | 10.9% ±0.4% , number 321,601 ±11,260 | 14.8% ±0.1% , number 19,801,668 ±84,120 |
Embed
What residents do for work
Source: ACS 2025 1-year, table A17004.
Show data
| Tennessee | United States | |
|---|---|---|
| Education and health care | 22.9% ±0.5% , number 815,641 ±18,940 | 24.4% ±0.1% , number 40,862,193 ±140,800 |
| Manufacturing | 12.0% ±0.3% , number 427,673 ±12,700 | 9.6% ±0.1% , number 16,064,394 ±91,270 |
| Retail trade | 11.3% ±0.4% , number 401,876 ±13,000 | 10.6% ±0.1% , number 17,781,181 ±96,660 |
| Professional and business services | 11.0% ±0.4% , number 391,781 ±13,380 | 12.8% ±0.1% , number 21,375,231 ±87,110 |
| Arts, food and lodging | 9.0% ±0.4% , number 321,560 ±13,030 | 8.9% ±0.1% , number 14,811,502 ±87,840 |
| Transportation and warehousing | 7.6% ±0.3% , number 270,134 ±12,350 | 5.9% ±<0.1% , number 9,832,211 ±73,020 |
| Construction | 7.1% ±0.3% , number 253,225 ±12,160 | 6.7% ±<0.1% , number 11,254,981 ±79,620 |
| Finance, insurance and real estate | 6.0% ±0.3% , number 212,108 ±9,348 | 6.6% ±<0.1% , number 11,025,569 ±68,570 |
Embed
Where workers come from and go
Tennessee has 3,187,461 jobs and 3,113,238 employed residents. 235,600 people commute in to work and 161,377 commute out, while 2,951,861 both live and work here. The most commuters come from Mississippi.
Most commuters come from
- Mississippi: 65,658
- Georgia: 46,964
- Kentucky: 26,650
Most residents commute to
- Mississippi: 34,820
- Kentucky: 25,450
- Georgia: 20,335
Show data
| Tennessee | |
|---|---|
| Live and work here | 2,951,861 |
| Work here, live elsewhere | 235,600 |
| Live here, work elsewhere | 161,377 |
Embed
All the numbers
| Indicator | Tennessee | US | Rank among states* | Table |
|---|---|---|---|---|
| Median household income | $75,875 ±$816 | $84,780 ±$215 | 42nd | A14006 |
| Income per person | $42,757 ±$542 | $47,171 ±$115 | 40th | A14024 |
| Income inequality (Gini index) | 0.477 ±0.006 | 0.482 ±0.001 | 18th | A14028 |
| Living in poverty | 12.6% ±0.4% , number 901,438 ±29,560 | 11.8% ±0.1% , number 39,264,183 ±277,400 | 13th | A13004 |
| Unemployment rate | 4.2% ±0.2% , number 154,842 ±8,987 | 4.9% ±<0.1% , number 8,574,594 ±64,350 | 33rd | A17005 |
| No health insurance | 10.0% ±0.3% , number 722,301 ±20,710 | 8.4% ±<0.1% , number 28,323,306 ±152,000 | 10th | A20001 |
*1 is the highest. Population is ranked among all states, and the rest among those of 1,000 people or more, whose figures can be ranked. Ranks use 5-year estimates, the only ones covering every state, so they can differ slightly from the figures here.
Education
Fewer college degrees than the US
32.8% of adults 25 and over have a bachelor’s degree or more, lower than the US (37.4%).
Highest level of education
Source: ACS 2025 1-year, table A12001.
Show data
| Tennessee | United States | |
|---|---|---|
| Less than high school | 9.0% ±0.3% , number 454,531 ±15,570 | 9.4% ±0.1% , number 22,321,002 ±120,500 |
| High school only | 30.0% ±0.5% , number 1,523,805 ±24,580 | 25.6% ±0.1% , number 61,096,726 ±203,400 |
| Some college | 28.2% ±0.5% , number 1,432,045 ±24,570 | 27.7% ±0.1% , number 65,920,977 ±173,500 |
| Bachelor’s degree | 20.4% ±0.4% , number 1,037,090 ±22,890 | 22.3% ±0.1% , number 53,224,312 ±196,700 |
| Graduate degree | 12.4% ±0.3% , number 626,727 ±16,890 | 15.0% ±0.1% , number 35,816,011 ±159,400 |
Embed
All the numbers
| Indicator | Tennessee | US | Rank among states* | Table |
|---|---|---|---|---|
| Bachelor’s degree or more | 32.8% ±0.6% , number 1,663,817 ±28,440 | 37.4% ±0.1% , number 89,040,323 ±253,200 | 40th | A12001 |
| High school graduate or more | 91.0% ±0.9% , number 4,619,667 ±44,910 | 90.6% ±0.2% , number 216,058,026 ±368,200 | 35th | A12001 |
*1 is the highest. Population is ranked among all states, and the rest among those of 1,000 people or more, whose figures can be ranked. Ranks use 5-year estimates, the only ones covering every state, so they can differ slightly from the figures here.
Housing
Home values outran incomes
32.3% of households rent, lower than the US (34.7%). The median home is worth $341,200 and the median rent is $1,356. After inflation, home values rose 65% from 2015 to 2025, while household income rose 17%.
Housing costs and income, 2015 to 2025, after inflation
Source: ACS 1-year, table A10036, A18009, A14006.
Show data
| Tennessee | United States | |
|---|---|---|
| Median home value | +65.4% | +39.3% |
| Median rent | +26.1% | +18.5% |
| Median household income | +17.1% | +10.9% |
Embed
Types of homes
Source: ACS 2025 1-year, table A10032.
Show data
| Tennessee | United States | |
|---|---|---|
| Single-family, detached | 67.9% ±0.5% , number 2,233,490 ±16,950 | 60.9% ±0.1% , number 90,335,844 ±173,300 |
| Single-family, attached | 4.2% ±0.2% , number 139,692 ±6,698 | 6.4% ±<0.1% , number 9,527,703 ±51,230 |
| 2 to 4 units | 5.4% ±0.3% , number 176,846 ±8,895 | 7.5% ±0.1% , number 11,109,005 ±75,790 |
| 5 to 19 units | 7.9% ±0.4% , number 260,641 ±12,660 | 8.7% ±0.1% , number 12,829,882 ±97,590 |
| 20 or more units | 6.9% ±0.3% , number 226,337 ±11,030 | 11.1% ±0.1% , number 16,381,450 ±92,310 |
| Mobile homes and other | 7.7% ±0.3% , number 254,168 ±8,923 | 5.4% ±<0.1% , number 8,045,083 ±53,680 |
Embed
When homes were built
Source: ACS 2025 1-year, table A10055.
Show data
| Tennessee | United States | |
|---|---|---|
| 2010 or later | 20.2% ±0.5% , number 595,891 ±15,800 | 15.1% ±0.1% , number 20,257,912 ±101,300 |
| 2000 to 2009 | 15.3% ±0.4% , number 453,386 ±13,040 | 13.8% ±0.1% , number 18,535,840 ±92,260 |
| 1980 to 1999 | 26.6% ±0.6% , number 785,687 ±17,170 | 24.1% ±0.1% , number 32,332,570 ±118,900 |
| 1960 to 1979 | 22.7% ±0.6% , number 670,415 ±17,060 | 22.9% ±0.1% , number 30,726,302 ±110,000 |
| Before 1960 | 15.2% ±0.4% , number 448,717 ±12,240 | 24.0% ±0.1% , number 32,210,798 ±121,500 |
Embed
All the numbers
| Indicator | Tennessee | US | Rank among states* | Table |
|---|---|---|---|---|
| Housing units | 3,291,174 | – | – | A10001 |
| Households | 2,954,096 ±11,880 | – | – | A10008 |
| People per household | 2.42 ±0.01 | 2.49 ±0.01 | 26th | A10003 |
| Households that rent | 32.3% ±0.6% , number 955,330 ±17,490 | 34.7% ±0.1% , number 46,551,688 ±193,200 | 21st | A10060 |
| Vacant homes | 10.2% ±0.4% , number 337,078 ±11,980 | 9.6% ±0.1% , number 14,165,545 ±137,100 | 28th | A10047, A10060 |
| Median gross rent | $1,356 ±$17 | $1,557 ±$4 | 29th | A18009 |
| Median home value | $341,200 ±$3,027 | $371,100 ±$646 | 29th | A10036 |
| Renters paying 30% or more of income | 45.9% ±1.3% , number 438,835 ±14,500 | 48.3% ±0.2% , number 22,486,693 ±122,100 | 31st | A18002 |
| Owners paying 30% or more of income | 19.3% ±0.6% , number 386,549 ±11,870 | 24.2% ±0.1% , number 21,201,943 ±93,050 | 38th | A10040 |
| Homes built before 1960 | 15.2% ±0.4% , number 448,717 ±12,240 | 24.0% ±0.1% , number 32,210,798 ±121,500 | 36th | A10055 |
*1 is the highest. Population is ranked among all states, and the rest among those of 1,000 people or more, whose figures can be ranked. Ranks use 5-year estimates, the only ones covering every state, so they can differ slightly from the figures here.
Getting around
A driving state
75.4% of workers drive alone and 12.5% work from home. 37.9% of those who travel to work spend 30 minutes or more getting there, and 5.6% of households have no vehicle.
How people get to work
Source: ACS 2025 1-year, table A09005.
Show data
| Tennessee | United States | |
|---|---|---|
| Drive alone | 75.4% ±0.5% , number 2,647,831 ±24,560 | 69.8% ±0.1% , number 115,297,377 ±192,900 |
| Carpool | 8.8% ±0.3% , number 309,923 ±11,290 | 8.9% ±0.1% , number 14,712,170 ±97,240 |
| Public transit | 0.9% ±0.1% , number 31,302 ±5,262 | 4.3% ±<0.1% , number 7,100,386 ±63,330 |
| Walk | 1.3% ±0.1% , number 44,095 ±4,654 | 2.4% ±<0.1% , number 4,016,469 ±41,070 |
| Work from home | 12.5% ±0.3% , number 439,866 ±12,520 | 12.9% ±0.1% , number 21,288,393 ±105,700 |
| Other | 1.1% ±0.1% , number 40,144 ±4,277 | 1.7% ±<0.1% , number 2,799,658 ±41,510 |
Embed
Time spent getting to work
Source: ACS 2025 1-year, table B09001.
Show data
| Tennessee | United States | |
|---|---|---|
| Under 10 minutes | 11.3% ±0.4% , number 347,753 ±13,700 | 12.0% ±0.1% , number 17,199,225 ±93,440 |
| 10 to 19 minutes | 28.0% ±0.6% , number 861,176 ±19,970 | 27.8% ±0.1% , number 40,059,540 ±137,700 |
| 20 to 29 minutes | 22.8% ±0.6% , number 700,092 ±18,220 | 21.0% ±0.1% , number 30,221,743 ±111,100 |
| 30 to 39 minutes | 17.7% ±0.6% , number 543,016 ±18,240 | 17.1% ±0.1% , number 24,659,138 ±103,800 |
| 40 to 59 minutes | 12.5% ±0.5% , number 384,836 ±14,610 | 12.6% ±0.1% , number 18,104,709 ±97,070 |
| 60 minutes or more | 7.7% ±0.3% , number 236,422 ±10,700 | 9.5% ±0.1% , number 13,681,705 ±84,440 |
Embed
Vehicles per household
Source: ACS 2025 1-year, table A10030.
Show data
| Tennessee | United States | |
|---|---|---|
| None | 5.6% ±0.3% , number 165,335 ±9,417 | 8.8% ±0.1% , number 11,781,997 ±77,240 |
| One | 30.0% ±0.6% , number 885,885 ±18,760 | 33.1% ±0.1% , number 44,424,682 ±160,700 |
| Two | 37.5% ±0.7% , number 1,109,025 ±20,700 | 36.0% ±0.1% , number 48,200,889 ±176,800 |
| Three or more | 26.9% ±0.5% , number 793,851 ±16,480 | 22.1% ±0.1% , number 29,655,854 ±113,300 |
Embed
All the numbers
| Indicator | Tennessee | US | Rank among states* | Table |
|---|---|---|---|---|
| Drive to work alone | 75.4% ±0.5% , number 2,647,831 ±24,560 | 69.8% ±0.1% , number 115,297,377 ±192,900 | 14th | A09005 |
| Take public transit | 0.9% ±0.1% , number 31,302 ±5,262 | 4.3% ±<0.1% , number 7,100,386 ±63,330 | 46th | A09005 |
| Work from home | 12.5% ±0.3% , number 439,866 ±12,520 | 12.9% ±0.1% , number 21,288,393 ±105,700 | 31st | A09005 |
| Commute 30 minutes or more | 37.9% ±0.8% , number 1,164,274 ±25,700 | 39.2% ±0.1% , number 56,445,552 ±165,300 | 16th | B09001 |
| Households with no vehicle | 5.6% ±0.3% , number 165,335 ±9,181 | 8.8% ±<0.1% , number 11,781,997 ±64,240 | 44th | A10030 |
*1 is the highest. Population is ranked among all states, and the rest among those of 1,000 people or more, whose figures can be ranked. Ranks use 5-year estimates, the only ones covering every state, so they can differ slightly from the figures here.
Places
The largest cities in Tennessee
Population, from the latest estimates available. Figures cover the whole of each place.
Largest places
- Nashville-Davidson: 721,085
- Memphis: 609,633
- Knoxville: 202,009
- Chattanooga: 194,153
- Clarksville: 188,837
- Murfreesboro: 171,173
- Franklin: 90,233
- Johnson City: 73,828
Every county and place in Tennessee
Find any county, city, town, metro area, ZIP code, school district or district in Tennessee.
Counties
Each of the 95 counties with its population, from ACS 2020–2024 5-year estimates.
- Anderson County79,153
- Bedford County52,237
- Benton County16,006
- Bledsoe County15,032
- Blount County139,333
- Bradley County111,065
- Campbell County39,761
- Cannon County14,818
- Carroll County28,641
- Carter County56,712
- Cheatham County41,829
- Chester County17,611
- Claiborne County32,466
- Clay County7,670
- Cocke County36,813
- Coffee County59,710
- Crockett County13,944
- Cumberland County63,553
- Davidson County715,388
- Decatur County11,579
- DeKalb County20,959
- Dickson County55,983
- Dyer County36,508
- Fayette County43,267
- Fentress County19,309
- Franklin County43,990
- Gibson County50,869
- Giles County30,620
- Grainger County24,266
- Greene County71,628
- Grundy County13,819
- Hamblen County65,669
- Hamilton County376,192
- Hancock County6,852
- Hardeman County25,433
- Hardin County27,249
- Hawkins County57,964
- Haywood County17,475
- Henderson County27,980
- Henry County32,412
- Hickman County25,436
- Houston County8,353
- Humphreys County19,214
- Jackson County12,029
- Jefferson County56,864
- Johnson County18,196
- Knox County494,148
- Lake County6,579
- Lauderdale County24,784
- Lawrence County45,385
- Lewis County12,992
- Lincoln County35,946
- Loudon County58,580
- Macon County26,240
- Madison County99,295
- Marion County29,250
- Marshall County36,049
- Maury County107,791
- McMinn County54,884
- McNairy County25,970
- Meigs County13,343
- Monroe County47,695
- Montgomery County234,153
- Moore County6,674
- Morgan County21,361
- Obion County30,453
- Overton County23,065
- Perry County8,697
- Pickett County5,079
- Polk County17,898
- Putnam County82,558
- Rhea County33,992
- Roane County55,208
- Robertson County75,539
- Rutherford County360,646
- Scott County22,113
- Sequatchie County16,809
- Sevier County99,652
- Shelby County919,173
- Smith County20,389
- Stewart County14,027
- Sullivan County160,624
- Sumner County204,424
- Tipton County61,553
- Trousdale County11,957
- Unicoi County17,756
- Union County20,431
- Van Buren County6,437
- Warren County42,166
- Washington County136,261
- Wayne County16,168
- Weakley County33,016
- White County28,160
- Williamson County260,351
- Wilson County158,805
Cities, towns and other places
Each of the 502 with its population, from ACS 2020–2024 5-year estimates. Census-designated places are communities without a local government of their own, drawn by the Census Bureau so they can be counted.
- Adams888
- Adamsville2,278
- Alamo2,311
- Alcoa12,222
- Alexandria1,136
- Algood4,036
- Allardt1,076
- Altamont1,322
- Andersonville353
- Apison4,271
- Ardmore1,073
- Arlington15,205
- Ashland City5,424
- Athens14,471
- Atoka10,385
- Atwood1,108
- Auburntown318
- Baileyton551
- Baneberry700
- Banner Hill1,211
- Bartlett56,876
- Baxter1,361
- Bean Station3,016
- Beech Bluff437
- Beersheba Springs654
- Bell Buckle529
- Belle Meade2,708
- Bells2,373
- Belvidere82
- Benton1,560
- Berry Hill1,980
- Bethel Springs664
- Bethpage289
- Big Rock163
- Big Sandy507
- Biltmore1,846
- Blaine3,213
- Blanche156
- Bloomingdale9,292
- Blountville3,309
- Bluff City2,225
- Bogota67
- Bolivar5,144
- Bon Air205
- Bon Aqua Junction1,586
- Bowman422
- Braden308
- Bradford1,385
- Brentwood45,556
- Briceville175
- Brighton2,889
- Bristol27,636
- Brownsville9,622
- Bruceton1,431
- Buchanan105
- Bulls Gap948
- Burlison398
- Burns1,884
- Butler127
- Byrdstown1,141
- Calhoun546
- Camden3,678
- Carthage2,327
- Caryville2,073
- Castalian Springs678
- Cedar Hill395
- Celina1,941
- Centertown263
- Centerville3,535
- Central1,938
- Chapel Hill1,712
- Charleston956
- Charlotte2,164
- Chattanooga185,783
- Chesterfield356
- Chewalla150
- Childers Hill18
- Christiana4,777
- Church Hill7,139
- Clarkrange554
- Clarksburg895
- Clarksville176,456
- Cleveland48,829
- Clifton2,660
- Clinton10,239
- Coalfield2,754
- Coalmont906
- Coker Creek155
- Collegedale11,330
- Collierville51,515
- Collinwood996
- Colonial Heights3,258
- Columbia45,441
- Conasauga128
- Cookeville36,088
- Coopertown4,640
- Copperhill493
- Cornersville1,847
- Cosby779
- Cottage Grove60
- Cottontown374
- Counce276
- Covington8,587
- Cowan1,934
- Crab Orchard980
- Cross Plains1,922
- Crossville12,428
- Crump1,231
- Cumberland City574
- Cumberland Gap309
- Dancyville53
- Dandridge3,538
- Darden582
- Dayton7,625
- Decatur1,898
- Decaturville934
- Decherd2,976
- Delano838
- Dellrose86
- Dickson16,424
- Dodson Branch1,425
- Dover1,956
- Dowelltown434
- Doyle532
- Dresden2,943
- Ducktown456
- Dukedom92
- Dunlap5,678
- Dyer2,217
- Dyersburg15,979
- Eagleton Village5,598
- Eagleville999
- East Cleveland1,934
- East Ridge22,070
- Eastview767
- Elgin347
- Elizabethton14,374
- Elkton469
- Embreeville1,062
- Englewood1,818
- Enville163
- Erin1,058
- Erwin5,988
- Essary Springs154
- Estill Springs2,695
- Ethridge419
- Etowah3,658
- Eva109
- Fairfield351
- Fairfield Glade9,487
- Fairgarden262
- Fairmount2,110
- Fairview10,009
- Fall Branch1,160
- Falling Water2,315
- Farner197
- Farragut24,634
- Fayetteville7,057
- Fincastle1,374
- Finger669
- Finley481
- Flat Top Mountain1,004
- Flintville525
- Forest Hills4,683
- Fowlkes753
- Frankewing19
- Franklin87,133
- Friendship692
- Friendsville980
- Gadsden459
- Gainesboro1,064
- Gallatin48,532
- Gallaway609
- Garland370
- Gates619
- Gatlinburg3,663
- Germantown40,673
- Gibson479
- Gilt Edge516
- Gladeville2,199
- Gleason1,159
- Goodlettsville17,597
- Gordonsville1,299
- Graball288
- Grand Junction435
- Gray2,237
- Graysville1,304
- Green Hill6,866
- Greenback1,378
- Greenbrier6,971
- Greeneville15,646
- Greenfield2,264
- Greenvale161
- Griffith Creek586
- Grimsley1,171
- Gruetli-Laager1,480
- Guys423
- Halls CDP10,272
- Halls town2,034
- Hampton1,883
- Harriman6,090
- Harrison8,011
- Harrogate4,368
- Hartsville/Trousdale County11,957
- Helenwood101
- Henderson6,411
- Hendersonville63,091
- Henning977
- Henry534
- Hickman276
- Hickory Valley126
- Hilham267
- Hillsboro555
- Hohenwald3,884
- Holladay130
- Hollow Rock739
- Hopewell2,634
- Hornbeak540
- Hornsby228
- Humboldt7,787
- Hunter1,918
- Huntingdon4,441
- Huntland1,532
- Huntsville1,814
- Iron City282
- Jacks Creek28
- Jacksboro2,650
- Jackson68,435
- Jamestown2,230
- Jasper3,612
- Jefferson City8,579
- Jellico1,855
- John Sevier1,177
- Johnson City72,222
- Jonesborough6,232
- Kahite892
- Karns4,115
- Kenton1,513
- Kimball1,639
- Kingsport56,262
- Kingston6,224
- Kingston Springs2,791
- Knoxville195,185
- La Follette7,273
- La Grange62
- La Vergne40,243
- Lafayette5,727
- Lake Tansi4,437
- Lakeland14,192
- Lakesite2,168
- Lakewood Park1,140
- Lavinia82
- Lawrenceburg11,844
- Lebanon44,788
- Lenoir City11,110
- Lenox348
- Leoma374
- Lewisburg12,861
- Lexington7,962
- Liberty406
- Linden1,122
- Livingston3,999
- Lobelville1,007
- Lone Oak1,422
- Lookout Mountain2,111
- Loretto1,731
- Loudon6,432
- Louisville4,383
- Luray77
- Luttrell1,158
- Lyles1,385
- Lynchburg, Moore County6,674
- Lynnville465
- Madisonville5,241
- Manchester12,944
- Martin10,915
- Maryville32,392
- Mascot3,277
- Mason1,039
- Maury City683
- Mayland365
- Maynardville2,528
- McDonald712
- McEwen1,806
- McKenzie5,631
- McLemoresville391
- McMinnville13,844
- Medina5,407
- Medon201
- Memphis618,980
- Mercer128
- Michie558
- Middle Valley12,187
- Middleton743
- Midtown1,369
- Milan8,244
- Milledgeville299
- Millersville5,836
- Millington11,289
- Minor Hill704
- Miston96
- Mitchellville176
- Monteagle1,926
- Monterey2,768
- Mooresburg755
- Morris Chapel218
- Morrison850
- Morristown31,527
- Moscow768
- Mosheim2,511
- Mount Carmel5,472
- Mount Juliet42,073
- Mount Pleasant4,837
- Mountain City2,542
- Mowbray Mountain1,721
- Munford6,588
- Murfreesboro161,445
- Nashville-Davidson690,130
- New Deal226
- New Hope862
- New Johnsonville2,060
- New Market1,619
- New Tazewell2,799
- New Union2,160
- Newbern3,289
- Newport6,881
- Niota735
- Nixon294
- Nolensville15,074
- Norene137
- Normandy106
- Norris1,485
- Oak Grove (Sumner County)248
- Oak Grove (Washington County)4,626
- Oak Hill4,617
- Oak Ridge32,693
- Oakdale175
- Oakland9,979
- Obion1,087
- Ocoee208
- Oliver Springs3,281
- Olivet1,377
- Oneida3,819
- Ooltewah578
- Orebank816
- Orlinda1,214
- Orme76
- Palmer818
- Palmersville114
- Paris10,338
- Park City2,813
- Parker's Crossroads615
- Parrottsville374
- Parsons2,686
- Pegram2,089
- Pelham704
- Petersburg508
- Petros352
- Philadelphia684
- Pigeon Forge6,375
- Pikeville2,319
- Pine Crest2,029
- Pinson565
- Piperton2,569
- Pittman Center583
- Plainview2,458
- Pleasant Hill514
- Pleasant View5,276
- Pocahontas391
- Portland13,449
- Powell13,739
- Powells Crossroads1,498
- Prospect145
- Pulaski8,285
- Puryear736
- Ramer243
- Randolph252
- Rarity Bay757
- Red Bank12,010
- Red Boiling Springs1,262
- Riceville823
- Ridgely1,796
- Ridgeside879
- Ridgetop1,995
- Ripley7,658
- Rives162
- Roan Mountain797
- Robbins133
- Rockford824
- Rockvale1,611
- Rockwood5,566
- Rocky Top1,607
- Rogersville4,647
- Rossville1,142
- Rural Hill2,075
- Russellville684
- Rutherford1,119
- Rutledge1,676
- Sale Creek2,955
- Saltillo753
- Samburg231
- Sardis536
- Saulsbury304
- Savannah7,412
- Scotts Hill1,083
- Selmer4,488
- Sequatchie359
- Sevierville18,397
- Sewanee2,936
- Seymour16,216
- Shackle Island4,404
- Sharon1,036
- Shelbyville24,661
- Sherwood43
- Shiloh130
- Signal Mountain8,860
- Silerton81
- Slayden189
- Smithville5,288
- Smyrna56,692
- Sneedville1,364
- Soddy-Daisy13,231
- Somerville3,466
- South Carthage2,364
- South Cleveland7,452
- South Fulton2,379
- South Pittsburg3,013
- Sparta4,939
- Spencer1,511
- Spring City2,358
- Spring Hill55,765
- Springfield19,255
- Spurgeon4,071
- St. Joseph783
- Stanton704
- Stantonville313
- Statesville201
- Strawberry Plains2,669
- Sullivan Gardens1,267
- Summertown733
- Sunbright792
- Surgoinsville1,911
- Sweetwater6,532
- Taft251
- Tazewell2,902
- Telford731
- Tellico Plains1,146
- Tellico Village7,414
- Tennessee Ridge1,726
- Thompson's Station8,294
- Three Way2,008
- Tiptonville3,572
- Toone289
- Townsend701
- Tracy City1,682
- Trenton4,151
- Trezevant980
- Trimble554
- Troy1,827
- Tuckers Crossroads426
- Tullahoma21,103
- Tusculum3,337
- Unicoi3,806
- Union City10,982
- Unionville1,275
- Valley Forge2,136
- Vanleer666
- Viola144
- Vonore2,191
- Walden1,845
- Walland377
- Walnut Grove (Hardin County)403
- Walnut Grove (Sumner County)575
- Walnut Hill2,415
- Walterhill113
- Wartburg1,191
- Wartrace630
- Watauga644
- Watertown1,463
- Waverly4,302
- Waynesboro2,296
- Westmoreland2,845
- Westpoint139
- White Bluff4,080
- White House14,631
- White Pine2,565
- Whiteside33
- Whiteville4,530
- Whitlock18
- Whitwell2,052
- Wildersville78
- Wildwood968
- Wildwood Lake3,495
- Williston480
- Winchester9,799
- Winfield1,153
- Woodbury2,774
- Woodland Mills624
- Wrigley50
- Wynnburg16
- Yorkville307
- Yuma54
Metro and micro areas
Each of the 27 that reach into Tennessee, with its whole population, from ACS 2020–2024 5-year estimates. Metro and micro areas are counties tied together by commuting, drawn by the Office of Management and Budget.
- Athens, TN Micro Area68,227
- Chattanooga, TN-GA Metro Area575,812
- Clarksville, TN-KY Metro Area334,564
- Cleveland, TN Metro Area128,963
- Cookeville, TN Micro Area145,812
- Crossville, TN Micro Area63,553
- Dyersburg, TN Micro Area36,508
- Fayetteville, TN Micro Area35,946
- Greeneville, TN Micro Area71,628
- Jackson, TN Metro Area181,719
- Johnson City, TN Metro Area210,729
- Kingsport-Bristol, TN-VA Metro Area310,842
- Knoxville, TN Metro Area932,241
- Lawrenceburg, TN Micro Area45,385
- Lewisburg, TN Micro Area36,049
- Martin, TN Micro Area33,016
- McMinnville, TN Micro Area42,166
- Memphis, TN-MS-AR Metro Area1.34M
- Morristown, TN Metro Area122,533
- Nashville-Davidson--Murfreesboro--Franklin, TN Metro Area2.08M
- Newport, TN Micro Area36,813
- Paris, TN Micro Area32,412
- Sevierville, TN Micro Area99,652
- Shelbyville, TN Micro Area52,237
- Tullahoma-Manchester, TN Micro Area66,384
- Union City, TN Micro Area30,453
- Winchester, TN Micro Area43,990
ZIP codes
Each of the 619 with people in it, by the town it's centered in, from ACS 2020–2024 5-year estimates. These are the Census Bureau's ZIP Code Tabulation Areas, which follow the Postal Service's ZIP codes as closely as census blocks allow.
- 37010Adams5,435
- 37012Alexandria2,118
- 37013Nashville-Davidson105,212
- 37014Nolensville3,227
- 37015Ashland City18,988
- 37016Auburntown900
- 37018Lakewood Park2,501
- 37019Lewisburg455
- 37020Bell Buckle5,000
- 37022Bethpage5,728
- 37023Big Rock1,677
- 37025Bon Aqua Junction6,854
- 37026Lakewood Park2,054
- 37027Brentwood61,630
- 37028Big Rock615
- 37029Burns6,405
- 37030Carthage8,183
- 37031Castalian Springs3,926
- 37032Cedar Hill5,453
- 37033Centerville8,249
- 37034Chapel Hill8,867
- 37035Pleasant View4,181
- 37036Charlotte7,205
- 37037Christiana9,855
- 37040Clarksville64,977
- 37042Clarksville87,652
- 37043Clarksville58,742
- 37046Eagleville7,310
- 37047Cornersville2,834
- 37048Walnut Grove6,380
- 37049Cross Plains4,160
- 37050Cumberland City1,815
- 37051Slayden3,765
- 37052Slayden1,659
- 37055Dickson29,035
- 37057Hartsville/Trousdale County1,016
- 37058Dover7,623
- 37059Dowelltown1,590
- 37060Eagleville3,396
- 37061Erin5,382
- 37062Fairview13,851
- 37064Thompson's Station67,513
- 37066Gallatin64,650
- 37067Franklin31,556
- 37069Franklin20,209
- 37072Nashville-Davidson32,208
- 37073Greenbrier14,995
- 37074Hartsville/Trousdale County10,932
- 37075Hendersonville73,522
- 37076Nashville-Davidson39,017
- 37078974
- 37079Cumberland City2,960
- 37080Nashville-Davidson6,844
- 37082Kingston Springs5,517
- 37083Lafayette17,364
- 37085Walterhill5,853
- 37086La Vergne38,872
- 37087Lebanon56,655
- 37090Norene19,774
- 37091Lewisburg24,747
- 37095Liberty1,697
- 37096Linden6,004
- 37097Lobelville2,473
- 37098Wrigley6,046
- 37101McEwen6,484
- 37110McMinnville34,296
- 37115Nashville-Davidson40,615
- 37118Greenvale1,094
- 37122Mount Juliet68,492
- 37127Murfreesboro21,499
- 37128Murfreesboro79,268
- 37129Smyrna63,652
- 37130Walterhill58,064
- 37132Murfreesboro2,704
- 37134New Johnsonville3,231
- 37135Nolensville24,409
- 37137Centerville2,090
- 37138Nashville-Davidson22,575
- 371401,494
- 37141Orlinda1,618
- 37142Cumberland City1,506
- 37143Pegram4,214
- 37144Petersburg2,892
- 37145Carthage2,442
- 37146Coopertown7,598
- 37148Portland26,274
- 37149Woodbury2,602
- 37150Red Boiling Springs4,476
- 37151Carthage457
- 37153Rockvale5,682
- 37160Shelbyville38,148
- 37165Slayden35
- 37166Smithville15,731
- 37167Smyrna66,504
- 371711,402
- 37172Springfield31,263
- 37174Spring Hill53,900
- 37175Tennessee Ridge953
- 37178Tennessee Ridge1,994
- 37179Thompson's Station18,043
- 37180Unionville3,397
- 37181Vanleer1,886
- 37183Wartrace3,523
- 37184Watertown7,289
- 37185Waverly9,072
- 37186Westmoreland10,709
- 37187White Bluff7,988
- 37188White House18,241
- 37189Nashville-Davidson3,442
- 37190Woodbury9,525
- 371913,860
- 37201Nashville-Davidson1,467
- 37203Nashville-Davidson21,442
- 37204Oak Hill16,469
- 37205Nashville-Davidson24,823
- 37206Nashville-Davidson28,545
- 37207Nashville-Davidson41,366
- 37208Nashville-Davidson20,889
- 37209Nashville-Davidson37,817
- 37210Nashville-Davidson17,725
- 37211Nashville-Davidson76,573
- 37212Nashville-Davidson20,592
- 37213Nashville-Davidson25
- 37214Nashville-Davidson29,805
- 37215Forest Hills22,018
- 37216Nashville-Davidson19,038
- 37217Nashville-Davidson31,869
- 37218Nashville-Davidson15,292
- 37219Nashville-Davidson2,398
- 37220Oak Hill5,265
- 37221Nashville-Davidson41,935
- 37228Nashville-Davidson2,585
- 37301Altamont1,528
- 37302Apison5,082
- 37303Athens25,688
- 37305Altamont1,019
- 37306Belvidere1,919
- 37307Benton5,302
- 37308Sale Creek3,188
- 37309Calhoun2,136
- 37310Charleston4,370
- 37311South Cleveland30,720
- 37312Hopewell36,669
- 37313Gruetli-Laager1,590
- 37315Collegedale1,825
- 37317Ducktown2,582
- 37318Cowan2,103
- 37321Dayton21,084
- 37322Decatur9,101
- 37323Wildwood Lake31,948
- 37324Sewanee5,628
- 37325Delano2,007
- 37326Ducktown411
- 37327Dunlap13,480
- 37328Flintville1,930
- 37329Englewood6,591
- 37330Estill Springs7,204
- 37331Etowah7,613
- 37332Spring City1,724
- 37333Farner513
- 37334Fayetteville23,790
- 37335Flintville2,527
- 37336Hopewell4,483
- 37337Spring City1,241
- 37338Flat Top Mountain3,309
- 37339Gruetli-Laager1,319
- 37340Whiteside288
- 37341Lakesite15,591
- 37342Hillsboro3,863
- 37343Middle Valley45,101
- 37345Huntland2,659
- 37347Jasper8,607
- 37348Flintville1,044
- 37350Lookout Mountain2,111
- 37351Chattanooga281
- 37352Lynchburg, Moore County3,166
- 37353McDonald5,330
- 37354Madisonville17,356
- 37355New Union29,805
- 37356Monteagle2,679
- 37357Morrison6,210
- 37359Lynchburg, Moore County1,062
- 37360Normandy1,719
- 37361Ocoee2,166
- 37362Conasauga3,430
- 37363Ooltewah42,093
- 37365Palmer1,678
- 37366Pelham1,216
- 37367Pikeville11,169
- 37369Delano713
- 37370Riceville5,414
- 37373Sale Creek3,273
- 37374Sequatchie1,497
- 37375Sewanee3,866
- 37376Sherwood361
- 37377Lone Oak17,188
- 37379Mowbray Mountain29,430
- 37380South Pittsburg6,688
- 37381Spring City10,711
- 37383Sewanee344
- 37385Tellico Plains9,015
- 37387Tracy City3,674
- 37388Tullahoma27,939
- 37391Ducktown1,530
- 37394Viola114
- 37396Whiteside44
- 37397Whitwell10,488
- 37398Winchester15,755
- 37402Chattanooga3,953
- 37403Chattanooga6,413
- 37404Chattanooga14,737
- 37405Signal Mountain18,109
- 37406Chattanooga13,364
- 37407Chattanooga9,156
- 37408Chattanooga3,502
- 37409Chattanooga3,357
- 37410Chattanooga4,129
- 37411Chattanooga18,997
- 37412East Ridge21,864
- 37415Red Bank24,181
- 37416Chattanooga13,919
- 37419Whiteside5,980
- 37421Chattanooga52,985
- 37601Central38,008
- 37604Johnson City39,097
- 37614Johnson City2,767
- 37615Gray22,821
- 37616Tusculum5,762
- 37617Blountville14,744
- 37618Bluff City12,548
- 37620Bristol38,494
- 37640Butler3,851
- 37641Tusculum9,733
- 37642Church Hill15,011
- 37643Hunter34,120
- 37645Mount Carmel5,472
- 37650Banner Hill12,774
- 37656Fall Branch3,849
- 376571,060
- 37658Hampton3,854
- 37659Jonesborough29,080
- 37660Kingsport40,996
- 37663Spurgeon14,230
- 37664Kingsport28,267
- 37665Kingsport4,741
- 37680Mountain City897
- 37681Telford5,723
- 37682Elizabethton591
- 37683Mountain City12,943
- 37686Bluff City9,495
- 37687Roan Mountain4,493
- 37688Mountain City1,138
- 37690Telford4,722
- 37691Mountain City475
- 37692Unicoi4,766
- 37694Watauga1,729
- 37701Alcoa10,247
- 37705Andersonville5,239
- 37708Bean Station6,512
- 37709Blaine4,177
- 37710Briceville1,083
- 37711Bulls Gap5,644
- 37713Parrottsville1,425
- 37714Briceville4,421
- 37715Jellico806
- 37716Clinton27,425
- 37719Coalfield45
- 37721Plainview14,306
- 37722Cosby6,708
- 37723Fairfield Glade1,420
- 37724Harrogate2,214
- 37725Dandridge18,301
- 37726Sunbright2,556
- 377271,936
- 37729Jellico1,279
- 37730Jellico33
- 37731564
- 37737Friendsville7,081
- 37738Gatlinburg4,952
- 37742Greenback7,046
- 37743Greeneville24,548
- 37745Baileyton21,090
- 37748Harriman17,575
- 37752Harrogate6,185
- 37753Cosby917
- 37754Andersonville4,211
- 37755Huntsville3,404
- 377562,881
- 37757Rocky Top10,100
- 37760Jefferson City13,253
- 37762Jellico2,536
- 37763Kingston16,984
- 37764Sevierville12,562
- 37765Sneedville370
- 37766Fincastle18,554
- 37769Rocky Top5,848
- 37770Wartburg2,756
- 37771Lenoir City18,042
- 37772Lenoir City14,646
- 37774Loudon21,784
- 37777Louisville12,877
- 37779Luttrell3,649
- 37801Greenback28,090
- 37803Maryville33,822
- 37804Wildwood27,382
- 37806Mascot3,674
- 37807Maynardville11,069
- 37809Mosheim2,181
- 37810Bulls Gap1,823
- 37811Mooresburg3,931
- 37813Morristown18,288
- 37814Morristown35,239
- 37818Mosheim5,774
- 37819Jellico475
- 37820New Market8,327
- 37821Newport22,909
- 37825New Tazewell8,409
- 37826Niota3,449
- 37828Norris1,371
- 37829Oakdale1,977
- 37830Oak Ridge33,038
- 37840Oliver Springs10,004
- 37841Oneida10,199
- 37843Parrottsville4,426
- 37845Petros171
- 37846Philadelphia4,579
- 37847Jacksboro2,513
- 37848Luttrell145
- 37849Powell29,375
- 37852Elgin2,733
- 37853Rockford3,365
- 37854Rockwood12,478
- 37857Rogersville21,657
- 37860Russellville3,700
- 37861Rutledge8,608
- 37862Townsend21,767
- 37863Pigeon Forge6,617
- 37865Seymour25,074
- 37866Maynardville2,468
- 37869Sneedville5,271
- 378704,385
- 37871Strawberry Plains9,926
- 37872Sunbright2,346
- 37873Surgoinsville3,960
- 37874Sweetwater16,567
- 37876Fairgarden33,561
- 37877Jefferson City9,185
- 37878761
- 37879Tazewell11,854
- 378803,599
- 37881Bean Station1,677
- 37882Townsend2,914
- 37885Kahite6,271
- 37886Walland3,670
- 37887Wartburg6,555
- 37888Rutledge3,432
- 37890White Pine6,821
- 37891Bulls Gap3,671
- 37892Winfield1,631
- 37902Knoxville2,412
- 37909Knoxville16,774
- 37912Knoxville21,505
- 37914John Sevier21,478
- 37915Knoxville5,991
- 37916Knoxville15,583
- 37917Knoxville24,615
- 37918Knoxville45,971
- 37919Knoxville31,754
- 37920Seymour44,995
- 37921Knoxville28,717
- 37922Louisville40,394
- 37923Karns30,131
- 37924John Sevier14,420
- 37931Karns31,842
- 37932Farragut25,424
- 37934Farragut28,272
- 37938Halls CDP17,437
- 38001Alamo4,156
- 38002Arlington43,882
- 38004Atoka12,001
- 38006Bells5,303
- 38008Bolivar9,057
- 38011Brighton9,948
- 38012Brownsville13,031
- 38015Gilt Edge1,950
- 38016Memphis44,136
- 38017Collierville56,826
- 38018Memphis38,527
- 38019Covington15,760
- 38023Randolph5,682
- 38024Dyersburg25,952
- 38028Arlington7,992
- 38030Finley228
- 38034Friendship3,230
- 38036Gallaway207
- 38037Gates1,749
- 38039Grand Junction1,305
- 38040Halls town4,416
- 38041Henning4,161
- 38042Hickory Valley464
- 38044Hornsby791
- 38046La Grange11
- 38047Lenox205
- 38049Mason3,957
- 38050Maury City402
- 38052Middleton3,668
- 38053Millington25,303
- 38054Millington102
- 38057Moscow3,563
- 38058Munford10,303
- 38059Newbern8,281
- 38060Oakland12,552
- 38061Pocahontas1,138
- 38063Henning15,958
- 38066Rossville3,446
- 38067Saulsbury1,830
- 38068Somerville10,427
- 38069Stanton3,015
- 38070Friendship141
- 38075Whiteville6,324
- 38076Williston954
- 38079Tiptonville4,262
- 38080Miston2,506
- 38103Memphis14,534
- 38104Memphis22,634
- 38105Memphis5,534
- 38106Memphis20,962
- 38107Memphis13,912
- 38108Memphis17,562
- 38109Memphis42,452
- 38111Memphis41,934
- 38112Memphis16,809
- 38114Memphis20,298
- 38115Memphis38,491
- 38116Memphis40,061
- 38117Memphis25,776
- 38118Memphis39,107
- 38119Memphis23,464
- 38120Memphis13,309
- 38122Memphis26,021
- 38125Germantown43,071
- 38126Memphis5,946
- 3812739,541
- 38128Memphis42,162
- 38132Memphis30
- 38133Bartlett21,278
- 38134Memphis43,947
- 38135Bartlett30,317
- 38138Germantown25,167
- 38139Germantown16,466
- 38141Memphis23,952
- 38152Memphis438
- 38201McKenzie10,472
- 38220Atwood1,720
- 38221Big Sandy3,098
- 38222Buchanan2,092
- 38224Cottage Grove1,042
- 38225Dresden5,881
- 38226Dukedom226
- 38229Gleason2,378
- 38230Greenfield3,765
- 38231Henry1,929
- 38232Hornbeak2,238
- 38233Kenton2,674
- 38235McLemoresville199
- 38236Henry1,127
- 38237Martin15,627
- 38240Hornbeak1,620
- 38241Palmersville835
- 38242Paris19,293
- 38251Puryear3,259
- 38253Rives917
- 38255Sharon2,271
- 38256Big Sandy3,248
- 38257South Fulton4,437
- 38258Trezevant1,445
- 38259Trimble672
- 38260Troy3,720
- 38261Woodland Mills16,385
- 38301Jackson33,536
- 38305Jackson53,488
- 38310Adamsville6,556
- 38311Clifton724
- 38313Beech Bluff3,288
- 38315Bethel Springs3,631
- 38316Bradford3,289
- 38317Hollow Rock2,584
- 38318Bruceton404
- 38320Camden10,430
- 38321Lavinia2,397
- 38326Counce2,366
- 38327Crump693
- 38328Darden858
- 38329Decaturville3,166
- 38330Dyer3,793
- 38332Enville1,188
- 38333Eva262
- 38334Finger2,004
- 38337Gadsden1,379
- 38338Gibson54
- 38339Guys503
- 38340Henderson12,694
- 38341Holladay2,578
- 38342Hollow Rock1,183
- 38343Humboldt15,837
- 38344Huntingdon8,931
- 38345Luray1,423
- 38347Jacks Creek257
- 38348Lavinia975
- 38351Lexington18,248
- 38352Jacks Creek722
- 38355Medina8,353
- 38356Medon2,387
- 38357Michie3,516
- 38358Milan12,874
- 38359Milledgeville307
- 38361Morris Chapel1,092
- 38362Three Way1,011
- 38363Parsons5,808
- 38365Counce42
- 38366Pinson2,336
- 38367Ramer2,541
- 38368Sardis2,635
- 38369Rutherford1,543
- 38370Saltillo1,079
- 38371Sardis1,092
- 38372Olivet17,873
- 38374Scotts Hill1,815
- 38375Selmer8,475
- 38376Shiloh280
- 38379Stantonville1,611
- 38380Holladay525
- 38381Toone1,490
- 38382Trenton8,432
- 38387Yuma407
- 38388Wildersville1,625
- 38389Yorkville76
- 38390Yuma1,170
- 38391Mercer1,440
- 38392Mercer767
- 38401Columbia67,482
- 38425Clifton3,518
- 38449Ardmore2,911
- 38450Collinwood2,611
- 38451Lynnville4,145
- 38452Collinwood1,294
- 38453Dellrose525
- 38454Centerville1,084
- 38455Elkton119
- 38456Ethridge4,561
- 38457Minor Hill567
- 38459Frankewing541
- 38460Minor Hill1,711
- 384611,460
- 38462Hohenwald9,986
- 38463Iron City2,644
- 38464Lawrenceburg23,504
- 38468Leoma5,545
- 38469Loretto4,647
- 38471Walnut Grove319
- 38472Lynnville2,464
- 38473Minor Hill1,129
- 38474Mount Pleasant9,143
- 38475Clifton873
- 38476Bon Aqua Junction1,228
- 38477Prospect2,821
- 38478Pulaski18,943
- 38481St. Joseph890
- 384822,017
- 38483Summertown7,610
- 38485Waynesboro6,165
- 38486Westpoint1,301
- 38487746
- 38488Taft2,138
- 38501Algood42,471
- 38504Allardt689
- 38505Cookeville960
- 38506Algood30,100
- 385411,542
- 38543336
- 38544Baxter8,175
- 38545Baxter1,575
- 38547Hickman2,088
- 38548Gordonsville1,154
- 38549Byrdstown4,141
- 38550Doyle17
- 38551Celina4,477
- 38552Gordonsville472
- 38553Clarkrange2,521
- 38554Grimsley719
- 38555Lake Tansi21,584
- 38556Jamestown12,936
- 38558Fairfield Glade9,472
- 38559Doyle1,551
- 38560Gordonsville1,432
- 38562Gainesboro6,493
- 38563South Carthage1,826
- 38564501
- 38565Grimsley1,205
- 38567Hickman1,065
- 38568Hilham2,243
- 38569Hickman390
- 38570Livingston10,255
- 38571Bowman14,678
- 38572Lake Tansi12,083
- 38573Byrdstown2,097
- 38574Monterey9,079
- 38575Celina865
- 38577Jamestown1,339
- 38578Pleasant Hill129
- 38579Doyle1,475
- 38580Livingston1,609
- 38581Spencer4,079
- 38582Baxter1,729
- 38583Sparta25,584
- 38585Spencer4,084
- 38587Doyle1,446
- 38588Gainesboro1,025
- 38589Grimsley527
Towns and townships
Each of the 12 with people in it, from ACS 2020–2024 5-year estimates: the county subdivisions that are governments of their own. A city, borough or village that is one too is listed with the places above.
- District 102,883
- District 112,145
- District 122,403
- District 132,324
- District 142,764
- District 152,381
- District 163,356
- District 172,524
- District 182,575
- District 192,368
- District 203,159
- District 212,913
Consolidated cities
A city and county governed as one, with the towns inside it that keep governments of their own.
School districts
Each of the 157 with people in it, from ACS 2020–2024 5-year estimates. Elementary districts teach the lower grades and secondary districts the upper ones, under them; the rest are unified, teaching every grade.
- Alamo City School Districtelementary4,303
- Alcoa City School District12,222
- Anderson County School District40,085
- Anderson County School District in Clintonsecondary10,239
- Arlington Community School District15,205
- Arlington Community Schools in Lakeland (9-12)secondary14,232
- Athens City Schoolselementary14,471
- Bartlett City School District56,876
- Bedford County School District52,237
- Bells City School Districtelementary3,564
- Benton County School District16,006
- Bledsoe County School District15,032
- Blount County School District94,719
- Bradford Special School District4,150
- Bradley County School District62,236
- Bristol City School District27,367
- Campbell County School District39,761
- Cannon County School District14,818
- Carter County School District42,338
- Cheatham County School District41,829
- Chester County School District17,611
- Claiborne County School District32,466
- Clarksville-Montgomery County School System226,503
- Clay County School District7,670
- Cleveland City School District48,829
- Clinton City School Districtelementary10,239
- Cocke County School District29,932
- Cocke County School District in Newportsecondary6,881
- Coffee County School District27,723
- Coffee County School District in Manchestersecondary12,710
- Collierville School District51,515
- Crockett County School District6,077
- Crockett County School District in Alamosecondary4,303
- Crockett County School District in Bellssecondary3,564
- Cumberland County School District63,553
- Dayton City Elementary School Districtelementary7,625
- Decatur County School District11,579
- DeKalb County School District20,959
- Dickson County School District55,983
- Dyer County School District20,529
- Dyersburg City School District15,979
- Elizabethton City School District14,374
- Etowah City School Districtelementary3,658
- Fayette County School District43,267
- Fayetteville City School District7,057
- Fentress County School District19,309
- Fort Campbell Schools7,650
- Franklin County School District42,164
- Franklin Special School Districtelementary40,530
- Germantown Municipal School District40,673
- Gibson County School District19,798
- Giles County School District30,620
- Grainger County School District24,266
- Greene County School District55,975
- Greeneville City School District15,653
- Grundy County School District13,819
- Hamblen County School District65,669
- Hamilton County School District376,192
- Hancock County School District6,852
- Hardeman County School District25,433
- Hardin County School District27,249
- Hawkins County School District50,512
- Hawkins County School District in Rogersvillesecondary4,647
- Haywood County School District17,475
- Henderson County School District20,018
- Henderson County School District in Lexingtonsecondary7,962
- Henry County School District20,526
- Henry County School District in Parissecondary11,886
- Hickman County School District25,436
- Hollow Rock-Bruceton Special School District3,683
- Houston County School District8,353
- Humboldt City School District7,753
- Humphreys County School District19,214
- Huntingdon Special School District7,474
- Jackson County School District12,029
- Jackson-Madison County School System99,295
- Jefferson County School District56,864
- Johnson City School District66,604
- Johnson County School District18,196
- Kingsport City School District56,175
- Knox County School District494,148
- Lake County School District6,579
- Lakeland School System Districtelementary14,232
- Lauderdale County School District24,784
- Lawrence County School District45,385
- Lebanon Special School Districtelementary42,670
- Lenoir City School District11,044
- Lewis County School District12,992
- Lexington City School Systemelementary7,962
- Lincoln County School District28,889
- Loudon County School District47,536
- Macon County School District26,240
- Manchester City School Districtelementary12,710
- Marion County School District28,077
- Marshall County School District36,049
- Maryville City School District32,392
- Maury County School District107,791
- McKenzie Special School District8,009
- McMinn County School District36,755
- McMinn County School District in Athenssecondary14,471
- McMinn County School District in Etowahsecondary3,658
- McNairy County School District25,970
- Meigs County School District13,343
- Metropolitan Nashville Public School District715,388
- Milan Special School District11,092
- Millington Municipal School District15,796
- Monroe County School District34,857
- Monroe County School District in Sweetwatersecondary12,838
- Moore County School District6,674
- Morgan County School District21,361
- Murfreesboro City School Districtelementary161,192
- Newport City School Districtelementary6,881
- Oak Ridge City School District32,693
- Obion County School District19,598
- Oneida Special School District3,032
- Overton County School District23,065
- Paris Special School Districtelementary11,886
- Perry County School District8,697
- Pickett County School District5,079
- Polk County School District17,898
- Putnam County School District82,558
- Rhea County School District26,367
- Rhea County School District in Daytonsecondary7,625
- Richard City Special School District1,173
- Roane County School District51,344
- Robertson County School District75,539
- Rogersville City Schoolselementary4,647
- Rutherford County School District199,454
- Rutherford County School District in Murfreesborosecondary161,192
- Scott County School District19,081
- Sequatchie County School District16,809
- Sevier County School District99,652
- Shelby County School District724,876
- Smith County School District20,389
- South Carroll Special School District2,653
- Stewart County School District14,027
- Sullivan County School District79,887
- Sumner County School District204,424
- Sweetwater City School Districtelementary12,838
- Tipton County School District61,553
- Trenton Special School District8,076
- Trousdale County School District11,957
- Tullahoma City School District21,103
- Unicoi County School District17,756
- Union City School District10,855
- Union County School District20,431
- Van Buren County School District6,437
- Warren County School District42,166
- Washington County School District69,657
- Wayne County School District16,168
- Weakley County School District33,016
- West Carroll Special District6,822
- White County School District28,160
- Williamson County School District219,821
- Williamson County School District in Franklinsecondary40,530
- Wilson County School District116,135
- Wilson County School District in Lebanonsecondary42,670
Congressional districts
As drawn for the 119th Congress (2025–2027).
- Congressional District 1782,000
- Congressional District 2792,639
- Congressional District 3788,609
- Congressional District 4799,279
- Congressional District 5796,623
- Congressional District 6788,325
- Congressional District 7791,449
- Congressional District 8767,898
- Congressional District 9759,561
State senate districts
The upper chamber’s districts, as drawn in 2024.
- State Senate District 1209,135
- State Senate District 2209,075
- State Senate District 3211,169
- State Senate District 4218,588
- State Senate District 5210,629
- State Senate District 6211,420
- State Senate District 7209,832
- State Senate District 8217,024
- State Senate District 9215,373
- State Senate District 10217,039
- State Senate District 11220,244
- State Senate District 12219,806
- State Senate District 13219,143
- State Senate District 14215,232
- State Senate District 15213,126
- State Senate District 16216,590
- State Senate District 17226,475
- State Senate District 18216,381
- State Senate District 19224,272
- State Senate District 20213,215
- State Senate District 21210,231
- State Senate District 22228,447
- State Senate District 23223,707
- State Senate District 24213,777
- State Senate District 25204,582
- State Senate District 26218,558
- State Senate District 27225,730
- State Senate District 28222,073
- State Senate District 29199,233
- State Senate District 30197,150
- State Senate District 31203,907
- State Senate District 32203,548
- State Senate District 33201,672
State house districts
The lower chamber’s districts, as drawn in 2024.
- State House District 167,712
- State House District 266,265
- State House District 368,217
- State House District 466,862
- State House District 571,628
- State House District 669,351
- State House District 766,910
- State House District 868,146
- State House District 968,376
- State House District 1074,372
- State House District 1170,968
- State House District 1267,338
- State House District 1373,492
- State House District 1473,516
- State House District 1573,221
- State House District 1667,607
- State House District 1770,586
- State House District 1869,963
- State House District 1970,179
- State House District 2071,187
- State House District 2169,480
- State House District 2270,620
- State House District 2368,638
- State House District 2471,686
- State House District 2571,726
- State House District 2673,959
- State House District 2774,634
- State House District 2876,230
- State House District 2975,941
- State House District 3075,428
- State House District 3172,270
- State House District 3274,098
- State House District 3368,317
- State House District 3473,741
- State House District 3572,892
- State House District 3673,330
- State House District 3767,360
- State House District 3870,384
- State House District 3973,240
- State House District 4071,024
- State House District 4169,440
- State House District 4274,385
- State House District 4370,326
- State House District 4474,733
- State House District 4568,756
- State House District 4679,940
- State House District 4773,529
- State House District 4874,093
- State House District 4971,960
- State House District 5064,020
- State House District 5175,653
- State House District 5273,020
- State House District 5371,617
- State House District 5473,541
- State House District 5576,060
- State House District 5669,439
- State House District 5776,036
- State House District 5870,500
- State House District 5969,610
- State House District 6071,928
- State House District 6170,137
- State House District 6275,267
- State House District 6375,322
- State House District 6477,853
- State House District 6575,344
- State House District 6675,539
- State House District 6780,266
- State House District 6879,032
- State House District 6967,918
- State House District 7072,476
- State House District 7174,450
- State House District 7268,115
- State House District 7369,082
- State House District 7468,959
- State House District 7574,855
- State House District 7667,978
- State House District 7765,257
- State House District 7868,322
- State House District 7965,664
- State House District 8065,424
- State House District 8166,549
- State House District 8266,724
- State House District 8371,068
- State House District 8468,297
- State House District 8570,992
- State House District 8669,209
- State House District 8772,849
- State House District 8870,224
- State House District 8972,487
- State House District 9067,175
- State House District 9172,146
- State House District 9275,597
- State House District 9369,155
- State House District 9471,938
- State House District 9571,625
- State House District 9669,491
- State House District 9770,699
- State House District 9869,891
- State House District 9973,527
PUMAs
Public Use Microdata Areas: areas of 100,000 people or more that the state draws from census tracts, for the Census Bureau’s microdata.
- Anderson, Roane & Morgan Counties–Oak Ridge city PUMA155,722
- Bedford, Lincoln & Marshall Counties–Shelbyville & Lewisburg cities PUMA124,232
- Blount County–Maryville & Alcoa cities PUMA139,333
- Bradley & Polk Counties–Cleveland city PUMA128,963
- Campbell, Claiborne & Scott Counties PUMA121,623
- Chattanooga city (South & Central) PUMA125,595
- Clarksville city (North) PUMA121,367
- Coffee, Franklin & Moore Counties–Tullahoma & Manchester cities PUMA110,430
- Cumberland, White & Fentress Counties–Crossville city PUMA111,022
- Dickson, Cheatham & Hickman Counties PUMA123,248
- Dyer, Weakely and Obion Counties–Dyersburg, Union City and Martin cities PUMA106,556
- Gibson, Lauderdale & Haywood Counties–Brownsville city PUMA107,072
- Greene & Hawkins Counties–Greenville town PUMA129,592
- Hamblen, Jefferson & Grainger Counties–Morristown city PUMA146,799
- Hamilton County (North)–Soddy-Daisy city PUMA135,132
- Hamilton County (South)–Chattanooga (North) & Red Bank cities PUMA115,465
- Henderson, Hardin & McNairy Counties PUMA118,211
- Hendersonville, Gallatin & Goodlettsville cities PUMA126,001
- Henry, Carol & Humphreys Counties–Paris city PUMA118,653
- Knox County (North, East & South) PUMA121,706
- Knox County (Northwest) PUMA128,171
- Knox County (Southwest) PUMA106,116
- Knoxville city (Central) PUMA138,155
- Lawrence, Giles & Wayne Counties–Lawrenceburg city PUMA113,862
- Loudon & Monroe Counties–Lenoir City PUMA106,275
- Macon, Dekalb & Cannon Counties PUMA106,392
- Madison & Chester Counties–Jackson city PUMA116,906
- Maury County–Columbia & Spring Hill cities PUMA107,791
- McMinn, Rhea & Bledsoe Counties–Athens city PUMA117,251
- Memphis (North) & Bartlett (Southwest) cities PUMA109,113
- Memphis City (Central Midtown) PUMA126,216
- Memphis City (Central Riverside) PUMA122,595
- Memphis City (Southeast) PUMA103,400
- Memphis City (Southwest) PUMA108,806
- Montgomery County–Clarksville city (South) PUMA112,786
- Murfreesboro city PUMA136,882
- Nashville/Davidson County (North) PUMA104,465
- Nashville/Davidson County–Antioch, South Nashville PUMA108,814
- Nashville/Davidson County–Donelson, Hermitage & Old Hickory PUMA98,898
- Nashville/Davidson County–Downtown, East & North Nashville PUMA147,546
- Nashville/Davidson County–South & Southeast Nashville PUMA122,258
- Nashville/Davidson County–West Nashville, Green Hills & Bellevue PUMA133,407
- Putnam & Overton Counties–Cookeville city PUMA118,372
- Robertson & Sumner Counties–Springfield & Portland cities PUMA153,962
- Rutherford County (North, East and South) PUMA112,541
- Rutherford County–Smyrna town & La Vergne city PUMA111,223
- Sevier & Cocke Counties–Sevierville city PUMA136,465
- Shelby County (East)–Memphis city (East) & Arlington town (South) PUMA107,755
- Shelby County (North)–Bartlett (North & East), Millington & Lakeland cities PUMA110,913
- Shelby County (Southeast)–Collierville town & Germantown city PUMA130,192
- Sullivan County–Kingsport & Bristol cities PUMA160,624
- Tipton & Fayette Counties PUMA105,003
- Warren, Marion & Sequatchie Counties–McMinnville city PUMA108,425
- Washington (South) & Carter Counties–Elizabethton city PUMA107,129
- Washington County–Johnson City PUMA121,796
- Williamson County–Brentwood & Franklin cities, Nolensville town (west) PUMA136,455
- Williamson County–Thompson Station town & Fairview city PUMA123,896
- Wilson County–Lebanon & Mount Juliet cities PUMA158,805
Urban areas
Each that reaches into Tennessee, with its whole population. Urban areas are the densely settled land the Census Bureau draws after each census, whatever the city lines.
- Arlington, TN14,767
- Athens, TN16,147
- Atoka, TN13,630
- Bolivar, TN5,753
- Bristol, TN–VA70,694
- Brownsville, TN9,327
- Chattanooga, TN–GA405,365
- Clarksville, TN–KY213,906
- Cleveland, TN73,102
- Columbia, TN45,056
- Cookeville, TN52,124
- Covington, TN7,567
- Crossville, TN19,471
- Dayton, TN9,230
- Dickson, TN16,315
- Dyersburg, TN16,417
- Erwin, TN7,722
- Etowah, TN4,359
- Fairfield Glade, TN8,728
- Fayetteville, TN10,209
- Fulton, KY–TN4,363
- Greeneville, TN22,881
- Harriman–Kingston–Rockwood, TN23,949
- Henderson, TN6,010
- Humboldt, TN6,656
- Jackson, TN72,656
- Johnson City, TN130,327
- Kingsport, TN–VA101,236
- Knoxville, TN614,890
- La Follette, TN21,178
- Lafayette, TN5,990
- Lawrenceburg, TN12,179
- Lebanon, TN41,123
- Lewisburg, TN12,032
- Lexington, TN7,024
- Madisonville, TN6,130
- Manchester, TN13,961
- Martin, TN10,797
- McKenzie, TN5,664
- McMinnville, TN15,282
- Memphis, TN–MS–AR1.05M
- Middlesborough, KY–TN13,750
- Milan, TN7,854
- Millington, TN13,111
- Morristown, TN67,811
- Murfreesboro, TN187,061
- Nashville-Davidson, TN1.18M
- New Tazewell–Tazewell, TN5,939
- Newport, TN10,874
- Oakland, TN10,533
- Paris, TN10,159
- Portland, TN–KY12,572
- Pulaski, TN8,077
- Ripley, TN6,836
- Rogersville, TN6,485
- Savannah, TN9,107
- Sevierville, TN32,843
- Seymour, TN16,795
- Shelbyville, TN23,663
- Smithville, TN5,060
- South Pittsburg–Bridgeport, TN–AL4,623
- Sparta, TN5,509
- Spring Hill, TN66,589
- Springfield, TN19,160
- Sweetwater, TN6,362
- Tellico Village, TN7,321
- Tullahoma, TN20,535
- Union City, TN10,541
- White House, TN16,202
- Winchester, TN13,845
Tribal areas
Each that reaches into Tennessee, with its whole population.
Turn Tennessee into your planning report.
Social Explorer Studio builds an editable profile of any place, with tables and charts beside the county and state, and exports to Word, PDF and Excel.
Questions about Tennessee
What is the population of Tennessee?
7,315,076 people, according to the ACS 2025 1-year estimates, which the Census Bureau adjusts to match its own population estimate. That’s the 15th largest of the 50 states and DC.
What is the FIPS code for Tennessee?
47. Every county’s and place’s FIPS code in Tennessee starts with it. The Census Bureau’s full geographic identifier (GEOID) is 0400000US47.
What is the largest community in Tennessee?
Nashville-Davidson, with 721,085 people. Other large places here include Memphis, Knoxville and Chattanooga.
What is the median household income in Tennessee?
$75,875 (±$816), according to the ACS 2025 1-year estimates, lower than the US ($84,780).
What is the median age in Tennessee?
39.5 years (±0.2), according to the ACS 2025 1-year estimates, about the same as the US (39.5).
How much does housing cost in Tennessee?
Tennessee’s median home value is $341,200 (±$3,027) and its median gross rent is $1,356 (±$17) a month, according to the ACS 2025 1-year estimates. 45.9% (±1.3%) of its renters pay 30% or more of their income on rent.
Is Tennessee growing?
Tennessee’s population grew 10.8%, from 6,600,299 in 2015 to 7,315,076 in 2025, according to the ACS 1-year estimates.
Where do people who work in Tennessee live?
2,951,861 of its 3,187,461 jobs are held by people who live here. Of those who commute in, the most come from Mississippi, Georgia, Kentucky.
Where does this census data come from?
The U.S. Census Bureau’s American Community Survey, through Social Explorer’s tables: the latest 1-year estimates where they exist, for the most recent numbers, and 5-year estimates otherwise. Each table lists its code, so you can find it again.
Is this data free to use?
Yes. You can read it, cite it, download the CSV and embed the charts, with no account. To map other variables, compare your own areas or build a report, see Social Explorer’s plans in a live demo.
Sources and how to cite
American Community Survey 2025 1-year estimates, or 2020–2024 5-year estimates where noted, U.S. Census Bureau, from Social Explorer’s tables A00001, A00002, A01004, A04001, A06001, A08001, A09005, A10001, A10003, A10008, A10030, A10036, A10040, A10047, A10055, A10060, A12001, A13004, A14006, A14024, A14028, A16002, A17005, A18002, A18009, A20001, B02002, B09001, B13002, B18101, C16001. Maps by census tract use 2020–2024 5-year estimates, since the 1-year survey doesn’t cover tracts. Commuting: LEHD LODES 2023. These are estimates from a sample, each with its margin of error. Data retrieved November 14, 2026. How these profiles are made.
U.S. Census Bureau, American Community Survey 2025 1-year estimates, or 2020–2024 5-year estimates where noted, via Social Explorer. “Tennessee.” https://www.socialexplorer.com/places/tennessee. Accessed November 14, 2026.