

Massachusetts: Population, demographics and census data
Home to 7,154,084 people, the 16th largest of the 50 states and DC, anchored by Boston. It grew 5.3% between 2015 and 2025.
- Population
- 7.15M. Census Bureau estimate · Rank 16 of the 50 states and DC
- Median household income
- $106,539 ±$1,459. US $84,780
- Median age
- 40.4 ±0.2. US 39.5
ACS 2025 1-year estimates, U.S. Census Bureau
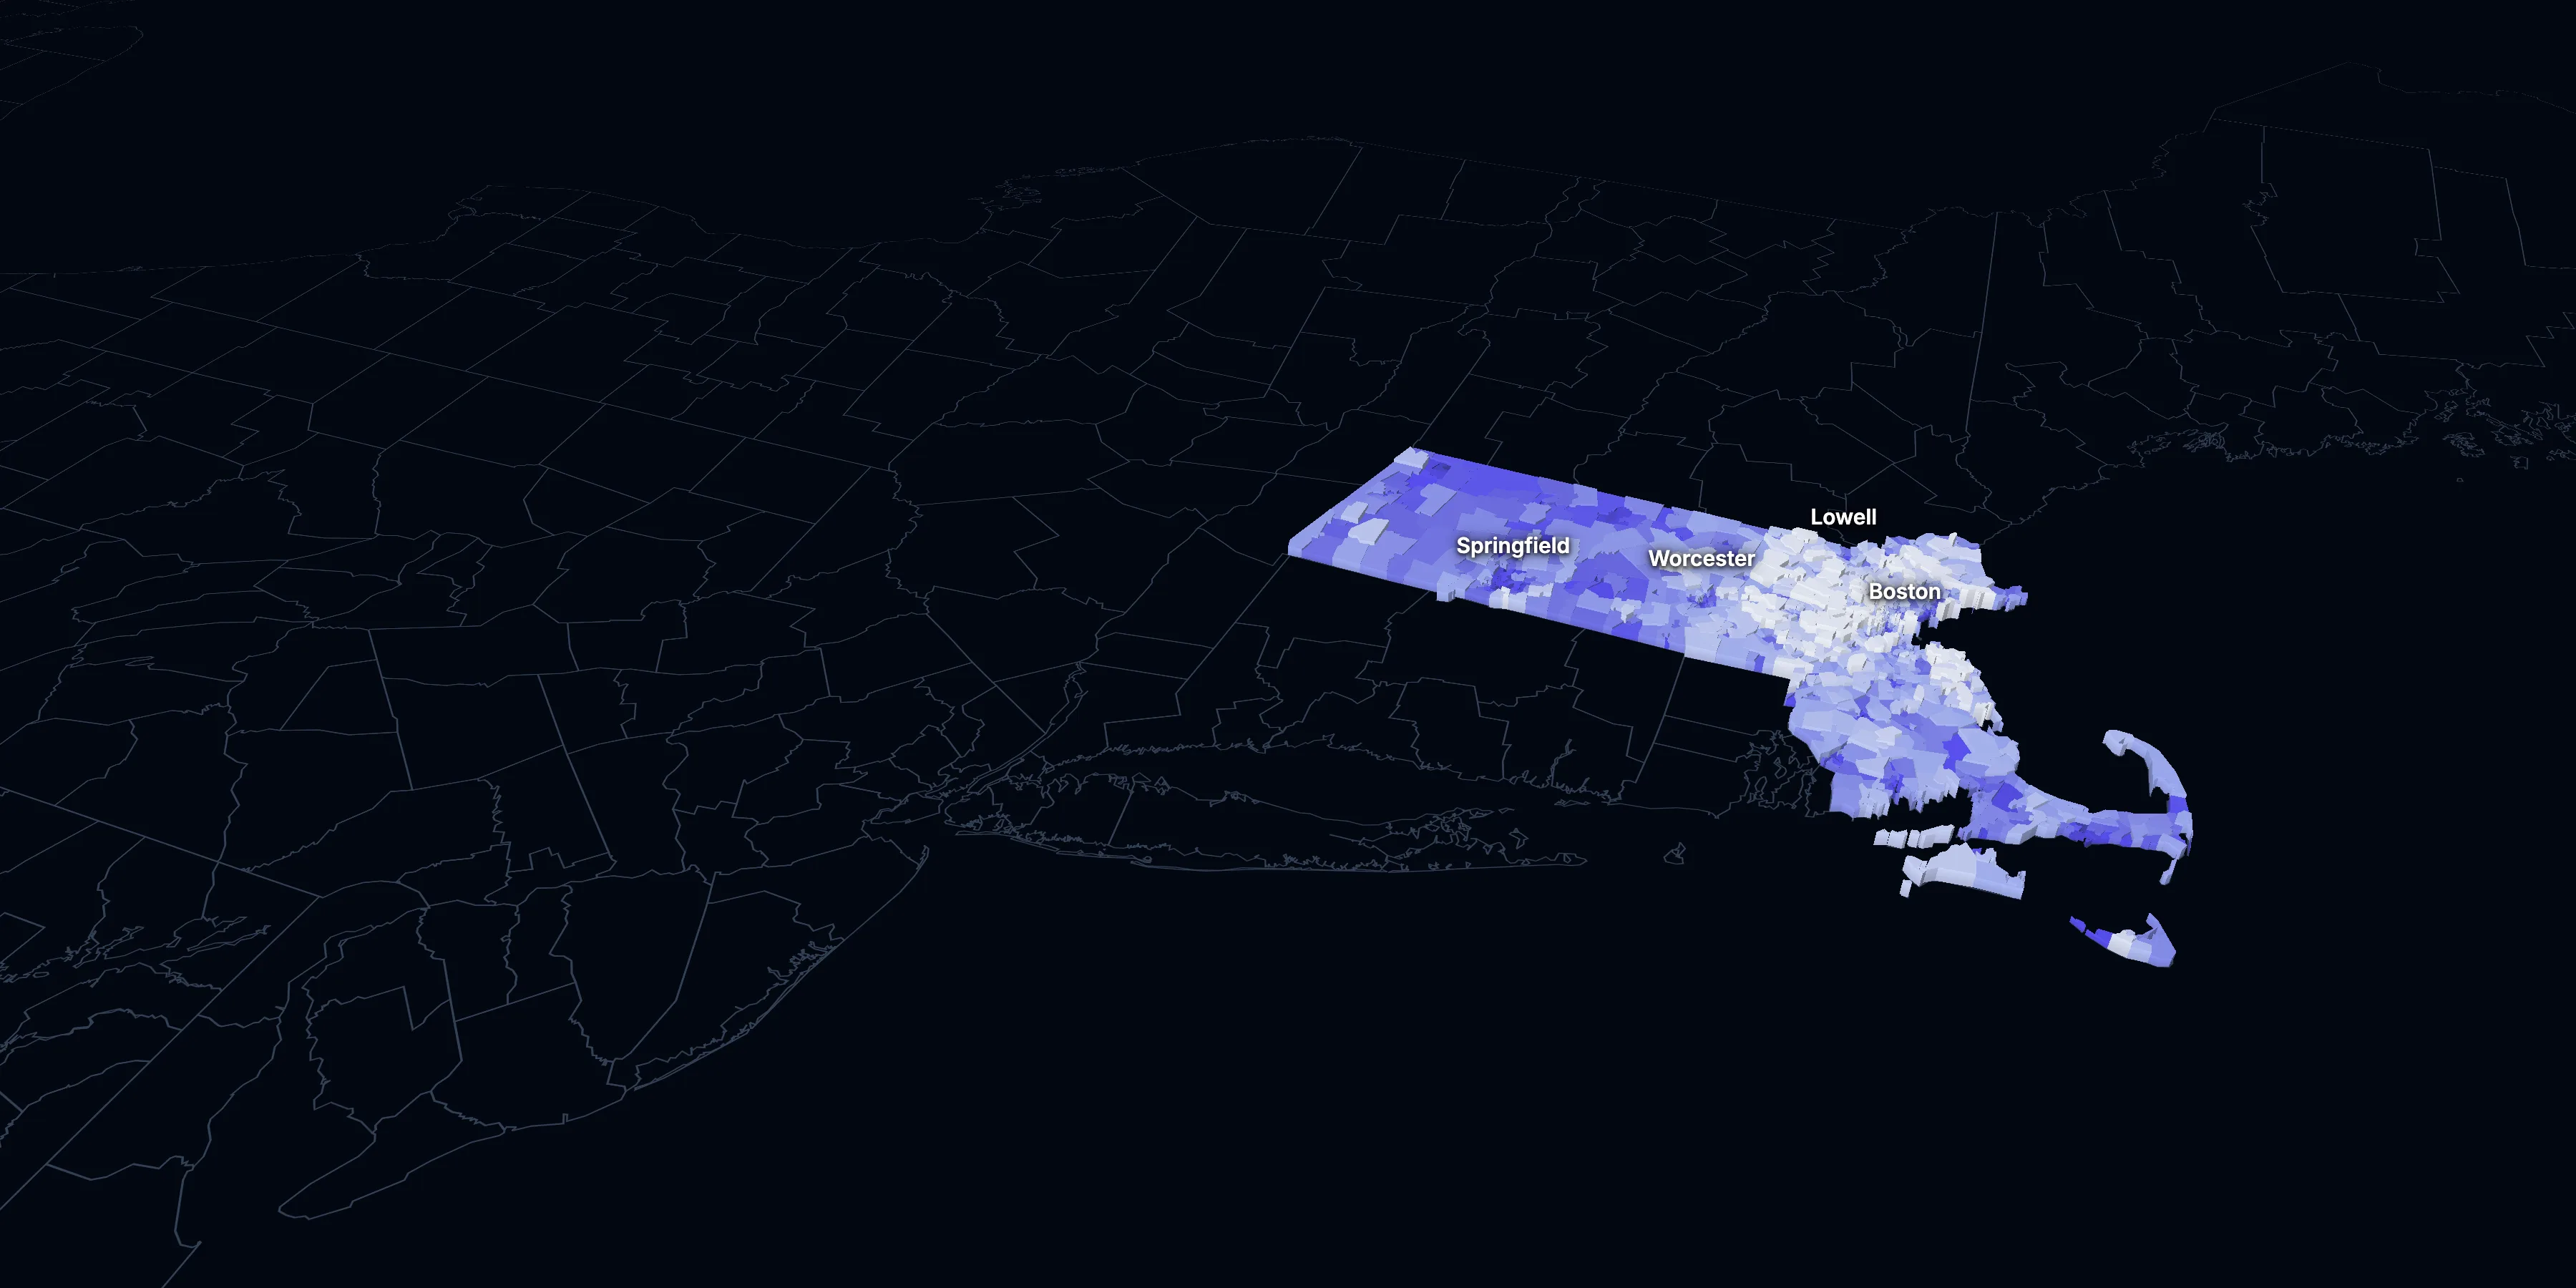
Taller, lighter tracts have higher household incomes
About Massachusetts
Massachusetts’s median household income is $106,539 (±$1,459), higher than the US ($84,780), and its median age is 40.4 (±0.2), according to the ACS 2025 1-year estimates. Its largest city is Boston.
± is each figure’s margin of error, at 90% confidence, and † marks one too uncertain to lean on. Under each percentage in the tables is the number it counts. How the margins are worked out.
FIPS code 25
Highlights
What stands out in Massachusetts
The numbers where Massachusetts sits furthest from the nation, or past a recognized policy benchmark.
Past a policy benchmark
49.9%
Very highRenters paying 30% or more of income
That’s higher than the US (48.3%). HUD counts households paying 30% or more of income on housing as cost-burdened.
28.3%
Very highOwners paying 30% or more of income
That’s higher than the US (24.2%). HUD’s 30% standard, applied to homeowners.
44.6%
Very highHomes built before 1960
That’s higher than the US (24.0%). Older homes carry more lead-paint risk: the EPA found lead paint in 69% of homes built from 1940 to 1959. It’s the 4th highest of the 50 states and DC.
+13 points
HighRent growth ahead of income
After inflation, rent grew 23% from 2015 to 2025, and household income 10%. The dots show rent growth.
Furthest from the national picture
2.7%
Lowest among statesNo health insurance
That’s lower than the US (8.4%). It’s the lowest of the 50 states and DC.
49.2%
2nd among statesBachelor’s degree or more
That’s higher than the US (37.4%). It’s the 2nd highest of the 50 states and DC.
2015 to 2025
How Massachusetts changed in ten years
The state added 359,662 people. It got older, more foreign-born and better educated, and poverty fell 1.6 points.
Population, change since 2015
+5.3% in the state and +6.3% in the US.
Source: ACS 1-year, 2015 to 2025, table A00001.
Show data
| Massachusetts | United States | |
|---|---|---|
| 2015 | 0.0% | 0.0% |
| 2016 | +0.3% | +0.5% |
| 2017 | +1.0% | +1.3% |
| 2018 | +1.6% | +1.8% |
| 2019 | +1.4% | +2.1% |
| 2021 | +2.8% | +3.3% |
| 2022 | +2.8% | +3.7% |
| 2023 | +3.0% | +4.2% |
| 2024 | +5.0% | +5.8% |
| 2025 | +5.3% | +6.3% |
Embed
Median household income, in 2025 dollars
+10.1% in the state and +10.9% in the US.
Source: ACS 1-year, 2015 to 2025, table A14006.
Show data
| Massachusetts | United States | |
|---|---|---|
| 2015 | $96,762 | $76,413 |
| 2016 | $101,845 | $77,931 |
| 2017 | $102,465 | $79,891 |
| 2018 | $103,194 | $80,059 |
| 2019 | $108,985 | $83,427 |
| 2021 | $107,394 | $83,521 |
| 2022 | $104,670 | $82,811 |
| 2023 | $106,237 | $82,683 |
| 2024 | $108,341 | $84,339 |
| 2025 | $106,539 | $84,780 |
Embed
Living in poverty
−1.6 points in the state and −3.0 points in the US.
Source: ACS 1-year, 2015 to 2025, table A13004.
Show data
| Massachusetts | United States | |
|---|---|---|
| 2015 | 11.5% | 14.7% |
| 2016 | 10.4% | 14.0% |
| 2017 | 10.5% | 13.4% |
| 2018 | 10.0% | 13.1% |
| 2019 | 9.4% | 12.3% |
| 2021 | 10.4% | 12.8% |
| 2022 | 10.4% | 12.6% |
| 2023 | 10.4% | 12.5% |
| 2024 | 9.7% | 12.1% |
| 2025 | 9.8% | 11.8% |
Embed
Bachelor’s degree or more
+7.8 points in the state and +6.7 points in the US.
Source: ACS 1-year, 2015 to 2025, table A12001.
Show data
| Massachusetts | United States | |
|---|---|---|
| 2015 | 41.5% | 30.6% |
| 2016 | 42.7% | 31.3% |
| 2017 | 43.4% | 32.0% |
| 2018 | 44.5% | 32.6% |
| 2019 | 45.0% | 33.1% |
| 2021 | 46.6% | 35.0% |
| 2022 | 46.6% | 35.7% |
| 2023 | 47.8% | 36.2% |
| 2024 | 48.3% | 36.8% |
| 2025 | 49.2% | 37.4% |
Embed
Median gross rent, in 2025 dollars
+23.0% in the state and +18.5% in the US.
Source: ACS 1-year, 2015 to 2025, table A18009.
Show data
| Massachusetts | United States | |
|---|---|---|
| 2015 | $1,595 | $1,314 |
| 2016 | $1,595 | $1,327 |
| 2017 | $1,600 | $1,340 |
| 2018 | $1,674 | $1,368 |
| 2019 | $1,727 | $1,393 |
| 2021 | $1,781 | $1,427 |
| 2022 | $1,810 | $1,440 |
| 2023 | $1,869 | $1,496 |
| 2024 | $1,910 | $1,537 |
| 2025 | $1,962 | $1,557 |
Embed
Median home value, in 2025 dollars
+30.0% in the state and +39.3% in the US.
Source: ACS 1-year, 2015 to 2025, table A10036.
Show data
| Massachusetts | United States | |
|---|---|---|
| 2015 | $482,384 | $266,469 |
| 2016 | $496,260 | $277,278 |
| 2017 | $510,308 | $288,124 |
| 2018 | $517,941 | $296,908 |
| 2019 | $531,450 | $305,336 |
| 2021 | $575,756 | $337,116 |
| 2022 | $592,321 | $355,481 |
| 2023 | $607,261 | $361,931 |
| 2024 | $627,756 | $372,685 |
| 2025 | $626,900 | $371,100 |
Embed
ACS 1-year estimates. The dotted stretch of each line spans 2020, when the Census Bureau released no standard 1-year estimates. Dollar values are in 2025 dollars.
| Indicator | 2015 | 2025 | Change |
|---|---|---|---|
| Population | 6,794,422 | 7,154,084 | +5.3% |
| Median age | 39.4 | 40.4 | +1.0 years |
| 65 and over | 15.4% | 19.9% | +4.5 points |
| Born outside the US | 16.1% | 19.1% | +3.0 points |
| Hispanic or Latino | 11.2% | 14.3% | +3.2 points |
| Median household income | $96,762 | $106,539 | +10.1% |
| Living in poverty | 11.5% | 9.8% | −1.6 points |
| Bachelor’s degree or more | 41.5% | 49.2% | +7.8 points |
| Households that rent | 38.3% | 37.2% | −1.0 points |
| Median gross rent | $1,595 | $1,962 | +23.0% |
| Median home value | $482,384 | $626,900 | +30.0% |
1620 census tracts
Massachusetts, tract by tract
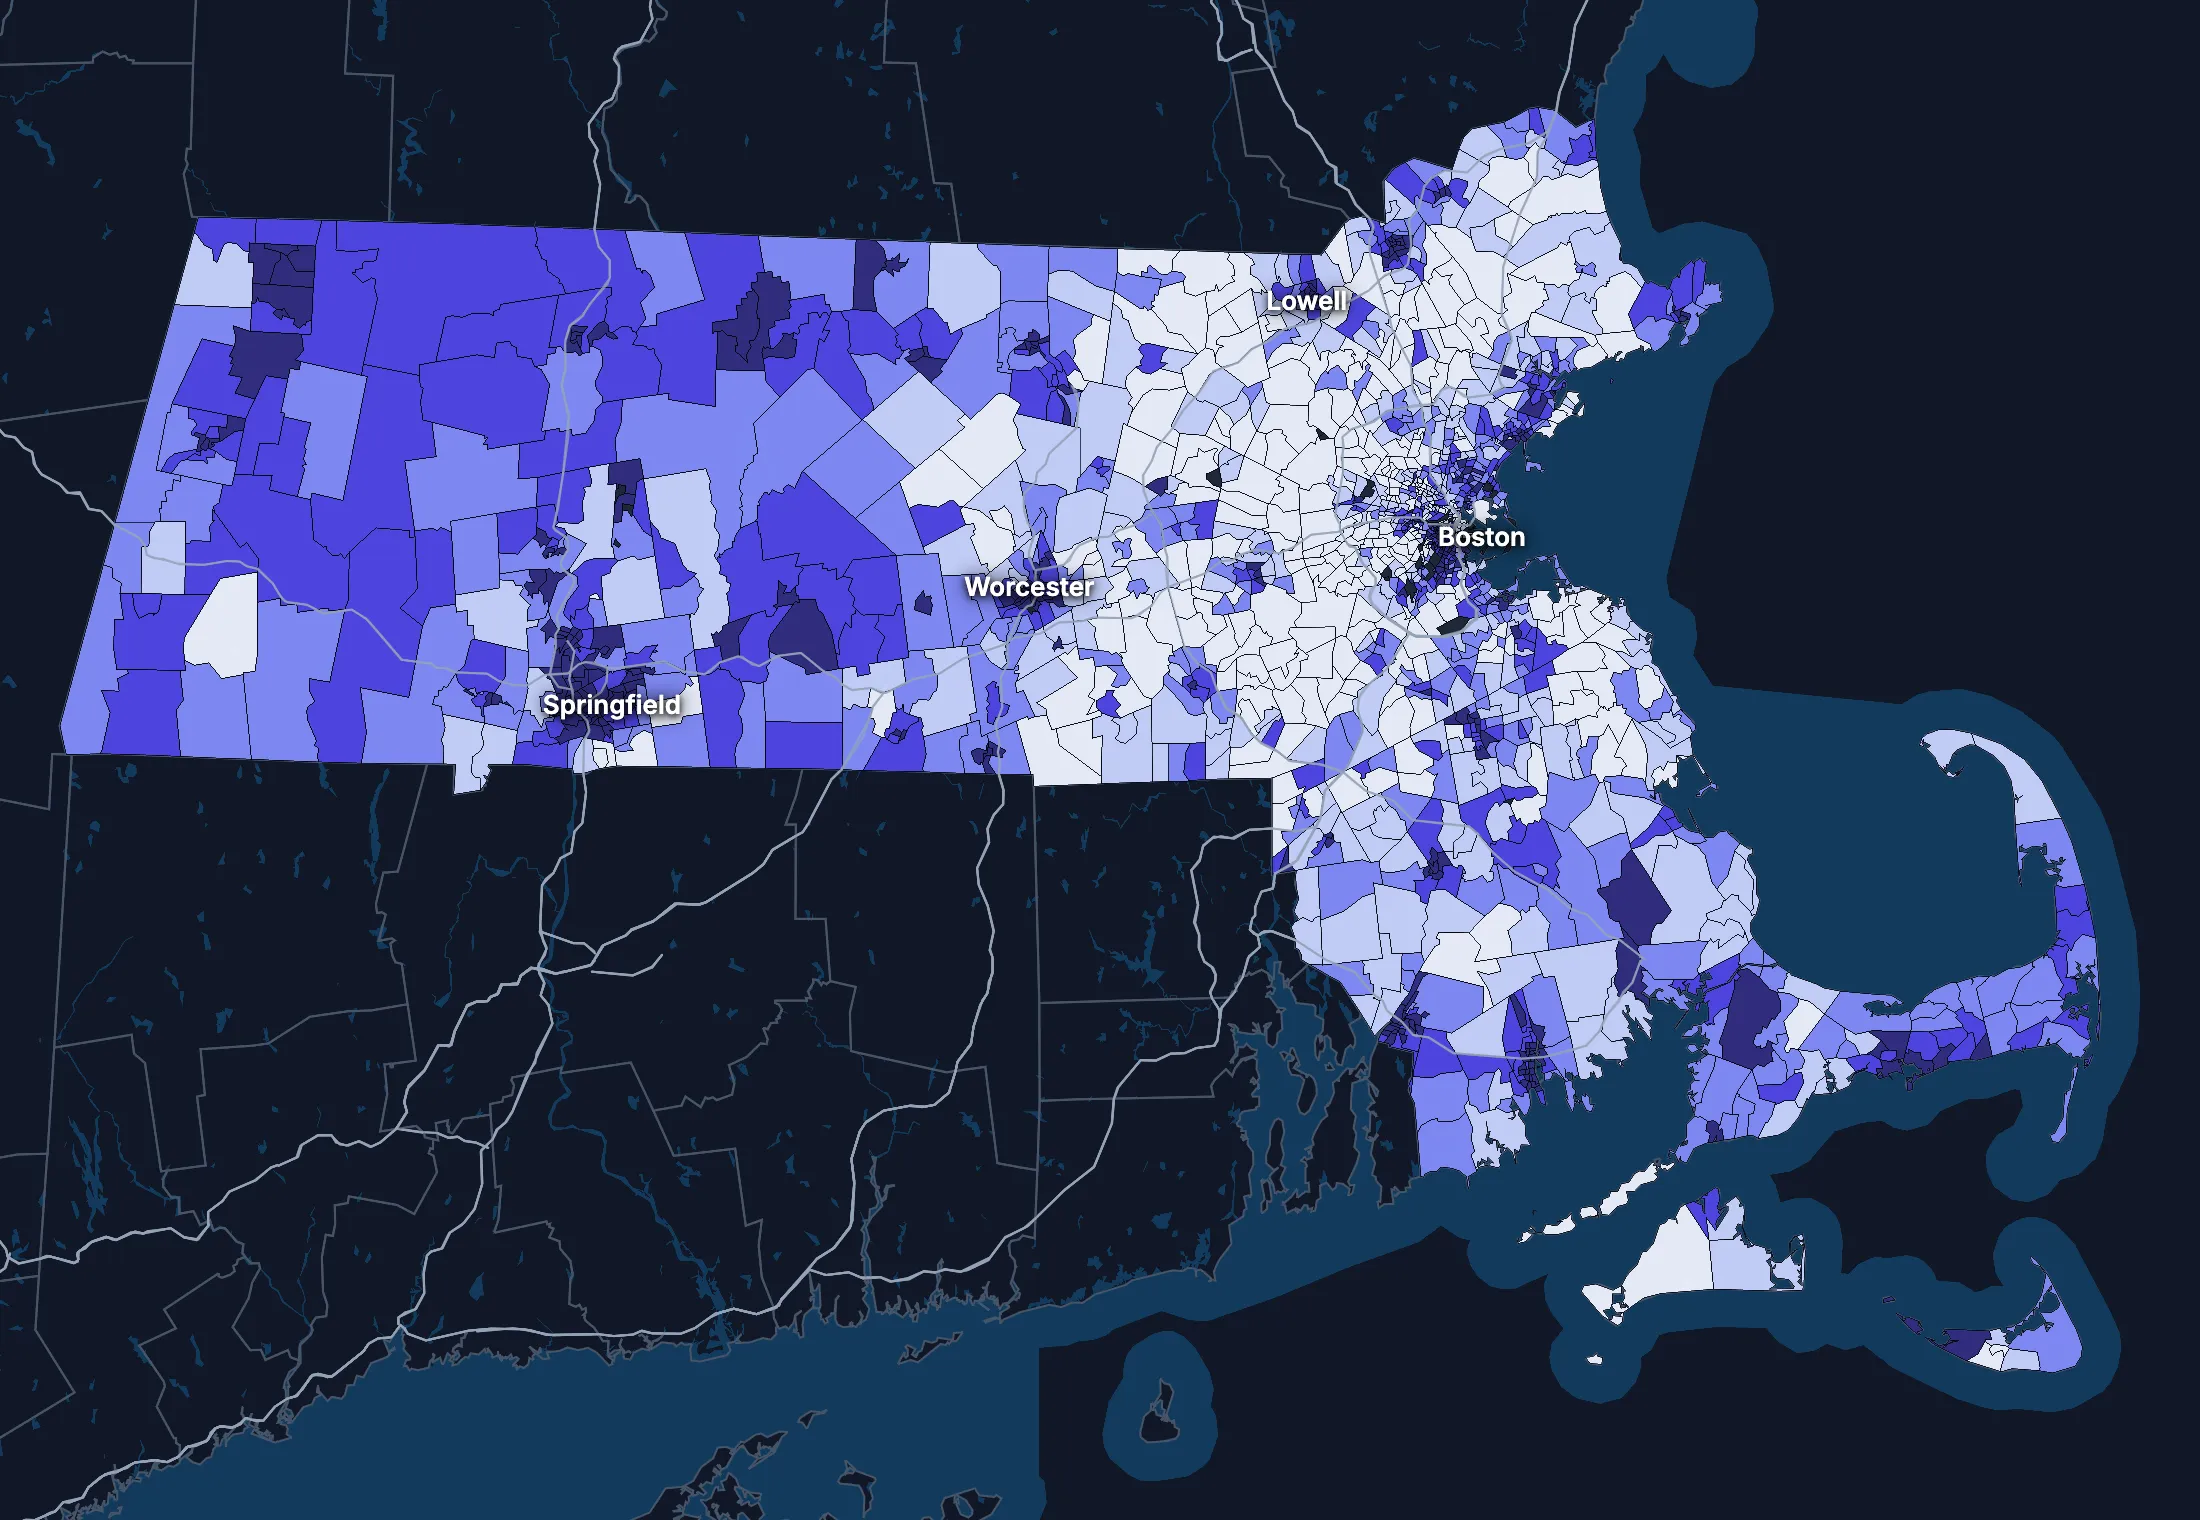
State averages hide a lot. These census tracts are the closest the census comes to neighborhoods.
Where the state’s average misleads
Each tick is one census tract, and the dark line marks the state. Hover over a tick or tap it to see the tract.
Poverty
367 of 1589 tracts are at least 1.5 times the state’s overall 10.0%, and 493 are at two-thirds of it or less.
Highest: Tract 8115, 74.4%. Lowest: Tract 9813, 0.0%.
Renters paying 30% or more of income
58 of 1542 tracts are at least 1.5 times the state’s overall 48.9%, and 262 are at two-thirds of it or less.
Highest: Tract 5221.01, 100.0%. Lowest: Tract 6161, 0.0%.
Adults with a bachelor’s degree
286 of 1590 tracts are at least 1.5 times the state’s overall 47.3%, and 437 are at two-thirds of it or less.
Highest: Tract 3531.02, 98.0%. Lowest: Tract 9811, 0.0%.
Median household income
249 of 1585 tracts are at least 1.5 times the typical tract’s $106,250, and 312 are at two-thirds of it or less.
Highest: Tract 2543.01, $250,000 or more. Lowest: Tract 8011.01, $16,276.
American Community Survey 2020–2024 5-year estimates, by census tract. Income is capped at $250,000+ by the Census Bureau.
People
Who lives in Massachusetts
Its median age of 40.4 is higher than the US (39.5). 19.1% of residents were born outside the US, and 26.3% speak a language other than English at home.
Age
Source: ACS 2025 1-year, table A01001.
Show data
| Massachusetts | United States | |
|---|---|---|
| Under 18 | 18.5% ±0.2% , number 1,324,554 ±14,030 | 21.0% ±<0.1% , number 71,689,151 ±111,800 |
| 18 to 24 | 9.9% ±0.2% , number 707,589 ±14,150 | 9.3% ±<0.1% , number 31,716,680 ±98,660 |
| 25 to 34 | 14.0% ±0.1% , number 1,002,976 ±5,067 | 13.6% ±<0.1% , number 46,357,354 ±55,690 |
| 35 to 44 | 13.3% ±0.2% , number 954,075 ±15,760 | 13.4% ±<0.1% , number 45,746,189 ±105,700 |
| 45 to 54 | 11.5% ±0.1% , number 825,253 ±5,490 | 11.8% ±<0.1% , number 40,257,563 ±53,540 |
| 55 to 64 | 12.8% ±0.2% , number 917,321 ±15,990 | 12.1% ±<0.1% , number 41,242,904 ±104,700 |
| 65 to 74 | 11.2% ±0.2% , number 797,699 ±13,770 | 10.8% ±<0.1% , number 36,895,650 ±91,520 |
| 75 and over | 8.7% ±0.2% , number 624,617 ±12,120 | 8.2% ±<0.1% , number 27,879,368 ±78,140 |
Embed
Race and ethnicity
Source: ACS 2025 1-year, table A04001.
Show data
| Massachusetts | United States | |
|---|---|---|
| White, not Hispanic | 63.7% ±0.2% , number 4,553,595 ±16,510 | 55.0% ±<0.1% , number 187,959,031 ±58,340 |
| Hispanic or Latino | 14.3% ±<0.1% , number 1,026,326 ±1,884 | 20.5% ±<0.1% , number 69,975,516 ±13,270 |
| Black, not Hispanic | 6.7% ±0.2% , number 480,477 ±13,260 | 11.7% ±<0.1% , number 40,096,453 ±106,200 |
| Asian, not Hispanic | 8.0% ±0.1% , number 574,143 ±6,847 | 6.5% ±<0.1% , number 22,096,709 ±58,340 |
| Other or multiracial | 7.3% ±0.3% , number 519,543 ±23,930 | 6.3% ±<0.1% , number 21,657,150 ±150,100 |
Embed
Language spoken at home
Source: ACS 2025 1-year, table C16001.
Show data
| Massachusetts | United States | |
|---|---|---|
| English only | 73.7% ±0.4% , number 5,018,315 ±30,440 | 77.1% ±0.1% , number 249,390,588 ±275,300 |
| Spanish | 10.3% ±0.2% , number 698,574 ±13,310 | 13.9% ±0.1% , number 44,921,985 ±177,800 |
| Other Indo-European | 9.2% ±0.4% , number 624,325 ±25,730 | 4.0% ±<0.1% , number 12,862,980 ±113,500 |
| Asian and Pacific Island | 4.8% ±0.2% , number 329,822 ±16,860 | 3.8% ±<0.1% , number 12,288,841 ±99,740 |
| Arabic and other | 2.0% ±0.2% , number 138,671 ±15,010 | 1.3% ±<0.1% , number 4,116,949 ±71,480 |
Embed
Marital status
Source: ACS 2025 1-year, table A11001.
Show data
| Massachusetts | United States | |
|---|---|---|
| Now married | 45.8% ±0.4% , number 2,781,170 ±25,420 | 47.9% ±0.1% , number 135,567,564 ±223,300 |
| Never married | 38.5% ±0.4% , number 2,339,847 ±21,570 | 34.8% ±0.1% , number 98,647,238 ±152,600 |
| Divorced | 9.0% ±0.3% , number 543,862 ±15,930 | 10.2% ±<0.1% , number 28,879,967 ±112,900 |
| Widowed | 5.3% ±0.2% , number 320,389 ±9,719 | 5.5% ±<0.1% , number 15,599,094 ±69,430 |
| Separated | 1.4% ±0.1% , number 87,592 ±5,876 | 1.6% ±<0.1% , number 4,441,399 ±49,160 |
Embed
Where people lived a year ago
Source: ACS 2025 1-year, table A08001.
Show data
| Massachusetts | United States | |
|---|---|---|
| Same home | 88.9% ±0.3% , number 6,297,285 ±24,100 | 88.4% ±0.1% , number 298,889,697 ±214,800 |
| Same county | 5.5% ±0.3% , number 388,625 ±19,720 | 6.0% ±<0.1% , number 20,202,671 ±166,300 |
| Another county in the state | 2.7% ±0.2% , number 194,515 ±11,250 | 3.0% ±<0.1% , number 10,168,097 ±89,190 |
| Another state | 1.9% ±0.1% , number 137,756 ±9,089 | 2.1% ±<0.1% , number 7,025,589 ±81,660 |
| Another country | 0.9% ±0.1% , number 67,262 ±7,600 | 0.6% ±<0.1% , number 1,984,943 ±47,210 |
Embed
Top countries of birth, among those born abroad
Source: ACS 2025 1-year, table A07001.
Show data
| Massachusetts | |
|---|---|
| Dominican Republic | 9.1% , number 124,264 |
| Brazil | 8.1% , number 111,372 |
| China, Excluding Hong Kong and Taiwan | 7.7% , number 105,640 |
| India | 6.8% , number 92,487 |
| Haiti | 4.6% , number 63,328 |
| Guatemala | 3.4% , number 46,977 |
Embed
All the numbers
| Indicator | Massachusetts | US | Rank among states* | Table |
|---|---|---|---|---|
| Population | 7,154,084 | 341,784,859 | 16th | A00001 |
| People per square mile | 917 | 97 | 4th | A00002 |
| Land area (square miles) | 7,801 | – | – | A00002 |
| Median age | 40.4 ±0.2 | 39.5 ±0.1 | 17th | A01004 |
| Under 18 | 18.5% ±0.2% , number 1,324,554 ±14,030 | 21.0% ±<0.1% , number 71,689,151 ±111,800 | 46th | B02002 |
| 65 and over | 19.9% ±0.3% , number 1,422,316 ±18,340 | 19.0% ±<0.1% , number 64,775,018 ±120,300 | 24th | B02002 |
| Born outside the US | 19.1% ±0.4% , number 1,368,806 ±29,530 | 14.7% ±0.1% , number 50,409,320 ±204,800 | 6th | A06001 |
| Speak a language other than English at home | 26.3% ±0.4% , number 1,791,392 ±36,720 | 22.9% ±0.1% , number 74,190,755 ±244,000 | 9th | C16001 |
| Veterans (adults) | 3.8% ±0.2% , number 222,521 ±9,510 | 5.9% ±<0.1% , number 15,746,228 ±85,320 | 47th | A16002 |
| Living with a disability | 12.5% ±0.3% , number 887,572 ±18,660 | 13.7% ±<0.1% , number 46,271,455 ±126,000 | 38th | B18101 |
| Women 15–50 who had a baby in the past year | 4.7% ±0.4% , number 80,636 ±6,422 | 5.0% ±0.1% , number 4,016,759 ±44,040 | 49th | B13002 |
| Lived in the same home a year ago | 88.9% ±0.3% , number 6,297,285 ±24,100 | 88.4% ±0.1% , number 298,889,697 ±214,800 | 16th | A08001 |
| White, not Hispanic | 63.7% ±0.2% , number 4,553,595 ±16,510 | 55.0% ±<0.1% , number 187,959,031 ±58,340 | 26th | A04001 |
| Hispanic or Latino | 14.3% ±<0.1% , number 1,026,326 ±1,884 | 20.5% ±<0.1% , number 69,975,516 ±13,270 | 18th | A04001 |
| Black, not Hispanic | 6.7% ±0.2% , number 480,477 ±13,260 | 11.7% ±<0.1% , number 40,096,453 ±106,200 | 28th | A04001 |
| Asian, not Hispanic | 8.0% ±0.1% , number 574,143 ±6,847 | 6.5% ±<0.1% , number 22,096,709 ±58,340 | 7th | A04001 |
*1 is the highest. Population is ranked among all states, and the rest among those of 1,000 people or more, whose figures can be ranked. Ranks use 5-year estimates, the only ones covering every state, so they can differ slightly from the figures here.
Income and work
Higher incomes than the US
The median household income is $106,539, higher than the US ($84,780). 9.8% of people live in poverty, and 2.7% have no health insurance, lower than the US (8.4%).
Household income
Source: ACS 2025 1-year, table A14001.
Show data
| Massachusetts | United States | |
|---|---|---|
| Under $25,000 | 12.8% ±0.5% , number 362,723 ±13,170 | 14.0% ±0.1% , number 18,727,548 ±88,990 |
| $25,000 to $49,999 | 11.1% ±0.4% , number 313,048 ±12,380 | 15.4% ±0.1% , number 20,665,585 ±101,400 |
| $50,000 to $74,999 | 11.9% ±0.4% , number 337,280 ±12,250 | 15.3% ±0.1% , number 20,513,565 ±88,500 |
| $75,000 to $99,999 | 11.0% ±0.5% , number 311,046 ±13,260 | 12.5% ±0.1% , number 16,814,245 ±87,520 |
| $100,000 to $149,999 | 17.6% ±0.5% , number 496,802 ±15,630 | 17.9% ±0.1% , number 24,018,984 ±99,670 |
| $150,000 to $199,999 | 11.8% ±0.4% , number 333,389 ±11,500 | 10.1% ±0.1% , number 13,521,827 ±70,660 |
| $200,000 or more | 23.8% ±0.4% , number 673,506 ±12,350 | 14.8% ±0.1% , number 19,801,668 ±84,120 |
Embed
What residents do for work
Source: ACS 2025 1-year, table A17004.
Show data
| Massachusetts | United States | |
|---|---|---|
| Education and health care | 29.2% ±0.5% , number 1,099,069 ±21,130 | 24.4% ±0.1% , number 40,862,193 ±140,800 |
| Professional and business services | 15.9% ±0.5% , number 599,346 ±17,520 | 12.8% ±0.1% , number 21,375,231 ±87,110 |
| Retail trade | 9.2% ±0.3% , number 346,937 ±13,250 | 10.6% ±0.1% , number 17,781,181 ±96,660 |
| Manufacturing | 8.6% ±0.3% , number 324,239 ±9,742 | 9.6% ±0.1% , number 16,064,394 ±91,270 |
| Arts, food and lodging | 7.7% ±0.3% , number 288,761 ±11,320 | 8.9% ±0.1% , number 14,811,502 ±87,840 |
| Finance, insurance and real estate | 7.1% ±0.3% , number 266,194 ±10,570 | 6.6% ±<0.1% , number 11,025,569 ±68,570 |
| Construction | 6.0% ±0.3% , number 225,391 ±10,770 | 6.7% ±<0.1% , number 11,254,981 ±79,620 |
| Other services | 4.5% ±0.2% , number 171,236 ±8,687 | 4.8% ±<0.1% , number 7,958,726 ±65,120 |
Embed
Where workers come from and go
Massachusetts has 3,637,277 jobs and 3,516,060 employed residents. 307,295 people commute in to work and 186,078 commute out, while 3,329,982 both live and work here. The most commuters come from New Hampshire.
Most commuters come from
- New Hampshire: 99,667
- Rhode Island: 88,498
- Connecticut: 45,419
Most residents commute to
- Rhode Island: 47,238
- New Hampshire: 45,903
- Connecticut: 34,682
Show data
| Massachusetts | |
|---|---|
| Live and work here | 3,329,982 |
| Work here, live elsewhere | 307,295 |
| Live here, work elsewhere | 186,078 |
Embed
All the numbers
| Indicator | Massachusetts | US | Rank among states* | Table |
|---|---|---|---|---|
| Median household income | $106,539 ±$1,459 | $84,780 ±$215 | 2nd | A14006 |
| Income per person | $59,933 ±$687 | $47,171 ±$115 | 2nd | A14024 |
| Income inequality (Gini index) | 0.486 ±0.004 | 0.482 ±0.001 | 6th | A14028 |
| Living in poverty | 9.8% ±0.4% , number 679,870 ±27,340 | 11.8% ±0.1% , number 39,264,183 ±277,400 | 42nd | A13004 |
| Unemployment rate | 4.9% ±0.2% , number 196,143 ±8,683 | 4.9% ±<0.1% , number 8,574,594 ±64,350 | 18th | A17005 |
| No health insurance | 2.7% ±0.2% , number 194,754 ±12,600 | 8.4% ±<0.1% , number 28,323,306 ±152,000 | 51st | A20001 |
*1 is the highest. Population is ranked among all states, and the rest among those of 1,000 people or more, whose figures can be ranked. Ranks use 5-year estimates, the only ones covering every state, so they can differ slightly from the figures here.
Education
More college degrees than the US
49.2% of adults 25 and over have a bachelor’s degree or more, higher than the US (37.4%).
Highest level of education
Source: ACS 2025 1-year, table A12001.
Show data
| Massachusetts | United States | |
|---|---|---|
| Less than high school | 7.8% ±0.3% , number 397,582 ±15,300 | 9.4% ±0.1% , number 22,321,002 ±120,500 |
| High school only | 22.1% ±0.4% , number 1,134,485 ±22,990 | 25.6% ±0.1% , number 61,096,726 ±203,400 |
| Some college | 20.9% ±0.4% , number 1,068,239 ±19,670 | 27.7% ±0.1% , number 65,920,977 ±173,500 |
| Bachelor’s degree | 26.0% ±0.5% , number 1,331,569 ±23,620 | 22.3% ±0.1% , number 53,224,312 ±196,700 |
| Graduate degree | 23.2% ±0.4% , number 1,190,066 ±20,030 | 15.0% ±0.1% , number 35,816,011 ±159,400 |
Embed
All the numbers
| Indicator | Massachusetts | US | Rank among states* | Table |
|---|---|---|---|---|
| Bachelor’s degree or more | 49.2% ±0.6% , number 2,521,635 ±30,970 | 37.4% ±0.1% , number 89,040,323 ±253,200 | 2nd | A12001 |
| High school graduate or more | 92.2% ±0.8% , number 4,724,359 ±43,300 | 90.6% ±0.2% , number 216,058,026 ±368,200 | 28th | A12001 |
*1 is the highest. Population is ranked among all states, and the rest among those of 1,000 people or more, whose figures can be ranked. Ranks use 5-year estimates, the only ones covering every state, so they can differ slightly from the figures here.
Housing
Home values outran incomes
37.2% of households rent, higher than the US (34.7%). The median home is worth $626,900 and the median rent is $1,962. After inflation, home values rose 30% from 2015 to 2025, while household income rose 10%.
Housing costs and income, 2015 to 2025, after inflation
Source: ACS 1-year, table A10036, A18009, A14006.
Show data
| Massachusetts | United States | |
|---|---|---|
| Median home value | +30.0% | +39.3% |
| Median rent | +23.0% | +18.5% |
| Median household income | +10.1% | +10.9% |
Embed
Types of homes
Source: ACS 2025 1-year, table A10032.
Show data
| Massachusetts | United States | |
|---|---|---|
| Single-family, detached | 50.2% ±0.5% , number 1,543,719 ±15,810 | 60.9% ±0.1% , number 90,335,844 ±173,300 |
| Single-family, attached | 6.5% ±0.3% , number 200,520 ±9,397 | 6.4% ±<0.1% , number 9,527,703 ±51,230 |
| 2 to 4 units | 19.3% ±0.5% , number 593,750 ±15,280 | 7.5% ±0.1% , number 11,109,005 ±75,790 |
| 5 to 19 units | 9.5% ±0.4% , number 292,963 ±11,830 | 8.7% ±0.1% , number 12,829,882 ±97,590 |
| 20 or more units | 13.4% ±0.4% , number 412,889 ±12,740 | 11.1% ±0.1% , number 16,381,450 ±92,310 |
| Mobile homes and other | 0.9% ±0.1% , number 28,344 ±3,095 | 5.4% ±<0.1% , number 8,045,083 ±53,680 |
Embed
When homes were built
Source: ACS 2025 1-year, table A10055.
Show data
| Massachusetts | United States | |
|---|---|---|
| 2010 or later | 9.6% ±0.3% , number 271,893 ±9,839 | 15.1% ±0.1% , number 20,257,912 ±101,300 |
| 2000 to 2009 | 6.8% ±0.3% , number 193,326 ±7,867 | 13.8% ±0.1% , number 18,535,840 ±92,260 |
| 1980 to 1999 | 18.5% ±0.5% , number 522,058 ±15,600 | 24.1% ±0.1% , number 32,332,570 ±118,900 |
| 1960 to 1979 | 20.5% ±0.5% , number 579,327 ±14,380 | 22.9% ±0.1% , number 30,726,302 ±110,000 |
| Before 1960 | 44.6% ±0.7% , number 1,261,190 ±21,650 | 24.0% ±0.1% , number 32,210,798 ±121,500 |
Embed
All the numbers
| Indicator | Massachusetts | US | Rank among states* | Table |
|---|---|---|---|---|
| Housing units | 3,072,185 | – | – | A10001 |
| Households | 2,827,794 ±12,940 | – | – | A10008 |
| People per household | 2.43 ±0.01 | 2.49 ±0.01 | 27th | A10003 |
| Households that rent | 37.2% ±0.5% , number 1,053,310 ±16,030 | 34.7% ±0.1% , number 46,551,688 ±193,200 | 5th | A10060 |
| Vacant homes | 8.0% ±0.4% , number 244,391 ±12,970 | 9.6% ±0.1% , number 14,165,545 ±137,100 | 42nd | A10047, A10060 |
| Median gross rent | $1,962 ±$25 | $1,557 ±$4 | 4th | A18009 |
| Median home value | $626,900 ±$4,178 | $371,100 ±$646 | 5th | A10036 |
| Renters paying 30% or more of income | 49.9% ±1.3% , number 525,245 ±16,060 | 48.3% ±0.2% , number 22,486,693 ±122,100 | 10th | A18002 |
| Owners paying 30% or more of income | 28.3% ±0.8% , number 501,998 ±14,490 | 24.2% ±0.1% , number 21,201,943 ±93,050 | 8th | A10040 |
| Homes built before 1960 | 44.6% ±0.7% , number 1,261,190 ±21,650 | 24.0% ±0.1% , number 32,210,798 ±121,500 | 4th | A10055 |
*1 is the highest. Population is ranked among all states, and the rest among those of 1,000 people or more, whose figures can be ranked. Ranks use 5-year estimates, the only ones covering every state, so they can differ slightly from the figures here.
Getting around
How people get around
62.8% of workers drive alone and 14.2% work from home. 47.3% of those who travel to work spend 30 minutes or more getting there, and 12.2% of households have no vehicle.
How people get to work
Source: ACS 2025 1-year, table A09005.
Show data
| Massachusetts | United States | |
|---|---|---|
| Drive alone | 62.8% ±0.4% , number 2,314,311 ±20,970 | 69.8% ±0.1% , number 115,297,377 ±192,900 |
| Carpool | 7.5% ±0.3% , number 275,275 ±12,880 | 8.9% ±0.1% , number 14,712,170 ±97,240 |
| Public transit | 9.2% ±0.4% , number 339,100 ±14,420 | 4.3% ±<0.1% , number 7,100,386 ±63,330 |
| Walk | 4.2% ±0.2% , number 156,633 ±7,936 | 2.4% ±<0.1% , number 4,016,469 ±41,070 |
| Work from home | 14.2% ±0.4% , number 524,275 ±14,860 | 12.9% ±0.1% , number 21,288,393 ±105,700 |
| Other | 2.1% ±0.2% , number 78,187 ±6,499 | 1.7% ±<0.1% , number 2,799,658 ±41,510 |
Embed
Time spent getting to work
Source: ACS 2025 1-year, table B09001.
Show data
| Massachusetts | United States | |
|---|---|---|
| Under 10 minutes | 10.1% ±0.4% , number 319,361 ±12,950 | 12.0% ±0.1% , number 17,199,225 ±93,440 |
| 10 to 19 minutes | 23.5% ±0.6% , number 742,444 ±19,830 | 27.8% ±0.1% , number 40,059,540 ±137,700 |
| 20 to 29 minutes | 19.1% ±0.4% , number 604,062 ±14,540 | 21.0% ±0.1% , number 30,221,743 ±111,100 |
| 30 to 39 minutes | 18.1% ±0.5% , number 571,389 ±16,840 | 17.1% ±0.1% , number 24,659,138 ±103,800 |
| 40 to 59 minutes | 16.1% ±0.5% , number 508,392 ±16,640 | 12.6% ±0.1% , number 18,104,709 ±97,070 |
| 60 minutes or more | 13.2% ±0.4% , number 417,858 ±14,000 | 9.5% ±0.1% , number 13,681,705 ±84,440 |
Embed
Vehicles per household
Source: ACS 2025 1-year, table A10030.
Show data
| Massachusetts | United States | |
|---|---|---|
| None | 12.2% ±0.4% , number 343,599 ±12,390 | 8.8% ±0.1% , number 11,781,997 ±77,240 |
| One | 36.1% ±0.6% , number 1,020,465 ±17,810 | 33.1% ±0.1% , number 44,424,682 ±160,700 |
| Two | 34.8% ±0.6% , number 984,943 ±16,470 | 36.0% ±0.1% , number 48,200,889 ±176,800 |
| Three or more | 16.9% ±0.5% , number 478,787 ±13,320 | 22.1% ±0.1% , number 29,655,854 ±113,300 |
Embed
All the numbers
| Indicator | Massachusetts | US | Rank among states* | Table |
|---|---|---|---|---|
| Drive to work alone | 62.8% ±0.4% , number 2,314,311 ±20,970 | 69.8% ±0.1% , number 115,297,377 ±192,900 | 49th | A09005 |
| Take public transit | 9.2% ±0.4% , number 339,100 ±14,420 | 4.3% ±<0.1% , number 7,100,386 ±63,330 | 4th | A09005 |
| Work from home | 14.2% ±0.4% , number 524,275 ±14,860 | 12.9% ±0.1% , number 21,288,393 ±105,700 | 6th | A09005 |
| Commute 30 minutes or more | 47.3% ±0.8% , number 1,497,639 ±27,500 | 39.2% ±0.1% , number 56,445,552 ±165,300 | 5th | B09001 |
| Households with no vehicle | 12.2% ±0.4% , number 343,599 ±11,120 | 8.8% ±<0.1% , number 11,781,997 ±64,240 | 3rd | A10030 |
*1 is the highest. Population is ranked among all states, and the rest among those of 1,000 people or more, whose figures can be ranked. Ranks use 5-year estimates, the only ones covering every state, so they can differ slightly from the figures here.
Places
The largest cities in Massachusetts
Population, from the latest estimates available. Figures cover the whole of each place.
Largest cities
States like this one
- New Jersey: 9,343,809
- Washington: 7,816,116
- Maryland: 6,206,011
- Connecticut: 3,624,508
States at least a third this size, with the closest income, education, age, housing and origins.
Every county and place in Massachusetts
Find any county, city, town, metro area, ZIP code, school district or district in Massachusetts.
Counties
Each of the 14 counties with its population, from ACS 2020–2024 5-year estimates.
- Barnstable County231,668
- Berkshire County129,430
- Bristol County582,270
- Dukes County20,933
- Essex County813,054
- Franklin County70,944
- Hampden County462,815
- Hampshire County162,028
- Middlesex County1.64M
- Nantucket County14,483
- Norfolk County730,082
- Plymouth County535,075
- Suffolk County785,121
- Worcester County867,788
Cities, towns and other places
Each of the 248 with its population, from ACS 2020–2024 5-year estimates. Census-designated places are communities without a local government of their own, drawn by the Census Bureau so they can be counted.
- Abington17,053
- Acushnet Center2,810
- Adams5,427
- Agawam Town28,539
- Amesbury17,403
- Amherst Town38,182
- Andover9,451
- Arlington46,350
- Athol8,801
- Attleboro46,762
- Ayer3,098
- Baldwinville2,528
- Barnstable Town49,568
- Barre673
- Belchertown2,355
- Bellingham5,325
- Belmont27,175
- Beverly42,665
- Blandford433
- Bliss Corner5,405
- Boston666,442
- Bourne1,806
- Boxford2,284
- Braintree Town38,899
- Brewster1,994
- Bridgewater Town28,471
- Brockton105,386
- Brookfield828
- Brookline63,266
- Burlington26,274
- Buzzards Bay2,909
- Cambridge118,796
- Cedar Crest1,730
- Chatham1,600
- Chelsea39,908
- Cheshire674
- Chester681
- Chicopee55,295
- Clinton7,658
- Cochituate6,471
- Cordaville2,989
- Danvers28,098
- Dedham25,237
- Deerfield458
- Dennis2,424
- Dennis Port3,691
- Devens1,723
- Dover2,308
- Duxbury1,994
- East Brookfield1,445
- East Dennis3,062
- East Douglas2,987
- East Falmouth6,245
- East Harwich5,654
- East Pepperell1,949
- East Sandwich3,864
- Easthampton16,086
- Edgartown904
- Essex1,688
- Everett50,045
- Fall River94,082
- Falmouth3,954
- Fiskdale2,311
- Fitchburg41,798
- Forestdale3,801
- Foxborough6,251
- Framingham72,399
- Franklin Town33,154
- Gardner21,148
- Gloucester30,075
- Granby1,152
- Great Barrington2,331
- Green Harbor1,314
- Greenfield17,664
- Groton1,232
- Hanscom AFB2,110
- Hanson1,927
- Harwich Center1,774
- Harwich Port2,238
- Hatfield1,449
- Haverhill67,698
- Hingham5,130
- Holbrook11,380
- Holland1,301
- Holyoke37,813
- Hopedale4,360
- Hopkinton3,426
- Housatonic1,113
- Hudson15,719
- Hull10,138
- Huntington892
- Ipswich4,924
- Kingston5,910
- Lawrence88,736
- Lee1,511
- Lenox1,866
- Lenox Dale29
- Leominster43,909
- Lexington34,295
- Littleton Common3,289
- Longmeadow15,696
- Lowell118,368
- Lunenburg2,057
- Lynn101,709
- Lynnfield13,064
- Madaket377
- Malden65,906
- Mansfield Center7,222
- Marblehead20,413
- Marion Center1,335
- Marlborough41,647
- Marshfield5,161
- Marshfield Hills1,978
- Mashpee Neck908
- Mattapoisett Center2,669
- Maynard10,712
- Medfield6,849
- Medford59,354
- Melrose29,650
- Methuen53,475
- Middleborough Center8,155
- Milford27,731
- Millers Falls1,054
- Millis-Clicquot4,437
- Milton28,587
- Monomoscoy Island141
- Monson Center1,613
- Monument Beach3,277
- Nahant3,325
- Nantucket10,017
- Needham32,459
- New Bedford100,998
- New Seabury726
- Newburyport18,652
- Newton89,044
- North Adams12,606
- North Attleborough Town30,984
- North Brookfield2,659
- North Eastham2,085
- North Falmouth2,838
- North Lakeville3,624
- North Pembroke3,393
- North Plymouth4,337
- North Scituate6,492
- North Seekonk2,974
- North Westport5,289
- Northampton30,962
- Northborough6,392
- Northfield1,070
- Northwest Harwich3,932
- Norton Center2,663
- Norwood31,542
- Oak Bluffs1,184
- Ocean Bluff-Brant Rock4,540
- Ocean Grove3,453
- Onset1,380
- Orange3,737
- Orleans1,480
- Oxford5,671
- Palmer Town12,381
- Peabody54,695
- Pepperell1,971
- Petersham312
- Pinehurst6,845
- Pittsfield43,457
- Plymouth7,918
- Pocasset2,247
- Popponesset563
- Popponesset Island33
- Provincetown3,452
- Quincy102,114
- Randolph Town34,878
- Raynham Center4,841
- Reading25,612
- Revere60,012
- Rockport4,704
- Rowley1,708
- Russell487
- Rutland2,019
- Sagamore4,072
- Salem44,795
- Salisbury5,656
- Sandwich2,890
- Saugus28,773
- Scituate5,796
- Seabrook530
- Seconsett Island168
- Sharon6,232
- Shelburne Falls1,845
- Shirley1,146
- Siasconset204
- Smith Mills4,612
- Somerset18,298
- Somerville81,036
- South Ashburnham1,500
- South Deerfield1,882
- South Dennis3,135
- South Duxbury3,252
- South Lancaster2,177
- South Yarmouth11,552
- Southbridge Town17,928
- Spencer5,661
- Springfield154,749
- Stoneham23,355
- Sturbridge2,443
- Swampscott15,277
- Taunton60,433
- Teaticket1,759
- The Pinehills5,282
- Topsfield2,624
- Townsend987
- Turners Falls4,124
- Upton3,234
- Vineyard Haven2,469
- Wakefield27,793
- Walpole6,461
- Waltham64,902
- Ware6,369
- Wareham Center3,635
- Warren1,426
- Watertown35,543
- Webster12,228
- Wellesley30,347
- West Brookfield1,563
- West Chatham1,258
- West Concord5,876
- West Dennis2,556
- West Falmouth1,325
- West Springfield Town28,772
- West Wareham2,257
- West Warren613
- West Yarmouth6,194
- Westborough4,699
- Westfield40,378
- Weweantic1,452
- Weymouth Town58,505
- White Island Shores1,620
- Whitinsville7,115
- Wilbraham3,679
- Williamstown5,070
- Wilmington23,336
- Winchendon4,331
- Winchester23,406
- Winthrop Town18,759
- Woburn41,939
- Woods Hole988
- Worcester207,055
- Yarmouth Port5,961
Metro and micro areas
Each of the 10 that reach into Massachusetts, with its whole population, from ACS 2020–2024 5-year estimates. Metro and micro areas are counties tied together by commuting, drawn by the Office of Management and Budget.
- Amherst Town-Northampton, MA Metro Area162,028
- Barnstable Town, MA Metro Area231,668
- Boston-Cambridge-Newton, MA-NH Metro Area4.95M
- Greenfield, MA Micro Area70,944
- Nantucket, MA Micro Area14,483
- Pittsfield, MA Metro Area129,430
- Providence-Warwick, RI-MA Metro Area1.68M
- Springfield, MA Metro Area462,815
- Vineyard Haven, MA Micro Area20,933
- Worcester, MA Metro Area867,788
ZIP codes
Each of the 532 with people in it, by the town it's centered in, from ACS 2020–2024 5-year estimates. These are the Census Bureau's ZIP Code Tabulation Areas, which follow the Postal Service's ZIP codes as closely as census blocks allow.
- 01001Agawam Town16,234
- 01002Amherst Town26,370
- 01003Amherst Town13,510
- 01005Barre5,204
- 01007Belchertown15,419
- 01008Blandford1,327
- 01009Palmer Town804
- 01010Fiskdale3,705
- 01011Chester1,175
- 01012Chester397
- 01013Chicopee23,284
- 01020Chicopee30,167
- 01022Chicopee1,844
- 010261,014
- 01027Northampton17,716
- 01028Longmeadow16,321
- 01029Chester539
- 01030Agawam Town12,305
- 01031Ware1,676
- 01032509
- 01033Granby6,080
- 01034Blandford2,332
- 01035Hatfield5,306
- 01036Wilbraham4,946
- 01037Barre572
- 01038Hatfield2,491
- 01039Hatfield1,506
- 01040Holyoke37,813
- 01050Huntington2,529
- 01053Northampton2,304
- 01054South Deerfield1,608
- 01056Wilbraham20,904
- 01057Monson Center8,176
- 01060Northampton16,492
- 01062Northampton9,816
- 01063Northampton2,272
- 01066Hatfield115
- 01068Barre1,639
- 01069Palmer Town8,821
- 01070575
- 01071Blandford1,054
- 01072Amherst Town1,521
- 01073Easthampton6,230
- 01074Barre368
- 01075Granby17,754
- 01077Westfield9,217
- 01079Palmer Town438
- 01080Palmer Town2,454
- 01081Monson Center1,747
- 01082Ware10,392
- 01083Warren2,858
- 01084Chester97
- 01085Westfield41,102
- 01088Hatfield702
- 01089West Springfield Town28,772
- 01092West Warren1,200
- 01093South Deerfield225
- 01094Barre52
- 01095Wilbraham14,618
- 01096Northampton2,580
- 01097Russell143
- 01098Chester979
- 01103Springfield2,477
- 01104Springfield23,209
- 01105Springfield11,843
- 01106Longmeadow15,853
- 01107Springfield12,009
- 01108Springfield27,405
- 01109Springfield31,124
- 01118Springfield14,839
- 01119Springfield13,616
- 01128Springfield2,896
- 01129Springfield5,672
- 01151Springfield9,606
- 01201Pittsfield44,848
- 01220Adams8,074
- 01222664
- 01223Chester2,495
- 01224Cheshire228
- 01225Cheshire3,216
- 01226Pittsfield6,256
- 01229Housatonic263
- 01230Great Barrington8,826
- 012352,489
- 01236Housatonic1,458
- 01237Cheshire2,302
- 01238Lee5,944
- 01240Lenox5,111
- 01242Lenox Dale29
- 01243Chester173
- 01244Great Barrington271
- 01245Great Barrington692
- 01247North Adams14,794
- 01253Chester936
- 01254Lenox1,036
- 01255994
- 01256Adams795
- 01257Great Barrington2,348
- 01258Great Barrington193
- 01259688
- 01260Lee20
- 01262Lee1,778
- 01264Lee188
- 01266Housatonic1,000
- 01267Williamstown9,633
- 01270Cheshire1,036
- 01301Greenfield17,876
- 01330Shelburne Falls1,704
- 01331Athol13,922
- 01337Greenfield2,589
- 01338Shelburne Falls95
- 01339Shelburne Falls1,313
- 01340Shelburne Falls1,759
- 01341Deerfield1,622
- 01342Deerfield1,267
- 01343Adams147
- 01344Millers Falls1,703
- 01346Shelburne Falls454
- 01347Millers Falls165
- 01349Millers Falls741
- 01350North Adams122
- 01351Millers Falls2,636
- 01354Turners Falls1,740
- 01355Petersham958
- 01360Northfield2,872
- 01364Orange7,658
- 01366Petersham1,185
- 01367563
- 01368Athol1,455
- 01370Shelburne Falls3,878
- 01373South Deerfield4,860
- 01375South Deerfield3,641
- 01376Turners Falls4,976
- 01378Northfield776
- 01379Millers Falls778
- 01380Millers Falls36
- 01420Fitchburg41,839
- 01430South Ashburnham6,481
- 01431Fitchburg3,211
- 01432Ayer8,521
- 01434Devens1,564
- 01436Baldwinville3,720
- 01438Gardner330
- 01440Gardner21,276
- 01450Groton11,356
- 01451Devens5,487
- 01452Gardner4,371
- 01453Leominster43,851
- 01460Littleton Common10,280
- 01462Lunenburg11,919
- 01463Pepperell11,697
- 01464Devens6,976
- 01468Baldwinville4,183
- 01469Townsend6,820
- 01473Gardner8,374
- 01474Townsend2,280
- 01475Winchendon10,265
- 01501Worcester16,877
- 01503Hudson3,378
- 01504Bellingham9,255
- 01505Northborough4,948
- 01506Brookfield3,460
- 01507Sturbridge13,435
- 01510Clinton15,563
- 01515East Brookfield2,166
- 01516East Douglas9,376
- 01518Fiskdale2,598
- 01519Upton8,058
- 01520Worcester16,912
- 01521Holland2,583
- 01522Rutland3,152
- 01523South Lancaster8,606
- 01524Spencer6,327
- 01527Worcester13,961
- 01529Bellingham3,160
- 01531North Brookfield973
- 01532Northborough15,750
- 01534Whitinsville6,230
- 01535North Brookfield4,760
- 01536Westborough6,860
- 01537Oxford2,278
- 01540Oxford10,979
- 01541Rutland3,529
- 01542Spencer2,615
- 01543Rutland9,353
- 01545Northborough38,876
- 01550Southbridge Town17,928
- 01560Upton4,984
- 01562Spencer12,008
- 01564South Lancaster8,183
- 01566Sturbridge7,362
- 01568Upton8,011
- 01569Whitinsville14,304
- 01570Webster17,748
- 01571Webster11,929
- 01581Westborough21,944
- 01583Clinton7,606
- 01585West Brookfield4,810
- 01588Whitinsville10,258
- 01590East Douglas9,422
- 01602Worcester27,092
- 01603Worcester20,868
- 01604Worcester39,812
- 01605Worcester30,579
- 01606Worcester22,844
- 01607Worcester8,706
- 01608Worcester4,932
- 01609Worcester22,047
- 01610Worcester30,444
- 01611Worcester2,299
- 01612Spencer5,002
- 01701Framingham32,618
- 01702Framingham39,789
- 01718Littleton Common404
- 01719Littleton Common5,496
- 01720West Concord23,526
- 01721Cordaville18,873
- 01730Hanscom AFB14,707
- 01731Hanscom AFB2,110
- 01740Hudson5,737
- 01741Littleton Common5,239
- 01742West Concord18,448
- 01745Cordaville586
- 01746Hopkinton15,094
- 01747Hopedale6,027
- 01748Hopkinton19,358
- 01749Hudson20,077
- 01752Marlborough41,647
- 01754Maynard10,712
- 01756Hopedale6,325
- 01757Milford30,609
- 01760Cochituate36,782
- 01770Millis-Clicquot4,427
- 01772Cordaville9,907
- 01773Hanscom AFB4,891
- 01775Maynard7,165
- 01776Maynard19,270
- 01778Cochituate14,033
- 01801Woburn41,939
- 01803Burlington26,274
- 01810Andover35,648
- 01821Pinehurst30,143
- 01824Lowell26,650
- 01826Lowell32,629
- 01827East Pepperell3,408
- 01830Haverhill26,530
- 01832Haverhill26,386
- 01833Boxford8,432
- 01834Haverhill6,777
- 01835Haverhill14,782
- 01840Lawrence8,522
- 01841Lawrence52,769
- 01843Lawrence27,445
- 01844Methuen53,420
- 01845Andover32,494
- 01850Lowell17,740
- 01851Lowell33,403
- 01852Lowell37,144
- 01854Lowell30,081
- 01860Amesbury6,748
- 01862Lowell12,129
- 01863Lowell9,796
- 01864Reading15,765
- 01867Reading25,612
- 01876Wilmington31,004
- 01879Lowell12,550
- 01880Wakefield27,793
- 01886Littleton Common24,690
- 01887Wilmington23,336
- 01890Winchester23,406
- 01901Lynn2,419
- 01902Lynn50,066
- 01904Lynn21,003
- 01905Lynn28,221
- 01906Saugus28,773
- 01907Swampscott15,277
- 01908Nahant3,325
- 01913Amesbury17,403
- 01915Beverly41,994
- 01921Boxford8,250
- 01922Rowley3,450
- 01923Danvers27,991
- 01929Essex3,621
- 01930Gloucester30,075
- 01937Danvers107
- 01938Ipswich13,930
- 01940Lynnfield13,285
- 01944Beverly5,403
- 01945Marblehead20,470
- 01949Topsfield9,816
- 01950Newburyport18,652
- 01951Newburyport3,327
- 01952Salisbury9,281
- 01960Peabody54,474
- 01965Beverly671
- 01966Rockport7,009
- 01969Rowley6,251
- 01970Salem44,738
- 01982Ipswich7,680
- 01983Topsfield6,564
- 01984Beverly4,929
- 01985Amesbury4,591
- 02019Bellingham17,410
- 02021Norwood24,748
- 02025North Scituate8,427
- 02026Dedham25,237
- 02030Dover5,930
- 02032Walpole4,992
- 02035Foxborough18,615
- 02038Franklin Town33,154
- 02043Hingham24,283
- 02045Hull10,138
- 02047Marshfield Hills182
- 02048Mansfield Center23,931
- 02050Marshfield25,963
- 02052Medfield13,068
- 02053Millis-Clicquot13,436
- 02054Millis-Clicquot8,888
- 02056Millis-Clicquot11,673
- 02061North Scituate11,361
- 02062Norwood31,542
- 02066North Scituate19,099
- 02067Sharon18,538
- 02071Walpole2,089
- 02072Sharon29,225
- 02081Walpole19,343
- 02090Norwood16,318
- 02093Franklin Town12,297
- 02108Boston3,794
- 02109Boston3,612
- 02110Boston2,342
- 02111Boston8,407
- 02113Boston6,385
- 02114Boston14,418
- 02115Boston29,705
- 02116Boston21,978
- 02118Boston28,946
- 02119Boston27,377
- 02120Boston15,283
- 02121Boston29,040
- 02122Boston23,479
- 02124Boston56,216
- 02125Boston33,662
- 02126Boston26,583
- 02127Boston36,769
- 02128Boston43,345
- 02129Boston20,032
- 02130Boston40,055
- 02131Boston31,151
- 02132Boston26,444
- 02133Boston62
- 02134Boston17,667
- 02135Boston43,149
- 02136Boston37,265
- 02138Cambridge38,509
- 02139Cambridge40,033
- 02140Cambridge21,204
- 02141Cambridge14,517
- 02142Cambridge4,737
- 02143Somerville25,513
- 02144Somerville25,448
- 02145Somerville27,495
- 02148Malden65,906
- 02149Everett50,045
- 02150Chelsea39,908
- 02151Revere60,012
- 02152Winthrop Town18,759
- 02155Medford61,730
- 02163Boston1,817
- 02169Quincy62,993
- 02170Quincy18,809
- 02171Quincy20,164
- 02176Melrose29,650
- 02180Stoneham23,355
- 02184Braintree Town38,899
- 02186Milton28,735
- 02188Weymouth Town16,179
- 02189Weymouth Town14,450
- 02190Weymouth Town19,695
- 02191Weymouth Town8,181
- 02199Boston1,292
- 02210Boston6,971
- 02215Boston24,581
- 02301Brockton68,969
- 02302Brockton36,417
- 02322Holbrook4,774
- 02324Bridgewater Town25,704
- 02325Bridgewater Town2,822
- 02330West Wareham11,712
- 02332Duxbury16,185
- 02333Bridgewater Town14,401
- 02338Hanson7,748
- 02339Hanson14,845
- 02341Hanson10,542
- 02343Holbrook11,346
- 02346Middleborough Center24,505
- 02347North Lakeville11,944
- 02350Hanson118
- 02351Abington17,053
- 02356Brockton12,475
- 02357Brockton1,566
- 02359Hanson18,382
- 02360The Pinehills63,689
- 02364Kingston14,027
- 02366White Island Shores264
- 02367Kingston2,935
- 02368Randolph Town34,912
- 02370Abington17,701
- 02375Raynham Center11,275
- 02379Bridgewater Town7,708
- 02382Abington15,295
- 02420Lexington16,215
- 02421Lexington18,080
- 02445Brookline22,560
- 02446Brookline31,310
- 02451Waltham17,393
- 02452Waltham15,808
- 02453Waltham31,591
- 02457Wellesley1,881
- 02458Newton13,050
- 02459Newton18,449
- 02460Newton10,099
- 02461Newton6,975
- 02462Newton1,470
- 02464Newton3,833
- 02465Newton11,697
- 02466Newton8,679
- 02467Brookline23,001
- 02468Newton5,773
- 02472Watertown35,620
- 02474Arlington28,642
- 02476Arlington17,708
- 02478Belmont27,175
- 02481Wellesley17,415
- 02482Wellesley11,051
- 02492Needham21,424
- 02493Cochituate11,579
- 02494Needham11,035
- 02532Buzzards Bay13,267
- 02534North Falmouth1,369
- 025352,244
- 02536East Falmouth21,328
- 02537East Sandwich6,383
- 02538White Island Shores4,074
- 02539Edgartown5,278
- 02540Falmouth8,104
- 02542Forestdale882
- 02543Woods Hole747
- 02553Monument Beach30
- 02554Nantucket14,212
- 02556North Falmouth2,868
- 02557Oak Bluffs1,250
- 02558Onset1,734
- 02559Pocasset2,802
- 02561Sagamore670
- 02562Sagamore3,402
- 02563Sandwich10,436
- 02564Siasconset255
- 02568Vineyard Haven9,412
- 02571Wareham Center11,258
- 02575Vineyard Haven2,718
- 02576West Wareham4,168
- 02584Siasconset16
- 02601Barnstable Town16,071
- 02630Barnstable Town2,371
- 02631Brewster10,061
- 02632Barnstable Town11,685
- 02633West Chatham4,512
- 02635Barnstable Town3,577
- 02637Barnstable Town227
- 02638Dennis3,253
- 02639Dennis Port3,808
- 02641East Dennis316
- 02642North Eastham5,811
- 02644Forestdale3,700
- 02645Harwich Center11,288
- 02646Harwich Port1,846
- 02647Barnstable Town209
- 02648Barnstable Town7,968
- 02649Mashpee Neck15,384
- 02650Chatham1,032
- 02652Provincetown845
- 02653Orleans6,443
- 02655Barnstable Town4,024
- 02657Provincetown3,703
- 02659West Chatham1,137
- 02660South Dennis6,381
- 02663North Eastham443
- 02664South Yarmouth9,949
- 02666Provincetown863
- 02667North Eastham3,961
- 02668Barnstable Town2,820
- 02670West Dennis1,087
- 02671Northwest Harwich818
- 02673West Yarmouth8,594
- 02675Yarmouth Port7,297
- 02702Fall River4,488
- 02703Attleboro46,713
- 0271323
- 02715Somerset3,757
- 02717Fall River4,797
- 02718Taunton6,878
- 02719New Bedford15,903
- 02720Fall River30,940
- 02721Fall River26,521
- 02723Fall River17,067
- 02724Fall River18,505
- 02725Somerset2,257
- 02726Somerset16,041
- 02738Marion Center5,310
- 02739Mattapoisett Center6,634
- 02740New Bedford46,281
- 02743Acushnet Center10,519
- 02744New Bedford12,716
- 02745New Bedford24,519
- 02746New Bedford17,531
- 02747Smith Mills22,445
- 02748Bliss Corner11,281
- 02760North Attleborough Town29,177
- 02762North Attleborough Town9,943
- 02763North Attleborough Town1,807
- 02764Taunton4,436
- 02766Norton Center19,240
- 02767Raynham Center15,599
- 02769North Seekonk13,022
- 02770West Wareham5,809
- 02771North Seekonk15,694
- 02777Ocean Grove17,359
- 02779Taunton6,829
- 02780Taunton53,461
- 02790North Westport16,901
- 02791Bliss Corner290
Towns and townships
Each of the 292 with people in it, from ACS 2020–2024 5-year estimates: the county subdivisions that are governments of their own. A city, borough or village that is one too is listed with the places above.
- Abington town17,053
- Acton town24,155
- Acushnet town10,624
- Adams town8,074
- Alford town433
- Andover town36,652
- Aquinnah town666
- Arlington town46,350
- Ashburnham town6,415
- Ashby town3,211
- Ashfield town1,893
- Ashland town18,873
- Athol town12,011
- Auburn town16,970
- Avon town4,774
- Ayer town8,645
- Barre town5,572
- Becket town1,962
- Bedford town14,727
- Belchertown town15,393
- Bellingham town17,410
- Belmont town27,175
- Berkley town6,829
- Berlin town3,378
- Bernardston town2,164
- Billerica town42,003
- Blackstone town9,255
- Blandford town1,156
- Bolton town5,737
- Bourne town20,323
- Boxborough town5,496
- Boxford town8,208
- Boylston town4,948
- Brewster town10,420
- Brimfield town3,705
- Brookfield town3,460
- Brookline town63,266
- Buckland town2,036
- Burlington town26,274
- Canton town24,748
- Carlisle town5,239
- Carver town11,712
- Charlemont town1,118
- Charlton town13,435
- Chatham town6,681
- Chelmsford town36,446
- Cheshire town3,216
- Chester town1,240
- Chesterfield town1,055
- Chilmark town1,578
- Clarksburg town1,667
- Clinton town15,563
- Cohasset town8,427
- Colrain town1,627
- Concord town18,223
- Conway town1,755
- Cummington town902
- Dalton town6,256
- Danvers town28,098
- Dartmouth town33,328
- Dedham town25,237
- Deerfield town5,158
- Dennis town14,868
- Dighton town8,193
- Douglas town9,207
- Dover town5,930
- Dracut town32,574
- Dudley town11,929
- Dunstable town3,408
- Duxbury town16,185
- East Bridgewater town14,456
- East Brookfield town2,166
- East Longmeadow town16,425
- Eastham town5,811
- Easton town25,316
- Edgartown town5,278
- Egremont town1,230
- Erving town1,703
- Essex town3,701
- Fairhaven town15,903
- Falmouth town33,039
- Florida town668
- Foxborough town18,615
- Freetown town9,285
- Georgetown town8,474
- Gill town1,740
- Goshen town915
- Gosnold town31
- Grafton town19,902
- Granby town6,080
- Granville town1,846
- Great Barrington town7,202
- Groton town11,390
- Groveland town6,777
- Hadley town5,306
- Halifax town7,748
- Hamilton town7,600
- Hampden town4,946
- Hancock town752
- Hanover town14,845
- Hanson town10,660
- Hardwick town2,684
- Harvard town6,927
- Harwich town13,598
- Hatfield town3,325
- Hawley town277
- Heath town765
- Hingham town24,283
- Hinsdale town1,859
- Holbrook town11,380
- Holden town20,064
- Holland town2,583
- Holliston town15,094
- Hopedale town6,027
- Hopkinton town19,358
- Hubbardston town4,371
- Hudson town20,077
- Hull town10,138
- Huntington town2,220
- Ipswich town13,930
- Kingston town14,027
- Lakeville town11,944
- Lancaster town8,606
- Lanesborough town3,028
- Lee town5,719
- Leicester town11,113
- Lenox town5,079
- Leverett town1,608
- Lexington town34,295
- Leyden town637
- Lincoln town6,948
- Littleton town10,280
- Longmeadow town15,696
- Ludlow town20,904
- Lunenburg town11,902
- Lynnfield town13,064
- Manchester-by-the-Sea town5,403
- Mansfield town23,931
- Marblehead town20,413
- Marion town5,310
- Marshfield town25,879
- Mashpee town15,384
- Mattapoisett town6,634
- Maynard town10,712
- Medfield town13,068
- Medway town13,436
- Mendon town6,325
- Merrimac town6,748
- Middleborough town24,505
- Middlefield town352
- Middleton town9,816
- Milford town30,431
- Millbury town13,961
- Millis town8,888
- Millville town3,160
- Milton town28,587
- Monroe town122
- Monson town8,136
- Montague town8,482
- Monterey town954
- Montgomery town796
- Mount Washington town193
- Nahant town3,325
- Natick town36,873
- Needham town32,459
- New Ashford town257
- New Braintree town973
- New Marlborough town1,501
- New Salem town1,054
- Newbury town6,777
- Norfolk town11,673
- North Andover town31,490
- North Brookfield town4,760
- North Reading town15,765
- Northborough town15,750
- Northbridge town16,458
- Northfield town2,872
- Norton town19,240
- Norwell town11,361
- Norwood town31,542
- Oak Bluffs town5,407
- Oakham town1,639
- Orange town7,573
- Orleans town6,415
- Otis town1,624
- Oxford town13,385
- Paxton town5,002
- Pelham town1,335
- Pembroke town18,382
- Pepperell town11,663
- Peru town630
- Petersham town1,185
- Phillipston town1,895
- Plainfield town616
- Plainville town9,943
- Plymouth town63,953
- Plympton town2,935
- Princeton town3,529
- Provincetown town3,703
- Raynham town15,505
- Reading town25,612
- Rehoboth town13,022
- Richmond town1,403
- Rochester town5,837
- Rockland town17,701
- Rockport town7,009
- Rowe town453
- Rowley town6,251
- Royalston town1,460
- Russell town1,197
- Rutland town9,353
- Salisbury town9,281
- Sandisfield town994
- Sandwich town20,522
- Saugus town28,773
- Savoy town795
- Scituate town19,365
- Seekonk town15,694
- Sharon town18,574
- Sheffield town3,330
- Shelburne town1,567
- Sherborn town4,427
- Shirley town6,976
- Shrewsbury town38,876
- Shutesbury town1,910
- Somerset town18,298
- South Hadley town17,754
- Southampton town6,230
- Southborough town10,493
- Southwick town9,217
- Spencer town12,008
- Sterling town8,183
- Stockbridge town2,056
- Stoneham town23,355
- Stoughton town29,225
- Stow town7,165
- Sturbridge town9,960
- Sudbury town19,306
- Sunderland town3,641
- Sutton town9,452
- Swampscott town15,277
- Swansea town17,359
- Templeton town8,252
- Tewksbury town31,273
- Tisbury town4,893
- Tolland town540
- Topsfield town6,564
- Townsend town9,100
- Truro town1,708
- Tyngsborough town12,550
- Tyringham town494
- Upton town8,189
- Uxbridge town14,473
- Wakefield town27,793
- Wales town1,929
- Walpole town26,388
- Ware town10,048
- Wareham town23,302
- Warren town5,009
- Warwick town776
- Washington town526
- Wayland town13,914
- Webster town17,748
- Wellesley town30,347
- Wellfleet town4,404
- Wendell town850
- Wenham town4,929
- West Boylston town7,782
- West Bridgewater town7,708
- West Brookfield town3,859
- West Newbury town4,591
- West Stockbridge town1,250
- West Tisbury town3,080
- Westborough town21,944
- Westford town24,690
- Westhampton town1,552
- Westminster town8,374
- Weston town11,579
- Westport town16,484
- Westwood town16,318
- Whately town1,499
- Whitman town15,295
- Wilbraham town14,572
- Williamsburg town2,694
- Williamstown town9,150
- Wilmington town23,336
- Winchendon town10,440
- Winchester town23,406
- Windsor town1,065
- Worthington town1,021
- Wrentham town12,297
- Yarmouth town25,224
School districts
Each of the 305 with people in it, from ACS 2020–2024 5-year estimates. Elementary districts teach the lower grades and secondary districts the upper ones, under them; the rest are unified, teaching every grade.
- Abington School District17,053
- Acton-Boxborough Regional School District29,651
- Acushnet School Districtelementary10,624
- Agawam School District28,539
- Amesbury School District17,403
- Amherst School Districtelementary38,182
- Amherst-Pelham School Districtsecondary43,035
- Andover School District36,652
- Arlington School District46,350
- Ashburnham-Westminster School District14,789
- Ashland School District18,873
- Athol-Royalston School District13,471
- Attleboro School District46,762
- Auburn School District16,970
- Avon School District4,774
- Ayer-Shirley School District15,621
- Barnstable School District49,568
- Bedford School District14,727
- Belchertown School District15,393
- Bellingham School District17,410
- Belmont School District27,175
- Berkley School Districtelementary6,829
- Berkshire Hills School District10,508
- Berlin-Boylston School District8,326
- Beverly School District42,665
- Billerica School District42,003
- Blackstone-Millville School District12,415
- Boston School District666,442
- Bourne School District20,323
- Boxford School Districtelementary8,208
- Braintree School District38,899
- Brewster School Districtelementary10,420
- Bridgewater-Raynham School District43,976
- Brimfield School Districtelementary3,705
- Brockton School District105,386
- Brookfield School Districtelementary3,460
- Brookline School District63,266
- Burlington School District26,274
- Cambridge School District118,796
- Canton School District24,748
- Carlisle School Districtelementary5,239
- Carver School District11,712
- Central Berkshire School District13,200
- Chelmsford School District36,446
- Chelsea School District39,908
- Chesterfield-Goshen School Districtelementary1,970
- Chicopee School District55,295
- Clarksburg School Districtelementary1,667
- Clinton School District15,563
- Cohasset School District8,427
- Concord School Districtelementary18,223
- Concord-Carlisle School Districtsecondary23,462
- Conway School Districtelementary1,755
- Danvers School District28,098
- Dartmouth School District33,328
- Dedham School District25,237
- Deerfield School Districtelementary5,158
- Dennis-Yarmouth School District40,092
- Dighton-Rehoboth School District21,215
- Douglas School District9,207
- Dover School Districtelementary5,930
- Dover-Sherborn School Districtsecondary10,357
- Dracut School District32,574
- Dudley-Charlton Regional School District25,364
- Duxbury School District16,185
- East Bridgewater School District14,456
- East Longmeadow School District16,425
- Eastham School Districtelementary5,811
- Easthampton School District16,086
- Easton School District25,316
- Edgartown School Districtelementary5,278
- Erving School Districtelementary1,703
- Everett School District50,045
- Fairhaven School District15,903
- Fairhaven/New Bedford School Districts in Acushnet (9-12)secondary10,624
- Fall River School District94,082
- Falmouth School District33,039
- Farmington River Regional School Districtelementary2,618
- Fitchburg School District41,798
- Florida School Districtelementary790
- Foxborough School District18,615
- Framingham School District72,399
- Franklin School District33,154
- Freetown-Lakeville School District21,229
- Frontier School Districtsecondary12,053
- Gardner School District21,148
- Gateway School District6,961
- Georgetown School District8,474
- Gill-Montague School District10,222
- Gill-Montague School District in Erving (7-12)secondary1,703
- Gloucester School District30,075
- Gosnold School District31
- Grafton School District19,902
- Granby School District6,080
- Greenfield School District17,664
- Groton-Dunstable School District14,798
- Hadley School District5,306
- Halifax School Districtelementary7,748
- Hamilton-Wenham School District12,529
- Hampden-Wilbraham School District19,518
- Hampshire School Districtsecondary12,446
- Hancock School Districtelementary752
- Hanover School District14,845
- Harvard School District6,927
- Hatfield School District3,325
- Haverhill School District67,698
- Hawlemont School Districtelementary1,395
- Hingham School District24,283
- Holbrook School District11,380
- Holland School Districtelementary2,583
- Holliston School District15,094
- Holyoke School District37,813
- Hoosac Valley School District11,290
- Hoosac Valley School District in Savoy (7-12)secondary795
- Hopedale School District6,027
- Hopkinton School District19,358
- Hudson School District20,077
- Hull School District10,138
- Ipswich School District13,930
- King Philip School Districtsecondary33,913
- Kingston School Districtelementary14,027
- Lawrence School District88,736
- Lee School District6,213
- Lee/Berkshire Hills in Farmington River Regional (7-12)secondary2,618
- Leicester School District11,113
- Lenox School District5,079
- Leominster School District43,909
- Leverett School Districtelementary1,608
- Lexington School District34,295
- Lincoln School Districtelementary6,948
- Lincoln-Sudbury School Districtsecondary26,254
- Littleton School District10,280
- Longmeadow School District15,696
- Lowell School District118,368
- Ludlow School District20,904
- Lunenburg School District11,902
- Lynn School District101,709
- Lynnfield School District13,064
- Malden School District65,906
- Manchester Essex Regional School District9,104
- Mansfield School District23,931
- Marblehead School District20,413
- Marion School Districtelementary5,310
- Marlborough School District41,647
- Marshfield School District25,879
- Martha's Vineyard School Districtsecondary20,902
- Masconomet School Districtsecondary24,588
- Mashpee School District15,384
- Mattapoisett School Districtelementary6,634
- Maynard School District10,712
- Medfield School District13,068
- Medford School District59,354
- Medway School District13,436
- Melrose School District29,650
- Mendon-Upton School District14,514
- Methuen School District53,475
- Middleborough School District24,505
- Middleton School Districtelementary9,816
- Milford School District30,431
- Millbury School District13,961
- Millis School District8,888
- Milton School District28,587
- Mohawk Trail Regional School District in Hawley and Charlemont townssecondary1,395
- Mohawk Trail School District8,504
- Mohawk Trail School District in Rowe (7-12)secondary453
- Monomoy Regional School District20,279
- Monson School District8,136
- Mount Greylock School District12,435
- Mount Greylock/New Lebanon (NY) School Districts in Hancock (7-12)secondary752
- Nahant School Districtelementary3,325
- Nantucket School District14,483
- Narragansett School District10,147
- Nashoba School District21,508
- Natick School District36,873
- Nauset School Districtsecondary27,050
- Nauset/Provincetown School Districts in Turo (7-12)secondary1,708
- Needham School District32,459
- New Bedford School District100,998
- New Salem-Wendell School Districtelementary1,904
- Newburyport School District18,652
- Newton School District89,044
- Norfolk School Districtelementary11,673
- North Adams School District12,606
- North Adams School District in Clarksburg (9-12)secondary1,667
- North Adams School District in Florida (9-12)secondary668
- North Adams School District in Monroe (9-12)secondary122
- North Andover School District31,490
- North Attleborough School District30,984
- North Brookfield School District4,760
- North Middlesex School District23,974
- North Reading School District15,765
- Northampton School District30,962
- Northborough School Districtelementary15,750
- Northborough-Southborough School Districtsecondary26,243
- Northbridge School District16,458
- Norton School District19,240
- Norwell School District11,361
- Norwood School District31,542
- Oak Bluffs School Districtelementary5,407
- Old Rochester School Districtsecondary17,781
- Orange School Districtelementary7,573
- Orleans School Districtelementary6,415
- Oxford School District13,385
- Palmer School District12,381
- Peabody School District54,695
- Pelham School Districtelementary1,335
- Pembroke School District18,382
- Pentucket School District18,116
- Petersham School Districtelementary1,185
- Pioneer Valley School District5,673
- Pioneer Valley School District in Warwick (7-12)secondary776
- Pittsfield School District43,457
- Pittsfield School District in Richmond (9-12)secondary1,403
- Plainville School Districtelementary9,943
- Plymouth School District63,953
- Plympton School Districtelementary2,935
- Provincetown School District3,703
- Quabbin School District15,239
- Quaboag Regional School District8,868
- Quincy School District102,114
- Ralph C. Mahar School Districtsecondary10,662
- Randolph School District34,878
- Reading School District25,612
- Revere School District60,012
- Richmond School Districtelementary1,403
- Rochester School Districtelementary5,837
- Rockland School District17,701
- Rockport School District7,009
- Rowe School Districtelementary453
- Salem School District44,795
- Sandwich School District20,522
- Saugus School District28,773
- Savoy School Districtelementary795
- Scituate School District19,365
- Seekonk School District15,694
- Sharon School District18,574
- Sherborn School Districtelementary4,427
- Shrewsbury School District38,876
- Shutesbury School Districtelementary1,910
- Silver Lake School Districtsecondary24,710
- Somerset School Districtelementary18,298
- Somerset-Berkley School Districtsecondary25,127
- Somerville School District81,036
- South Hadley School District17,754
- Southampton School Districtelementary6,230
- Southborough School Districtelementary10,493
- Southbridge School District17,928
- Southern Berkshire School District7,641
- Southwick-Tolland-Granville Regional School District11,603
- Spencer-East Brookfield School District14,174
- Springfield School District154,749
- Stoneham School District23,355
- Stoughton School District29,225
- Sturbridge School Districtelementary9,960
- Sudbury School Districtelementary19,306
- Sunderland School Districtelementary3,641
- Sutton School District9,452
- Swampscott School District15,277
- Swampscott School District in Nahant (7-12)secondary3,325
- Swansea School District17,359
- Tantasqua School Districtsecondary21,637
- Taunton School District60,433
- Tewksbury School District31,273
- Tisbury School Districtelementary4,893
- Topsfield School Districtelementary6,564
- Triton School District22,309
- Truro School Districtelementary1,708
- Tyngsborough School District12,550
- Up-Island Regional School Districtelementary5,324
- Uxbridge School District14,473
- Wachusett School District46,131
- Wakefield School District27,793
- Wales School Districtelementary1,929
- Walpole School District26,388
- Waltham School District64,902
- Ware School District10,048
- Wareham School District23,302
- Warwick School Districtelementary776
- Watertown School District35,543
- Wayland School District13,914
- Webster School District17,748
- Wellesley School District30,347
- Wellfleet School Districtelementary4,404
- West Boylston School District7,782
- West Bridgewater School District7,708
- West Springfield School District28,772
- Westborough School District21,944
- Westfield School District40,378
- Westford School District24,690
- Westhampton School Districtelementary1,552
- Weston School District11,579
- Westport School District16,484
- Westwood School District16,318
- Weymouth School District58,505
- Whately School Districtelementary1,499
- Whitman-Hanson School District25,955
- Williamsburg School Districtelementary2,694
- Wilmington School District23,336
- Winchendon School District10,440
- Winchester School District23,406
- Winthrop School District18,759
- Woburn School District41,939
- Worcester School District207,055
- Worthington School Districtelementary1,021
- Wrentham School Districtelementary12,297
Congressional districts
As drawn for the 119th Congress (2025–2027).
- Congressional District 1777,981
- Congressional District 2787,021
- Congressional District 3785,403
- Congressional District 4787,020
- Congressional District 5778,640
- Congressional District 6784,690
- Congressional District 7773,502
- Congressional District 8781,306
- Congressional District 9788,493
State senate districts
The upper chamber’s districts, as drawn in 2024.
- Berkshire-Hampden-Franklin-Hampshire District167,868
- Bristol and Norfolk District182,854
- Cape and Islands District177,816
- Fifth Middlesex District184,747
- First Bristol and Plymouth District173,289
- First Essex and Middlesex District180,919
- First Essex District166,641
- First Middlesex District178,563
- First Plymouth and Norfolk District174,143
- First Suffolk District184,982
- First Worcester District168,642
- Fourth Middlesex District179,448
- Hampden and Hampshire District165,004
- Hampden District165,964
- Hampden-Hampshire-Worcester District168,047
- Hampshire-Franklin-Worcester District168,453
- Middlesex and Norfolk District176,033
- Middlesex and Suffolk District184,498
- Middlesex and Worcester District178,817
- Norfolk and Middlesex District182,657
- Norfolk and Plymouth District172,881
- Norfolk and Suffolk District181,232
- Norfolk-Plymouth-Bristol District169,047
- Norfolk-Worcester-Middlesex District179,680
- Plymouth and Barnstable District188,565
- Second Bristol and Plymouth District167,487
- Second Essex and Middlesex District183,054
- Second Essex District170,253
- Second Middlesex District181,262
- Second Plymouth and Norfolk District172,568
- Second Suffolk District184,309
- Second Worcester District167,468
- Suffolk and Middlesex District174,051
- Third Bristol and Plymouth District184,505
- Third Essex District182,561
- Third Middlesex District169,477
- Third Suffolk District177,196
- Worcester and Hampden District183,284
- Worcester and Hampshire District168,646
- Worcester and Middlesex District177,145
State house districts
The lower chamber’s districts, as drawn in 2024.
- 1st Barnstable District43,302
- 1st Berkshire District43,767
- 1st Bristol District43,419
- 1st Essex District46,369
- 1st Franklin District42,699
- 1st Hampden District42,380
- 1st Hampshire District43,042
- 1st Middlesex District42,619
- 1st Norfolk District46,879
- 1st Plymouth District46,755
- 1st Suffolk District43,345
- 1st Worcester District46,322
- 2nd Barnstable District46,194
- 2nd Berkshire District43,457
- 2nd Bristol District43,148
- 2nd Essex District46,482
- 2nd Franklin District43,061
- 2nd Hampden District42,200
- 2nd Hampshire District42,524
- 2nd Middlesex District42,409
- 2nd Norfolk District45,904
- 2nd Plymouth District43,107
- 2nd Suffolk District43,338
- 2nd Worcester District42,991
- 3rd Barnstable District45,987
- 3rd Berkshire District42,206
- 3rd Bristol District46,242
- 3rd Essex District46,631
- 3rd Hampden District43,229
- 3rd Hampshire District40,884
- 3rd Middlesex District43,691
- 3rd Norfolk District42,300
- 3rd Plymouth District42,848
- 3rd Suffolk District38,745
- 3rd Worcester District45,045
- 4th Barnstable District42,320
- 4th Bristol District42,538
- 4th Essex District40,964
- 4th Hampden District42,859
- 4th Middlesex District42,551
- 4th Norfolk District42,141
- 4th Plymouth District44,203
- 4th Suffolk District43,417
- 4th Worcester District43,909
- 5th Barnstable District43,317
- 5th Bristol District44,825
- 5th Essex District46,188
- 5th Hampden District41,966
- 5th Middlesex District43,376
- 5th Norfolk District45,242
- 5th Plymouth District43,156
- 5th Suffolk District44,653
- 5th Worcester District44,730
- 6th Bristol District45,077
- 6th Essex District45,353
- 6th Hampden District45,075
- 6th Middlesex District42,083
- 6th Norfolk District44,565
- 6th Plymouth District47,399
- 6th Suffolk District49,568
- 6th Worcester District42,767
- 7th Bristol District41,102
- 7th Essex District44,795
- 7th Hampden District42,631
- 7th Middlesex District41,849
- 7th Norfolk District44,648
- 7th Plymouth District43,309
- 7th Suffolk District42,448
- 7th Worcester District43,899
- 8th Bristol District42,414
- 8th Essex District44,088
- 8th Hampden District42,462
- 8th Middlesex District44,705
- 8th Norfolk District42,733
- 8th Plymouth District43,976
- 8th Suffolk District41,927
- 8th Worcester District43,989
- 9th Bristol District41,888
- 9th Essex District44,112
- 9th Hampden District43,671
- 9th Middlesex District43,003
- 9th Norfolk District47,356
- 9th Plymouth District45,931
- 9th Suffolk District42,037
- 9th Worcester District44,549
- 10th Bristol District43,643
- 10th Essex District44,081
- 10th Hampden District43,625
- 10th Middlesex District43,872
- 10th Norfolk District42,996
- 10th Plymouth District44,827
- 10th Suffolk District45,002
- 10th Worcester District42,783
- 11th Bristol District42,763
- 11th Essex District46,540
- 11th Hampden District41,457
- 11th Middlesex District44,032
- 11th Norfolk District44,628
- 11th Plymouth District42,663
- 11th Suffolk District44,081
- 11th Worcester District42,987
- 12th Bristol District46,205
- 12th Essex District46,010
- 12th Hampden District43,571
- 12th Middlesex District45,936
- 12th Norfolk District44,499
- 12th Plymouth District45,355
- 12th Suffolk District47,128
- 12th Worcester District44,686
- 13th Bristol District41,598
- 13th Essex District44,717
- 13th Middlesex District42,797
- 13th Norfolk District44,848
- 13th Suffolk District42,949
- 13th Worcester District47,108
- 14th Bristol District42,605
- 14th Essex District46,033
- 14th Middlesex District45,049
- 14th Norfolk District45,516
- 14th Suffolk District47,969
- 14th Worcester District43,612
- 15th Essex District45,633
- 15th Middlesex District44,442
- 15th Norfolk District45,306
- 15th Suffolk District44,128
- 15th Worcester District41,160
- 16th Essex District42,583
- 16th Middlesex District47,110
- 16th Suffolk District40,026
- 16th Worcester District44,810
- 17th Essex District42,683
- 17th Middlesex District45,611
- 17th Suffolk District40,057
- 17th Worcester District43,634
- 18th Essex District47,371
- 18th Middlesex District42,658
- 18th Suffolk District39,560
- 18th Worcester District46,875
- 19th Middlesex District41,744
- 19th Suffolk District44,764
- 19th Worcester District41,234
- 20th Middlesex District45,755
- 21st Middlesex District44,485
- 22nd Middlesex District42,003
- 23rd Middlesex District43,811
- 24th Middlesex District45,843
- 25th Middlesex District43,261
- 26th Middlesex District45,647
- 27th Middlesex District46,341
- 28th Middlesex District44,016
- 29th Middlesex District45,303
- 30th Middlesex District47,327
- 31st Middlesex District43,665
- 32nd Middlesex District46,173
- 33rd Middlesex District46,307
- 34th Middlesex District44,812
- 35th Middlesex District43,101
- 36th Middlesex District45,124
- 37th Middlesex District44,273
- Barnstable-Dukes-Nantucket District45,964
PUMAs
Public Use Microdata Areas: areas of 100,000 people or more that the state draws from census tracts, for the Census Bureau’s microdata.
- Barnstable (East), Dukes & Nantucket Counties–Outer Cape Cod Towns PUMA128,248
- Barnstable County (West)–Inner Cape Cod Towns & Barnstable Town City PUMA138,836
- Berkshire County–Pittsfield PUMA129,430
- Boston City–Allston, Brighton & Fenway PUMA112,516
- Boston City–Back Bay, Beacon Hill, Charlestown, East Boston, Central & South End PUMA157,619
- Boston City–Dorchester & South Boston PUMA124,643
- Boston City–Hyde Park, Jamaica Plain, Roslindale & West Roxbury PUMA131,493
- Boston City–Mattapan & Roxbury PUMA140,142
- Bristol County (Central)–Fall River, Somerset & Acushnet PUMA132,289
- Bristol County (South)–New Bedford, Dartmouth & Westport PUMA166,713
- Bristol County–Attleboro, North Attleborough & Swansea PUMA123,821
- Bristol County–Taunton, Easton & Mansfield PUMA159,447
- Essex County (Central)–Peabody, Danvers & Saugus PUMA171,170
- Essex County (North)–Newburyport, Amesbury & North Andover PUMA124,652
- Essex County (Northwest)–Haverhill & Methuen PUMA121,173
- Essex County (South Coastline)–Salem, Beverly & Gloucester PUMA165,637
- Essex County (West)–Lawrence & Andover PUMA125,388
- Essex County–Lynn & Nahant PUMA105,034
- Franklin & Hampshire (West, North, East) Counties PUMA118,602
- Hampden County (Central)–Springfield PUMA154,749
- Hampden County (East)–Chicopee PUMA156,572
- Hampden County (West)–Westfield & Holyoke PUMA151,494
- Hampshire County (South)–Northampton PUMA114,370
- Middlesex County (East)–Cambridge PUMA118,796
- Middlesex County (East)–Malden & Medford PUMA125,260
- Middlesex County (East)–Somerville & Everett PUMA131,081
- Middlesex County (Northeast)–Billerica, Tewksbury & Dracut PUMA105,850
- Middlesex County (Northwest)–Outside Lowell PUMA128,079
- Middlesex County (Southwest) PUMA108,575
- Middlesex County (West Central) PUMA120,617
- Middlesex County–Framingham & Marlborough PUMA114,046
- Middlesex County–Lexington, Burlington & Wilmington PUMA140,565
- Middlesex County–Lowell PUMA118,368
- Middlesex County–Newton & Waltham PUMA153,946
- Middlesex County–Watertown, Arlington & Belmont PUMA109,068
- Middlesex County–Woburn, Melrose & Reading PUMA164,114
- Norfolk County (Central)–Norwood, Stoughton & Canton PUMA120,243
- Norfolk County (Northeast)–Weymouth, Braintree, Randolph & Cohasset PUMA140,709
- Norfolk County (Northwest)–Needham, Wellesley & Westwood PUMA120,446
- Norfolk County (Southwest)–Franklin, Walpole & Foxborough PUMA129,480
- Norfolk County–Brookline, Milton & Dedham PUMA117,090
- Norfolk County–Quincy PUMA102,114
- Plymouth County (North)–Marshfield, Hingham & Scituate PUMA143,294
- Plymouth County (South)–Plymouth Town, Middleborough & Wareham PUMA153,197
- Plymouth County (West)–Bridgewater, Abington & Whitman PUMA133,198
- Plymouth County–Brockton PUMA105,386
- Suffolk County (North)–Revere, Chelsea & Winthrop PUMA118,708
- Worcester City (East) PUMA106,545
- Worcester City (West) PUMA100,510
- Worcester County (East Central)–Outside Worcester City PUMA153,911
- Worcester County (Northeast)–Fitchburg, Leominster & Lunenburg PUMA118,879
- Worcester County (Northwest)–Gardner PUMA112,055
- Worcester County (South) PUMA158,742
- Worcester County (West Central)–Outside Worcester City PUMA117,146
Urban areas
Each that reaches into Massachusetts, with its whole population. Urban areas are the densely settled land the Census Bureau draws after each census, whatever the city lines.
- Amherst Town–Northampton–Easthampton Town, MA89,840
- Athol, MA14,141
- Barnstable Town, MA307,349
- Boston, MA–NH4.39M
- Greenfield, MA21,912
- Ipswich, MA9,773
- Lee, MA8,100
- Leominster–Fitchburg, MA111,473
- Nantucket, MA12,214
- Nashua, NH–MA242,017
- New Bedford, MA154,863
- North Adams, MA25,999
- Pepperell, MA5,553
- Pittsfield, MA50,677
- Providence, RI–MA1.29M
- Provincetown, MA5,149
- Southbridge Town, MA20,853
- Spencer, MA8,262
- Springfield, MA–CT439,257
- Sunderland–South Deerfield, MA5,531
- Vineyard Haven–Edgartown–Oak Bluffs, MA13,855
- Ware, MA5,638
- Winchendon, MA4,850
- Worcester, MA–CT485,823
Tribal areas
Each that reaches into Massachusetts, with its whole population.
Turn Massachusetts into your planning report.
Social Explorer Studio builds an editable profile of any place, with tables and charts beside the county and state, and exports to Word, PDF and Excel.
Questions about Massachusetts
What is the population of Massachusetts?
7,154,084 people, according to the ACS 2025 1-year estimates, which the Census Bureau adjusts to match its own population estimate. That’s the 16th largest of the 50 states and DC.
What is the FIPS code for Massachusetts?
25. Every county’s and place’s FIPS code in Massachusetts starts with it. The Census Bureau’s full geographic identifier (GEOID) is 0400000US25.
What is the largest city in Massachusetts?
Boston, with 670,792 people. Other large cities here include Worcester, Springfield and Cambridge.
What is the median household income in Massachusetts?
$106,539 (±$1,459), according to the ACS 2025 1-year estimates, higher than the US ($84,780).
What is the median age in Massachusetts?
40.4 years (±0.2), according to the ACS 2025 1-year estimates, higher than the US (39.5).
How much does housing cost in Massachusetts?
Massachusetts’s median home value is $626,900 (±$4,178) and its median gross rent is $1,962 (±$25) a month, according to the ACS 2025 1-year estimates. 49.9% (±1.3%) of its renters pay 30% or more of their income on rent.
Is Massachusetts growing?
Massachusetts’s population grew 5.3%, from 6,794,422 in 2015 to 7,154,084 in 2025, according to the ACS 1-year estimates.
Where do people who work in Massachusetts live?
3,329,982 of its 3,637,277 jobs are held by people who live here. Of those who commute in, the most come from New Hampshire, Rhode Island, Connecticut.
Where does this census data come from?
The U.S. Census Bureau’s American Community Survey, through Social Explorer’s tables: the latest 1-year estimates where they exist, for the most recent numbers, and 5-year estimates otherwise. Each table lists its code, so you can find it again.
Is this data free to use?
Yes. You can read it, cite it, download the CSV and embed the charts, with no account. To map other variables, compare your own areas or build a report, see Social Explorer’s plans in a live demo.
Sources and how to cite
American Community Survey 2025 1-year estimates, or 2020–2024 5-year estimates where noted, U.S. Census Bureau, from Social Explorer’s tables A00001, A00002, A01004, A04001, A06001, A08001, A09005, A10001, A10003, A10008, A10030, A10036, A10040, A10047, A10055, A10060, A12001, A13004, A14006, A14024, A14028, A16002, A17005, A18002, A18009, A20001, B02002, B09001, B13002, B18101, C16001. Maps by census tract use 2020–2024 5-year estimates, since the 1-year survey doesn’t cover tracts. Commuting: LEHD LODES 2023. These are estimates from a sample, each with its margin of error. Data retrieved November 14, 2026. How these profiles are made.
U.S. Census Bureau, American Community Survey 2025 1-year estimates, or 2020–2024 5-year estimates where noted, via Social Explorer. “Massachusetts.” https://www.socialexplorer.com/places/massachusetts. Accessed November 14, 2026.