

Virginia: Population, demographics and census data
Home to 8,880,107 people, the 12th largest of the 50 states and DC, anchored by Virginia Beach. It grew 5.9% between 2015 and 2025.
- Population
- 8.88M. Census Bureau estimate · Rank 12 of the 50 states and DC
- Median household income
- $99,322 ±$1,105. US $84,780
- Median age
- 39.5 ±0.2. US 39.5
ACS 2025 1-year estimates, U.S. Census Bureau
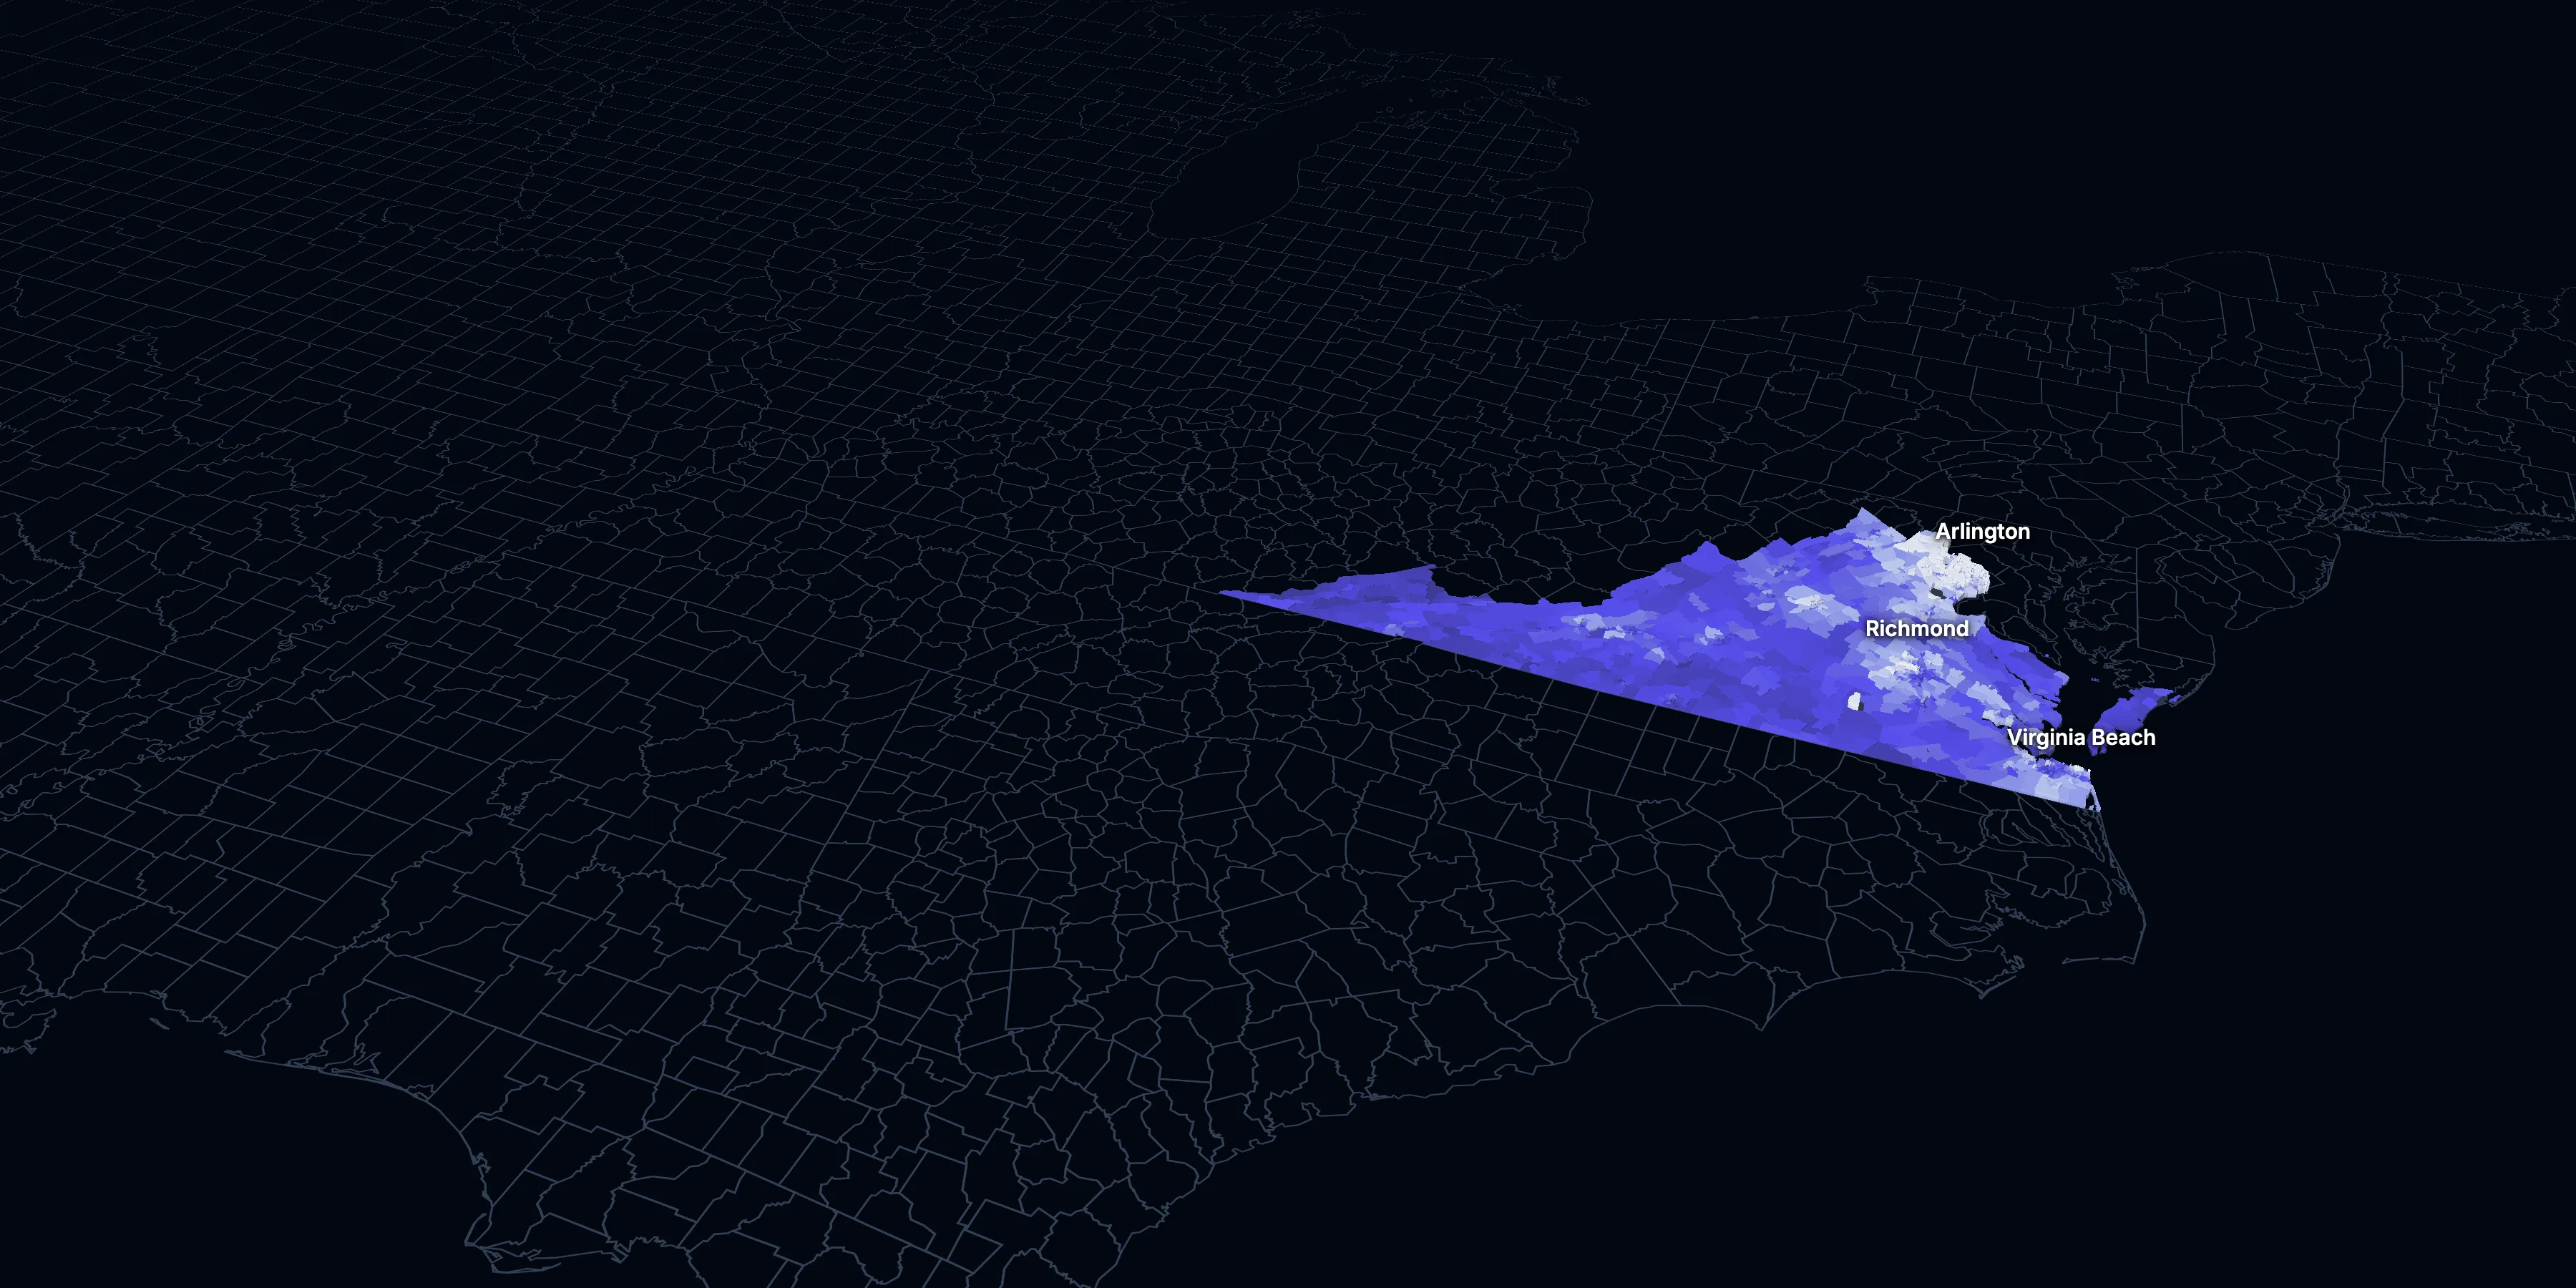
Taller, lighter tracts have higher household incomes
About Virginia
Virginia’s median household income is $99,322 (±$1,105), higher than the US ($84,780), and its median age is 39.5 (±0.2), according to the ACS 2025 1-year estimates. Its largest city is Virginia Beach.
± is each figure’s margin of error, at 90% confidence, and † marks one too uncertain to lean on. Under each percentage in the tables is the number it counts. How the margins are worked out.
FIPS code 51
Highlights
What stands out in Virginia
The numbers where Virginia sits furthest from the nation, or past a recognized policy benchmark.
Furthest from the national picture
9.0%
2nd among statesVeterans (adults)
That’s higher than the US (5.9%). It’s the 2nd highest of the 50 states and DC.
$99,322
Higher than the USMedian household income
That’s higher than the US ($84,780).
44.7%
Higher than the USBachelor’s degree or more
That’s higher than the US (37.4%).
9.4%
Lower than the USLiving in poverty
That’s lower than the US (11.8%). It’s the 7th lowest of the 50 states and DC.
17.9%
1.5× the USBlack, not Hispanic
That’s higher than the US (11.7%).
12.6%
Lower than the USLiving with a disability
That’s lower than the US (13.7%).
2015 to 2025
How Virginia changed in ten years
The state added 497,114 people. It got older, more foreign-born and better educated, and poverty fell 1.8 points.
Population, change since 2015
+5.9% in the state and +6.3% in the US.
Source: ACS 1-year, 2015 to 2025, table A00001.
Show data
| Virginia | United States | |
|---|---|---|
| 2015 | 0.0% | 0.0% |
| 2016 | +0.3% | +0.5% |
| 2017 | +1.0% | +1.3% |
| 2018 | +1.6% | +1.8% |
| 2019 | +1.8% | +2.1% |
| 2021 | +3.1% | +3.3% |
| 2022 | +3.6% | +3.7% |
| 2023 | +4.0% | +4.2% |
| 2024 | +5.1% | +5.8% |
| 2025 | +5.9% | +6.3% |
Embed
Median household income, in 2025 dollars
+9.4% in the state and +10.9% in the US.
Source: ACS 1-year, 2015 to 2025, table A14006.
Show data
| Virginia | United States | |
|---|---|---|
| 2015 | $90,780 | $76,413 |
| 2016 | $92,129 | $77,931 |
| 2017 | $94,719 | $79,891 |
| 2018 | $93,812 | $80,059 |
| 2019 | $97,068 | $83,427 |
| 2021 | $96,993 | $83,521 |
| 2022 | $95,127 | $82,811 |
| 2023 | $95,676 | $82,683 |
| 2024 | $95,176 | $84,339 |
| 2025 | $99,322 | $84,780 |
Embed
Living in poverty
−1.8 points in the state and −3.0 points in the US.
Source: ACS 1-year, 2015 to 2025, table A13004.
Show data
| Virginia | United States | |
|---|---|---|
| 2015 | 11.2% | 14.7% |
| 2016 | 11.0% | 14.0% |
| 2017 | 10.6% | 13.4% |
| 2018 | 10.7% | 13.1% |
| 2019 | 9.9% | 12.3% |
| 2021 | 10.2% | 12.8% |
| 2022 | 10.6% | 12.6% |
| 2023 | 10.2% | 12.5% |
| 2024 | 9.7% | 12.1% |
| 2025 | 9.4% | 11.8% |
Embed
Bachelor’s degree or more
+7.7 points in the state and +6.7 points in the US.
Source: ACS 1-year, 2015 to 2025, table A12001.
Show data
| Virginia | United States | |
|---|---|---|
| 2015 | 37.0% | 30.6% |
| 2016 | 38.1% | 31.3% |
| 2017 | 38.7% | 32.0% |
| 2018 | 39.3% | 32.6% |
| 2019 | 39.6% | 33.1% |
| 2021 | 41.8% | 35.0% |
| 2022 | 42.2% | 35.7% |
| 2023 | 42.4% | 36.2% |
| 2024 | 43.3% | 36.8% |
| 2025 | 44.7% | 37.4% |
Embed
Median gross rent, in 2025 dollars
+10.7% in the state and +18.5% in the US.
Source: ACS 1-year, 2015 to 2025, table A18009.
Show data
| Virginia | United States | |
|---|---|---|
| 2015 | $1,567 | $1,314 |
| 2016 | $1,568 | $1,327 |
| 2017 | $1,561 | $1,340 |
| 2018 | $1,570 | $1,368 |
| 2019 | $1,592 | $1,393 |
| 2021 | $1,595 | $1,427 |
| 2022 | $1,596 | $1,440 |
| 2023 | $1,667 | $1,496 |
| 2024 | $1,701 | $1,537 |
| 2025 | $1,734 | $1,557 |
Embed
Median home value, in 2025 dollars
+19.7% in the state and +39.3% in the US.
Source: ACS 1-year, 2015 to 2025, table A10036.
Show data
| Virginia | United States | |
|---|---|---|
| 2015 | $353,191 | $266,469 |
| 2016 | $357,080 | $277,278 |
| 2017 | $362,009 | $288,124 |
| 2018 | $364,123 | $296,908 |
| 2019 | $366,657 | $305,336 |
| 2021 | $396,057 | $337,116 |
| 2022 | $405,109 | $355,481 |
| 2023 | $407,359 | $361,931 |
| 2024 | $417,023 | $372,685 |
| 2025 | $422,600 | $371,100 |
Embed
ACS 1-year estimates. The dotted stretch of each line spans 2020, when the Census Bureau released no standard 1-year estimates. Dollar values are in 2025 dollars.
| Indicator | 2015 | 2025 | Change |
|---|---|---|---|
| Population | 8,382,993 | 8,880,107 | +5.9% |
| Median age | 37.8 | 39.5 | +1.7 years |
| 65 and over | 14.2% | 18.5% | +4.4 points |
| Born outside the US | 12.2% | 13.9% | +1.8 points |
| Hispanic or Latino | 9.0% | 11.9% | +3.0 points |
| Median household income | $90,780 | $99,322 | +9.4% |
| Living in poverty | 11.2% | 9.4% | −1.8 points |
| Bachelor’s degree or more | 37.0% | 44.7% | +7.7 points |
| Households that rent | 35.0% | 32.1% | −2.9 points |
| Median gross rent | $1,567 | $1,734 | +10.7% |
| Median home value | $353,191 | $422,600 | +19.7% |
2198 census tracts
Virginia, tract by tract
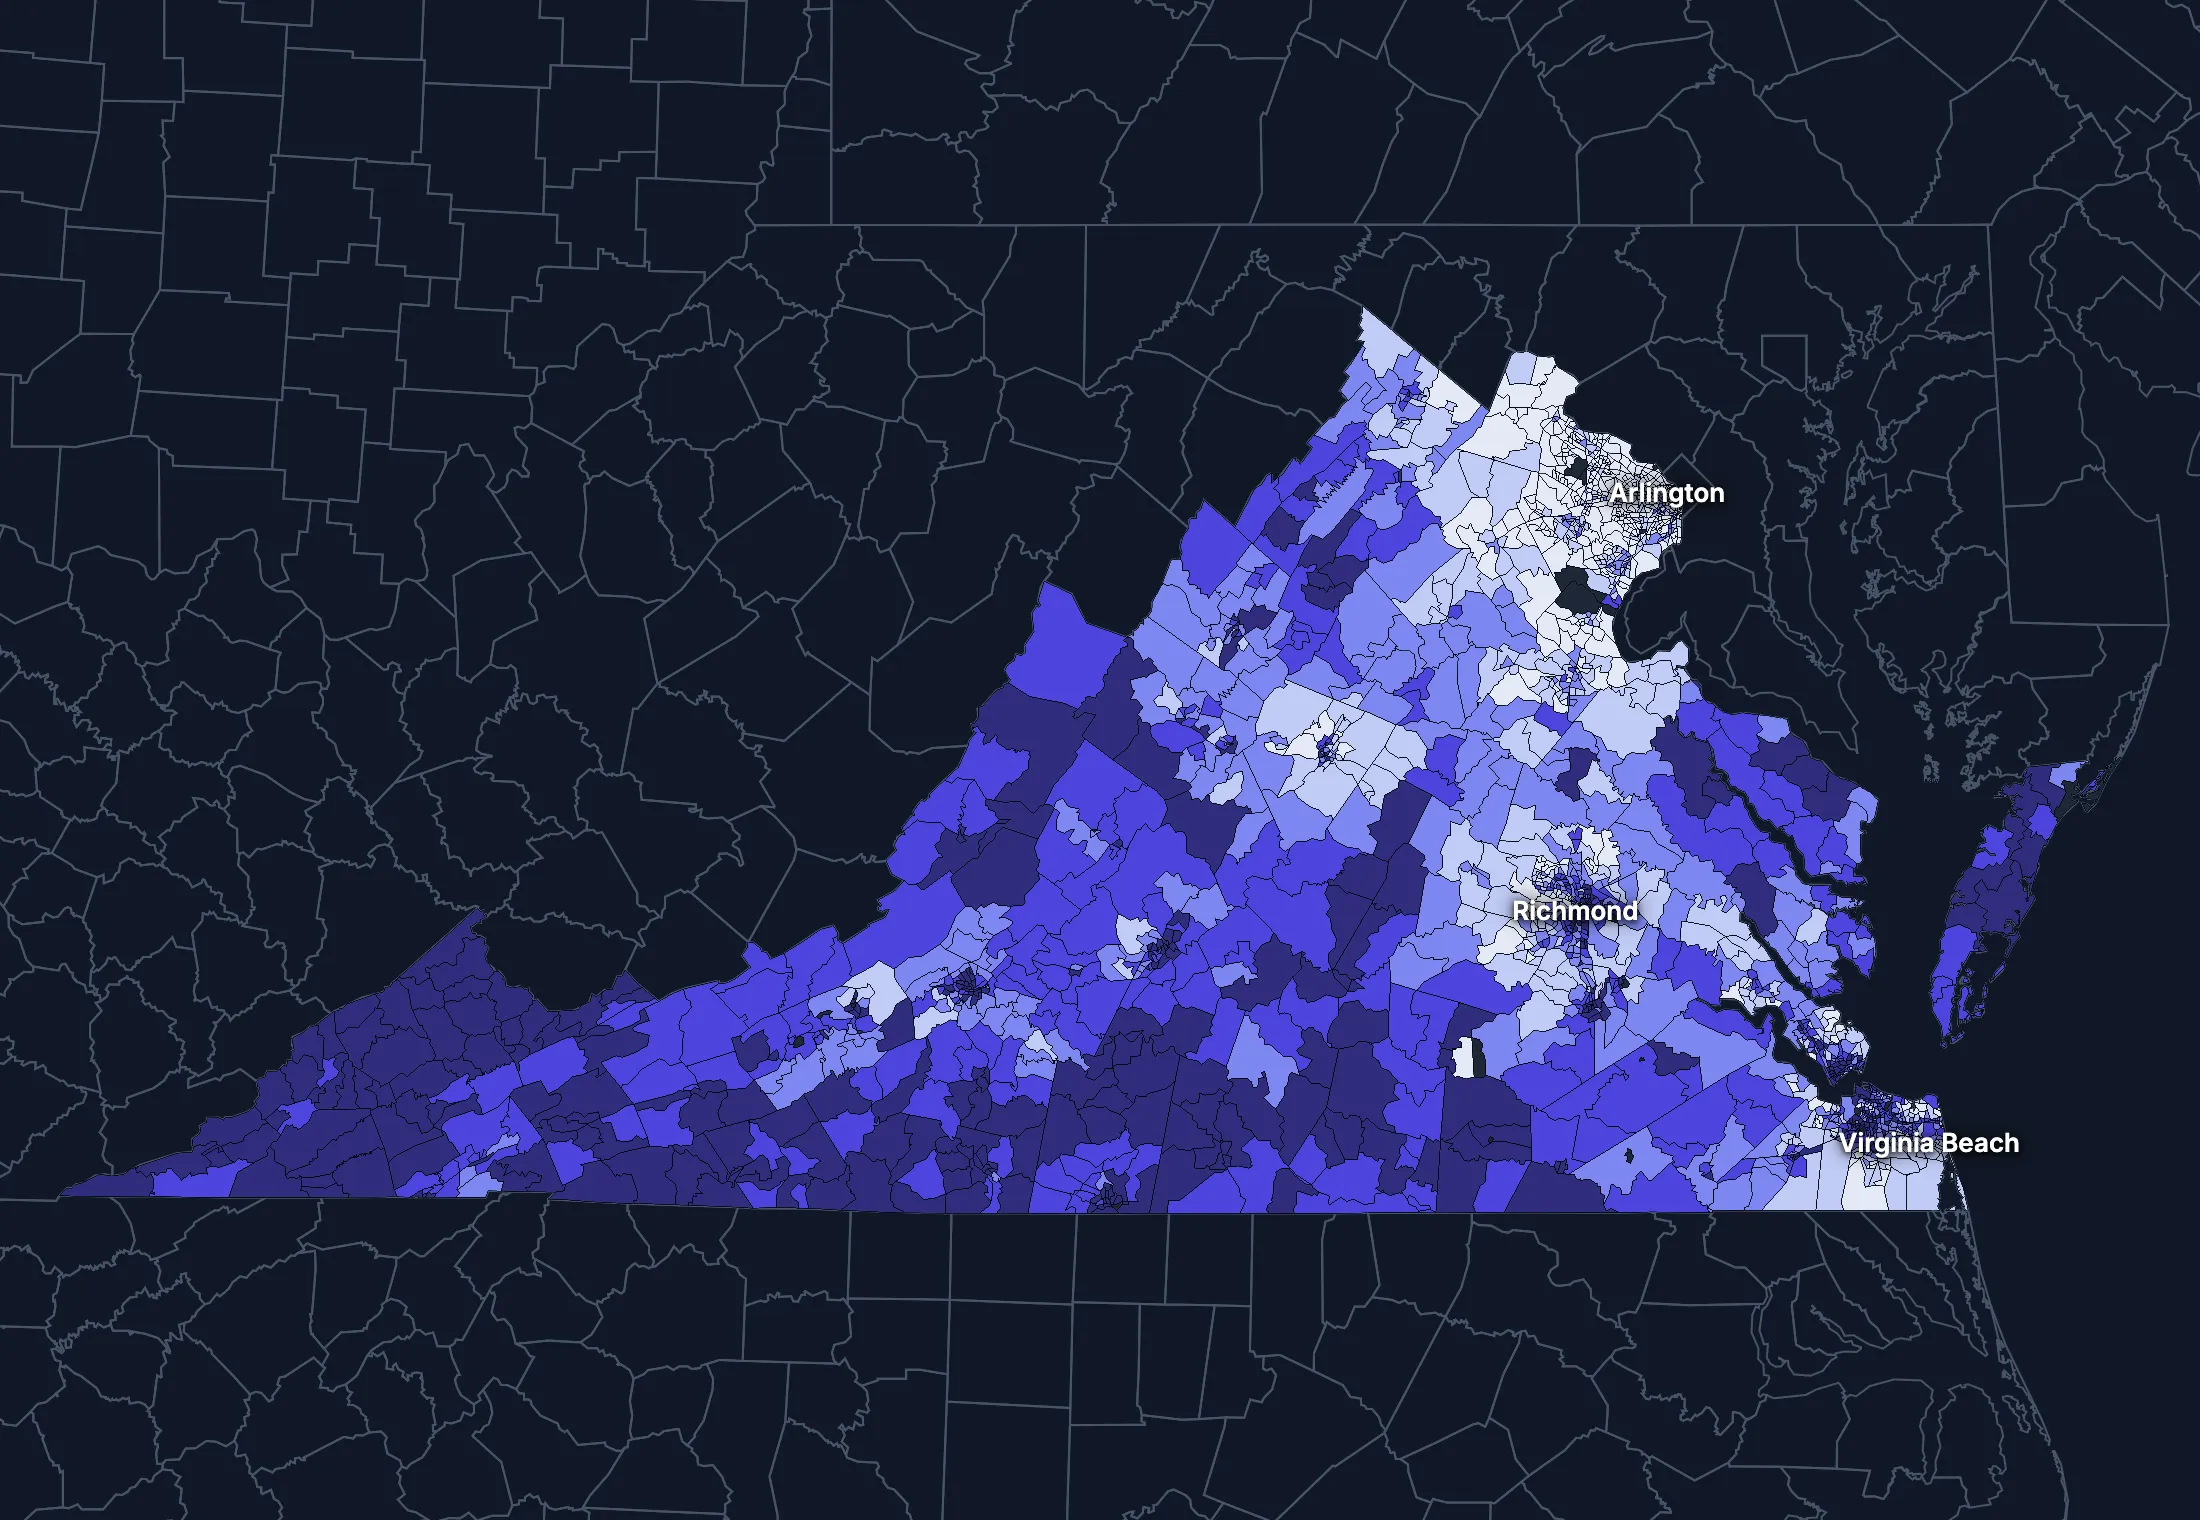
State averages hide a lot. These census tracts are the closest the census comes to neighborhoods.
Where the state’s average misleads
Each tick is one census tract, and the dark line marks the state. Hover over a tick or tap it to see the tract.
Poverty
524 of 2159 tracts are at least 1.5 times the state’s overall 9.9%, and 631 are at two-thirds of it or less.
Highest: Tract 204.01, 79.3%. Lowest: Tract 103.02, 0.0%.
Renters paying 30% or more of income
140 of 2072 tracts are at least 1.5 times the state’s overall 45.3%, and 523 are at two-thirds of it or less.
Highest: Tract 9501.01, 100.0%. Lowest: Tract 401, 0.0%.
Adults with a bachelor’s degree
433 of 2164 tracts are at least 1.5 times the state’s overall 42.2%, and 764 are at two-thirds of it or less.
Highest: Tract 1018.01, 96.1%. Lowest: Tract 8702.02, 1.9%.
Median household income
514 of 2155 tracts are at least 1.5 times the typical tract’s $88,016, and 438 are at two-thirds of it or less.
Highest: Tract 1003, $250,000 or more. Lowest: Tract 42, $11,953.
American Community Survey 2020–2024 5-year estimates, by census tract. Income is capped at $250,000+ by the Census Bureau.
People
Who lives in Virginia
Its median age of 39.5 is about the same as the US (39.5). 13.9% of residents were born outside the US, and 18.5% speak a language other than English at home.
Age
Source: ACS 2025 1-year, table A01001.
Show data
| Virginia | United States | |
|---|---|---|
| Under 18 | 20.8% ±0.2% , number 1,845,189 ±20,100 | 21.0% ±<0.1% , number 71,689,151 ±111,800 |
| 18 to 24 | 9.3% ±0.2% , number 829,505 ±16,420 | 9.3% ±<0.1% , number 31,716,680 ±98,660 |
| 25 to 34 | 13.4% ±0.1% , number 1,192,415 ±11,190 | 13.6% ±<0.1% , number 46,357,354 ±55,690 |
| 35 to 44 | 13.9% ±0.2% , number 1,234,546 ±18,680 | 13.4% ±<0.1% , number 45,746,189 ±105,700 |
| 45 to 54 | 11.8% ±0.1% , number 1,050,666 ±10,380 | 11.8% ±<0.1% , number 40,257,563 ±53,540 |
| 55 to 64 | 12.2% ±0.2% , number 1,082,604 ±16,640 | 12.1% ±<0.1% , number 41,242,904 ±104,700 |
| 65 to 74 | 10.5% ±0.2% , number 936,266 ±14,540 | 10.8% ±<0.1% , number 36,895,650 ±91,520 |
| 75 and over | 8.0% ±0.1% , number 708,916 ±11,460 | 8.2% ±<0.1% , number 27,879,368 ±78,140 |
Embed
Race and ethnicity
Source: ACS 2025 1-year, table A04001.
Show data
| Virginia | United States | |
|---|---|---|
| White, not Hispanic | 56.0% ±0.1% , number 4,976,231 ±7,568 | 55.0% ±<0.1% , number 187,959,031 ±58,340 |
| Hispanic or Latino | 11.9% ±<0.1% , number 1,060,435 ±2,366 | 20.5% ±<0.1% , number 69,975,516 ±13,270 |
| Black, not Hispanic | 17.9% ±0.2% , number 1,586,836 ±15,280 | 11.7% ±<0.1% , number 40,096,453 ±106,200 |
| Asian, not Hispanic | 7.6% ±0.1% , number 677,448 ±11,660 | 6.5% ±<0.1% , number 22,096,709 ±58,340 |
| Other or multiracial | 6.5% ±0.2% , number 579,157 ±20,130 | 6.3% ±<0.1% , number 21,657,150 ±150,100 |
Embed
Language spoken at home
Source: ACS 2025 1-year, table C16001.
Show data
| Virginia | United States | |
|---|---|---|
| English only | 81.5% ±0.3% , number 6,859,216 ±27,040 | 77.1% ±0.1% , number 249,390,588 ±275,300 |
| Spanish | 8.2% ±0.2% , number 685,932 ±18,020 | 13.9% ±0.1% , number 44,921,985 ±177,800 |
| Other Indo-European | 4.4% ±0.2% , number 366,903 ±16,830 | 4.0% ±<0.1% , number 12,862,980 ±113,500 |
| Asian and Pacific Island | 4.0% ±0.2% , number 337,254 ±16,690 | 3.8% ±<0.1% , number 12,288,841 ±99,740 |
| Arabic and other | 1.9% ±0.2% , number 162,896 ±12,680 | 1.3% ±<0.1% , number 4,116,949 ±71,480 |
Embed
Marital status
Source: ACS 2025 1-year, table A11001.
Show data
| Virginia | United States | |
|---|---|---|
| Now married | 50.1% ±0.4% , number 3,692,037 ±28,360 | 47.9% ±0.1% , number 135,567,564 ±223,300 |
| Never married | 33.2% ±0.3% , number 2,449,108 ±22,180 | 34.8% ±0.1% , number 98,647,238 ±152,600 |
| Divorced | 9.5% ±0.2% , number 701,922 ±15,050 | 10.2% ±<0.1% , number 28,879,967 ±112,900 |
| Widowed | 5.4% ±0.2% , number 397,366 ±11,150 | 5.5% ±<0.1% , number 15,599,094 ±69,430 |
| Separated | 1.8% ±0.1% , number 129,226 ±7,981 | 1.6% ±<0.1% , number 4,441,399 ±49,160 |
Embed
Where people lived a year ago
Source: ACS 2025 1-year, table A08001.
Show data
| Virginia | United States | |
|---|---|---|
| Same home | 87.5% ±0.4% , number 7,687,973 ±35,950 | 88.4% ±0.1% , number 298,889,697 ±214,800 |
| Same county | 4.1% ±0.2% , number 357,197 ±21,590 | 6.0% ±<0.1% , number 20,202,671 ±166,300 |
| Another county in the state | 4.5% ±0.2% , number 390,932 ±21,350 | 3.0% ±<0.1% , number 10,168,097 ±89,190 |
| Another state | 3.2% ±0.2% , number 278,173 ±15,380 | 2.1% ±<0.1% , number 7,025,589 ±81,660 |
| Another country | 0.8% ±0.1% , number 70,446 ±8,864 | 0.6% ±<0.1% , number 1,984,943 ±47,210 |
Embed
Top countries of birth, among those born abroad
Source: ACS 2025 1-year, table A07001.
Show data
| Virginia | |
|---|---|
| India | 9.5% , number 117,812 |
| El Salvador | 9.1% , number 112,470 |
| Philippines | 4.7% , number 58,540 |
| Mexico | 4.7% , number 58,115 |
| Korea | 4.1% , number 50,576 |
| China, Excluding Hong Kong and Taiwan | 3.9% , number 48,290 |
Embed
All the numbers
| Indicator | Virginia | US | Rank among states* | Table |
|---|---|---|---|---|
| Population | 8,880,107 | 341,784,859 | 12th | A00001 |
| People per square mile | 225 | 97 | 16th | A00002 |
| Land area (square miles) | 39,481 | – | – | A00002 |
| Median age | 39.5 ±0.2 | 39.5 ±0.1 | 27th | A01004 |
| Under 18 | 20.8% ±0.2% , number 1,845,189 ±20,100 | 21.0% ±<0.1% , number 71,689,151 ±111,800 | 30th | B02002 |
| 65 and over | 18.5% ±0.2% , number 1,645,182 ±18,510 | 19.0% ±<0.1% , number 64,775,018 ±120,300 | 40th | B02002 |
| Born outside the US | 13.9% ±0.2% , number 1,238,730 ±22,080 | 14.7% ±0.1% , number 50,409,320 ±204,800 | 15th | A06001 |
| Speak a language other than English at home | 18.5% ±0.3% , number 1,552,985 ±32,360 | 22.9% ±0.1% , number 74,190,755 ±244,000 | 17th | C16001 |
| Veterans (adults) | 9.0% ±0.2% , number 623,047 ±12,320 | 5.9% ±<0.1% , number 15,746,228 ±85,320 | 2nd | A16002 |
| Living with a disability | 12.6% ±0.2% , number 1,088,103 ±18,650 | 13.7% ±<0.1% , number 46,271,455 ±126,000 | 37th | B18101 |
| Women 15–50 who had a baby in the past year | 5.0% ±0.4% , number 104,577 ±8,187 | 5.0% ±0.1% , number 4,016,759 ±44,040 | 34th | B13002 |
| Lived in the same home a year ago | 87.5% ±0.4% , number 7,687,973 ±35,950 | 88.4% ±0.1% , number 298,889,697 ±214,800 | 34th | A08001 |
| White, not Hispanic | 56.0% ±0.1% , number 4,976,231 ±7,568 | 55.0% ±<0.1% , number 187,959,031 ±58,340 | 34th | A04001 |
| Hispanic or Latino | 11.9% ±<0.1% , number 1,060,435 ±2,366 | 20.5% ±<0.1% , number 69,975,516 ±13,270 | 25th | A04001 |
| Black, not Hispanic | 17.9% ±0.2% , number 1,586,836 ±15,280 | 11.7% ±<0.1% , number 40,096,453 ±106,200 | 10th | A04001 |
| Asian, not Hispanic | 7.6% ±0.1% , number 677,448 ±11,660 | 6.5% ±<0.1% , number 22,096,709 ±58,340 | 8th | A04001 |
*1 is the highest. Population is ranked among all states, and the rest among those of 1,000 people or more, whose figures can be ranked. Ranks use 5-year estimates, the only ones covering every state, so they can differ slightly from the figures here.
Income and work
Higher incomes than the US
The median household income is $99,322, higher than the US ($84,780). 9.4% of people live in poverty, and 6.9% have no health insurance, lower than the US (8.4%).
Household income
Source: ACS 2025 1-year, table A14001.
Show data
| Virginia | United States | |
|---|---|---|
| Under $25,000 | 11.7% ±0.4% , number 406,944 ±12,870 | 14.0% ±0.1% , number 18,727,548 ±88,990 |
| $25,000 to $49,999 | 12.8% ±0.4% , number 446,034 ±14,030 | 15.4% ±0.1% , number 20,665,585 ±101,400 |
| $50,000 to $74,999 | 13.9% ±0.4% , number 484,453 ±12,940 | 15.3% ±0.1% , number 20,513,565 ±88,500 |
| $75,000 to $99,999 | 11.8% ±0.3% , number 411,708 ±12,100 | 12.5% ±0.1% , number 16,814,245 ±87,520 |
| $100,000 to $149,999 | 18.5% ±0.4% , number 643,029 ±14,510 | 17.9% ±0.1% , number 24,018,984 ±99,670 |
| $150,000 to $199,999 | 11.5% ±0.3% , number 398,495 ±10,570 | 10.1% ±0.1% , number 13,521,827 ±70,660 |
| $200,000 or more | 19.8% ±0.4% , number 689,556 ±12,670 | 14.8% ±0.1% , number 19,801,668 ±84,120 |
Embed
What residents do for work
Source: ACS 2025 1-year, table A17004.
Show data
| Virginia | United States | |
|---|---|---|
| Education and health care | 23.5% ±0.4% , number 1,041,721 ±17,050 | 24.4% ±0.1% , number 40,862,193 ±140,800 |
| Professional and business services | 16.4% ±0.4% , number 727,657 ±16,600 | 12.8% ±0.1% , number 21,375,231 ±87,110 |
| Public administration | 9.4% ±0.3% , number 416,400 ±13,300 | 4.7% ±<0.1% , number 7,944,601 ±69,540 |
| Retail trade | 9.4% ±0.3% , number 414,666 ±15,030 | 10.6% ±0.1% , number 17,781,181 ±96,660 |
| Arts, food and lodging | 8.2% ±0.3% , number 364,121 ±14,100 | 8.9% ±0.1% , number 14,811,502 ±87,840 |
| Manufacturing | 6.7% ±0.2% , number 298,254 ±9,470 | 9.6% ±0.1% , number 16,064,394 ±91,270 |
| Construction | 6.6% ±0.3% , number 290,608 ±12,570 | 6.7% ±<0.1% , number 11,254,981 ±79,620 |
| Finance, insurance and real estate | 6.6% ±0.3% , number 290,469 ±12,040 | 6.6% ±<0.1% , number 11,025,569 ±68,570 |
Embed
Where workers come from and go
Virginia has 3,894,892 jobs and 3,924,600 employed residents. 346,247 people commute in to work and 375,955 commute out, while 3,548,645 both live and work here. The most commuters come from Maryland.
Most commuters come from
- Maryland: 147,012
- West Virginia: 46,698
- North Carolina: 46,168
Most residents commute to
- District of Columbia: 166,338
- Maryland: 97,904
- North Carolina: 35,115
Show data
| Virginia | |
|---|---|
| Live and work here | 3,548,645 |
| Work here, live elsewhere | 346,247 |
| Live here, work elsewhere | 375,955 |
Embed
All the numbers
| Indicator | Virginia | US | Rank among states* | Table |
|---|---|---|---|---|
| Median household income | $99,322 ±$1,105 | $84,780 ±$215 | 12th | A14006 |
| Income per person | $53,931 ±$521 | $47,171 ±$115 | 10th | A14024 |
| Income inequality (Gini index) | 0.469 ±0.003 | 0.482 ±0.001 | 21st | A14028 |
| Living in poverty | 9.4% ±0.4% , number 812,739 ±30,900 | 11.8% ±0.1% , number 39,264,183 ±277,400 | 45th | A13004 |
| Unemployment rate | 4.1% ±0.2% , number 189,598 ±8,097 | 4.9% ±<0.1% , number 8,574,594 ±64,350 | 36th | A17005 |
| No health insurance | 6.9% ±0.2% , number 595,652 ±19,990 | 8.4% ±<0.1% , number 28,323,306 ±152,000 | 27th | A20001 |
*1 is the highest. Population is ranked among all states, and the rest among those of 1,000 people or more, whose figures can be ranked. Ranks use 5-year estimates, the only ones covering every state, so they can differ slightly from the figures here.
Education
More college degrees than the US
44.7% of adults 25 and over have a bachelor’s degree or more, higher than the US (37.4%).
Highest level of education
Source: ACS 2025 1-year, table A12001.
Show data
| Virginia | United States | |
|---|---|---|
| Less than high school | 7.4% ±0.2% , number 460,098 ±14,410 | 9.4% ±0.1% , number 22,321,002 ±120,500 |
| High school only | 22.5% ±0.4% , number 1,393,718 ±24,150 | 25.6% ±0.1% , number 61,096,726 ±203,400 |
| Some college | 25.4% ±0.4% , number 1,577,264 ±23,650 | 27.7% ±0.1% , number 65,920,977 ±173,500 |
| Bachelor’s degree | 24.6% ±0.4% , number 1,525,604 ±22,700 | 22.3% ±0.1% , number 53,224,312 ±196,700 |
| Graduate degree | 20.1% ±0.3% , number 1,248,729 ±19,300 | 15.0% ±0.1% , number 35,816,011 ±159,400 |
Embed
All the numbers
| Indicator | Virginia | US | Rank among states* | Table |
|---|---|---|---|---|
| Bachelor’s degree or more | 44.7% ±0.5% , number 2,774,333 ±29,800 | 37.4% ±0.1% , number 89,040,323 ±253,200 | 8th | A12001 |
| High school graduate or more | 92.6% ±0.7% , number 5,745,315 ±45,060 | 90.6% ±0.2% , number 216,058,026 ±368,200 | 26th | A12001 |
*1 is the highest. Population is ranked among all states, and the rest among those of 1,000 people or more, whose figures can be ranked. Ranks use 5-year estimates, the only ones covering every state, so they can differ slightly from the figures here.
Housing
Home values outran incomes
32.1% of households rent, lower than the US (34.7%). The median home is worth $422,600 and the median rent is $1,734. After inflation, home values rose 20% from 2015 to 2025, while household income rose 9%.
Housing costs and income, 2015 to 2025, after inflation
Source: ACS 1-year, table A10036, A18009, A14006.
Show data
| Virginia | United States | |
|---|---|---|
| Median home value | +19.7% | +39.3% |
| Median rent | +10.7% | +18.5% |
| Median household income | +9.4% | +10.9% |
Embed
Types of homes
Source: ACS 2025 1-year, table A10032.
Show data
| Virginia | United States | |
|---|---|---|
| Single-family, detached | 60.5% ±0.5% , number 2,287,854 ±18,820 | 60.9% ±0.1% , number 90,335,844 ±173,300 |
| Single-family, attached | 11.4% ±0.3% , number 431,165 ±12,560 | 6.4% ±<0.1% , number 9,527,703 ±51,230 |
| 2 to 4 units | 4.5% ±0.3% , number 169,664 ±9,722 | 7.5% ±0.1% , number 11,109,005 ±75,790 |
| 5 to 19 units | 9.7% ±0.3% , number 366,330 ±11,850 | 8.7% ±0.1% , number 12,829,882 ±97,590 |
| 20 or more units | 9.6% ±0.3% , number 363,374 ±11,260 | 11.1% ±0.1% , number 16,381,450 ±92,310 |
| Mobile homes and other | 4.3% ±0.2% , number 160,920 ±8,508 | 5.4% ±<0.1% , number 8,045,083 ±53,680 |
Embed
When homes were built
Source: ACS 2025 1-year, table A10055.
Show data
| Virginia | United States | |
|---|---|---|
| 2010 or later | 15.4% ±0.4% , number 534,403 ±14,710 | 15.1% ±0.1% , number 20,257,912 ±101,300 |
| 2000 to 2009 | 14.9% ±0.4% , number 518,610 ±12,910 | 13.8% ±0.1% , number 18,535,840 ±92,260 |
| 1980 to 1999 | 28.7% ±0.5% , number 998,990 ±17,380 | 24.1% ±0.1% , number 32,332,570 ±118,900 |
| 1960 to 1979 | 23.6% ±0.5% , number 819,998 ±16,130 | 22.9% ±0.1% , number 30,726,302 ±110,000 |
| Before 1960 | 17.5% ±0.4% , number 608,218 ±14,040 | 24.0% ±0.1% , number 32,210,798 ±121,500 |
Embed
All the numbers
| Indicator | Virginia | US | Rank among states* | Table |
|---|---|---|---|---|
| Housing units | 3,779,307 | – | – | A10001 |
| Households | 3,480,219 ±10,200 | – | – | A10008 |
| People per household | 2.48 ±0.01 | 2.49 ±0.01 | 12th | A10003 |
| Households that rent | 32.1% ±0.5% , number 1,117,312 ±17,880 | 34.7% ±0.1% , number 46,551,688 ±193,200 | 25th | A10060 |
| Vacant homes | 7.9% ±0.3% , number 299,088 ±10,480 | 9.6% ±0.1% , number 14,165,545 ±137,100 | 38th | A10047, A10060 |
| Median gross rent | $1,734 ±$20 | $1,557 ±$4 | 12th | A18009 |
| Median home value | $422,600 ±$3,315 | $371,100 ±$646 | 17th | A10036 |
| Renters paying 30% or more of income | 47.1% ±1.2% , number 526,562 ±16,240 | 48.3% ±0.2% , number 22,486,693 ±122,100 | 23rd | A18002 |
| Owners paying 30% or more of income | 22.0% ±0.5% , number 519,397 ±13,560 | 24.2% ±0.1% , number 21,201,943 ±93,050 | 27th | A10040 |
| Homes built before 1960 | 17.5% ±0.4% , number 608,218 ±14,040 | 24.0% ±0.1% , number 32,210,798 ±121,500 | 33rd | A10055 |
*1 is the highest. Population is ranked among all states, and the rest among those of 1,000 people or more, whose figures can be ranked. Ranks use 5-year estimates, the only ones covering every state, so they can differ slightly from the figures here.
Getting around
A driving state
70.6% of workers drive alone and 13.9% work from home. 41.0% of those who travel to work spend 30 minutes or more getting there, and 6.2% of households have no vehicle.
How people get to work
Source: ACS 2025 1-year, table A09005.
Show data
| Virginia | United States | |
|---|---|---|
| Drive alone | 70.6% ±0.4% , number 3,167,870 ±23,840 | 69.8% ±0.1% , number 115,297,377 ±192,900 |
| Carpool | 8.1% ±0.3% , number 361,903 ±15,270 | 8.9% ±0.1% , number 14,712,170 ±97,240 |
| Public transit | 3.8% ±0.2% , number 169,682 ±8,681 | 4.3% ±<0.1% , number 7,100,386 ±63,330 |
| Walk | 2.3% ±0.1% , number 101,683 ±6,544 | 2.4% ±<0.1% , number 4,016,469 ±41,070 |
| Work from home | 13.9% ±0.3% , number 624,173 ±15,170 | 12.9% ±0.1% , number 21,288,393 ±105,700 |
| Other | 1.3% ±0.1% , number 60,540 ±5,407 | 1.7% ±<0.1% , number 2,799,658 ±41,510 |
Embed
Time spent getting to work
Source: ACS 2025 1-year, table B09001.
Show data
| Virginia | United States | |
|---|---|---|
| Under 10 minutes | 10.1% ±0.3% , number 391,880 ±11,600 | 12.0% ±0.1% , number 17,199,225 ±93,440 |
| 10 to 19 minutes | 26.9% ±0.5% , number 1,037,218 ±20,480 | 27.8% ±0.1% , number 40,059,540 ±137,700 |
| 20 to 29 minutes | 22.0% ±0.5% , number 850,237 ±19,720 | 21.0% ±0.1% , number 30,221,743 ±111,100 |
| 30 to 39 minutes | 17.3% ±0.4% , number 667,061 ±16,600 | 17.1% ±0.1% , number 24,659,138 ±103,800 |
| 40 to 59 minutes | 14.1% ±0.4% , number 544,458 ±15,030 | 12.6% ±0.1% , number 18,104,709 ±97,070 |
| 60 minutes or more | 9.6% ±0.3% , number 370,824 ±13,070 | 9.5% ±0.1% , number 13,681,705 ±84,440 |
Embed
Vehicles per household
Source: ACS 2025 1-year, table A10030.
Show data
| Virginia | United States | |
|---|---|---|
| None | 6.2% ±0.3% , number 214,831 ±9,029 | 8.8% ±0.1% , number 11,781,997 ±77,240 |
| One | 31.4% ±0.6% , number 1,093,376 ±19,800 | 33.1% ±0.1% , number 44,424,682 ±160,700 |
| Two | 37.0% ±0.5% , number 1,288,019 ±18,990 | 36.0% ±0.1% , number 48,200,889 ±176,800 |
| Three or more | 25.4% ±0.5% , number 883,993 ±15,980 | 22.1% ±0.1% , number 29,655,854 ±113,300 |
Embed
All the numbers
| Indicator | Virginia | US | Rank among states* | Table |
|---|---|---|---|---|
| Drive to work alone | 70.6% ±0.4% , number 3,167,870 ±23,840 | 69.8% ±0.1% , number 115,297,377 ±192,900 | 37th | A09005 |
| Take public transit | 3.8% ±0.2% , number 169,682 ±8,681 | 4.3% ±<0.1% , number 7,100,386 ±63,330 | 12th | A09005 |
| Work from home | 13.9% ±0.3% , number 624,173 ±15,170 | 12.9% ±0.1% , number 21,288,393 ±105,700 | 8th | A09005 |
| Commute 30 minutes or more | 41.0% ±0.6% , number 1,582,343 ±25,920 | 39.2% ±0.1% , number 56,445,552 ±165,300 | 11th | B09001 |
| Households with no vehicle | 6.2% ±0.2% , number 214,831 ±8,420 | 8.8% ±<0.1% , number 11,781,997 ±64,240 | 29th | A10030 |
*1 is the highest. Population is ranked among all states, and the rest among those of 1,000 people or more, whose figures can be ranked. Ranks use 5-year estimates, the only ones covering every state, so they can differ slightly from the figures here.
Places
The largest cities in Virginia
Population, from the latest estimates available. Figures cover the whole of each place.
Largest places
- Virginia Beach: 453,737
- Chesapeake: 255,332
- Arlington: 243,931
- Richmond: 237,257
- Norfolk: 231,013
- Newport News: 183,230
- Alexandria: 160,662
- Hampton: 137,315
States like this one
- Illinois: 12,694,798
- Washington: 7,816,116
- Maryland: 6,206,011
- Connecticut: 3,624,508
States at least a third this size, with the closest income, education, age, housing and origins.
Every county and place in Virginia
Find any county, city, town, metro area, ZIP code, school district or district in Virginia.
Counties and equivalents
Each of the 133 counties and equivalents with its population, from ACS 2020–2024 5-year estimates.
- Accomack County33,335
- Albemarle County114,919
- Alexandria city156,976
- Alleghany County14,859
- Amelia County13,462
- Amherst County31,485
- Appomattox County16,610
- Arlington County236,254
- Augusta County78,033
- Bath County4,100
- Bedford County80,894
- Bland County6,199
- Botetourt County34,004
- Bristol city16,849
- Brunswick County15,841
- Buchanan County19,415
- Buckingham County16,976
- Buena Vista city6,593
- Campbell County55,312
- Caroline County32,098
- Carroll County29,157
- Charles City County6,627
- Charlotte County11,422
- Charlottesville city45,437
- Chesapeake city252,583
- Chesterfield County377,869
- Clarke County15,216
- Colonial Heights city18,352
- Covington city5,680
- Craig County4,856
- Culpeper County54,397
- Cumberland County9,818
- Danville city42,214
- Dickenson County13,733
- Dinwiddie County28,191
- Emporia city5,547
- Essex County10,623
- Fairfax city25,026
- Fairfax County1.15M
- Falls Church city14,710
- Fauquier County74,577
- Floyd County15,593
- Fluvanna County28,092
- Franklin city8,250
- Franklin County55,130
- Frederick County95,008
- Fredericksburg city28,873
- Galax city6,726
- Giles County16,557
- Gloucester County39,526
- Goochland County26,410
- Grayson County15,287
- Greene County21,155
- Greensville County11,275
- Halifax County33,639
- Hampton city137,557
- Hanover County112,879
- Harrisonburg city51,392
- Henrico County335,744
- Henry County49,980
- Highland County2,296
- Hopewell city22,959
- Isle of Wight County39,974
- James City County81,013
- King and Queen County6,695
- King George County27,896
- King William County18,593
- Lancaster County10,936
- Lee County21,900
- Lexington city7,525
- Loudoun County432,998
- Louisa County39,980
- Lunenburg County12,016
- Lynchburg city79,497
- Madison County14,044
- Manassas city42,976
- Manassas Park city16,798
- Martinsville city13,658
- Mathews County8,540
- Mecklenburg County30,516
- Middlesex County10,847
- Montgomery County99,101
- Nelson County14,732
- New Kent County25,105
- Newport News city184,216
- Norfolk city233,596
- Northampton County12,059
- Northumberland County12,188
- Norton city3,577
- Nottoway County15,597
- Orange County37,822
- Page County23,727
- Patrick County17,512
- Petersburg city33,537
- Pittsylvania County59,856
- Poquoson city12,639
- Portsmouth city97,190
- Powhatan County31,555
- Prince Edward County21,996
- Prince George County43,146
- Prince William County488,880
- Pulaski County33,687
- Radford city16,726
- Rappahannock County7,427
- Richmond city229,359
- Richmond County9,095
- Roanoke city98,355
- Roanoke County97,023
- Rockbridge County22,531
- Rockingham County85,600
- Russell County25,538
- Salem city25,618
- Scott County21,479
- Shenandoah County44,925
- Smyth County29,420
- Southampton County17,964
- Spotsylvania County146,603
- Stafford County163,466
- Staunton city25,948
- Suffolk city98,796
- Surry County6,549
- Sussex County10,765
- Tazewell County39,624
- Virginia Beach city456,349
- Warren County41,531
- Washington County53,926
- Waynesboro city22,841
- Westmoreland County18,826
- Williamsburg city15,798
- Winchester city27,913
- Wise County35,448
- Wythe County28,188
- York County71,005
Cities, towns and other places
Each of the 681 with its population, from ACS 2020–2024 5-year estimates. Census-designated places are communities without a local government of their own, drawn by the Census Bureau so they can be counted.
- Abbs Valley124
- Abingdon8,330
- Accomac948
- Adwolf1,046
- Afton266
- Alberta345
- Aldie163
- Alexandria156,976
- Allison Gap526
- Allisonia40
- Alonzaville296
- Altavista3,342
- Amelia Court House746
- Amherst1,865
- Annandale41,705
- Appalachia1,391
- Apple Mountain Lake1,671
- Appomattox2,084
- Aquia Harbour7,481
- Arcola3,509
- Arlington236,254
- Arrington915
- Ashburn46,026
- Ashland7,772
- Atkins985
- Atlantic342
- Augusta Springs56
- Bailey's Crossroads24,271
- Barboursville694
- Baskerville178
- Bassett1,031
- Bastian374
- Basye1,481
- Bayside21
- Baywood681
- Bealeton5,034
- Bedford7,724
- Belle Haven CDP6,570
- Belle Haven town836
- Bellwood7,907
- Belmont9,729
- Belmont Estates1,162
- Belspring152
- Belview990
- Benns Church1,813
- Bensley5,949
- Berryville4,707
- Bethel Manor4,393
- Big Island91
- Big Rock384
- Big Stone Gap5,162
- Big Stone Gap East567
- Blacksburg45,446
- Blackstone3,341
- Blairs1,062
- Bland564
- Bloxom571
- Blue Ridge2,800
- Blue Ridge Shores918
- Bluefield4,979
- Bobtown141
- Boissevain830
- Bon Air16,904
- Boones Mill228
- Boston96
- Boswell's Corner1,239
- Bowling Green1,561
- Bowmans Crossing420
- Boyce891
- Boydton269
- Boykins631
- Bracey1,242
- Braddock6,536
- Brambleton24,537
- Branchville146
- Brandermill13,730
- Brandy Station237
- Breaks208
- Bridgewater6,708
- Brightwood1,325
- Bristol16,849
- Broadlands14,353
- Broadway4,273
- Brodnax414
- Brookneal1,300
- Brucetown250
- Buchanan1,367
- Buckhall21,602
- Buckingham Courthouse227
- Buena Vista6,593
- Bull Run (Fairfax County)7,823
- Bull Run (Prince William County)16,859
- Bull Run Mountain Estates1,827
- Burke44,029
- Burke Centre17,037
- Burkeville488
- Callaghan198
- Calverton26
- Camp Barrett1,681
- Camptown834
- Cana964
- Cape Charles1,201
- Capron148
- Captains Cove1,542
- Carrollton8,436
- Carrsville363
- Cascades12,357
- Castlewood1,357
- Catlett290
- Cats Bridge200
- Cave Spring25,742
- Cedar Bluff1,167
- Central Garage1,864
- Centreville71,706
- Chamberlayne4,692
- Chantilly24,036
- Charles City64
- Charlotte Court House673
- Charlottesville45,437
- Chase City2,470
- Chase Crossing372
- Chatham1,448
- Chatmoss1,563
- Cheriton555
- Cherry Hill26,044
- Chesapeake252,583
- Chester24,474
- Chester Gap726
- Chilhowie2,428
- Chincoteague3,296
- Christiansburg22,720
- Churchville132
- Claremont393
- Clarksville1,547
- Claypool Hill1,610
- Cleveland369
- Clifton312
- Clifton Forge3,447
- Cliftondale Park86
- Clinchco268
- Clinchport44
- Clintwood1,400
- Clover696
- Cloverdale3,208
- Cluster Springs859
- Coeburn1,639
- Collinsville7,139
- Colonial Beach3,966
- Colonial Heights18,352
- Columbia Furnace307
- Concord1,462
- Conicville446
- Countryside9,661
- County Center3,789
- Courtland1,579
- Covington5,680
- Craigsville1,104
- Crewe2,906
- Crimora1,252
- Crosspointe5,669
- Crozet9,289
- Culpeper20,794
- Cumberland273
- Dahlgren3,350
- Dahlgren Center765
- Dale City71,016
- Daleville3,797
- Damascus772
- Dante591
- Danville42,214
- Dayton1,920
- Deep Creek95
- Deerfield439
- Deltaville958
- Dendron303
- Difficult Run9,938
- Dillwyn459
- Dinwiddie589
- Disputanta609
- Dooms1,454
- Doran37
- Drakes Branch435
- Dranesville11,828
- Draper348
- Dryden823
- Dublin2,671
- Duffield78
- Dulles Town Center5,464
- Dumbarton7,997
- Dumfries5,816
- Dunbar115
- Dungannon316
- Dunn Loring8,957
- Eagle Rock67
- Earlysville1,222
- East Highland Park15,265
- East Lexington1,652
- East Stone Gap683
- Eastville254
- Ebony95
- Edinburg1,671
- Eggleston117
- Elkton3,006
- Elliston952
- Emory1,419
- Emporia5,547
- Enon4,137
- Esmont751
- Ettrick5,910
- Ewing365
- Exmore1,571
- Fair Lakes8,894
- Fair Oaks35,545
- Fairfax25,026
- Fairfax Station12,566
- Fairfield566
- Fairlawn2,488
- Fairview240
- Fairview Beach180
- Falls Church14,710
- Falls Mills96
- Falmouth5,216
- Fancy Gap214
- Farmville7,774
- Ferrum1,774
- Fieldale783
- Fincastle858
- Fishersville9,484
- Flint Hill275
- Floris7,589
- Floyd479
- Forest13,430
- Forestville35
- Fort Belvoir8,449
- Fort Chiswell821
- Fort Hunt16,700
- Fort Lee8,993
- Franconia18,335
- Franklin8,250
- Franklin Farm18,736
- Franktown12
- Fredericksburg28,873
- Free Union124
- Fries330
- Front Royal15,296
- Gainesville18,196
- Galax6,726
- Gargatha564
- Gasburg485
- Gate City1,928
- George Mason9,937
- Glade Spring2,135
- Glasgow1,330
- Glen Allen17,551
- Glen Lyn68
- Glen Wilton66
- Glenvar829
- Gloucester Courthouse3,336
- Gloucester Point11,109
- Goochland1,182
- Goose Creek Village2,461
- Gordonsville1,459
- Gore86
- Goshen271
- Gratton841
- Great Falls15,228
- Great Falls Crossing1,414
- Greenbackville86
- Greenbriar8,243
- Greenbush337
- Greenville1,183
- Gretna1,452
- Grottoes2,961
- Groveton13,931
- Grundy872
- Gwynn514
- Halifax1,496
- Hallwood160
- Hamilton589
- Hampden-Sydney1,769
- Hampton137,557
- Hanover33
- Harborton92
- Harrisonburg51,392
- Harriston1,212
- Hayfield4,392
- Haymarket1,580
- Haysi519
- Heathsville98
- Henry Fork805
- Herndon24,672
- Highland Springs14,296
- Hillsboro141
- Hillsville2,864
- Hilltown302
- Hiltons217
- Hiwassee72
- Hollins17,097
- Hollymead8,482
- Honaker1,188
- Hopewell22,959
- Horntown466
- Horse Pasture2,236
- Hot Springs487
- Hudson Crossroads6
- Huntington13,502
- Hurt1,361
- Hutchison7,284
- Hybla Valley17,257
- Idylwood17,559
- Independence1,132
- Independent Hill10,853
- Innovation1,034
- Innsbrook8,578
- Iron Gate426
- Irvington513
- Ivanhoe540
- Ivor301
- Ivy794
- Jarratt989
- Jewell Ridge45
- Jolivue1,075
- Jonesville1,308
- Keezletown706
- Keller288
- Kenbridge1,432
- Keokee174
- Keswick402
- Keysville988
- Kilmarnock1,333
- Kincora1,008
- King and Queen Court House43
- King George4,851
- King William85
- Kings Park4,315
- Kings Park West13,442
- Kingstowne18,360
- La Crosse550
- Lafayette628
- Lake Barcroft10,973
- Lake Caroline2,862
- Lake Holiday2,193
- Lake Land'Or4,390
- Lake Monticello10,662
- Lake of the Woods7,984
- Lake Ridge46,049
- Lake Wilderness3,139
- Lakeside12,654
- Lancaster20
- Lansdowne12,328
- Laurel18,721
- Laurel Hill7,450
- Laurel Park553
- Lawrenceville1,272
- Laymantown1,626
- Lebanon3,116
- Lebanon Church63
- Lee Mont79
- Leesburg49,171
- Leesylvania21,632
- Lexington7,525
- Lincolnia20,320
- Linton Hall41,876
- Linville484
- Loch Lomond4,606
- Locust Grove67
- Locust Mount95
- Long Branch7,034
- Lorton20,991
- Loudoun Valley Estates10,271
- Louisa2,435
- Lovettsville2,719
- Lovingston455
- Low Moor430
- Lowes Island11,018
- Lunenburg42
- Luray4,827
- Lynchburg79,497
- Lyndhurst1,309
- Madison273
- Madison Heights10,266
- Makemie Park150
- Mallow537
- Manassas42,976
- Manassas Park16,798
- Manchester12,445
- Mantua8,298
- Mappsburg103
- Mappsville186
- Marion5,670
- Marshall3,219
- Martinsville13,658
- Mason Neck2,039
- Massanetta Springs6,358
- Massanutten2,261
- Mathews941
- Matoaca2,724
- Maurertown1,092
- Max Meadows599
- McDowell58
- McGaheysville1,327
- McKenney518
- McLean49,627
- McMullin324
- McNair22,655
- Meadowbrook20,749
- Meadows of Dan134
- Meadowview871
- Mechanicsburg52
- Mechanicsville38,683
- Melfa468
- Mendota262
- Merrifield20,698
- Merrimac2,733
- Metompkin447
- Middlebrook241
- Middleburg774
- Middletown1,786
- Midland122
- Midlothian19,120
- Millboro108
- Mineral555
- Modest Town265
- Moneta395
- Montclair22,387
- Monterey197
- Montrose8,285
- Montross375
- Montvale351
- Moorefield6,123
- Motley987
- Mount Clifton170
- Mount Crawford532
- Mount Hermon4,155
- Mount Jackson2,000
- Mount Olive58
- Mount Sidney703
- Mount Vernon13,122
- Mountain Road1,574
- Narrows1,935
- Nassawadox590
- Nathalie24
- Navy3,839
- Nellysford1,584
- Nelsonia608
- New Baltimore11,919
- New Castle138
- New Church443
- New Hope900
- New Kent801
- New Market2,342
- New River268
- Newington13,478
- Newington Forest12,316
- Newport News184,216
- Newsoms289
- Nickelsville368
- Nokesville1,226
- Norfolk233,596
- North Garden475
- North Shore3,638
- North Springfield7,050
- Norton3,577
- Nottoway Court House69
- Oak Grove2,408
- Oak Hall86
- Oak Level563
- Oakton36,528
- Occoquan910
- Onancock1,433
- One Loudoun3,309
- Onley678
- Opal984
- Orange5,066
- Osaka74
- Painter305
- Palmyra171
- Pamplin City275
- Pantops4,665
- Paris63
- Parksley867
- Parrott401
- Passapatanzy1,259
- Pastoria863
- Patrick Springs2,223
- Pearisburg2,860
- Pembroke996
- Penhook1,250
- Pennington Gap1,798
- Petersburg33,537
- Phenix418
- Pimmit Hills6,589
- Piney Mountain2,288
- Plum Creek1,068
- Pocahontas234
- Poquoson12,639
- Port Republic510
- Port Royal89
- Portsmouth97,190
- Potomac Mills5,741
- Pound913
- Pounding Mill222
- Powhatan667
- Prices Fork900
- Prince George1,829
- Pulaski8,893
- Pungoteague190
- Purcellville8,973
- Quantico578
- Quantico Base5,840
- Quicksburg106
- Quinby198
- Radford16,726
- Raven1,345
- Ravensworth2,475
- Rectortown45
- Remington989
- Reston64,414
- Rhoadesville207
- Rich Creek776
- Richlands5,171
- Richmond229,359
- Ridgeway1,051
- Riner1,038
- Rio1,252
- Ripplemead294
- Rivanna2,211
- Riverdale1,077
- Riverview607
- Roanoke98,355
- Rockwood10,010
- Rocky Gap7
- Rocky Mount4,950
- Rose Hill (Fairfax County)21,066
- Rose Hill (Lee County)447
- Round Hill678
- Ruckersville1,399
- Rural Retreat1,644
- Rushmere1,033
- Rustburg1,417
- Salem25,618
- Saltville2,198
- Saluda615
- Sandston7,399
- Sandy Level407
- Sanford44
- Savage Town175
- Savageville124
- Saxis218
- Schooner Bay223
- Schuyler197
- Scotland161
- Scottsburg51
- Scottsville510
- Sedley568
- Selma146
- Seven Corners9,371
- Seven Mile Ford644
- Shawneeland2,754
- Shawsville1,411
- Shenandoah2,888
- Shenandoah Farms4,179
- Shenandoah Retreat592
- Shenandoah Shores611
- Sherando281
- Shipman472
- Short Pump29,026
- Singers Glen155
- Skyland Estates620
- Smithfield8,834
- Snowville77
- South Boston7,853
- South Hill4,786
- South Riding34,352
- South Run6,600
- Southampton Meadows421
- Southern Gateway2,771
- Southside Chesconessex84
- Sperryville358
- Spotsylvania Courthouse7,180
- Springfield31,154
- Springville841
- St. Charles83
- St. Paul963
- Stafford Courthouse5,839
- Stanardsville740
- Stanley2,034
- Stanleytown1,386
- Staunton25,948
- Stephens City2,393
- Sterling32,411
- Stevens Creek148
- Stewartsville737
- Stickleyville143
- Stone Ridge16,603
- Stonega151
- Stony Creek341
- Strasburg7,214
- Stuart1,952
- Stuarts Draft11,780
- Sudley19,162
- Suffolk98,796
- Sugar Grove563
- Sugarland Run12,629
- Sully Square2,394
- Surry212
- Sussex66
- Tacoma131
- Tangier252
- Tappahannock1,908
- Tasley23
- Tazewell4,390
- Temperanceville115
- Templeton34
- The Plains164
- The University of Virginia's College at Wise489
- Thynedale86
- Timberlake12,725
- Timberville3,036
- Toms Brook439
- Triangle10,450
- Troutdale178
- Troutville475
- Tuckahoe49,183
- Twin Lakes1,562
- Tysons28,936
- Union Hall1,445
- Union Level143
- Union Mill4,484
- Unionville262
- University Center3,923
- University of Virginia9,065
- Upperville61
- Urbanna495
- Vansant551
- Verona4,165
- Victoria1,595
- Vienna16,412
- Villa Heights601
- Vinton8,056
- Virgilina171
- Virginia Beach456,349
- Wachapreague306
- Wakefield CDP11,930
- Wakefield town1,201
- Warfield29
- Warm Springs19
- Warrenton10,176
- Warsaw2,292
- Washington45
- Waterford220
- Wattsville1,439
- Waverly2,324
- Waynesboro22,841
- Weber City1,504
- Weems279
- West Falls Church31,279
- West Point3,480
- West Springfield22,532
- Westlake Corner2,033
- Weyers Cave2,744
- White Stone449
- Whitesville65
- Williamsburg15,798
- Willis Wharf278
- Winchester27,913
- Windsor2,852
- Wintergreen589
- Wise2,916
- Wolf Trap15,858
- Woodbridge43,945
- Woodburn9,503
- Woodlake7,358
- Woodlawn (Carroll County)2,250
- Woodlawn (Fairfax County)21,194
- Woodstock5,871
- Wyndham12,099
- Wytheville8,202
- Yogaville288
- Yorkshire9,782
- Yorktown128
Metro and micro areas
Each of the 15 that reach into Virginia, with its whole population, from ACS 2020–2024 5-year estimates. Metro and micro areas are counties tied together by commuting, drawn by the Office of Management and Budget.
- Blacksburg-Christiansburg-Radford, VA Metro Area181,664
- Bluefield, WV-VA Micro Area98,187
- Charlottesville, VA Metro Area224,335
- Danville, VA Micro Area102,070
- Harrisonburg, VA Metro Area136,992
- Kingsport-Bristol, TN-VA Metro Area310,842
- Lake of the Woods, VA Micro Area37,822
- Lynchburg, VA Metro Area263,798
- Martinsville, VA Micro Area63,638
- Richmond, VA Metro Area1.34M
- Roanoke, VA Metro Area314,986
- Staunton-Stuarts Draft, VA Metro Area126,822
- Virginia Beach-Chesapeake-Norfolk, VA-NC Metro Area1.79M
- Washington-Arlington-Alexandria, DC-VA-MD-WV Metro Area6.32M
- Winchester, VA-WV Metro Area146,386
ZIP codes
Each of the 886 with people in it, by the town it's centered in, from ACS 2020–2024 5-year estimates. These are the Census Bureau's ZIP Code Tabulation Areas, which follow the Postal Service's ZIP codes as closely as census blocks allow.
- 20105Aldie37,639
- 20106Flint Hill4,297
- 20109Bull Run45,444
- 20110Manassas49,890
- 20111Buckhall38,124
- 20112Independent Hill30,500
- 20115Marshall8,173
- 20117Middleburg2,790
- 20119Calverton3,416
- 20120Bull Run42,896
- 20121Bull Run27,788
- 20124Clifton14,375
- 20129Waterford538
- 20130Paris271
- 20132Purcellville19,817
- 20135Shenandoah Retreat3,585
- 20136Linton Hall32,325
- 20137Gainesville1,938
- 20141Round Hill8,359
- 20143Stone Ridge1,070
- 20144Rectortown1,340
- 20147Ashburn67,692
- 20148Brambleton64,021
- 20151Chantilly22,610
- 20152South Riding36,674
- 20155Gainesville37,486
- 20158Hamilton4,979
- 20164Sterling43,436
- 20165Cascades34,088
- 20166Loudoun Valley Estates14,949
- 20169Bull Run Mountain Estates28,089
- 20170Herndon43,866
- 20171Floris51,286
- 20175Leesburg34,733
- 20176Waterford51,471
- 20180Lovettsville7,531
- 20181Nokesville10,774
- 20184Upperville635
- 20186Warrenton15,703
- 20187New Baltimore18,980
- 20190Reston22,012
- 20191Reston31,011
- 20194Reston12,275
- 20197Waterford1,825
- 20198The Plains2,251
- 22003Annandale57,755
- 22015Burke Centre44,647
- 22025Montclair19,356
- 22026Cherry Hill22,897
- 22027Dunn Loring1,939
- 22030George Mason61,332
- 22031Mantua37,276
- 22032Kings Park West29,240
- 22033Greenbriar39,526
- 22039South Run19,626
- 22041Bailey's Crossroads29,183
- 22042West Falls Church35,483
- 22043Pimmit Hills25,750
- 22044Lake Barcroft13,996
- 22046Falls Church18,169
- 22060Fort Belvoir10,641
- 22066Great Falls17,185
- 22079Mason Neck35,284
- 22101McLean30,953
- 22102McLean29,184
- 22124Difficult Run18,091
- 22125Occoquan681
- 22134Camp Barrett8,310
- 22150Springfield27,955
- 22151North Springfield17,017
- 22152West Springfield28,814
- 22153Newington Forest32,664
- 22172Montclair11,490
- 22180Vienna26,568
- 22181Oakton15,760
- 22182Wolf Trap27,783
- 22191Woodbridge73,623
- 22192Lake Ridge59,794
- 22193Dale City81,588
- 22201Arlington37,473
- 22202Arlington27,715
- 22203Arlington26,594
- 22204Arlington51,921
- 22205Arlington17,738
- 22206Arlington20,703
- 22207Arlington35,479
- 22209Arlington14,154
- 22211Arlington947
- 22213Arlington4,021
- 22301Alexandria13,665
- 22302Alexandria18,026
- 22303Huntington16,922
- 22304Alexandria48,613
- 22305Alexandria17,214
- 22306Groveton30,602
- 22307Belle Haven CDP10,343
- 22308Fort Hunt14,090
- 22309Mount Vernon34,316
- 22310Rose Hill28,136
- 22311Alexandria19,337
- 22312Lincolnia26,768
- 22314Alexandria36,612
- 22315Kingstowne30,404
- 22401Fredericksburg28,731
- 22405Falmouth36,890
- 22406Falmouth27,367
- 22407Fredericksburg65,425
- 22408Fredericksburg31,586
- 22427Bowling Green4,356
- 22432Heathsville256
- 22433Lake of the Woods111
- 22435Heathsville2,215
- 22436Port Royal791
- 22437King and Queen Court House582
- 22438252
- 22443Colonial Beach10,011
- 22448Dahlgren Center765
- 22454Tappahannock2,290
- 22460Heathsville1,757
- 224691,967
- 22472Warsaw960
- 22473Heathsville5,498
- 22476224
- 22480Irvington898
- 22482Kilmarnock3,075
- 22485King George27,131
- 224881,367
- 22503Lancaster4,296
- 22504227
- 22508Lake of the Woods15,557
- 22509Port Royal74
- 22511Heathsville1,239
- 22514Bowling Green2,290
- 22520Montross4,740
- 22529Warsaw200
- 22534Lake Land'Or3,290
- 22535Port Royal460
- 22538Port Royal348
- 225392,074
- 22542Rhoadesville2,418
- 22546Lake Caroline18,392
- 22548115
- 22551Spotsylvania Courthouse24,146
- 22553Lake Wilderness17,207
- 22554Aquia Harbour65,494
- 22556Camp Barrett31,785
- 22560Tappahannock6,612
- 22567Rhoadesville2,717
- 22572Warsaw6,597
- 22576Weems1,427
- 22578White Stone2,353
- 22580Bowling Green5,107
- 22601Winchester29,230
- 22602Shawneeland32,840
- 22603Gore17,133
- 22610Chester Gap2,113
- 22611Berryville9,276
- 22620Boyce2,825
- 22623Chester Gap641
- 22624Brucetown3,416
- 22625Lake Holiday3,376
- 22627Flint Hill945
- 22630Front Royal35,615
- 22637Gore1,933
- 22639Chester Gap606
- 22640Chester Gap556
- 22641Lebanon Church165
- 22642Shenandoah Farms3,933
- 22643Skyland Estates137
- 22644Alonzaville2,561
- 22645Middletown4,639
- 22650Luray1,007
- 22652Woodstock1,625
- 22654Lebanon Church1,040
- 22655Stephens City22,687
- 22656Brucetown5,360
- 22657Strasburg12,067
- 22660Toms Brook1,468
- 22663Boyce1,705
- 22664Woodstock9,293
- 22701Culpeper38,512
- 22709Madison920
- 22711Madison139
- 22712Bealeton9,501
- 22713Culpeper1,489
- 22714Brandy Station946
- 22715Brightwood1,552
- 22716Washington1,200
- 22718Brandy Station826
- 22719Sperryville348
- 22720Midland1,497
- 22722Brightwood448
- 22723Stanardsville52
- 22724Opal2,518
- 22725Brightwood99
- 22726Lake of the Woods660
- 22727Madison5,742
- 22728Midland3,752
- 22729Unionville1,148
- 22730Brightwood336
- 22731Madison70
- 22732Orange262
- 22733Unionville1,711
- 22734Remington3,918
- 22735Brightwood1,628
- 22736Lake of the Woods844
- 22737Culpeper3,465
- 22738Ruckersville928
- 22740Sperryville1,179
- 22741Brandy Station421
- 22742Remington1,596
- 22743Stanley276
- 22746539
- 22747Washington967
- 22749Sperryville244
- 22801Harrisonburg39,983
- 22802Linville30,374
- 22807Harrisonburg5,347
- 22810Basye532
- 22811316
- 22812Bridgewater10,660
- 22815Forestville8,465
- 22820118
- 228216,116
- 22824Columbia Furnace6,596
- 22827Elkton10,529
- 22830Singers Glen2,209
- 22831352
- 22832Massanutten1,136
- 22834Linville956
- 22835Luray11,314
- 22840McGaheysville5,239
- 22841Mount Crawford3,090
- 22842Mount Clifton5,580
- 228432,697
- 22844New Market4,677
- 22845Basye48
- 22846Keezletown1,496
- 22847Forestville1,054
- 22849Shenandoah5,170
- 22850Singers Glen1,218
- 22851Stanley5,903
- 22853Timberville5,214
- 22901Ivy37,237
- 22902Esmont23,486
- 22903North Garden40,372
- 22904University of Virginia5,729
- 22911Hollymead19,107
- 22920Afton3,608
- 22922Arrington2,226
- 22923Barboursville6,435
- 22931North Garden145
- 22932Crozet9,148
- 22935Twin Lakes575
- 22936Earlysville6,983
- 22937Esmont1,743
- 22938Schuyler884
- 22939Fishersville6,908
- 22940Free Union1,066
- 22942Gordonsville10,560
- 22943Afton402
- 22946Esmont195
- 22947Keswick5,256
- 22948Brightwood137
- 22949Lovingston1,426
- 22952Wintergreen1,694
- 22958Nellysford2,306
- 22959North Garden1,923
- 22960Orange11,657
- 22963Palmyra16,896
- 22964Arrington99
- 22967Lovingston2,413
- 22968Ruckersville11,235
- 22969Schuyler1,429
- 22971Shipman2,359
- 22972Barboursville290
- 22973Stanardsville6,292
- 22974Lake Monticello5,309
- 22976Wintergreen149
- 22980Dooms32,965
- 22989Orange49
- 23002Amelia Court House10,849
- 23004819
- 23005Ashland19,987
- 23009Central Garage8,270
- 23011West Point1,682
- 23015Lake Land'Or4,601
- 23021Mathews19
- 23022Palmyra1,006
- 23023King William482
- 23024Mineral11,233
- 23025Mathews686
- 230271,612
- 23030Charles City4,470
- 23032Urbanna109
- 23035Deltaville1,495
- 230381,471
- 23039Goochland938
- 23040Cumberland4,640
- 23043Deltaville1,628
- 23045Mathews25
- 23047Ashland1,381
- 23050Mathews437
- 23055Palmyra1,004
- 23056Mathews175
- 23059Wyndham42,522
- 23060Laurel36,497
- 23061Gloucester Courthouse23,308
- 23062Gloucester Point1,745
- 23063Goochland6,164
- 23065Goochland1,292
- 23066Gwynn514
- 23068Gwynn333
- 23069Hanover3,425
- 23070Deltaville616
- 23071Deltaville1,879
- 23072Gloucester Point13,328
- 23075Highland Springs8,347
- 23076Gwynn552
- 23079400
- 23083Amelia Court House2,220
- 23084Palmyra1,652
- 23085King and Queen Court House393
- 23086King William3,777
- 23089New Kent4,831
- 23091King and Queen Court House562
- 23092Urbanna765
- 23093Louisa14,647
- 23102Goochland3,605
- 23103Short Pump6,922
- 23106Central Garage917
- 23108Saluda22
- 23109Mathews2,327
- 23110West Point764
- 23111Mechanicsville38,070
- 23112Brandermill57,016
- 23113Midlothian27,477
- 23114Midlothian21,631
- 23116Mechanicsville34,188
- 23117Mineral10,480
- 23119Mathews284
- 23120Woodlake17,586
- 231231,995
- 23124New Kent5,147
- 23126410
- 23128Mathews367
- 23129Goochland305
- 23130Mathews94
- 23138Mathews1,198
- 23139Powhatan27,757
- 23140New Kent7,755
- 23141Sandston7,814
- 23146Wyndham3,451
- 23147Charles City22
- 23148Central Garage1,471
- 23149Saluda2,414
- 23150Sandston12,544
- 23153Goochland1,586
- 23156West Point1,158
- 23160Goochland1,186
- 23161King and Queen Court House337
- 23163Mathews78
- 231689,673
- 23169Weems1,104
- 23173Richmond2,107
- 23175Urbanna2,053
- 23176Deltaville677
- 23177King William608
- 23180Urbanna479
- 23181King and Queen Court House5,565
- 23185Williamsburg55,270
- 23188Williamsburg45,803
- 231926,629
- 23219Richmond4,062
- 23220Richmond34,671
- 23221Richmond14,402
- 23222East Highland Park26,322
- 23223East Highland Park54,659
- 23224Richmond40,575
- 23225Richmond42,771
- 23226Richmond15,477
- 23227Chamberlayne24,925
- 23228Laurel36,527
- 23229Tuckahoe35,689
- 23230Lakeside8,910
- 23231Sandston38,544
- 23233Short Pump31,582
- 23234Meadowbrook47,465
- 23235Bon Air33,461
- 23236Rockwood27,903
- 23237Bellwood27,126
- 23238Tuckahoe26,050
- 23284Richmond2,362
- 23294Laurel20,216
- 23298Richmond98
- 23301Accomac1,804
- 23302Atlantic111
- 23303Atlantic342
- 23304Smithfield45
- 23306Belle Haven town1,729
- 23307Nassawadox701
- 23308Bloxom2,370
- 23310Cheriton5,031
- 23314Carrollton10,099
- 23315Carrsville1,391
- 23316Cheriton91
- 23320Chesapeake59,108
- 23321Chesapeake40,176
- 23322Chesapeake66,956
- 23323Chesapeake43,043
- 23324Chesapeake24,670
- 23325Chesapeake19,138
- 23336Chincoteague3,319
- 23337Wattsville666
- 23347Eastville502
- 23350Exmore2,983
- 23354Franktown433
- 23356Greenbackville1,628
- 23357Chase Crossing890
- 23358Harborton236
- 23359Hallwood940
- 23389Harborton92
- 23395Horntown466
- 23398Franktown27
- 23401Keller288
- 23405Eastville1,237
- 23407Mappsville270
- 23409Sanford109
- 23410Melfa2,305
- 23413Nassawadox776
- 23414Nelsonia26
- 23415New Church2,289
- 23416Oak Hall96
- 23417Southside Chesconessex3,827
- 23418Wachapreague753
- 23420Boston2,673
- 23421Metompkin4,290
- 23422Pungoteague202
- 23423Quinby219
- 23426Sanford37
- 23427Saxis218
- 23430Smithfield19,109
- 23432Suffolk1,180
- 23433Suffolk1,391
- 23434Suffolk54,387
- 23435Suffolk33,721
- 23436Suffolk882
- 23437Suffolk5,023
- 23438Suffolk1,749
- 23440Tangier252
- 23442Temperanceville488
- 23451Virginia Beach44,012
- 23452Virginia Beach58,455
- 23453Virginia Beach34,482
- 23454Virginia Beach58,178
- 23455Virginia Beach49,977
- 23456Virginia Beach61,911
- 23457Virginia Beach4,814
- 23459Virginia Beach1,324
- 23460Virginia Beach1,041
- 23461Virginia Beach943
- 23462Virginia Beach66,151
- 23464Virginia Beach75,061
- 23480Locust Mount338
- 23486Willis Wharf278
- 23487Windsor6,477
- 23488Makemie Park62
- 23502Norfolk20,399
- 23503Norfolk30,216
- 23504Norfolk23,502
- 23505Norfolk28,247
- 23507Norfolk6,645
- 23508Norfolk19,432
- 23509Norfolk13,105
- 23510Norfolk9,190
- 23511Norfolk9,664
- 23513Norfolk28,628
- 23517Norfolk4,932
- 23518Norfolk29,746
- 23523Norfolk8,188
- 23551Norfolk1,702
- 23601Newport News26,645
- 23602Newport News42,265
- 23603Newport News3,504
- 23604Newport News4,416
- 23605Newport News13,332
- 23606Newport News29,971
- 23607Newport News23,096
- 23608Newport News43,641
- 23651Hampton439
- 23661Hampton14,005
- 23662Poquoson12,639
- 23663Hampton14,656
- 23664Hampton9,643
- 23665Hampton5,810
- 23666Hampton54,233
- 23668Hampton723
- 23669Hampton39,884
- 23690Yorktown4,597
- 23691Yorktown464
- 23692Yorktown19,301
- 23693Bethel Manor23,176
- 23696Bethel Manor3,937
- 23701Portsmouth24,298
- 23702Portsmouth12,485
- 23703Portsmouth25,610
- 23704Portsmouth19,207
- 23707Portsmouth14,766
- 23708Portsmouth269
- 23709Portsmouth510
- 23801Colonial Heights8,993
- 23803Matoaca42,012
- 23805Templeton21,408
- 23821Alberta1,983
- 23824Blackstone6,455
- 23827Boykins1,091
- 23828Branchville577
- 23829Capron2,731
- 23830Templeton1,412
- 23831Chester39,529
- 23832Brandermill41,442
- 238332,212
- 23834Colonial Heights26,628
- 23836Enon15,298
- 23837Courtland4,623
- 23838Woodlake17,686
- 23839Dendron993
- 23840Dinwiddie1,733
- 23841Dinwiddie3,021
- 23842Disputanta6,924
- 23843Warfield446
- 23844Capron522
- 23845Ebony280
- 23846Surry709
- 23847Emporia12,956
- 238501,161
- 23851Franklin13,237
- 23856Lawrenceville540
- 23857Gasburg352
- 23860Hopewell31,404
- 23866Ivor1,943
- 23867Jarratt5,173
- 23868Lawrenceville6,281
- 23872McKenney2,571
- 23874Newsoms673
- 23875Prince George13,029
- 23876Warfield252
- 23878Sedley1,217
- 23879Emporia386
- 23881Claremont2,531
- 23882Stony Creek1,848
- 23883Scotland1,870
- 23884Sussex29
- 23885Dinwiddie3,193
- 23887Gasburg631
- 23888Wakefield town2,528
- 23889Warfield565
- 23890Waverly4,167
- 23891Disputanta1,449
- 23893Ebony504
- 23894326
- 23897Sussex949
- 23898Ivor2,246
- 23899Claremont387
- 23901Farmville15,173
- 23909Farmville1,109
- 23915Baskerville1,360
- 23917Boydton2,422
- 23919Bracey2,306
- 23920Brodnax3,225
- 23921Buckingham Courthouse2,408
- 23922Burkeville4,197
- 23923Charlotte Court House2,063
- 23924Fairview5,915
- 23927Clarksville4,809
- 23930Crewe5,508
- 23934Pamplin City441
- 23936Dillwyn7,334
- 23937Drakes Branch1,915
- 23938Alberta295
- 23942Burkeville1,001
- 23943Hampden-Sydney1,066
- 23944Kenbridge3,978
- 23947Keysville3,785
- 23950La Crosse3,510
- 23952Lunenburg84
- 23954Keysville2,396
- 23955Nottoway Court House14
- 23958Pamplin City3,425
- 23959Phenix1,154
- 23960Hampden-Sydney2,176
- 23962Drakes Branch705
- 23963Pamplin City468
- 23964Clover903
- 23966Farmville2,010
- 23967Drakes Branch1,495
- 23968Chase City671
- 23970South Hill8,109
- 23974Lunenburg4,582
- 23976Thynedale97
- 24011Roanoke784
- 24012Cloverdale28,235
- 24013Roanoke8,026
- 24014Vinton15,300
- 24015Roanoke15,865
- 24016Roanoke10,521
- 24017Roanoke23,678
- 24018Cave Spring38,720
- 24019Hollins28,585
- 24020Hollins583
- 24053Cana2,414
- 24054Laurel Park5,957
- 24055Bassett11,814
- 24058Belspring281
- 24059Elliston893
- 24060Blacksburg48,541
- 24061Blacksburg9,202
- 24064Montvale4,875
- 24065Boones Mill6,565
- 24066Buchanan4,963
- 24067Ferrum2,371
- 24069Sandy Level1,861
- 24070Glenvar1,271
- 24072Shawsville1,238
- 24073Christiansburg29,677
- 24076Stuart801
- 24077Cloverdale943
- 24078Collinsville6,438
- 240791,389
- 24082Patrick Springs291
- 24083Daleville4,948
- 24084Dublin10,604
- 24085Eagle Rock2,391
- 24086Eggleston263
- 24087Elliston3,941
- 24088Ferrum5,017
- 24089Fieldale2,265
- 24090Fincastle4,521
- 24091Floyd7,417
- 24092Union Hall3,368
- 24093Glen Lyn102
- 24095Stewartsville3,962
- 24101Stewartsville6,185
- 24102Oak Level1,291
- 24104Moneta3,163
- 24105Hiwassee426
- 24112Martinsville31,028
- 24120Meadows of Dan1,591
- 24121Moneta10,315
- 24122Montvale1,492
- 24124Narrows4,042
- 241274,392
- 24128Blacksburg1,450
- 24129New River114
- 24131New Castle10
- 24132Parrott694
- 24133Patrick Springs2,219
- 24134Narrows5,400
- 24136Pembroke3,145
- 24137Penhook2,767
- 24138Riner1,432
- 24139Motley654
- 24141Radford21,484
- 24142Radford2,205
- 24147Rich Creek1,352
- 24148Ridgeway8,355
- 24149Riner3,986
- 24150Pembroke883
- 24151Henry Fork18,154
- 24153Glenvar38,914
- 24161Penhook703
- 24162Shawsville2,259
- 24165Horse Pasture1,875
- 24167Pearisburg275
- 24168Stanleytown204
- 24171Patrick Springs8,268
- 24174Montvale2,191
- 24175New Castle8,128
- 24176Union Hall1,586
- 24179Stewartsville18,773
- 24184Westlake Corner4,527
- 24185Floyd894
- 24201Bristol15,903
- 24202Bristol12,389
- 24210Abingdon16,814
- 24211Abingdon10,298
- 24216Stonega2,246
- 24217474
- 24219East Stone Gap10,450
- 24220Haysi503
- 24221Jonesville633
- 24224Castlewood5,273
- 24225Cleveland1,791
- 24226Clinchco2,110
- 24228Clintwood6,317
- 24230Coeburn6,900
- 24236Damascus3,109
- 24237Dante1,064
- 2423938
- 24243Dryden1,452
- 24244Duffield5,600
- 24245Dungannon1,053
- 24246East Stone Gap78
- 24248Ewing2,207
- 24250Gate City1,268
- 24251Gate City7,937
- 24256Haysi2,982
- 24258Hiltons1,163
- 24260Honaker5,318
- 24263Jonesville5,830
- 24265Keokee1,140
- 24266Lebanon8,688
- 24269Clinchco209
- 24270Mendota416
- 24271Nickelsville2,525
- 24272Dante316
- 24273Norton5,593
- 24277Pennington Gap5,839
- 24279Pound4,671
- 24280Honaker784
- 24281Rose Hill1,890
- 24282St. Charles1,181
- 24283St. Paul1,832
- 24290Weber City2,274
- 24292555
- 24293Wise9,786
- 24301Pulaski13,567
- 24311Atkins1,526
- 24312Ivanhoe1,650
- 24313Allisonia806
- 24314Bastian1,324
- 24315Bland3,978
- 24316Saltville46
- 24317Cana3,409
- 24318Rural Retreat376
- 24319Chilhowie6,997
- 24322Stevens Creek124
- 24323Rural Retreat798
- 24324Draper2,298
- 24325Hillsville979
- 24326Independence858
- 24327Emory598
- 24328Fancy Gap1,915
- 24330Stevens Creek2,982
- 24333Galax17,390
- 24340Glade Spring6,111
- 24343Hillsville9,210
- 24347Hiwassee1,677
- 24348Independence4,855
- 24350Ivanhoe1,130
- 24351Cana562
- 24352Meadows of Dan1,381
- 24354Marion13,001
- 24360Fort Chiswell5,750
- 24361Emory4,484
- 24363Troutdale1,031
- 24366Rocky Gap466
- 24368Rural Retreat5,574
- 24370Saltville5,766
- 24374Rural Retreat411
- 24375Sugar Grove1,711
- 24377569
- 24378Troutdale1,056
- 243803,088
- 24381Woodlawn3,091
- 24382Wytheville14,582
- 24401Staunton38,756
- 24411Augusta Springs2
- 24412Warm Springs205
- 24413Monterey251
- 24415Fairfield90
- 24416Buena Vista9,082
- 24421Churchville3,450
- 24422Cliftondale Park5,334
- 24426Covington13,872
- 24430Augusta Springs3,109
- 24431Crimora2,176
- 24432Deerfield544
- 24433McDowell88
- 24435Fairfield1,764
- 24437New Hope1,468
- 24439Goshen1,124
- 24440Greenville2,710
- 24441Harriston6,520
- 24442McDowell68
- 24445Hot Springs2,332
- 24448Iron Gate420
- 24450Lexington17,714
- 24457Low Moor425
- 24458McDowell244
- 24459Middlebrook535
- 24460Millboro1,119
- 24464190
- 24465Monterey1,403
- 24467Mount Sidney2,318
- 24471Port Republic1,768
- 24472Greenville2,176
- 24473Goshen979
- 24474Selma146
- 24476Greenville227
- 24477Stuarts Draft11,482
- 24479Churchville1,791
- 24482Verona5,312
- 24483Fairfield475
- 24484486
- 24485Deerfield346
- 24486Weyers Cave3,739
- 24487566
- 24501Lynchburg25,006
- 24502Lynchburg41,979
- 24503Lynchburg20,419
- 24504Concord9,632
- 24515Lynchburg6,391
- 24517Altavista4,996
- 24520Cluster Springs1,931
- 24521Amherst10,599
- 24522Appomattox10,056
- 24523Bedford20,349
- 24526Big Island1,494
- 24527Blairs3,262
- 24528Brookneal3,775
- 24529Clarksville1,345
- 24530678
- 24531Chatham8,695
- 24534Clover1,655
- 24536Big Island406
- 24538Concord4,867
- 24539Halifax159
- 24540Mount Hermon31,013
- 24541Danville28,042
- 24549Mount Hermon4,160
- 24550Timberlake8,190
- 24551Forest28,554
- 245531,610
- 24554Brookneal3,769
- 24555Glasgow2,123
- 24556Forest2,584
- 24557Gretna7,678
- 24558Halifax6,458
- 24562Yogaville820
- 24563Hurt5,184
- 245651,098
- 24566Blairs1,084
- 245691,059
- 24571Hurt2,092
- 24572Madison Heights15,744
- 24574Big Island3,666
- 24577Nathalie4,577
- 24578Glasgow457
- 24579Glasgow1,107
- 24580Virgilina360
- 24586Danville4,807
- 24588Rustburg8,817
- 24589Scottsburg1,763
- 24590Scottsville8,229
- 24592South Boston14,589
- 24593Concord2,162
- 245941,250
- 24595Amherst630
- 24597Mountain Road691
- 24598Virgilina1,309
- 24599Yogaville470
- 24602Jewell Ridge1,213
- 24603Big Rock632
- 24604Abbs Valley230
- 24605Boissevain8,872
- 24606Boissevain310
- 24607Breaks313
- 24609Claypool Hill6,923
- 24612Raven113
- 24613Falls Mills276
- 24614Grundy6,668
- 246202,270
- 24622Jewell Ridge527
- 24630Tazewell5,307
- 24631Vansant2,397
- 24634Jewell Ridge338
- 24635Pocahontas779
- 24637Pounding Mill3,778
- 24639Raven2,736
- 24641Richlands5,446
- 24646Vansant667
- 24649Raven2,135
- 24651Tazewell5,982
- 24656Vansant2,305
- 24657Jewell Ridge250
School districts
Each of the 136 with people in it, from ACS 2020–2024 5-year estimates. Elementary districts teach the lower grades and secondary districts the upper ones, under them; the rest are unified, teaching every grade.
- Accomack County Public Schools33,335
- Albemarle County Public Schools114,919
- Alexandria City Public Schools156,976
- Alleghany Highlands Public Schools20,539
- Amelia County Public Schools13,462
- Amherst County Public Schools31,485
- Appomattox County Public Schools16,610
- Arlington County Public Schools236,254
- Augusta County Public Schools78,033
- Bath County Public Schools4,100
- Bedford County Public Schools80,894
- Bland County Public Schools6,199
- Botetourt County Public Schools34,004
- Bristol City Public Schools16,849
- Brunswick County Public Schools15,841
- Buchanan County Public Schools19,415
- Buckingham County Public Schools16,976
- Buena Vista City Public Schools6,593
- Campbell County Public Schools55,312
- Caroline County Public Schools32,098
- Carroll County Public Schools29,157
- Charles City County Public Schools6,627
- Charlotte County Public Schools11,422
- Charlottesville City Public Schools45,437
- Chesapeake City Public Schools252,583
- Chesterfield County Public Schools377,869
- Clarke County Public Schools15,216
- Colonial Beach Town Public Schools3,632
- Colonial Heights City Public Schools18,352
- Craig County Public Schools4,856
- Culpeper County Public Schools54,397
- Cumberland County Public Schools9,818
- Dahlgren Department of Defense School District765
- Danville City Public Schools42,214
- Dickenson County Public Schools13,733
- Dinwiddie County Public Schools28,191
- Emporia City Public Schools5,547
- Essex County Public Schools10,623
- Fairfax City Public Schools25,026
- Fairfax County Public Schools1.15M
- Falls Church City Public Schools14,710
- Fauquier County Public Schools74,577
- Floyd County Public Schools15,593
- Fluvanna County Public Schools28,092
- Franklin City Public Schools8,250
- Franklin County Public Schools55,130
- Frederick County Public Schools95,008
- Fredericksburg City Public Schools28,873
- Galax City Public Schools6,726
- Giles County Public Schools16,557
- Gloucester County Public Schools39,526
- Goochland County Public Schools26,410
- Grayson County Public Schools15,287
- Greene County Public Schools21,155
- Greensville County Public Schools11,275
- Halifax County Public Schools33,639
- Hampton City Public Schools137,557
- Hanover County Public Schools112,879
- Harrisonburg City Public Schools51,392
- Henrico County Public Schools335,744
- Henry County Public Schools49,980
- Highland County Public Schools2,296
- Hopewell City Public Schools22,959
- Isle of Wight County Public Schools39,974
- James City County Public Schools81,013
- King and Queen County Public Schools6,695
- King George County Public Schools27,131
- King William County Public Schools15,113
- Lancaster County Public Schools10,936
- Lee County Public Schools21,900
- Lexington City Public Schoolselementary7,525
- Loudoun County Public Schools432,998
- Louisa County Public Schools39,980
- Lunenburg County Public Schools12,016
- Lynchburg City Public Schools79,497
- Madison County Public Schools14,044
- Manassas City Public Schools42,976
- Manassas Park City Public Schools16,798
- Martinsville City Public Schools13,658
- Mathews County Public Schools8,540
- Mecklenburg County Public Schools30,516
- Middlesex County Public Schools10,847
- Montgomery County Public Schools99,101
- Nelson County Public Schools14,732
- New Kent County Public Schools25,105
- Newport News City Public Schools184,216
- Norfolk City Public Schools233,596
- Northampton County Public Schools12,059
- Northumberland County Public Schools12,188
- Norton City Public Schools3,577
- Nottoway County Public Schools15,597
- Orange County Public Schools37,822
- Page County Public Schools23,727
- Patrick County Public Schools17,512
- Petersburg City Public Schools33,537
- Pittsylvania County Public Schools59,856
- Poquoson City Public Schools12,639
- Portsmouth City Public Schools97,190
- Powhatan County Public Schools31,555
- Prince Edward County Public Schools21,996
- Prince George County Public Schools43,146
- Prince William County Public Schools482,708
- Pulaski County Public Schools33,687
- Quantico Marine Corps Center School District8,310
- Radford City Public Schools16,726
- Rappahannock County Public Schools7,427
- Richmond City Public Schools229,359
- Richmond County Public Schools9,095
- Roanoke City Public Schools98,355
- Roanoke County Public Schools97,023
- Rockbridge County Public Schools22,531
- Rockingham County Public Schools85,600
- Russell County Public Schools25,538
- Salem City Public Schools25,618
- Scott County Public Schools21,479
- Shenandoah County Public Schools44,925
- Smyth County Public Schools29,420
- Southampton County Public Schools17,964
- Spotsylvania County Public Schools146,603
- Stafford County Public Schools161,328
- Staunton City Public Schools25,948
- Suffolk City Public Schools98,796
- Surry County Public Schools6,549
- Sussex County Public Schools10,765
- Tazewell County Public Schools39,624
- Virginia Beach City Public Schools456,349
- Warren County Public Schools41,531
- Washington County Public Schools53,926
- Waynesboro City Public Schools22,841
- West Point Town Public Schools3,480
- Westmoreland County Public Schools15,194
- Williamsburg City Public Schools15,798
- Winchester City Public Schools27,913
- Wise County Public Schools35,448
- Wythe County Public Schools28,188
- York County Public Schools71,005
Congressional districts
As drawn for the 119th Congress (2025–2027).
- Congressional District 1804,410
- Congressional District 2787,890
- Congressional District 3776,096
- Congressional District 4796,326
- Congressional District 5798,638
- Congressional District 6790,761
- Congressional District 7806,870
- Congressional District 8776,847
- Congressional District 9780,117
- Congressional District 10802,125
- Congressional District 11785,090
State senate districts
The upper chamber’s districts, as drawn in 2024.
- State Senate District 1224,593
- State Senate District 2217,225
- State Senate District 3213,140
- State Senate District 4217,798
- State Senate District 5218,387
- State Senate District 6211,865
- State Senate District 7216,976
- State Senate District 8215,703
- State Senate District 9214,802
- State Senate District 10225,574
- State Senate District 11216,592
- State Senate District 12227,100
- State Senate District 13212,855
- State Senate District 14218,604
- State Senate District 15225,580
- State Senate District 16221,266
- State Senate District 17226,172
- State Senate District 18214,423
- State Senate District 19214,133
- State Senate District 20215,818
- State Senate District 21207,196
- State Senate District 22212,710
- State Senate District 23215,050
- State Senate District 24210,920
- State Senate District 25217,830
- State Senate District 26222,927
- State Senate District 27221,295
- State Senate District 28219,361
- State Senate District 29216,843
- State Senate District 30217,286
- State Senate District 31224,658
- State Senate District 32229,551
- State Senate District 33217,847
- State Senate District 34217,403
- State Senate District 35215,070
- State Senate District 36211,224
- State Senate District 37216,660
- State Senate District 38215,861
- State Senate District 39216,873
- State Senate District 40209,999
State house districts
The lower chamber’s districts, as drawn in 2024.
- State House District 186,871
- State House District 281,865
- State House District 384,481
- State House District 485,854
- State House District 587,801
- State House District 682,127
- State House District 786,180
- State House District 887,554
- State House District 988,013
- State House District 1083,555
- State House District 1189,169
- State House District 1289,507
- State House District 1386,512
- State House District 1481,737
- State House District 1588,931
- State House District 1685,210
- State House District 1786,047
- State House District 1883,779
- State House District 1989,772
- State House District 2086,445
- State House District 2186,810
- State House District 2286,864
- State House District 2389,666
- State House District 2486,337
- State House District 2584,029
- State House District 2688,763
- State House District 2786,085
- State House District 2889,015
- State House District 2988,093
- State House District 3092,774
- State House District 3190,693
- State House District 3286,471
- State House District 3387,897
- State House District 3487,521
- State House District 3589,236
- State House District 3686,398
- State House District 3786,362
- State House District 3886,897
- State House District 3984,469
- State House District 4086,157
- State House District 4188,467
- State House District 4284,610
- State House District 4385,699
- State House District 4487,510
- State House District 4584,479
- State House District 4684,492
- State House District 4782,901
- State House District 4886,666
- State House District 4983,864
- State House District 5084,594
- State House District 5186,075
- State House District 5286,896
- State House District 5388,387
- State House District 5488,009
- State House District 5586,485
- State House District 5690,539
- State House District 5789,273
- State House District 5884,836
- State House District 5989,136
- State House District 6088,087
- State House District 6186,764
- State House District 6289,757
- State House District 6388,708
- State House District 6490,088
- State House District 6589,973
- State House District 6686,912
- State House District 6789,810
- State House District 6887,477
- State House District 6989,728
- State House District 7085,621
- State House District 7186,235
- State House District 7292,235
- State House District 7394,468
- State House District 7487,534
- State House District 7591,109
- State House District 7689,291
- State House District 7788,884
- State House District 7882,903
- State House District 7991,863
- State House District 8086,921
- State House District 8182,773
- State House District 8285,524
- State House District 8393,019
- State House District 8490,476
- State House District 8588,288
- State House District 8686,664
- State House District 8786,268
- State House District 8884,793
- State House District 8989,499
- State House District 9089,801
- State House District 9186,499
- State House District 9288,856
- State House District 9384,411
- State House District 9479,803
- State House District 9581,660
- State House District 9687,920
- State House District 9784,360
- State House District 9888,250
- State House District 9982,735
- State House District 10084,338
PUMAs
Public Use Microdata Areas: areas of 100,000 people or more that the state draws from census tracts, for the Census Bureau’s microdata.
- Alexandria City PUMA156,976
- Arlington County (North) PUMA120,800
- Arlington County (South) PUMA115,454
- Central Shenandoah Planning District Commission (Northeast) PUMA136,992
- Central Shenandoah Planning District Commission (Southwest) PUMA169,867
- Chesapeake City (Northeast) PUMA112,046
- Chesapeake City (South & West) PUMA128,346
- Chesterfield County (Central)–Chester & Rockwood PUMA128,121
- Chesterfield County (East)–James River Region PUMA117,784
- Chesterfield County (West)–Brandermill & Woodlake PUMA131,964
- Crater Planning District Commission PUMA180,321
- Fairfax County (Central)–Fairfax City & Burke PUMA162,346
- Fairfax County (East Central)–Annandale, West Falls Church & Bailey's Crossroads PUMA146,638
- Fairfax County (North Central)–Vienna Town, Oakton & Fair Oaks (East) PUMA125,436
- Fairfax County (Northeast)–McLean & Idylwood PUMA120,874
- Fairfax County (Northwest)–Reston (North) & Franklin Farm PUMA174,177
- Fairfax County (South Central)–Springfield (South), West Springfield & Franconia PUMA107,397
- Fairfax County (Southeast)–Woodlawn, Rose Hill & Mount Vernon PUMA129,317
- Fairfax County (Southwest)–Centreville (Southeast) & Lorton PUMA106,491
- Fairfax County (West Central)–Centreville (North & West) & Chantilly (South & West) PUMA114,897
- George Washington Regional Commission (North) PUMA192,339
- George Washington Regional Commission (South) PUMA206,552
- Goochland, Powhatan & Western Hanover Counties PUMA116,451
- Hampton City PUMA137,557
- Henrico County (South & East)–Highland Springs, East Highland Park & Glen Allen PUMA150,647
- Henrico County (West)–Tuckahoe, Short Pump & Wyndham PUMA185,097
- Isle of Wight, Southampton Counties, Suffolk & Franklin Cities PUMA164,984
- James City, York Counties, Williamsburg & Poquoson Cities PUMA180,455
- King William, New Kent, Charles City & Eastern Hanover Counties PUMA104,718
- LENOWISCO & Cumberland Plateau Planning District Commissions PUMA180,714
- Loudoun County (East Central)–Ashburn (Southwest/Belmont Ridge) & Dulles Airport PUMA157,399
- Loudoun County (Northeast)–Sterling & Ashburn (Northeast/Ashburn Village) PUMA120,002
- Loudoun County (West & South)–Leesburg Town PUMA155,597
- Manassas, Manassas Park Cities & Prince William County (Central)–Buckhall & Sudley PUMA137,233
- Middle Peninsula, Northern Neck & Accomack-Northampton Planning District Commissions PUMA172,670
- Mount Rogers Planning District Commission PUMA185,752
- New River Valley Planning District Commission PUMA181,664
- Newport News City PUMA184,216
- Norfolk City (North) PUMA97,647
- Norfolk City (South) PUMA135,949
- Northern Shenandoah Valley Regional Commission (North) PUMA138,137
- Northern Shenandoah Valley Regional Commission (South) PUMA110,183
- Portsmouth & Northern Chesapeake Cities PUMA109,381
- Prince William County (East) PUMA107,825
- Prince William County (North & West)–Linton Hall & Gainesville PUMA138,154
- Prince William County (Northeast) PUMA165,442
- Rappahannock-Rapidan Regional Commission PUMA188,312
- Richmond City (North & West) PUMA113,057
- Richmond City (South & East) PUMA116,302
- Roanoke Valley-Alleghany Regional Commission (Outside Roanoke & Salem Cities) PUMA203,496
- Roanoke Valley-Alleghany Regional Commission (Roanoke, Salem Cities & Vinton Town) PUMA132,029
- Southside Planning District Commission & Commonwealth Regional Council PUMA181,283
- Thomas Jefferson Planning District Commission (North) PUMA140,092
- Thomas Jefferson Planning District Commission (South & East) PUMA124,223
- Virginia Beach City (Central) PUMA179,207
- Virginia Beach City (North) PUMA146,490
- Virginia Beach City (South) PUMA130,652
- Virginia's Region 2000 (North)–Bedford, Amherst, Appomattox Counties & Bedford City PUMA128,989
- Virginia's Region 2000 (South)–Campbell County & Lynchburg City PUMA134,809
- West Piedmont Planning District Commission PUMA183,220
Urban areas
Each that reaches into Virginia, with its whole population. Urban areas are the densely settled land the Census Bureau draws after each census, whatever the city lines.
- Altavista, VA4,603
- Bealeton, VA5,426
- Bedford, VA6,742
- Big Stone Gap, VA6,673
- Blacksburg–Christiansburg, VA71,350
- Bluefield, WV–VA41,767
- Bristol, TN–VA70,694
- Broadway–Timberville, VA7,371
- Buena Vista, VA6,484
- Charlottesville, VA105,242
- Chincoteague, VA3,163
- Clifton Forge, VA4,441
- Colonial Beach, VA4,018
- Covington, VA7,944
- Crozet, VA9,354
- Culpeper, VA23,233
- Danville, VA–NC46,495
- Elkton, VA5,483
- Emporia, VA6,795
- Farmville, VA8,833
- Franklin, VA9,178
- Fredericksburg, VA173,739
- Front Royal, VA16,410
- Galax, VA6,262
- Hagerstown, MD–WV–PA–VA201,864
- Harrisonburg, VA73,659
- Kingsport, TN–VA101,236
- Lake Monticello, VA10,589
- Lake of the Woods, VA11,309
- Lexington, VA9,524
- Luray, VA4,333
- Lynchburg, VA127,904
- Marion, VA7,031
- Martinsville, VA31,292
- Orange, VA4,902
- Pulaski, VA16,257
- Purcellville, VA16,316
- Radford, VA19,647
- Richlands, VA8,119
- Richmond, VA1.08M
- Roanoke, VA215,653
- Rocky Mount, VA4,962
- Smithfield, VA9,530
- South Boston, VA7,360
- South Hill, VA5,247
- Staunton–Waynesboro, VA59,610
- Strasburg, VA7,779
- Suffolk, VA46,620
- Tazewell, VA4,036
- Virginia Beach–Norfolk, VA1.45M
- Warrenton–New Baltimore, VA25,326
- Washington–Arlington, DC–VA–MD5.17M
- Williamsburg, VA94,055
- Winchester, VA85,567
- Wise–Norton, VA9,807
- Woodstock, VA5,884
- Wytheville, VA7,052
Tribal areas
Each that reaches into Virginia, with its whole population.
- Chickahominy TDSA, VA3,800
- Eastern Chickahominy TDSA, VA368
- Mattaponi (state) Reservation, VA48
- Pamunkey (state) Reservation, VA118
- Rappahannock TDSA, VA2,101
Turn Virginia into your planning report.
Social Explorer Studio builds an editable profile of any place, with tables and charts beside the county and state, and exports to Word, PDF and Excel.
Questions about Virginia
What is the population of Virginia?
8,880,107 people, according to the ACS 2025 1-year estimates, which the Census Bureau adjusts to match its own population estimate. That’s the 12th largest of the 50 states and DC.
What is the FIPS code for Virginia?
51. Every county’s and place’s FIPS code in Virginia starts with it. The Census Bureau’s full geographic identifier (GEOID) is 0400000US51.
What is the largest city in Virginia?
Virginia Beach, with 453,737 people. Other large places here include Chesapeake, Arlington and Richmond.
What is the median household income in Virginia?
$99,322 (±$1,105), according to the ACS 2025 1-year estimates, higher than the US ($84,780).
What is the median age in Virginia?
39.5 years (±0.2), according to the ACS 2025 1-year estimates, about the same as the US (39.5).
How much does housing cost in Virginia?
Virginia’s median home value is $422,600 (±$3,315) and its median gross rent is $1,734 (±$20) a month, according to the ACS 2025 1-year estimates. 47.1% (±1.2%) of its renters pay 30% or more of their income on rent.
Is Virginia growing?
Virginia’s population grew 5.9%, from 8,382,993 in 2015 to 8,880,107 in 2025, according to the ACS 1-year estimates.
Where do people who work in Virginia live?
3,548,645 of its 3,894,892 jobs are held by people who live here. Of those who commute in, the most come from Maryland, West Virginia, North Carolina.
Where does this census data come from?
The U.S. Census Bureau’s American Community Survey, through Social Explorer’s tables: the latest 1-year estimates where they exist, for the most recent numbers, and 5-year estimates otherwise. Each table lists its code, so you can find it again.
Is this data free to use?
Yes. You can read it, cite it, download the CSV and embed the charts, with no account. To map other variables, compare your own areas or build a report, see Social Explorer’s plans in a live demo.
Sources and how to cite
American Community Survey 2025 1-year estimates, or 2020–2024 5-year estimates where noted, U.S. Census Bureau, from Social Explorer’s tables A00001, A00002, A01004, A04001, A06001, A08001, A09005, A10001, A10003, A10008, A10030, A10036, A10040, A10047, A10055, A10060, A12001, A13004, A14006, A14024, A14028, A16002, A17005, A18002, A18009, A20001, B02002, B09001, B13002, B18101, C16001. Maps by census tract use 2020–2024 5-year estimates, since the 1-year survey doesn’t cover tracts. Commuting: LEHD LODES 2023. These are estimates from a sample, each with its margin of error. Data retrieved November 14, 2026. How these profiles are made.
U.S. Census Bureau, American Community Survey 2025 1-year estimates, or 2020–2024 5-year estimates where noted, via Social Explorer. “Virginia.” https://www.socialexplorer.com/places/virginia. Accessed November 14, 2026.