

Vermont: Population, demographics and census data
Home to 644,663 people, the 50th largest of the 50 states and DC, anchored by Burlington. It grew 3.0% between 2015 and 2025.
- Population
- 644,663. Census Bureau estimate · Rank 50 of the 50 states and DC
- Median household income
- $86,018 ±$2,458. US $84,780
- Median age
- 44.6 ±0.3. US 39.5
ACS 2025 1-year estimates, U.S. Census Bureau
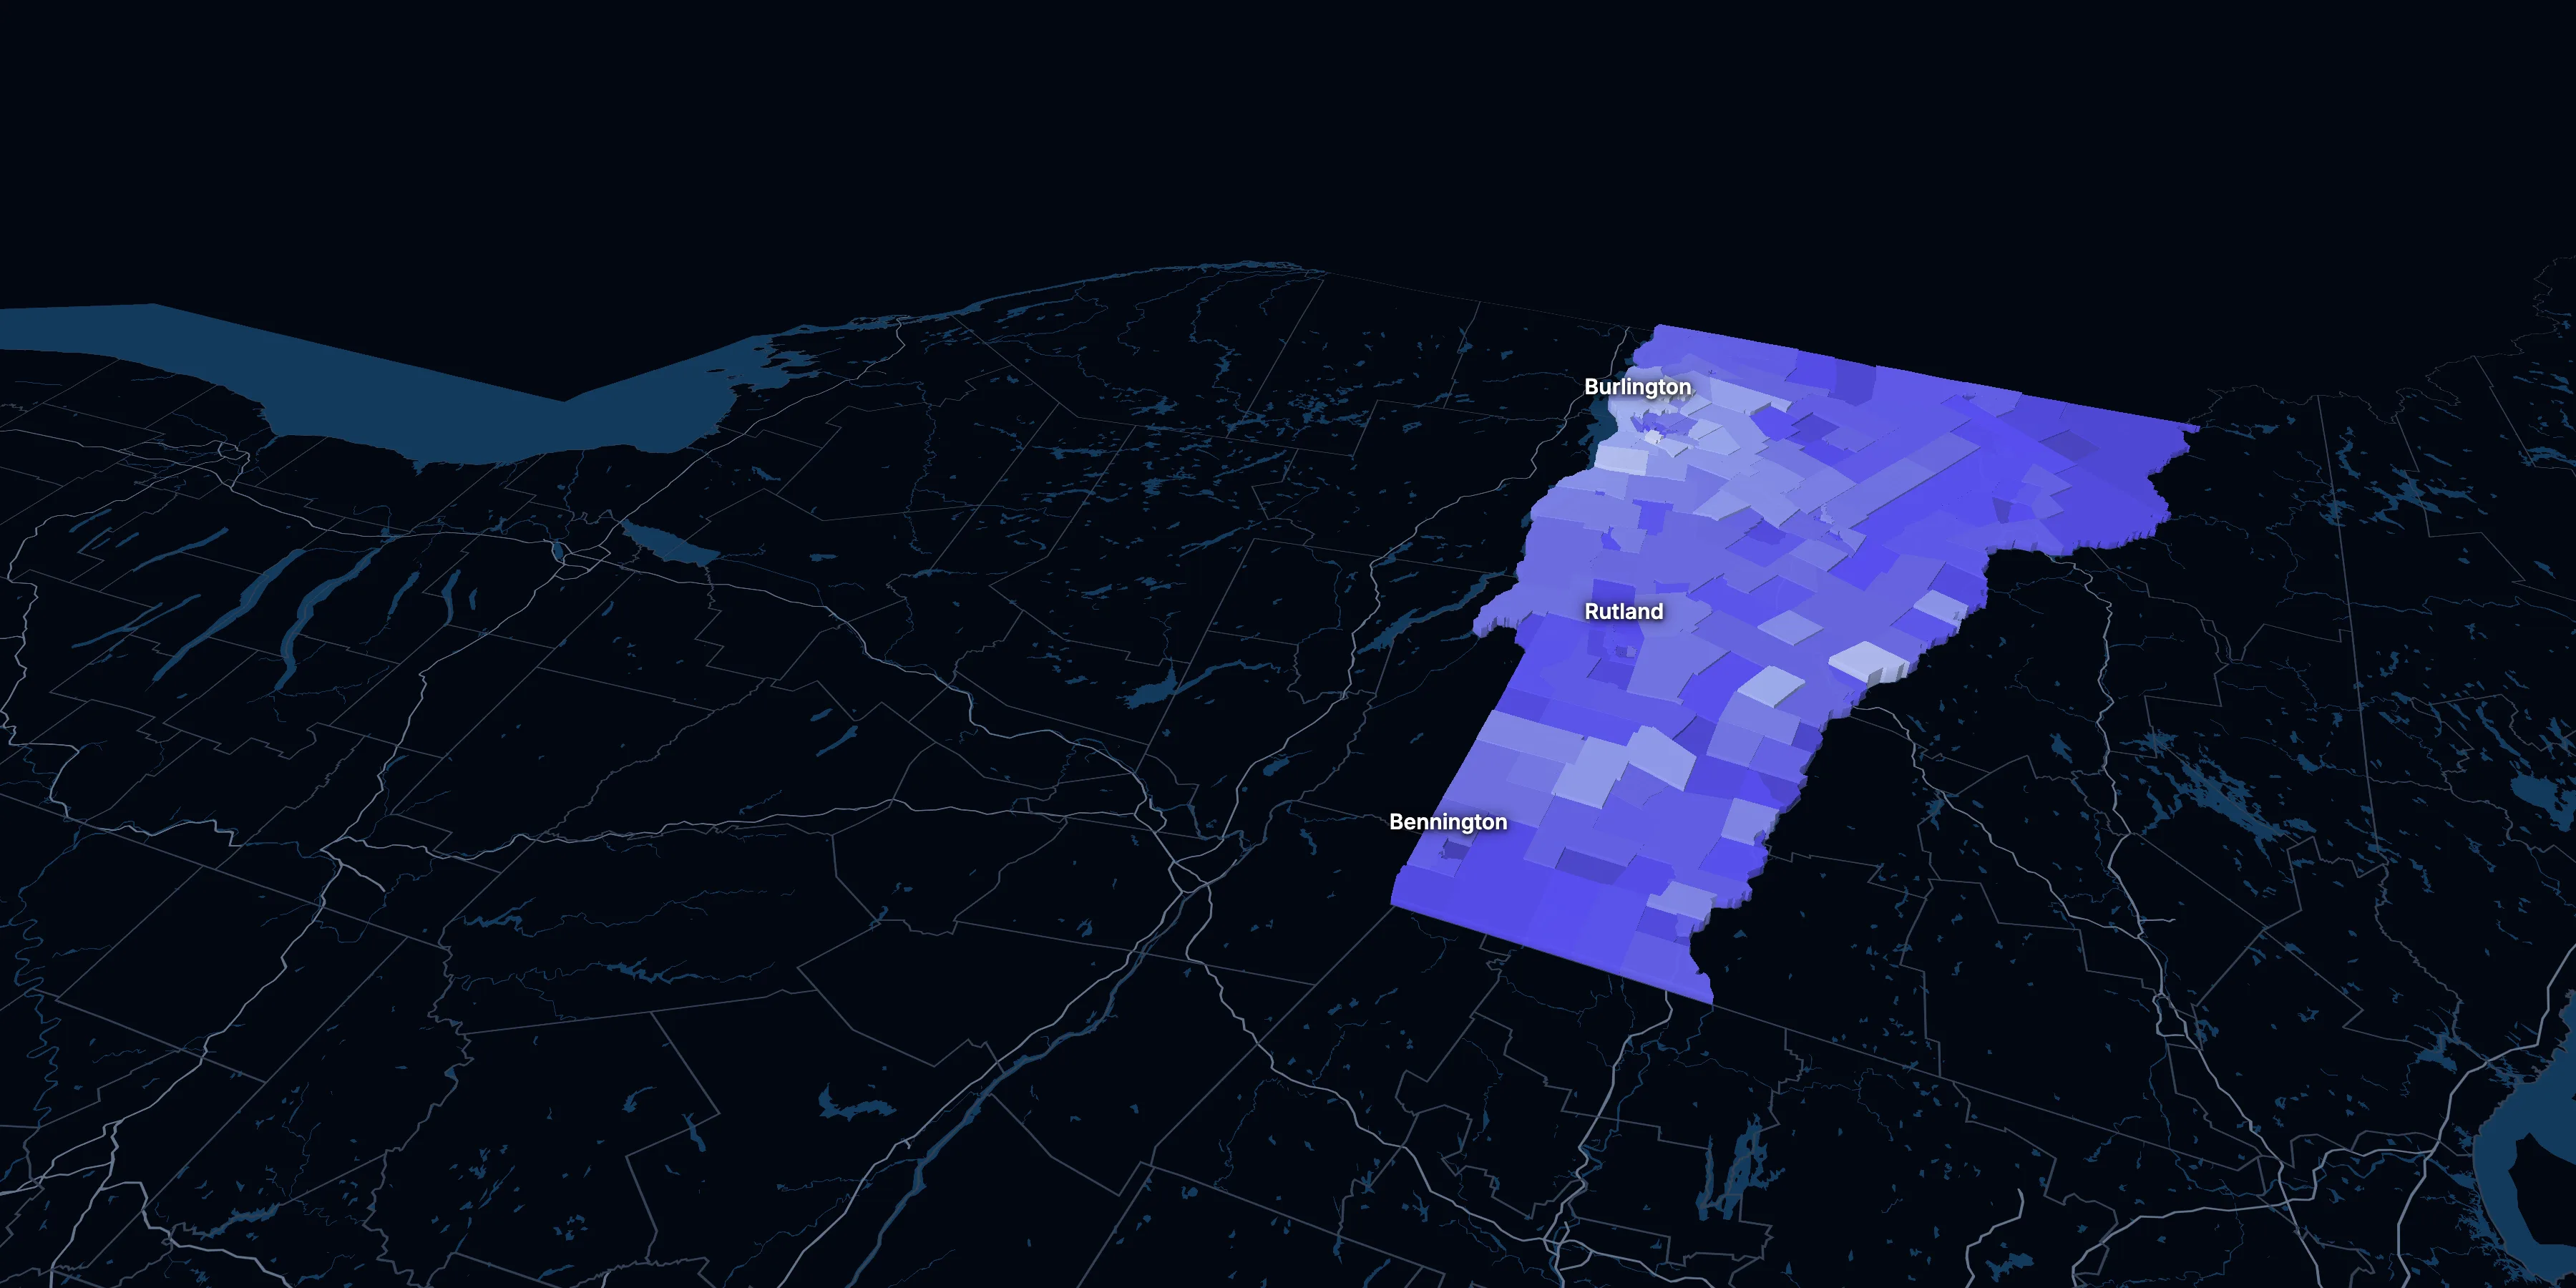
Taller, lighter tracts have higher household incomes
About Vermont
Vermont’s median household income is $86,018 (±$2,458), about the same as the US ($84,780), and its median age is 44.6 (±0.3), according to the ACS 2025 1-year estimates. Its largest city is Burlington.
± is each figure’s margin of error, at 90% confidence, and † marks one too uncertain to lean on. Under each percentage in the tables is the number it counts. How the margins are worked out.
FIPS code 50
Highlights
What stands out in Vermont
The numbers where Vermont sits furthest from the nation, or past a recognized policy benchmark.
Past a policy benchmark
32.5%
HighHomes built before 1960
That’s higher than the US (24.0%). Older homes carry more lead-paint risk: the EPA found lead paint in 69% of homes built from 1940 to 1959.
Furthest from the national picture
24.1%
2nd among states65 and over
That’s higher than the US (19.0%). It’s the 2nd highest of the 50 states and DC.
44.6
3rd among statesMedian age
That’s higher than the US (39.5). It’s the 3rd highest of the 50 states and DC.
16.6%
Lowest among statesUnder 18
That’s lower than the US (21.0%). It’s the lowest of the 50 states and DC.
2.17
Lower than the USPeople per household
That’s lower than the US (2.49). It’s the 4th lowest of the 50 states and DC.
5.5%
Very lowSpeak a language other than English at home
That’s lower than the US (22.9%). It’s the 4th lowest of the 50 states and DC.
2015 to 2025
How Vermont changed in ten years
The state added 18,621 people. It got older, more foreign-born and better educated, and poverty fell 1.0 points.
Population, change since 2015
+3.0% in the state and +6.3% in the US.
Source: ACS 1-year, 2015 to 2025, table A00001.
Show data
| Vermont | United States | |
|---|---|---|
| 2015 | 0.0% | 0.0% |
| 2016 | −0.2% | +0.5% |
| 2017 | −0.4% | +1.3% |
| 2018 | +0.0% | +1.8% |
| 2019 | −0.3% | +2.1% |
| 2021 | +3.1% | +3.3% |
| 2022 | +3.4% | +3.7% |
| 2023 | +3.4% | +4.2% |
| 2024 | +3.6% | +5.8% |
| 2025 | +3.0% | +6.3% |
Embed
Median household income, in 2025 dollars
+10.2% in the state and +10.9% in the US.
Source: ACS 1-year, 2015 to 2025, table A14006.
Show data
| Vermont | United States | |
|---|---|---|
| 2015 | $78,077 | $76,413 |
| 2016 | $78,012 | $77,931 |
| 2017 | $76,153 | $79,891 |
| 2018 | $78,566 | $80,059 |
| 2019 | $79,985 | $83,427 |
| 2021 | $86,772 | $83,521 |
| 2022 | $81,965 | $82,811 |
| 2023 | $86,399 | $82,683 |
| 2024 | $85,503 | $84,339 |
| 2025 | $86,018 | $84,780 |
Embed
Living in poverty
−1.0 points in the state and −3.0 points in the US.
Source: ACS 1-year, 2015 to 2025, table A13004.
Show data
| Vermont | United States | |
|---|---|---|
| 2015 | 10.2% | 14.7% |
| 2016 | 11.9% | 14.0% |
| 2017 | 11.3% | 13.4% |
| 2018 | 11.0% | 13.1% |
| 2019 | 10.2% | 12.3% |
| 2021 | 10.3% | 12.8% |
| 2022 | 10.4% | 12.6% |
| 2023 | 9.7% | 12.5% |
| 2024 | 9.0% | 12.1% |
| 2025 | 9.2% | 11.8% |
Embed
Bachelor’s degree or more
+7.6 points in the state and +6.7 points in the US.
Source: ACS 1-year, 2015 to 2025, table A12001.
Show data
| Vermont | United States | |
|---|---|---|
| 2015 | 36.9% | 30.6% |
| 2016 | 36.4% | 31.3% |
| 2017 | 38.3% | 32.0% |
| 2018 | 38.7% | 32.6% |
| 2019 | 38.7% | 33.1% |
| 2021 | 44.4% | 35.0% |
| 2022 | 44.2% | 35.7% |
| 2023 | 43.7% | 36.2% |
| 2024 | 45.1% | 36.8% |
| 2025 | 44.5% | 37.4% |
Embed
Median gross rent, in 2025 dollars
+5.8% in the state and +18.5% in the US.
Source: ACS 1-year, 2015 to 2025, table A18009.
Show data
| Vermont | United States | |
|---|---|---|
| 2015 | $1,265 | $1,314 |
| 2016 | $1,251 | $1,327 |
| 2017 | $1,258 | $1,340 |
| 2018 | $1,253 | $1,368 |
| 2019 | $1,244 | $1,393 |
| 2021 | $1,336 | $1,427 |
| 2022 | $1,264 | $1,440 |
| 2023 | $1,279 | $1,496 |
| 2024 | $1,363 | $1,537 |
| 2025 | $1,338 | $1,557 |
Embed
Median home value, in 2025 dollars
+17.4% in the state and +39.3% in the US.
Source: ACS 1-year, 2015 to 2025, table A10036.
Show data
| Vermont | United States | |
|---|---|---|
| 2015 | $306,473 | $266,469 |
| 2016 | $302,571 | $277,278 |
| 2017 | $299,644 | $288,124 |
| 2018 | $301,303 | $296,908 |
| 2019 | $296,068 | $305,336 |
| 2021 | $325,256 | $337,116 |
| 2022 | $337,536 | $355,481 |
| 2023 | $353,207 | $361,931 |
| 2024 | $364,624 | $372,685 |
| 2025 | $359,800 | $371,100 |
Embed
ACS 1-year estimates. The dotted stretch of each line spans 2020, when the Census Bureau released no standard 1-year estimates. Dollar values are in 2025 dollars.
| Indicator | 2015 | 2025 | Change |
|---|---|---|---|
| Population | 626,042 | 644,663 | +3.0% |
| Median age | 43.1 | 44.6 | +1.5 years |
| 65 and over | 17.6% | 24.1% | +6.5 points |
| Born outside the US | 4.5% | 5.4% | +0.9 points |
| Hispanic or Latino | 1.7% | 2.8% | +1.2 points |
| Median household income | $78,077 | $86,018 | +10.2% |
| Living in poverty | 10.2% | 9.2% | −1.0 points |
| Bachelor’s degree or more | 36.9% | 44.5% | +7.6 points |
| Households that rent | 29.3% | 27.3% | −2.0 points |
| Median gross rent | $1,265 | $1,338 | +5.8% |
| Median home value | $306,473 | $359,800 | +17.4% |
193 census tracts
Vermont, tract by tract
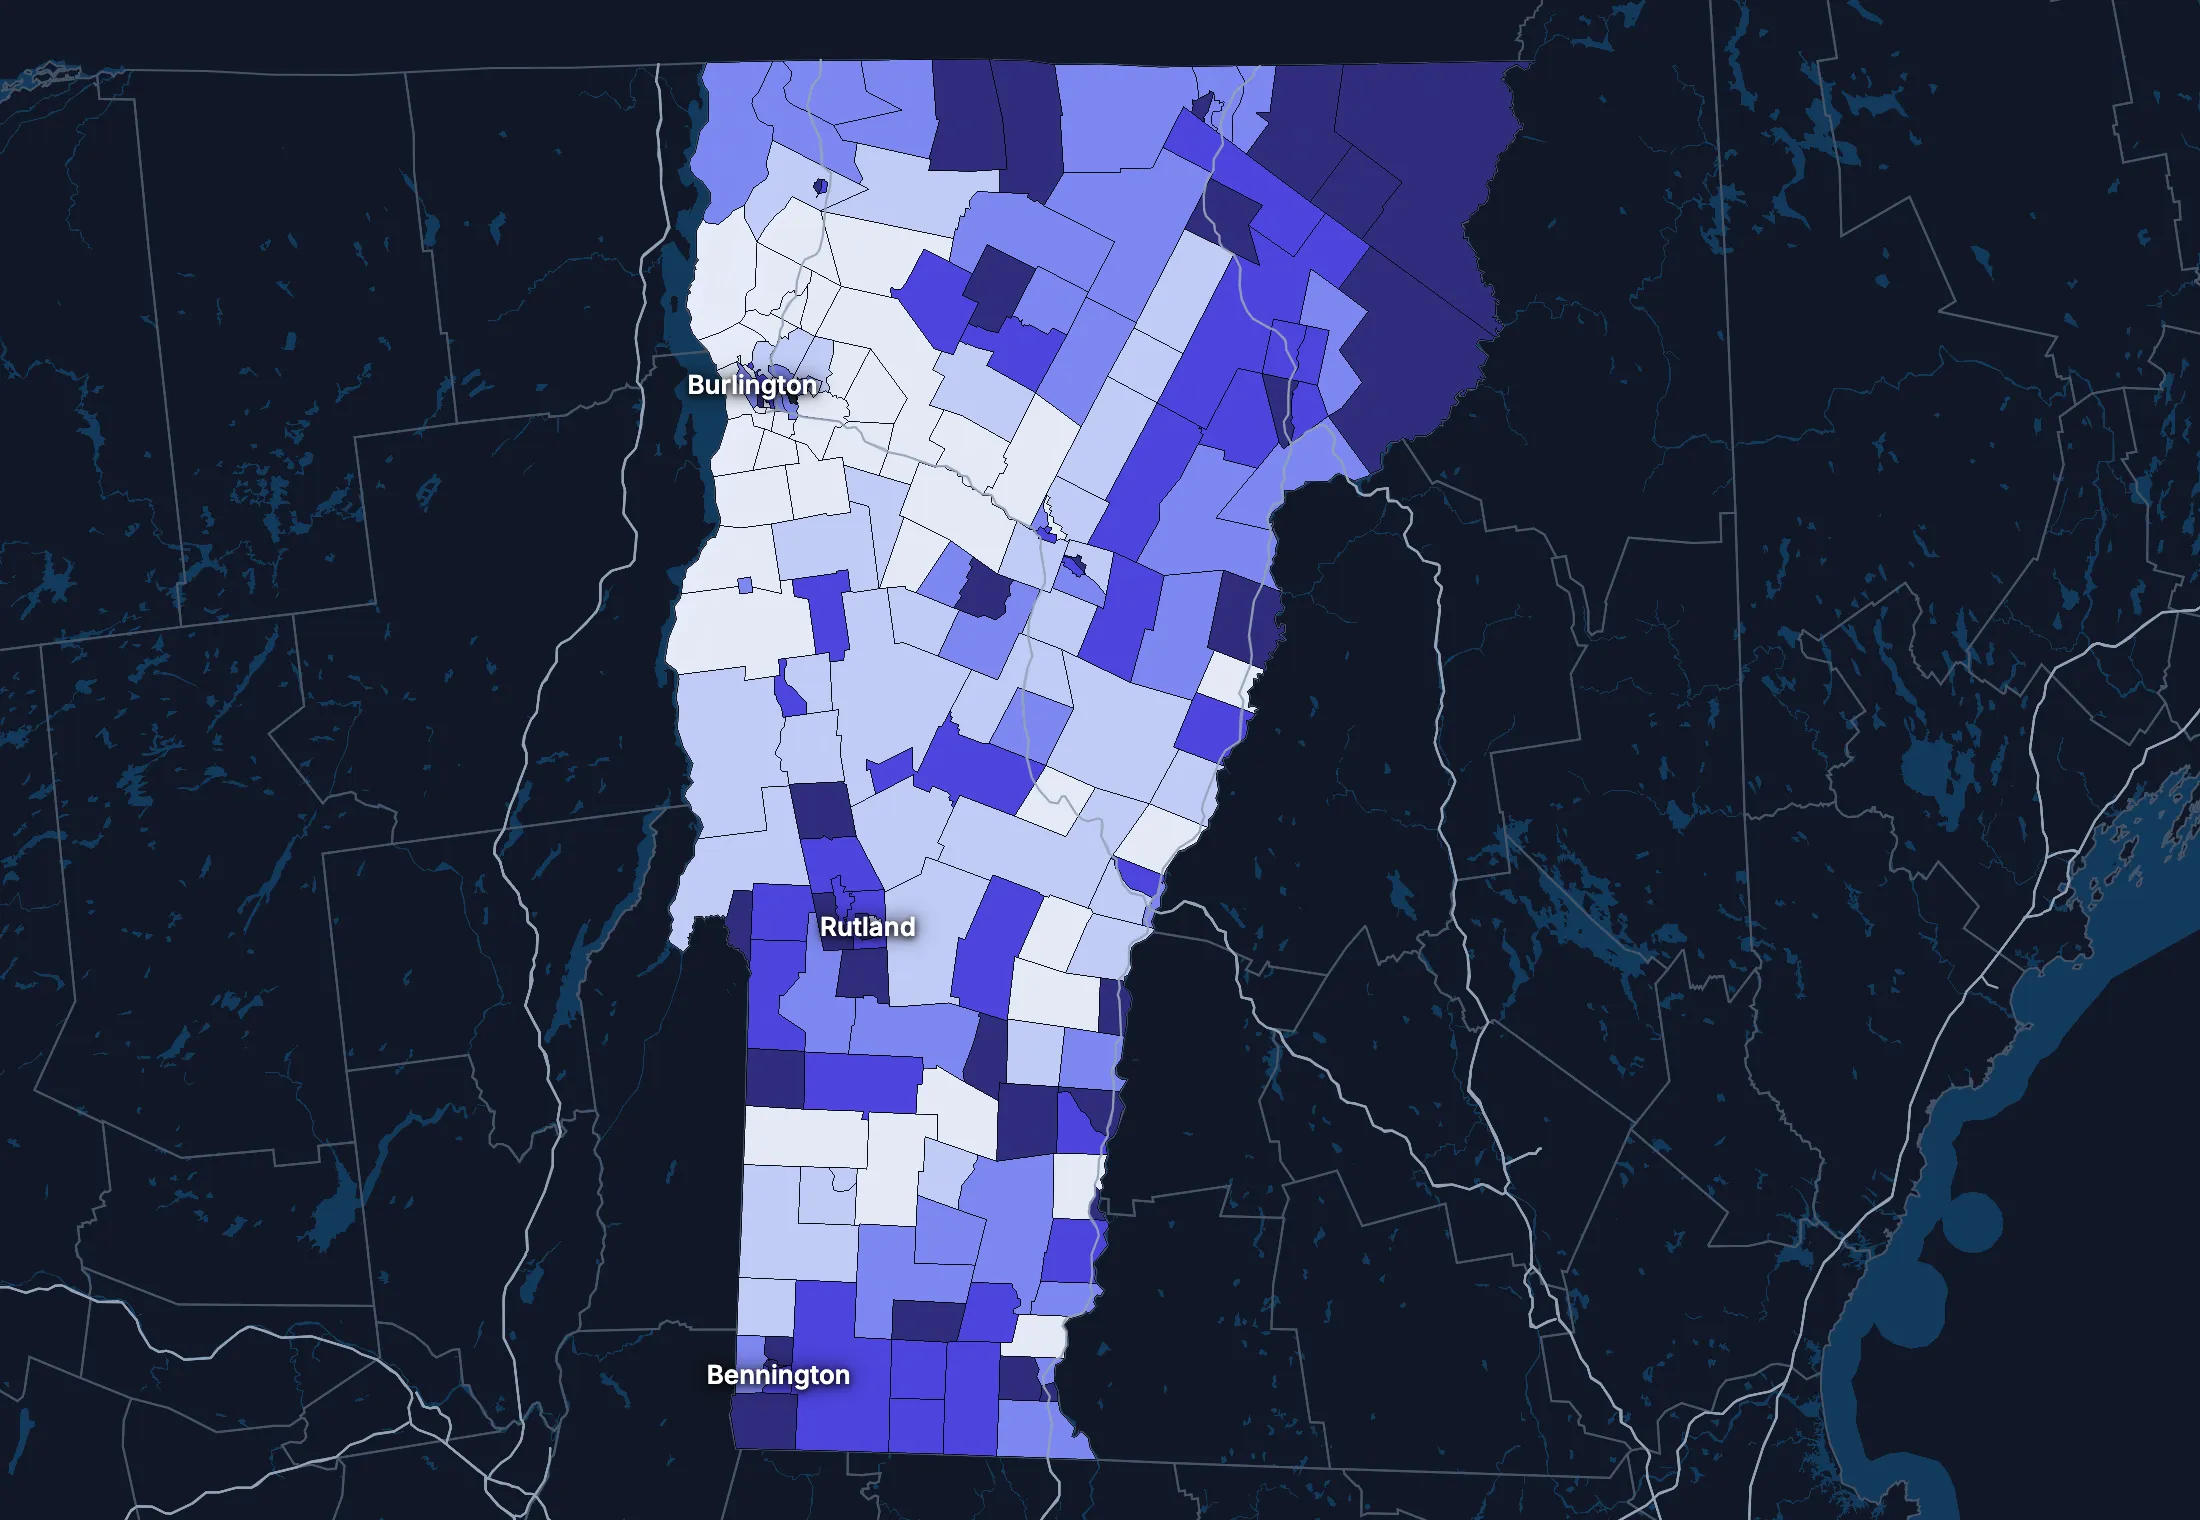
State averages hide a lot. These census tracts are the closest the census comes to neighborhoods.
Where the state’s average misleads
Each tick is one census tract, and the dark line marks the state. Hover over a tick or tap it to see the tract.
Poverty
35 of 192 tracts are at least 1.5 times the state’s overall 10.1%, and 34 are at two-thirds of it or less.
Highest: Tract 41, 56.2%. Lowest: Tract 21.01, 0.1%.
Renters paying 30% or more of income
11 of 190 tracts are at least 1.5 times the state’s overall 45.2%, and 41 are at two-thirds of it or less.
Highest: Tract 9655.01, 84.7%. Lowest: Tract 109, 0.0%.
Adults with a bachelor’s degree
15 of 192 tracts are at least 1.5 times the state’s overall 43.8%, and 29 are at two-thirds of it or less.
Highest: Tract 39, 82.3%. Lowest: Tract 9592, 17.6%.
Median household income
11 of 192 tracts are at least 1.5 times the typical tract’s $80,014, and 13 are at two-thirds of it or less.
Highest: Tract 33.01, $164,294. Lowest: Tract 41, $32,212.
American Community Survey 2020–2024 5-year estimates, by census tract. Income is capped at $250,000+ by the Census Bureau.
People
Who lives in Vermont
Its median age of 44.6 is higher than the US (39.5). 5.4% of residents were born outside the US, and 5.5% speak a language other than English at home.
Age
Source: ACS 2025 1-year, table A01001.
Show data
| Vermont | United States | |
|---|---|---|
| Under 18 | 16.6% ±0.5% , number 106,790 ±3,204 | 21.0% ±<0.1% , number 71,689,151 ±111,800 |
| 18 to 24 | 9.1% ±0.6% , number 58,831 ±4,042 | 9.3% ±<0.1% , number 31,716,680 ±98,660 |
| 25 to 34 | 11.7% ±0.4% , number 75,685 ±2,371 | 13.6% ±<0.1% , number 46,357,354 ±55,690 |
| 35 to 44 | 13.1% ±0.7% , number 84,463 ±4,252 | 13.4% ±<0.1% , number 45,746,189 ±105,700 |
| 45 to 54 | 11.5% ±0.3% , number 74,227 ±1,621 | 11.8% ±<0.1% , number 40,257,563 ±53,540 |
| 55 to 64 | 13.9% ±0.6% , number 89,361 ±3,822 | 12.1% ±<0.1% , number 41,242,904 ±104,700 |
| 65 to 74 | 13.7% ±0.6% , number 88,627 ±3,655 | 10.8% ±<0.1% , number 36,895,650 ±91,520 |
| 75 and over | 10.3% ±0.5% , number 66,679 ±3,041 | 8.2% ±<0.1% , number 27,879,368 ±78,140 |
Embed
Race and ethnicity
Source: ACS 2025 1-year, table A04001.
Show data
| Vermont | United States | |
|---|---|---|
| White, not Hispanic | 87.9% ±0.3% , number 566,750 ±1,880 | 55.0% ±<0.1% , number 187,959,031 ±58,340 |
| Hispanic or Latino | 2.8% ±0.1% , number 18,309 ±375 | 20.5% ±<0.1% , number 69,975,516 ±13,270 |
| Black, not Hispanic | 1.7% ±0.3% , number 10,872 ±2,009 | 11.7% ±<0.1% , number 40,096,453 ±106,200 |
| Asian, not Hispanic | 1.9% ±0.3% , number 12,002 ±1,759 | 6.5% ±<0.1% , number 22,096,709 ±58,340 |
| Other or multiracial | 5.7% ±0.5% , number 36,730 ±3,024 | 6.3% ±<0.1% , number 21,657,150 ±150,100 |
Embed
Language spoken at home
Source: ACS 2025 1-year, table C16001.
Show data
| Vermont | United States | |
|---|---|---|
| English only | 94.5% ±0.6% , number 586,221 ±3,835 | 77.1% ±0.1% , number 249,390,588 ±275,300 |
| Spanish | 1.3% ±0.2% , number 7,757 ±1,506 | 13.9% ±0.1% , number 44,921,985 ±177,800 |
| Other Indo-European | 3.1% ±0.5% , number 19,294 ±3,002 | 4.0% ±<0.1% , number 12,862,980 ±113,500 |
| Asian and Pacific Island | 0.6% ±0.2% , number 3,962 ±1,424 | 3.8% ±<0.1% , number 12,288,841 ±99,740 |
| Arabic and other | 0.5% ±0.3% , number 2,876 ±1,835 | 1.3% ±<0.1% , number 4,116,949 ±71,480 |
Embed
Marital status
Source: ACS 2025 1-year, table A11001.
Show data
| Vermont | United States | |
|---|---|---|
| Now married | 49.7% ±1.2% , number 276,569 ±6,640 | 47.9% ±0.1% , number 135,567,564 ±223,300 |
| Never married | 31.1% ±0.9% , number 173,153 ±5,136 | 34.8% ±0.1% , number 98,647,238 ±152,600 |
| Divorced | 12.4% ±0.7% , number 68,870 ±4,005 | 10.2% ±<0.1% , number 28,879,967 ±112,900 |
| Widowed | 5.8% ±0.5% , number 32,022 ±2,879 | 5.5% ±<0.1% , number 15,599,094 ±69,430 |
| Separated | 1.1% ±0.3% , number 6,011 ±1,446 | 1.6% ±<0.1% , number 4,441,399 ±49,160 |
Embed
Where people lived a year ago
Source: ACS 2025 1-year, table A08001.
Show data
| Vermont | United States | |
|---|---|---|
| Same home | 90.0% ±0.8% , number 575,849 ±5,019 | 88.4% ±0.1% , number 298,889,697 ±214,800 |
| Same county | 4.2% ±0.6% , number 27,039 ±3,652 | 6.0% ±<0.1% , number 20,202,671 ±166,300 |
| Another county in the state | 1.7% ±0.3% , number 10,613 ±1,928 | 3.0% ±<0.1% , number 10,168,097 ±89,190 |
| Another state | 3.8% ±0.6% , number 24,086 ±3,804 | 2.1% ±<0.1% , number 7,025,589 ±81,660 |
| Another country | 0.3% ±0.1% , number 2,206 ±922 | 0.6% ±<0.1% , number 1,984,943 ±47,210 |
Embed
Top countries of birth, among those born abroad
Source: ACS 2020–2024 5-year, table A07001.
Show data
| Vermont | |
|---|---|
| Canada | 15.5% , number 4,295 |
| India | 5.7% , number 1,570 |
| China, Excluding Hong Kong and Taiwan | 5.4% , number 1,497 |
| Germany | 4.6% , number 1,268 |
| England | 3.5% , number 961 |
| Philippines | 3.5% , number 957 |
Embed
All the numbers
| Indicator | Vermont | US | Rank among states* | Table |
|---|---|---|---|---|
| Population | 644,663 | 341,784,859 | 50th | A00001 |
| People per square mile | 70 | 97 | 32nd | A00002 |
| Land area (square miles) | 9,217 | – | – | A00002 |
| Median age | 44.6 ±0.3 | 39.5 ±0.1 | 3rd | A01004 |
| Under 18 | 16.6% ±0.5% , number 106,790 ±3,204 | 21.0% ±<0.1% , number 71,689,151 ±111,800 | 51st | B02002 |
| 65 and over | 24.1% ±0.7% , number 155,306 ±4,755 | 19.0% ±<0.1% , number 64,775,018 ±120,300 | 2nd | B02002 |
| Born outside the US | 5.4% ±0.6% , number 35,107 ±3,895 | 14.7% ±0.1% , number 50,409,320 ±204,800 | 44th | A06001 |
| Speak a language other than English at home | 5.5% ±0.6% , number 33,889 ±4,083 | 22.9% ±0.1% , number 74,190,755 ±244,000 | 48th | C16001 |
| Veterans (adults) | 6.1% ±0.5% , number 33,009 ±2,802 | 5.9% ±<0.1% , number 15,746,228 ±85,320 | 38th | A16002 |
| Living with a disability | 15.9% ±0.8% , number 101,795 ±4,891 | 13.7% ±<0.1% , number 46,271,455 ±126,000 | 15th | B18101 |
| Women 15–50 who had a baby in the past year | 4.2% ±0.9% , number 5,854 ±1,221 | 5.0% ±0.1% , number 4,016,759 ±44,040 | 51st | B13002 |
| Lived in the same home a year ago | 90.0% ±0.8% , number 575,849 ±5,019 | 88.4% ±0.1% , number 298,889,697 ±214,800 | 19th | A08001 |
| White, not Hispanic | 87.9% ±0.3% , number 566,750 ±1,880 | 55.0% ±<0.1% , number 187,959,031 ±58,340 | 1st | A04001 |
| Hispanic or Latino | 2.8% ±0.1% , number 18,309 ±375 | 20.5% ±<0.1% , number 69,975,516 ±13,270 | 49th | A04001 |
| Black, not Hispanic | 1.7% ±0.3% , number 10,872 ±2,009 | 11.7% ±<0.1% , number 40,096,453 ±106,200 | 47th | A04001 |
| Asian, not Hispanic | 1.9% ±0.3% , number 12,002 ±1,759 | 6.5% ±<0.1% , number 22,096,709 ±58,340 | 37th | A04001 |
*1 is the highest. Population is ranked among all states, and the rest among those of 1,000 people or more, whose figures can be ranked. Ranks use 5-year estimates, the only ones covering every state, so they can differ slightly from the figures here.
Income and work
Incomes close to the US
The median household income is $86,018, about the same as the US ($84,780). 9.2% of people live in poverty, and 3.8% have no health insurance, lower than the US (8.4%).
Household income
Source: ACS 2025 1-year, table A14001.
Show data
| Vermont | United States | |
|---|---|---|
| Under $25,000 | 12.9% ±1.0% , number 36,735 ±2,954 | 14.0% ±0.1% , number 18,727,548 ±88,990 |
| $25,000 to $49,999 | 15.0% ±1.2% , number 42,877 ±3,541 | 15.4% ±0.1% , number 20,665,585 ±101,400 |
| $50,000 to $74,999 | 15.7% ±1.3% , number 44,723 ±3,639 | 15.3% ±0.1% , number 20,513,565 ±88,500 |
| $75,000 to $99,999 | 13.2% ±1.1% , number 37,859 ±3,236 | 12.5% ±0.1% , number 16,814,245 ±87,520 |
| $100,000 to $149,999 | 20.0% ±1.3% , number 57,236 ±3,683 | 17.9% ±0.1% , number 24,018,984 ±99,670 |
| $150,000 to $199,999 | 10.2% ±1.2% , number 29,257 ±3,494 | 10.1% ±0.1% , number 13,521,827 ±70,660 |
| $200,000 or more | 13.0% ±1.0% , number 37,063 ±2,975 | 14.8% ±0.1% , number 19,801,668 ±84,120 |
Embed
What residents do for work
Source: ACS 2025 1-year, table A17004.
Show data
| Vermont | United States | |
|---|---|---|
| Education and health care | 29.3% ±1.3% , number 100,266 ±4,791 | 24.4% ±0.1% , number 40,862,193 ±140,800 |
| Professional and business services | 11.6% ±1.0% , number 39,663 ±3,577 | 12.8% ±0.1% , number 21,375,231 ±87,110 |
| Retail trade | 11.2% ±1.1% , number 38,521 ±3,962 | 10.6% ±0.1% , number 17,781,181 ±96,660 |
| Manufacturing | 9.2% ±0.8% , number 31,572 ±2,930 | 9.6% ±0.1% , number 16,064,394 ±91,270 |
| Arts, food and lodging | 9.1% ±0.8% , number 31,047 ±2,801 | 8.9% ±0.1% , number 14,811,502 ±87,840 |
| Construction | 6.8% ±0.7% , number 23,390 ±2,535 | 6.7% ±<0.1% , number 11,254,981 ±79,620 |
| Public administration | 5.9% ±0.7% , number 20,153 ±2,585 | 4.7% ±<0.1% , number 7,944,601 ±69,540 |
| Other services | 4.2% ±0.5% , number 14,484 ±1,887 | 4.8% ±<0.1% , number 7,958,726 ±65,120 |
Embed
Where workers come from and go
Vermont has 303,206 jobs and 301,990 employed residents. 33,136 people commute in to work and 31,920 commute out, while 270,070 both live and work here. The most commuters come from New Hampshire.
Most commuters come from
- New Hampshire: 11,314
- New York: 10,902
- Massachusetts: 5,482
Most residents commute to
- New Hampshire: 17,342
- New York: 6,060
- Massachusetts: 5,113
Show data
| Vermont | |
|---|---|
| Live and work here | 270,070 |
| Work here, live elsewhere | 33,136 |
| Live here, work elsewhere | 31,920 |
Embed
All the numbers
| Indicator | Vermont | US | Rank among states* | Table |
|---|---|---|---|---|
| Median household income | $86,018 ±$2,458 | $84,780 ±$215 | 20th | A14006 |
| Income per person | $50,244 ±$1,659 | $47,171 ±$115 | 15th | A14024 |
| Income inequality (Gini index) | 0.457 ±0.013 | 0.482 ±0.001 | 40th | A14028 |
| Living in poverty | 9.2% ±0.8% , number 57,320 ±5,264 | 11.8% ±0.1% , number 39,264,183 ±277,400 | 40th | A13004 |
| Unemployment rate | 2.8% ±0.5% , number 9,823 ±1,708 | 4.9% ±<0.1% , number 8,574,594 ±64,350 | 46th | A17005 |
| No health insurance | 3.8% ±0.5% , number 24,334 ±2,883 | 8.4% ±<0.1% , number 28,323,306 ±152,000 | 48th | A20001 |
*1 is the highest. Population is ranked among all states, and the rest among those of 1,000 people or more, whose figures can be ranked. Ranks use 5-year estimates, the only ones covering every state, so they can differ slightly from the figures here.
Education
More college degrees than the US
44.5% of adults 25 and over have a bachelor’s degree or more, higher than the US (37.4%).
Highest level of education
Source: ACS 2025 1-year, table A12001.
Show data
| Vermont | United States | |
|---|---|---|
| Less than high school | 4.6% ±0.5% , number 21,908 ±2,346 | 9.4% ±0.1% , number 22,321,002 ±120,500 |
| High school only | 26.6% ±1.2% , number 127,562 ±5,873 | 25.6% ±0.1% , number 61,096,726 ±203,400 |
| Some college | 24.3% ±1.2% , number 116,224 ±5,706 | 27.7% ±0.1% , number 65,920,977 ±173,500 |
| Bachelor’s degree | 24.5% ±1.0% , number 117,213 ±4,854 | 22.3% ±0.1% , number 53,224,312 ±196,700 |
| Graduate degree | 20.1% ±1.1% , number 96,135 ±5,335 | 15.0% ±0.1% , number 35,816,011 ±159,400 |
Embed
All the numbers
| Indicator | Vermont | US | Rank among states* | Table |
|---|---|---|---|---|
| Bachelor’s degree or more | 44.5% ±1.5% , number 213,348 ±7,212 | 37.4% ±0.1% , number 89,040,323 ±253,200 | 4th | A12001 |
| High school graduate or more | 95.4% ±2.2% , number 457,134 ±10,910 | 90.6% ±0.2% , number 216,058,026 ±368,200 | 1st | A12001 |
*1 is the highest. Population is ranked among all states, and the rest among those of 1,000 people or more, whose figures can be ranked. Ranks use 5-year estimates, the only ones covering every state, so they can differ slightly from the figures here.
Housing
Home values kept pace with incomes
27.3% of households rent, lower than the US (34.7%). The median home is worth $359,800 and the median rent is $1,338. After inflation, home values rose 17% from 2015 to 2025, while household income rose 10%.
Housing costs and income, 2015 to 2025, after inflation
Source: ACS 1-year, table A10036, A18009, A14006.
Show data
| Vermont | United States | |
|---|---|---|
| Median home value | +17.4% | +39.3% |
| Median rent | +5.8% | +18.5% |
| Median household income | +10.2% | +10.9% |
Embed
Types of homes
Source: ACS 2025 1-year, table A10032.
Show data
| Vermont | United States | |
|---|---|---|
| Single-family, detached | 66.1% ±1.3% , number 228,845 ±4,489 | 60.9% ±0.1% , number 90,335,844 ±173,300 |
| Single-family, attached | 3.9% ±0.5% , number 13,429 ±1,742 | 6.4% ±<0.1% , number 9,527,703 ±51,230 |
| 2 to 4 units | 11.3% ±1.0% , number 38,971 ±3,348 | 7.5% ±0.1% , number 11,109,005 ±75,790 |
| 5 to 19 units | 7.4% ±1.0% , number 25,589 ±3,312 | 8.7% ±0.1% , number 12,829,882 ±97,590 |
| 20 or more units | 5.0% ±0.7% , number 17,438 ±2,406 | 11.1% ±0.1% , number 16,381,450 ±92,310 |
| Mobile homes and other | 6.4% ±0.8% , number 22,003 ±2,709 | 5.4% ±<0.1% , number 8,045,083 ±53,680 |
Embed
When homes were built
Source: ACS 2025 1-year, table A10055.
Show data
| Vermont | United States | |
|---|---|---|
| 2010 or later | 9.6% ±1.0% , number 27,313 ±2,893 | 15.1% ±0.1% , number 20,257,912 ±101,300 |
| 2000 to 2009 | 10.6% ±1.0% , number 30,301 ±2,893 | 13.8% ±0.1% , number 18,535,840 ±92,260 |
| 1980 to 1999 | 25.7% ±1.4% , number 73,442 ±4,144 | 24.1% ±0.1% , number 32,332,570 ±118,900 |
| 1960 to 1979 | 21.7% ±1.5% , number 61,967 ±4,215 | 22.9% ±0.1% , number 30,726,302 ±110,000 |
| Before 1960 | 32.5% ±1.7% , number 92,727 ±4,985 | 24.0% ±0.1% , number 32,210,798 ±121,500 |
Embed
All the numbers
| Indicator | Vermont | US | Rank among states* | Table |
|---|---|---|---|---|
| Housing units | 346,275 ±732 | – | – | A10001 |
| Households | 285,750 ±2,748 | – | – | A10008 |
| People per household | 2.17 ±0.02 | 2.49 ±0.01 | 48th | A10003 |
| Households that rent | 27.3% ±1.3% , number 78,080 ±3,871 | 34.7% ±0.1% , number 46,551,688 ±193,200 | 48th | A10060 |
| Vacant homes | 17.5% ±0.8% , number 60,525 ±2,764 | 9.6% ±0.1% , number 14,165,545 ±137,100 | 2nd | A10047, A10060 |
| Median gross rent | $1,338 ±$57 | $1,557 ±$4 | 26th | A18009 |
| Median home value | $359,800 ±$8,499 | $371,100 ±$646 | 24th | A10036 |
| Renters paying 30% or more of income | 46.1% ±4.3% , number 35,969 ±3,824 | 48.3% ±0.2% , number 22,486,693 ±122,100 | 24th | A18002 |
| Owners paying 30% or more of income | 24.4% ±1.7% , number 50,775 ±3,581 | 24.2% ±0.1% , number 21,201,943 ±93,050 | 10th | A10040 |
| Homes built before 1960 | 32.5% ±1.7% , number 92,727 ±4,985 | 24.0% ±0.1% , number 32,210,798 ±121,500 | 12th | A10055 |
*1 is the highest. Population is ranked among all states, and the rest among those of 1,000 people or more, whose figures can be ranked. Ranks use 5-year estimates, the only ones covering every state, so they can differ slightly from the figures here.
Getting around
How people get around
69.3% of workers drive alone and 15.9% work from home. 33.0% of those who travel to work spend 30 minutes or more getting there, and 5.9% of households have no vehicle.
How people get to work
Source: ACS 2025 1-year, table A09005.
Show data
| Vermont | United States | |
|---|---|---|
| Drive alone | 69.3% ±1.5% , number 233,098 ±6,464 | 69.8% ±0.1% , number 115,297,377 ±192,900 |
| Carpool | 8.4% ±1.0% , number 28,272 ±3,283 | 8.9% ±0.1% , number 14,712,170 ±97,240 |
| Public transit | 0.9% ±0.4% , number 3,086 ±1,181 | 4.3% ±<0.1% , number 7,100,386 ±63,330 |
| Walk | 4.0% ±0.5% , number 13,379 ±1,825 | 2.4% ±<0.1% , number 4,016,469 ±41,070 |
| Work from home | 15.9% ±1.3% , number 53,430 ±4,358 | 12.9% ±0.1% , number 21,288,393 ±105,700 |
| Other | 1.6% ±0.4% , number 5,229 ±1,373 | 1.7% ±<0.1% , number 2,799,658 ±41,510 |
Embed
Time spent getting to work
Source: ACS 2025 1-year, table B09001.
Show data
| Vermont | United States | |
|---|---|---|
| Under 10 minutes | 15.0% ±1.4% , number 42,461 ±4,046 | 12.0% ±0.1% , number 17,199,225 ±93,440 |
| 10 to 19 minutes | 30.6% ±1.8% , number 86,734 ±5,479 | 27.8% ±0.1% , number 40,059,540 ±137,700 |
| 20 to 29 minutes | 21.4% ±1.5% , number 60,503 ±4,476 | 21.0% ±0.1% , number 30,221,743 ±111,100 |
| 30 to 39 minutes | 16.8% ±1.2% , number 47,672 ±3,619 | 17.1% ±0.1% , number 24,659,138 ±103,800 |
| 40 to 59 minutes | 10.6% ±0.9% , number 30,045 ±2,520 | 12.6% ±0.1% , number 18,104,709 ±97,070 |
| 60 minutes or more | 5.5% ±0.8% , number 15,649 ±2,270 | 9.5% ±0.1% , number 13,681,705 ±84,440 |
Embed
Vehicles per household
Source: ACS 2025 1-year, table A10030.
Show data
| Vermont | United States | |
|---|---|---|
| None | 5.9% ±0.8% , number 16,910 ±2,428 | 8.8% ±0.1% , number 11,781,997 ±77,240 |
| One | 34.8% ±1.7% , number 99,389 ±4,899 | 33.1% ±0.1% , number 44,424,682 ±160,700 |
| Two | 39.9% ±1.5% , number 114,009 ±4,540 | 36.0% ±0.1% , number 48,200,889 ±176,800 |
| Three or more | 19.4% ±1.3% , number 55,442 ±3,685 | 22.1% ±0.1% , number 29,655,854 ±113,300 |
Embed
All the numbers
| Indicator | Vermont | US | Rank among states* | Table |
|---|---|---|---|---|
| Drive to work alone | 69.3% ±1.5% , number 233,098 ±6,464 | 69.8% ±0.1% , number 115,297,377 ±192,900 | 35th | A09005 |
| Take public transit | 0.9% ±0.4% , number 3,086 ±1,181 | 4.3% ±<0.1% , number 7,100,386 ±63,330 | 32nd | A09005 |
| Work from home | 15.9% ±1.3% , number 53,430 ±4,358 | 12.9% ±0.1% , number 21,288,393 ±105,700 | 12th | A09005 |
| Commute 30 minutes or more | 33.0% ±1.6% , number 93,366 ±4,960 | 39.2% ±0.1% , number 56,445,552 ±165,300 | 32nd | B09001 |
| Households with no vehicle | 5.9% ±0.9% , number 16,910 ±2,475 | 8.8% ±<0.1% , number 11,781,997 ±64,240 | 28th | A10030 |
*1 is the highest. Population is ranked among all states, and the rest among those of 1,000 people or more, whose figures can be ranked. Ranks use 5-year estimates, the only ones covering every state, so they can differ slightly from the figures here.
Places
The largest cities in Vermont
Population, from the latest estimates available. Figures cover the whole of each place.
Largest places
- Burlington: 44,675
- South Burlington: 20,756
- Rutland: 15,712
- Essex Junction: 10,803
- Bennington: 9,245
- Barre: 8,412
- Winooski: 8,293
- Montpelier: 8,014
States like this one
- Pennsylvania: 13,018,639
- New Hampshire: 1,394,868
- Maine: 1,387,817
- Delaware: 1,021,191
States at least a third this size, with the closest income, education, age, housing and origins.
Every county and place in Vermont
Find any county, city, town, metro area, ZIP code, school district or district in Vermont.
Counties
Each of the 14 counties with its population, from ACS 2020–2024 5-year estimates.
- Addison County37,664
- Bennington County37,269
- Caledonia County30,475
- Chittenden County169,758
- Essex County5,982
- Franklin County50,638
- Grand Isle County7,450
- Lamoille County26,148
- Orange County29,761
- Orleans County27,606
- Rutland County60,425
- Washington County60,017
- Windham County45,923
- Windsor County57,990
Cities, towns and other places
Each of the 179 with its population, from ACS 2020–2024 5-year estimates. Census-designated places are communities without a local government of their own, drawn by the Census Bureau so they can be counted.
- Albany135
- Alburgh486
- Algiers242
- Arlington1,623
- Ascutney381
- Bakersfield340
- Barnet61
- Barre8,412
- Barton730
- Beecher Falls67
- Bellows Falls2,891
- Bennington9,245
- Benson193
- Bethel521
- Bolton17
- Bolton Valley252
- Bradford1,097
- Brandon1,927
- Brattleboro7,657
- Bristol2,142
- Burlington44,675
- Cabot243
- Cambridge173
- Canaan293
- Castleton1,052
- Castleton Four Corners732
- Cavendish171
- Chelsea416
- Chester1,298
- Chimney Hill75
- Chittenden93
- Concord143
- Coventry71
- Danby172
- Danville401
- Derby Center693
- Derby Line783
- Dorset310
- East Barre1,017
- East Burke151
- East Charlotte102
- East Dorset177
- East Middlebury332
- East Poultney176
- Enosburg Falls1,570
- Essex Junction10,803
- Fair Haven2,537
- Fairfax1,099
- Fairlee54
- Gilman165
- Glover282
- Grafton82
- Graniteville244
- Greensboro115
- Greensboro Bend224
- Groton430
- Hanksville41
- Hardwick1,046
- Harmonyville151
- Hartford Village426
- Hartland572
- Highgate Center401
- Highgate Springs1
- Hinesburg733
- Huntington516
- Huntington Center181
- Hyde Park513
- Irasburg253
- Island Pond852
- Jacksonville106
- Jamaica59
- Jeffersonville718
- Jericho1,346
- Jericho Center241
- Johnson1,799
- Killington Village506
- Lincoln279
- Londonderry137
- Lowell232
- Ludlow808
- Lunenburg201
- Lyndon160
- Lyndon Center291
- Lyndonville1,408
- Manchester676
- Manchester Center2,037
- Marshfield470
- Middlebury7,220
- Middletown Springs181
- Milton3,555
- Montpelier8,014
- Morrisville2,664
- New Haven221
- Newbury393
- Newfane141
- Newport4,394
- Newport Center280
- North Bennington1,336
- North Clarendon297
- North Hartland322
- North Hyde Park396
- North Pownal308
- North Springfield427
- North Troy506
- North Westminster125
- Northfield3,766
- Norwich1,147
- Old Bennington182
- Orleans809
- Pawlet330
- Peacham237
- Pittsford891
- Plainfield450
- Poultney1,033
- Pownal570
- Pownal Center456
- Proctor1,586
- Proctorsville427
- Putney393
- Quechee412
- Randolph2,007
- Readsboro299
- Richford1,573
- Richmond753
- Rochester288
- Rutland15,712
- Saxtons River553
- Sheffield190
- Shelburne6,499
- South Barre1,346
- South Burlington20,756
- South Hero219
- South Lincoln189
- South Londonderry68
- South Royalton458
- South Shaftsbury566
- South Woodstock79
- Springfield4,237
- St. Albans6,954
- St. George411
- St. Johnsbury5,859
- Stamford466
- Stowe1,003
- Stratton Mountain87
- Sutton160
- Swanton2,670
- Townshend160
- Troy219
- Underhill Center40
- Underhill Flats434
- Vergennes2,565
- Waitsfield193
- Wallingford643
- Wardsboro48
- Waterbury1,753
- Waterbury Center273
- Websterville471
- Wells308
- Wells River340
- West Brattleboro2,749
- West Burke161
- West Charlotte208
- West Dummerston46
- West Pawlet368
- West Rutland2,125
- West Woodstock657
- Westford153
- Westminster497
- Weston52
- White River Junction3,364
- Whitingham178
- Wilder3,087
- Williamstown1,660
- Wilmington348
- Windsor2,060
- Winooski8,293
- Wolcott212
- Woodstock936
- Worcester113
Metro and micro areas
Each of the 6 that reach into Vermont, with its whole population, from ACS 2020–2024 5-year estimates. Metro and micro areas are counties tied together by commuting, drawn by the Office of Management and Budget.
ZIP codes
Each of the 259 with people in it, by the town it's centered in, from ACS 2020–2024 5-year estimates. These are the Census Bureau's ZIP Code Tabulation Areas, which follow the Postal Service's ZIP codes as closely as census blocks allow.
- 05001Hartford Village9,751
- 05030Ascutney111
- 05031South Royalton44
- 05032Bethel2,817
- 05033Bradford3,081
- 05034West Woodstock180
- 05035Killington Village772
- 05036Williamstown1,169
- 05037Windsor949
- 05038Chelsea1,371
- 05039Chelsea935
- 05040Bradford589
- 05041Chelsea372
- 05042Barnet602
- 05043Fairlee907
- 05045Fairlee1,779
- 05046Groton1,241
- 05048North Hartland2,506
- 05050Barnet209
- 05051Newbury927
- 05052North Hartland346
- 05053Quechee333
- 05055Norwich3,463
- 05056Ludlow352
- 05058Fairlee128
- 05059Quechee510
- 05060Randolph4,268
- 05061Randolph1,788
- 05062South Woodstock705
- 05065South Royalton1,198
- 05067Woodstock291
- 05068South Royalton2,987
- 05069Wells River778
- 05070South Royalton510
- 05071South Woodstock130
- 05072Chelsea751
- 05073Quechee64
- 05075Fairlee1,438
- 05076Groton495
- 05077Chelsea1,116
- 05079Chelsea914
- 05081Wells River842
- 05083Fairlee193
- 05084Quechee183
- 05086East Barre647
- 05088Wilder581
- 05089Windsor4,462
- 05091Woodstock3,443
- 05101Saxtons River4,165
- 05141Grafton66
- 05142Cavendish564
- 05143Chester4,767
- 05146Grafton678
- 05148Londonderry1,401
- 05149Ludlow2,241
- 05150North Springfield418
- 05151Ascutney1,590
- 05152East Dorset448
- 05153Cavendish851
- 05154Saxtons River479
- 05155South Londonderry735
- 05156Springfield9,116
- 05158North Westminster1,151
- 05161Weston676
- 05201Bennington14,998
- 05250Arlington3,847
- 05251Dorset1,674
- 05252Arlington455
- 05253East Dorset516
- 05254Manchester439
- 05255Manchester4,108
- 05257North Bennington2,807
- 05260North Pownal384
- 05261Pownal2,171
- 05262South Shaftsbury2,043
- 05301West Brattleboro16,955
- 05340Manchester Center745
- 05341Wardsboro728
- 05342Jacksonville428
- 05343Jamaica955
- 05344Jacksonville514
- 05345Newfane1,667
- 05346Putney5,177
- 05350Readsboro844
- 05351Newfane190
- 05352Stamford926
- 05353Townshend1,327
- 05354Algiers2,709
- 05355Wardsboro724
- 05356Wardsboro738
- 05358Jacksonville403
- 05359Jamaica757
- 05360Stratton Mountain512
- 05361Whitingham1,058
- 05362West Dummerston152
- 05363Chimney Hill1,886
- 05401Burlington31,662
- 05403South Burlington20,614
- 05404Winooski8,293
- 05405Burlington3,136
- 05408Burlington10,019
- 05439Winooski1,228
- 05440Alburgh1,832
- 05441Bakersfield540
- 05442Bakersfield422
- 05443Bristol6,549
- 05444Cambridge1,752
- 05445West Charlotte3,916
- 05446Burlington16,452
- 05447Richford120
- 05448Bakersfield1,010
- 05450Enosburg Falls5,428
- 05452Essex Junction22,626
- 05454Fairfax5,364
- 05455St. Albans1,286
- 05456Vergennes998
- 05457Highgate Center1,696
- 05458South Hero2,278
- 05459Highgate Center1,925
- 05461Hinesburg4,898
- 05462Huntington Center1,810
- 05463Alburgh577
- 05464Jeffersonville2,998
- 05465Jericho Center5,735
- 05468Milton13,324
- 05471Lowell719
- 05472New Haven1,938
- 05473East Charlotte1,423
- 05474St. Albans1,263
- 05476Richford3,218
- 05477Richmond4,454
- 05478St. Albans15,580
- 05482Shelburne7,969
- 05483Highgate Center1,717
- 05486South Hero1,500
- 05487Hanksville1,598
- 05488Swanton8,469
- 05489Underhill Flats3,484
- 05491Vergennes5,767
- 05492Bakersfield725
- 05494Westford1,603
- 05495St. George10,956
- 05602Montpelier12,250
- 05640Worcester259
- 05641Websterville16,936
- 05647Cabot1,122
- 05648Worcester483
- 05649East Barre427
- 05650Marshfield1,029
- 05651Plainfield1,510
- 05652North Hyde Park816
- 05653Albany535
- 05654Graniteville953
- 05655Hyde Park3,000
- 05656Johnson3,458
- 05658Marshfield1,725
- 05660Waterbury1,882
- 05661Morrisville6,227
- 05663Northfield6,840
- 05666Plainfield17
- 05667Plainfield2,412
- 05669Northfield768
- 05672Stowe5,285
- 05673Waitsfield2,570
- 05674Waitsfield1,585
- 05675East Barre898
- 05676Waterbury5,032
- 05677Waterbury Center2,290
- 05678Websterville228
- 05679Williamstown3,147
- 05680Wolcott2,003
- 05681Hardwick119
- 05682Worcester1,149
- 05701Rutland20,382
- 05730Ludlow525
- 05731Benson35
- 05732Castleton Four Corners1,187
- 05733Brandon6,015
- 05734Middlebury1,297
- 05735Castleton3,651
- 05736West Rutland408
- 05737Chittenden639
- 05738North Clarendon1,295
- 05739Danby1,294
- 05742Wallingford803
- 05743Benson4,160
- 05744Proctor372
- 05747South Lincoln361
- 05748Rochester435
- 05751Killington Village785
- 05753Middlebury11,094
- 05757Middletown Springs791
- 05758Ludlow700
- 05759North Clarendon1,900
- 05760Benson993
- 05761Pawlet1,081
- 05762Rochester387
- 05763Pittsford3,037
- 05764East Poultney3,106
- 05765Proctor1,798
- 05766East Middlebury508
- 05767Rochester1,393
- 05768Pawlet70
- 05769East Middlebury1,238
- 057701,185
- 05772Bethel782
- 05773Wallingford2,279
- 05774Wells1,102
- 05775West Pawlet649
- 05776Dorset341
- 05777West Rutland3,229
- 05778Brandon990
- 05819St. Johnsbury9,106
- 05820Albany300
- 05821Peacham1,109
- 05822Barton2,107
- 05824Concord1,155
- 05825Coventry126
- 05826Greensboro839
- 05827Albany630
- 05828Danville2,092
- 05829Derby Line1,688
- 05830Derby Line1,534
- 05832East Burke969
- 05833Island Pond28
- 05836Greensboro Bend1,531
- 05837East Burke301
- 05839Glover664
- 0584034
- 05841Greensboro297
- 05842Greensboro Bend458
- 05843Hardwick2,198
- 05845Irasburg1,464
- 05846Island Pond1,315
- 05847Lowell1,070
- 05850Lyndon Center307
- 05851Lyndon Center6,024
- 05853Island Pond743
- 05855Newport7,412
- 05857Newport Center1,467
- 05858East Burke340
- 05859North Troy2,123
- 05860Orleans2,728
- 05862Peacham361
- 05866Sheffield684
- 05867Sutton634
- 05868Newport Center40
- 05871West Burke1,524
- 05872Island Pond809
- 05873Danville864
- 05874Troy568
- 05875Glover542
- 05901Canaan9
- 05902Beecher Falls104
- 05903Canaan801
- 05904Gilman187
- 05905968
- 05906Lunenburg1,210
- 05907108
Towns and townships
Each of the 239 with people in it, from ACS 2020–2024 5-year estimates: the county subdivisions that are governments of their own. A city, borough or village that is one too is listed with the places above.
- Addison town1,175
- Albany town934
- Alburgh town1,832
- Andover town616
- Arlington town2,598
- Athens town431
- Averill town9
- Bakersfield town1,109
- Baltimore town361
- Barnard town1,211
- Barnet town1,855
- Barre town8,005
- Barton town2,815
- Belvidere town422
- Bennington town15,249
- Benson town784
- Berkshire town1,745
- Berlin town2,880
- Bethel town1,736
- Bloomfield town234
- Bolton town1,163
- Bradford town2,827
- Braintree town1,026
- Brandon town4,120
- Brattleboro town12,122
- Bridgewater town980
- Bridport town1,235
- Brighton town1,167
- Bristol town3,778
- Brookfield town1,486
- Brookline town531
- Brownington town1,144
- Brunswick town109
- Burke town1,317
- Cabot town1,579
- Calais town1,713
- Cambridge town3,767
- Canaan town810
- Castleton town4,453
- Cavendish town1,242
- Charleston town936
- Charlotte town3,916
- Chelsea town1,223
- Chester town2,992
- Chittenden town1,318
- Clarendon town2,460
- Colchester town17,648
- Concord town1,145
- Corinth town1,539
- Cornwall town1,208
- Coventry town917
- Craftsbury town1,352
- Danby town1,133
- Danville town2,360
- Derby town4,537
- Dorset town2,092
- Dover town1,466
- Dummerston town2,090
- Duxbury town1,548
- East Haven town225
- East Montpelier town2,612
- Eden town1,351
- Elmore town964
- Enosburgh town2,804
- Essex town11,516
- Fair Haven town2,724
- Fairfax town5,226
- Fairfield town1,938
- Fairlee town1,066
- Fayston town1,342
- Ferdinand town68
- Ferrisburgh town2,661
- Fletcher town1,196
- Franklin town1,590
- Georgia town4,890
- Glover town1,051
- Goshen town142
- Grafton town666
- Granby town67
- Grand Isle town2,192
- Granville town414
- Greensboro town633
- Groton town967
- Guildhall town371
- Guilford town2,461
- Halifax town847
- Hancock town435
- Hardwick town2,965
- Hartford town10,736
- Hartland town3,460
- Highgate town3,528
- Hinesburg town4,718
- Holland town790
- Hubbardton town831
- Huntington town1,853
- Hyde Park town3,000
- Ira town381
- Irasburg town1,384
- Isle La Motte town577
- Jamaica town882
- Jay town471
- Jericho town5,114
- Johnson town3,450
- Killington town785
- Kirby town756
- Landgrove town225
- Leicester town1,026
- Lemington town108
- Lincoln town1,394
- Londonderry town1,873
- Lowell town1,070
- Ludlow town1,990
- Lunenburg town1,267
- Lyndon town5,590
- Maidstone town241
- Manchester town4,486
- Marlboro town1,362
- Marshfield town1,863
- Mendon town1,113
- Middlebury town9,175
- Middlesex town1,943
- Middletown Springs town747
- Milton town10,769
- Monkton town1,999
- Montgomery town1,047
- Moretown town1,532
- Morgan town827
- Morristown town5,722
- Mount Holly town1,415
- Mount Tabor town304
- New Haven town1,792
- Newark town727
- Newbury town2,169
- Newfane town1,456
- Newport town1,601
- North Hero town1,263
- Northfield town5,920
- Norton town108
- Norwich town3,640
- Orange town957
- Orwell town1,294
- Panton town690
- Pawlet town1,480
- Peacham town887
- Peru town434
- Pittsfield town391
- Pittsford town2,892
- Plainfield town1,314
- Plymouth town533
- Pomfret town908
- Poultney town3,010
- Pownal town3,265
- Proctor town1,794
- Putney town2,622
- Randolph town4,843
- Reading town699
- Readsboro town807
- Richford town2,467
- Richmond town4,159
- Ripton town508
- Rochester town1,389
- Rockingham town4,807
- Roxbury town942
- Royalton town2,752
- Rupert town676
- Rutland town3,927
- Ryegate town1,059
- Salisbury town1,200
- Sandgate town435
- Searsburg town129
- Shaftsbury town3,607
- Sharon town1,577
- Sheffield town573
- Shelburne town7,969
- Sheldon town2,267
- Shoreham town1,269
- Shrewsbury town1,237
- South Hero town1,586
- Springfield town9,084
- St. Albans town7,057
- St. George town812
- St. Johnsbury town7,368
- Stamford town963
- Stannard town228
- Starksboro town1,939
- Stockbridge town791
- Stowe town5,285
- Strafford town1,372
- Stratton town532
- Sudbury town679
- Sunderland town1,269
- Sutton town790
- Swanton town6,820
- Thetford town2,813
- Tinmouth town827
- Topsham town999
- Townshend town1,538
- Troy town1,749
- Tunbridge town1,253
- Underhill town3,141
- Vernon town2,709
- Vershire town842
- Victory town53
- Waitsfield town1,918
- Walden town1,037
- Wallingford town2,286
- Waltham town452
- Wardsboro town820
- Warren town1,585
- Washington town1,056
- Waterbury town5,405
- Waterford town1,279
- Waterville town680
- Weathersfield town2,856
- Wells town1,148
- West Fairlee town711
- West Haven town234
- West Rutland town2,240
- West Windsor town1,171
- Westfield town536
- Westford town2,290
- Westminster town2,999
- Westmore town465
- Weston town685
- Weybridge town781
- Wheelock town717
- Whiting town532
- Whitingham town1,368
- Williamstown town3,579
- Williston town10,144
- Wilmington town1,747
- Windham town594
- Windsor town3,554
- Winhall town752
- Wolcott town1,507
- Woodbury town659
- Woodford town282
- Woodstock town3,027
- Worcester town831
School districts
Each of the 125 with people in it, from ACS 2020–2024 5-year estimates. Elementary districts teach the lower grades and secondary districts the upper ones, under them; the rest are unified, teaching every grade.
- Addison Central Unified School District15,376
- Addison Northwest Unified School District7,543
- Alburgh School District1,832
- Arlington School District2,598
- Averill School District9
- Barre Unified Union School District 9716,417
- Barstow Unified School District2,431
- Bellows Falls UHSD 27secondary8,903
- Blue Mountain USD 212,366
- Brighton School Districtelementary1,167
- Buels Gore School District19
- Burlington School District44,675
- Cabot School District1,579
- Caledonia Cooperative Unified School District4,171
- Cambridge School Districtelementary3,767
- Canaan School District810
- Champlain Islands Unified Union School District 664,032
- Champlain Valley Unified School District27,559
- Charleston School Districtelementary936
- Colchester School District17,648
- Coventry School District917
- Craftsbury School District1,352
- Danville School District2,360
- Derby School Districtelementary4,537
- Echo Valley Community School District2,013
- Elmore-Morristown Unified Union School District 906,686
- Enosburgh-Richford Unified Union School District 885,271
- Essex-Westford Educational Community Unified School District24,609
- Fairfax School District5,226
- Ferdinand School District68
- First Branch Unified School District2,476
- Fletcher School District1,196
- Georgia School District4,890
- Granville Hancock Unified School District849
- Green Mountain Unified School District5,211
- Halifaxelementary847
- Hartford School District10,736
- Hartland School District3,460
- Harwood Unified School District13,330
- Hazen UHSD 26secondary4,257
- Holland School Districtelementary790
- Ira School District381
- Jay School Districtelementary471
- Kingdom East Unified Union School District12,126
- Lake Region UHSD 24secondary7,793
- Lake Region Union Elementary Middle School Districtelementary7,793
- Lamoille North Modified USD 058Aelementary8,903
- Lamoille North Modified USD 058Bsecondary12,670
- Lincoln Town School Districtelementary1,394
- Lowell School Districtelementary1,070
- Ludlow Mt. Holly Unified Union School District3,405
- Maple Run Unified School District15,949
- Marlboro School District1,362
- Mettawee School District2,156
- Mill River Unified School District6,810
- Milton Incorporated School District10,769
- Missisquoi Valley School District 8911,938
- Montpelier Roxbury Unified Union School District8,956
- Morgan School Districtelementary827
- Mount Anthony UHSD 14secondary8,490
- Mount Anthony UHSD 14 (6-12)secondary13,913
- Mount Ascutney School District 864,725
- Mount Mansfield Unified Union School District 40115,430
- Mountain View Union Elementary School Districtelementary4,485
- Mountain Views Unified Union School District8,143
- Mt. Abraham Unified School District9,508
- Newport City School Districtelementary4,394
- Newport Town School Districtelementary1,601
- North Bennington Incorporated School Districtelementary1,957
- North Country Junior/Senior UHSD 22 (7-12)secondary11,555
- North Country Senior UHSD 22secondary6,523
- Northeast Kingdom Choice School District2,272
- Northern Mountain Valley Unified Union School District 856,168
- Norwich School District3,640
- Orange Southwest Unified School District7,355
- Otter Valley Unified Union School District 539,391
- Oxbow Unified Union School District 914,656
- Paine Mountain School District9,499
- Peacham School District887
- Pittsfield School District391
- Quarry Valley Unified Union School District 707,044
- Readsboroelementary807
- Rivendell Interstate School District2,619
- River Valleys Unified School District 732,286
- Rochester Stockbridge Unified School District2,180
- Rockingham School Districtelementary4,807
- Rutland City School District15,712
- Rutland Town School District3,927
- Sandgate School District435
- Searsburg School District129
- Sharon School District1,577
- Slate Valley Unified Union School District 6210,320
- South Burlington School District20,756
- South Hero School District1,586
- Southwest Vermont Union Elementary School District 87elementary6,533
- Southwest Vermont Union Elementary School District 87 (PK-5)elementary13,913
- Springfield School District9,084
- St. Johnsbury School District7,368
- Stamford School District963
- Stannard School Districtsecondary228
- Stowe Town School District5,285
- Strafford School District1,372
- Stratton School District532
- Taconic and Green Regional School District12,501
- Thetford School District2,813
- Troy School Districtelementary1,749
- Twin Valley Unified School District3,115
- Twinfield USD 333,177
- Vernon School District2,709
- Waits River Valley USD 362,538
- Washington Central Unified Union School District 929,979
- Weathersfield School District2,856
- Wells Spring Unified Union School District1,895
- West River Valley Modified Union Education District 72Aelementary4,407
- West River Valley Modified Union Education District 72Bsecondary4,407
- West River Valley Modified Union Education District 72B (7-12)secondary594
- Westfield School Districtelementary536
- Westminster School Districtelementary2,999
- White River Unified School District4,488
- Windham Northeast Union Elementary School District 95elementary1,097
- Windham School Districtelementary594
- Windham Southeast Unified Union School District 9619,295
- Winhall School District752
- Winooski School District8,293
- Wolcott School District1,507
State senate districts
The upper chamber’s districts, as drawn in 2024.
- Addison Senatorial District40,925
- Bennington Senatorial District41,421
- Caledonia Senatorial District22,891
- Chittenden Central Senatorial District66,459
- Chittenden North Senatorial District22,677
- Chittenden South East Senatorial District69,299
- Essex Senatorial District22,876
- Franklin Senatorial District45,001
- Grand Isle Senatorial District20,295
- Lamoille Senatorial District22,059
- Orange Senatorial District22,796
- Orleans Senatorial District21,512
- Rutland Senatorial District60,034
- Washington Senatorial District67,285
- Windham Senatorial District41,771
- Windsor Senatorial District59,805
State house districts
The lower chamber’s districts, as drawn in 2024.
- Addison-1 State House District8,320
- Addison-2 State House District4,084
- Addison-3 State House District8,047
- Addison-4 State House District9,110
- Addison-5 State House District4,159
- Addison-Rutland State House District4,605
- Bennington-1 State House District4,253
- Bennington-2 State House District8,005
- Bennington-3 State House District4,031
- Bennington-4 State House District8,364
- Bennington-5 State House District8,437
- Bennington-Rutland State House District4,191
- Caledonia-1 State House District4,193
- Caledonia-2 State House District4,230
- Caledonia-3 State House District8,391
- Caledonia-Essex State House District9,269
- Caledonia-Washington State House District4,826
- Chittenden-1 State House District4,159
- Chittenden-2 State House District9,429
- Chittenden-3 State House District8,255
- Chittenden-4 State House District4,281
- Chittenden-5 State House District4,353
- Chittenden-6 State House District4,945
- Chittenden-7 State House District3,836
- Chittenden-8 State House District4,364
- Chittenden-9 State House District3,005
- Chittenden-10 State House District4,039
- Chittenden-11 State House District5,166
- Chittenden-12 State House District4,897
- Chittenden-13 State House District7,407
- Chittenden-14 State House District8,314
- Chittenden-15 State House District8,652
- Chittenden-16 State House District7,601
- Chittenden-17 State House District4,807
- Chittenden-18 State House District7,894
- Chittenden-19 State House District8,413
- Chittenden-20 State House District9,235
- Chittenden-21 State House District8,293
- Chittenden-22 State House District9,426
- Chittenden-23 State House District8,501
- Chittenden-24 State House District4,392
- Chittenden-25 State House District4,814
- Chittenden-Franklin State House District7,749
- Essex-Caledonia State House District3,958
- Essex-Orleans State House District4,755
- Franklin-1 State House District9,171
- Franklin-2 State House District4,354
- Franklin-3 State House District4,769
- Franklin-4 State House District9,078
- Franklin-5 State House District9,330
- Franklin-6 State House District4,243
- Franklin-7 State House District3,860
- Franklin-8 State House District4,888
- Grand Isle-Chittenden State House District8,891
- Lamoille-1 State House District4,660
- Lamoille-2 State House District8,379
- Lamoille-3 State House District4,447
- Lamoille-Washington State House District8,801
- Orange-1 State House District4,394
- Orange-2 State House District4,604
- Orange-3 State House District4,257
- Orange-Caledonia State House District4,135
- Orange-Washington-Addison State House District8,711
- Orleans-1 State House District4,537
- Orleans-2 State House District4,394
- Orleans-3 State House District4,424
- Orleans-4 State House District3,970
- Orleans-Lamoille State House District9,079
- Rutland-1 State House District3,991
- Rutland-2 State House District9,091
- Rutland-3 State House District4,453
- Rutland-4 State House District4,815
- Rutland-5 State House District3,595
- Rutland-6 State House District4,237
- Rutland-7 State House District4,887
- Rutland-8 State House District4,686
- Rutland-9 State House District4,120
- Rutland-10 State House District3,742
- Rutland-11 State House District3,607
- Rutland-Bennington State House District4,275
- Rutland-Windsor State House District4,642
- Washington-1 State House District8,800
- Washington-2 State House District7,925
- Washington-3 State House District8,412
- Washington-4 State House District8,014
- Washington-5 State House District4,555
- Washington-6 State House District4,890
- Washington-Chittenden State House District8,440
- Washington-Orange State House District8,550
- Windham-1 State House District5,170
- Windham-2 State House District3,700
- Windham-3 State House District8,337
- Windham-4 State House District4,712
- Windham-5 State House District4,356
- Windham-6 State House District3,962
- Windham-7 State House District3,852
- Windham-8 State House District4,153
- Windham-9 State House District4,117
- Windham-Windsor-Bennington State House District3,926
- Windsor-1 State House District8,185
- Windsor-2 State House District4,459
- Windsor-3 State House District9,084
- Windsor-4 State House District4,813
- Windsor-5 State House District4,259
- Windsor-6 State House District9,022
- Windsor-Addison State House District4,351
- Windsor-Orange-1 State House District4,005
- Windsor-Orange-2 State House District9,402
- Windsor-Windham State House District4,683
PUMAs
Public Use Microdata Areas: areas of 100,000 people or more that the state draws from census tracts, for the Census Bureau’s microdata.
Urban areas
Each that reaches into Vermont, with its whole population. Urban areas are the densely settled land the Census Bureau draws after each census, whatever the city lines.
- Barre–Montpelier, VT20,418
- Bellows Falls, VT–NH3,689
- Bennington, VT13,559
- Brattleboro, VT10,511
- Burlington, VT120,006
- Lebanon, NH–VT30,905
- Middlebury, VT5,874
- Milton, VT6,506
- Rutland, VT19,271
- Springfield, VT4,950
- St. Albans, VT11,447
- St. Johnsbury, VT4,949
Turn Vermont into your planning report.
Social Explorer Studio builds an editable profile of any place, with tables and charts beside the county and state, and exports to Word, PDF and Excel.
Questions about Vermont
What is the population of Vermont?
644,663 people, according to the ACS 2025 1-year estimates, which the Census Bureau adjusts to match its own population estimate. That’s the 50th largest of the 50 states and DC.
What is the FIPS code for Vermont?
50. Every county’s and place’s FIPS code in Vermont starts with it. The Census Bureau’s full geographic identifier (GEOID) is 0400000US50.
What is the largest city in Vermont?
Burlington, with 44,675 people. Other large places here include South Burlington, Rutland and Essex Junction.
What is the median household income in Vermont?
$86,018 (±$2,458), according to the ACS 2025 1-year estimates, about the same as the US ($84,780).
What is the median age in Vermont?
44.6 years (±0.3), according to the ACS 2025 1-year estimates, higher than the US (39.5).
How much does housing cost in Vermont?
Vermont’s median home value is $359,800 (±$8,499) and its median gross rent is $1,338 (±$57) a month, according to the ACS 2025 1-year estimates. 46.1% (±4.3%) of its renters pay 30% or more of their income on rent.
Is Vermont growing?
Vermont’s population grew 3.0%, from 626,042 in 2015 to 644,663 in 2025, according to the ACS 1-year estimates.
Where do people who work in Vermont live?
270,070 of its 303,206 jobs are held by people who live here. Of those who commute in, the most come from New Hampshire, New York, Massachusetts.
Where does this census data come from?
The U.S. Census Bureau’s American Community Survey, through Social Explorer’s tables: the latest 1-year estimates where they exist, for the most recent numbers, and 5-year estimates otherwise. Each table lists its code, so you can find it again.
Is this data free to use?
Yes. You can read it, cite it, download the CSV and embed the charts, with no account. To map other variables, compare your own areas or build a report, see Social Explorer’s plans in a live demo.
Sources and how to cite
American Community Survey 2025 1-year estimates, or 2020–2024 5-year estimates where noted, U.S. Census Bureau, from Social Explorer’s tables A00001, A00002, A01004, A04001, A06001, A08001, A09005, A10001, A10003, A10008, A10030, A10036, A10040, A10047, A10055, A10060, A12001, A13004, A14006, A14024, A14028, A16002, A17005, A18002, A18009, A20001, B02002, B09001, B13002, B18101, C16001. Maps by census tract use 2020–2024 5-year estimates, since the 1-year survey doesn’t cover tracts. Commuting: LEHD LODES 2023. These are estimates from a sample, each with its margin of error. Data retrieved November 14, 2026. How these profiles are made.
U.S. Census Bureau, American Community Survey 2025 1-year estimates, or 2020–2024 5-year estimates where noted, via Social Explorer. “Vermont.” https://www.socialexplorer.com/places/vermont. Accessed November 14, 2026.