

Trade area analysis that shows how a market is changing
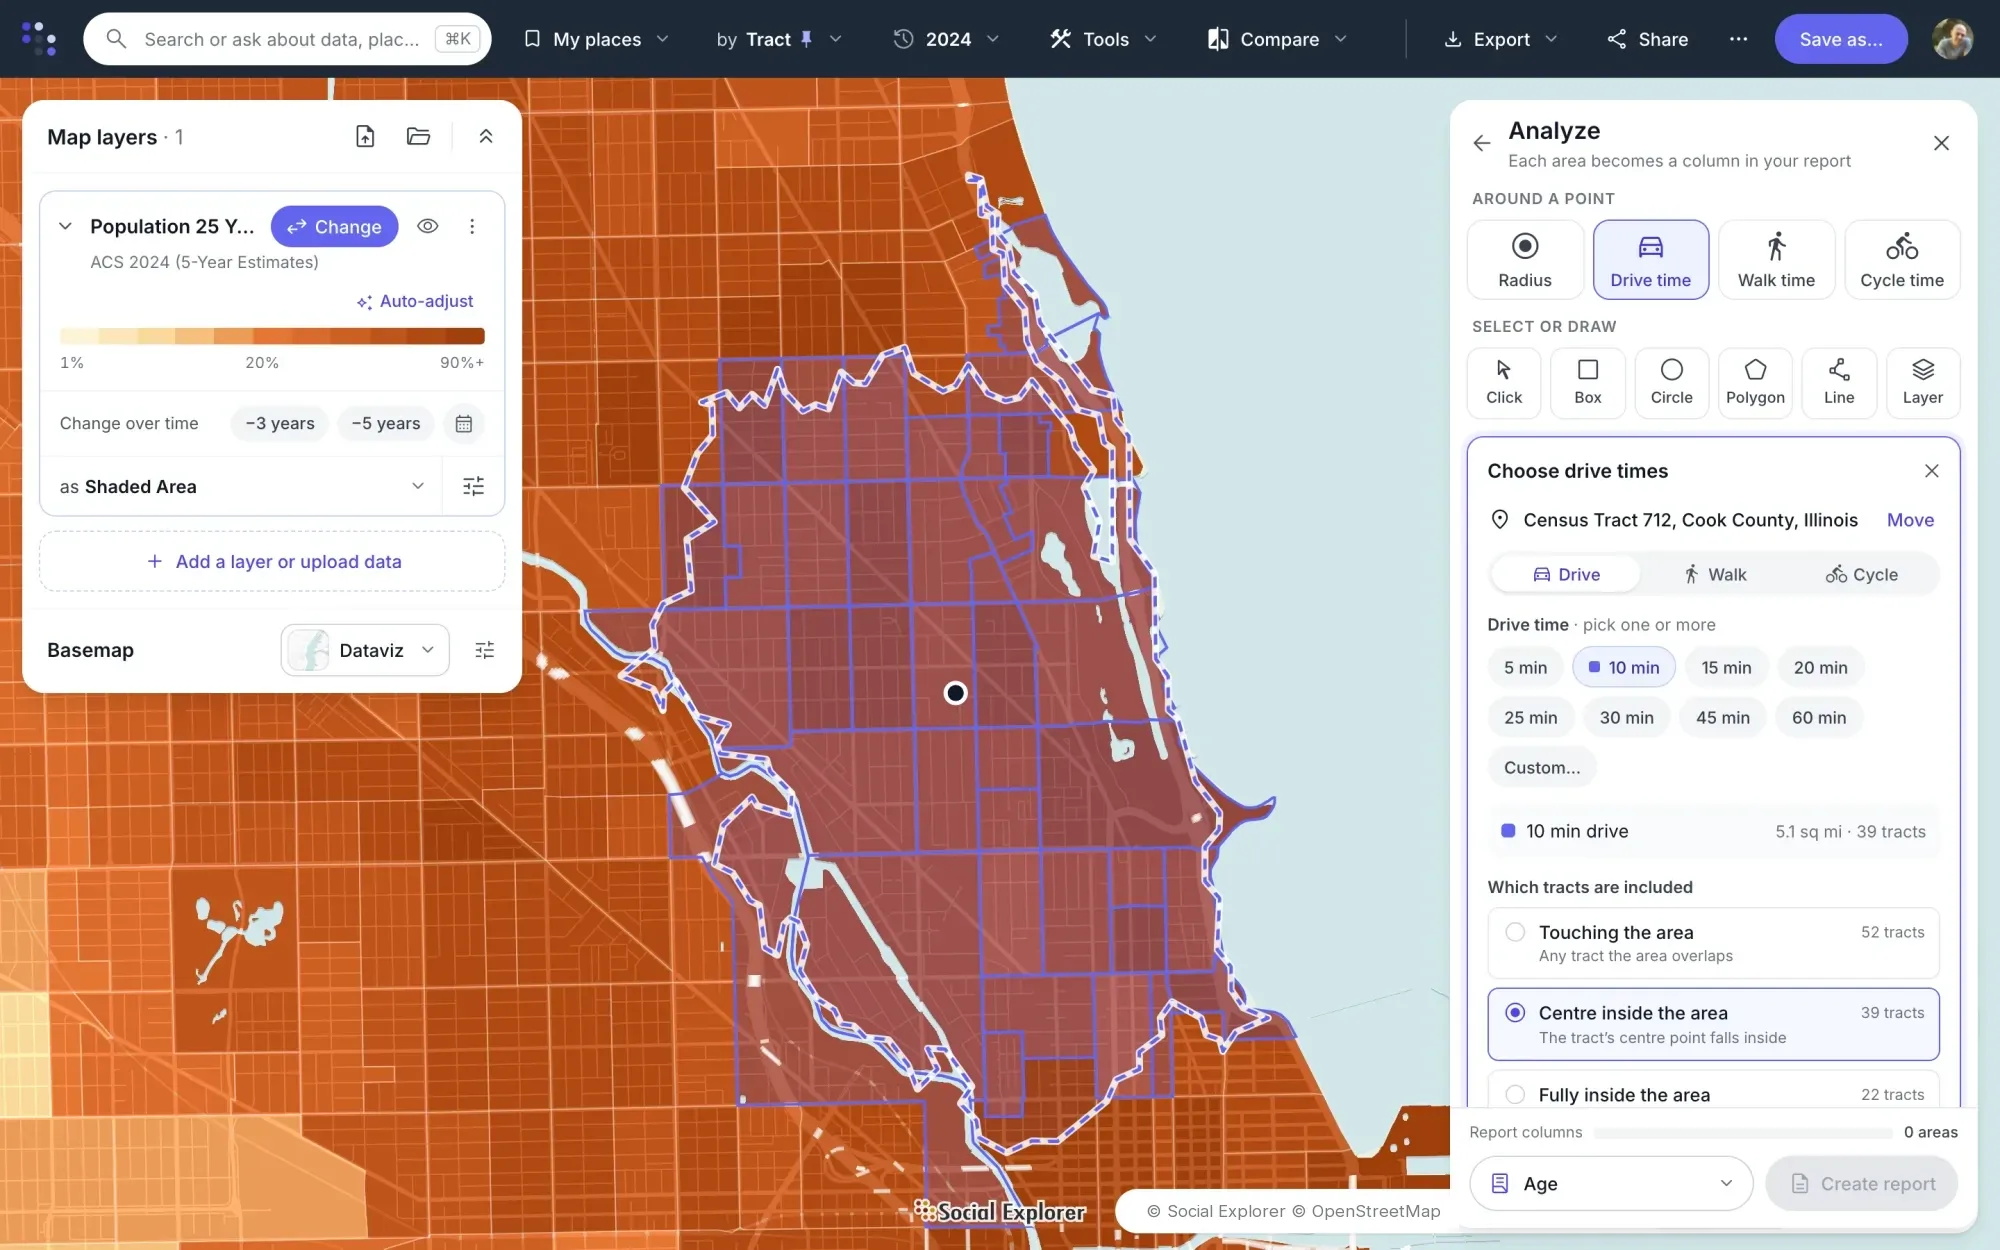
Trade area analysis measures who lives in the area a store, branch or service draws from, and how that is changing. In Social Explorer, draw the trade area by drive time or radius, or combine tracts into an area of your own, and put current and historical demographics side by side.
How do you run a trade area analysis?
-
1
Analyze
Click a site and draw its trade area as a radius or a drive, walk or cycle time, several sizes at once. Each trade area becomes a column in a report, with the ZIP, county or state around it for comparison.
-
2
Create a report
Mix geography levels in one report, such as a metro area, its counties and specific tracts. Load exact areas by FIPS code if you have them.
-
3
Change over time
Compare up to three years in one report. Social Explorer normalizes geographies and variables across years, so like is compared with like.
-
4
Adjust $ values for inflation
Turn nominal income and home values into real ones with one click.
-
5
Map the trend
Swipe between two years, or map change over time as a percent or as the actual difference.
-
6
Export and embed
Export to Excel or CSV for your models, or embed the live map. Embeds keep their filters and layers.
The data behind it
Part of a library of 610,000+ variables, each one with its source.
- American Community Survey, 5-year estimates Down to census tract and block group
- American Community Survey, 1-year estimates The latest year for larger areas
- EASI Market Profile data Commercial estimates for 2010 and 2020–2025, with projections to 2030
- County Business Patterns Businesses and employment by industry
- Decennial Census Back to 1790
Good to know
- Change over time in reports works for datasets Social Explorer has normalized, such as the ACS and EASI Market Profile data. It isn’t available for decennial census tables.
- Change-over-time maps cover ACS 5-year estimates from 2010 to 2020 and EASI Market Profile data from 2010 to 2026.
- A report with several geography levels exports as one CSV file per level.
Tools for this work

Questions about trade area analysis
What is a trade area?
A trade area is the geographic area a store, branch or service draws most of its customers from. It’s often drawn as a radius or a drive time around a site, or built from standard areas such as ZIP codes, counties or census tracts. Its shape depends on how far customers will travel.
What is trade area analysis?
Trade area analysis measures who lives and works in a trade area and how that is changing: population, households, income, age and businesses. In Social Explorer, draw the trade area, compare it with the county or state, look back up to three years in inflation-adjusted dollars, and export the numbers for your models.
How do you define a trade area in Social Explorer?
Click a site in Social Explorer Maps, choose a radius or a drive, walk or cycle time, several sizes at once, and choose which tracts count: those touching the area, those with their center inside it, or those fully inside. Or combine tracts into an area of your own, or load exact areas by FIPS code.
Can I see how a trade area has changed?
Yes. Reports compare up to three years for datasets Social Explorer has normalized, such as the American Community Survey and EASI Market Profile data, with dollar values adjusted for inflation. Maps swipe between two years or show change over time as a percent or as the actual difference. Decennial census tables aren’t compared this way.
Other solutions
- Site selection Compare candidate areas on the demographics that drive your business.
- Community needs & grants Build citable evidence of need for a grant or program.
- Data storytelling Turn a question into an interactive map or story.
- Equity analysis See which communities carry the heaviest burdens.
- Planning & policy Understand who lives where and how that is changing.
- Community change Show how a place has changed, with comparable data across decades.
- Census data Every census since 1790 and the latest American Community Survey, ready to map and analyze.
Try it on a place you know
In a live demo, we’ll show you how it fits your team or campus.