

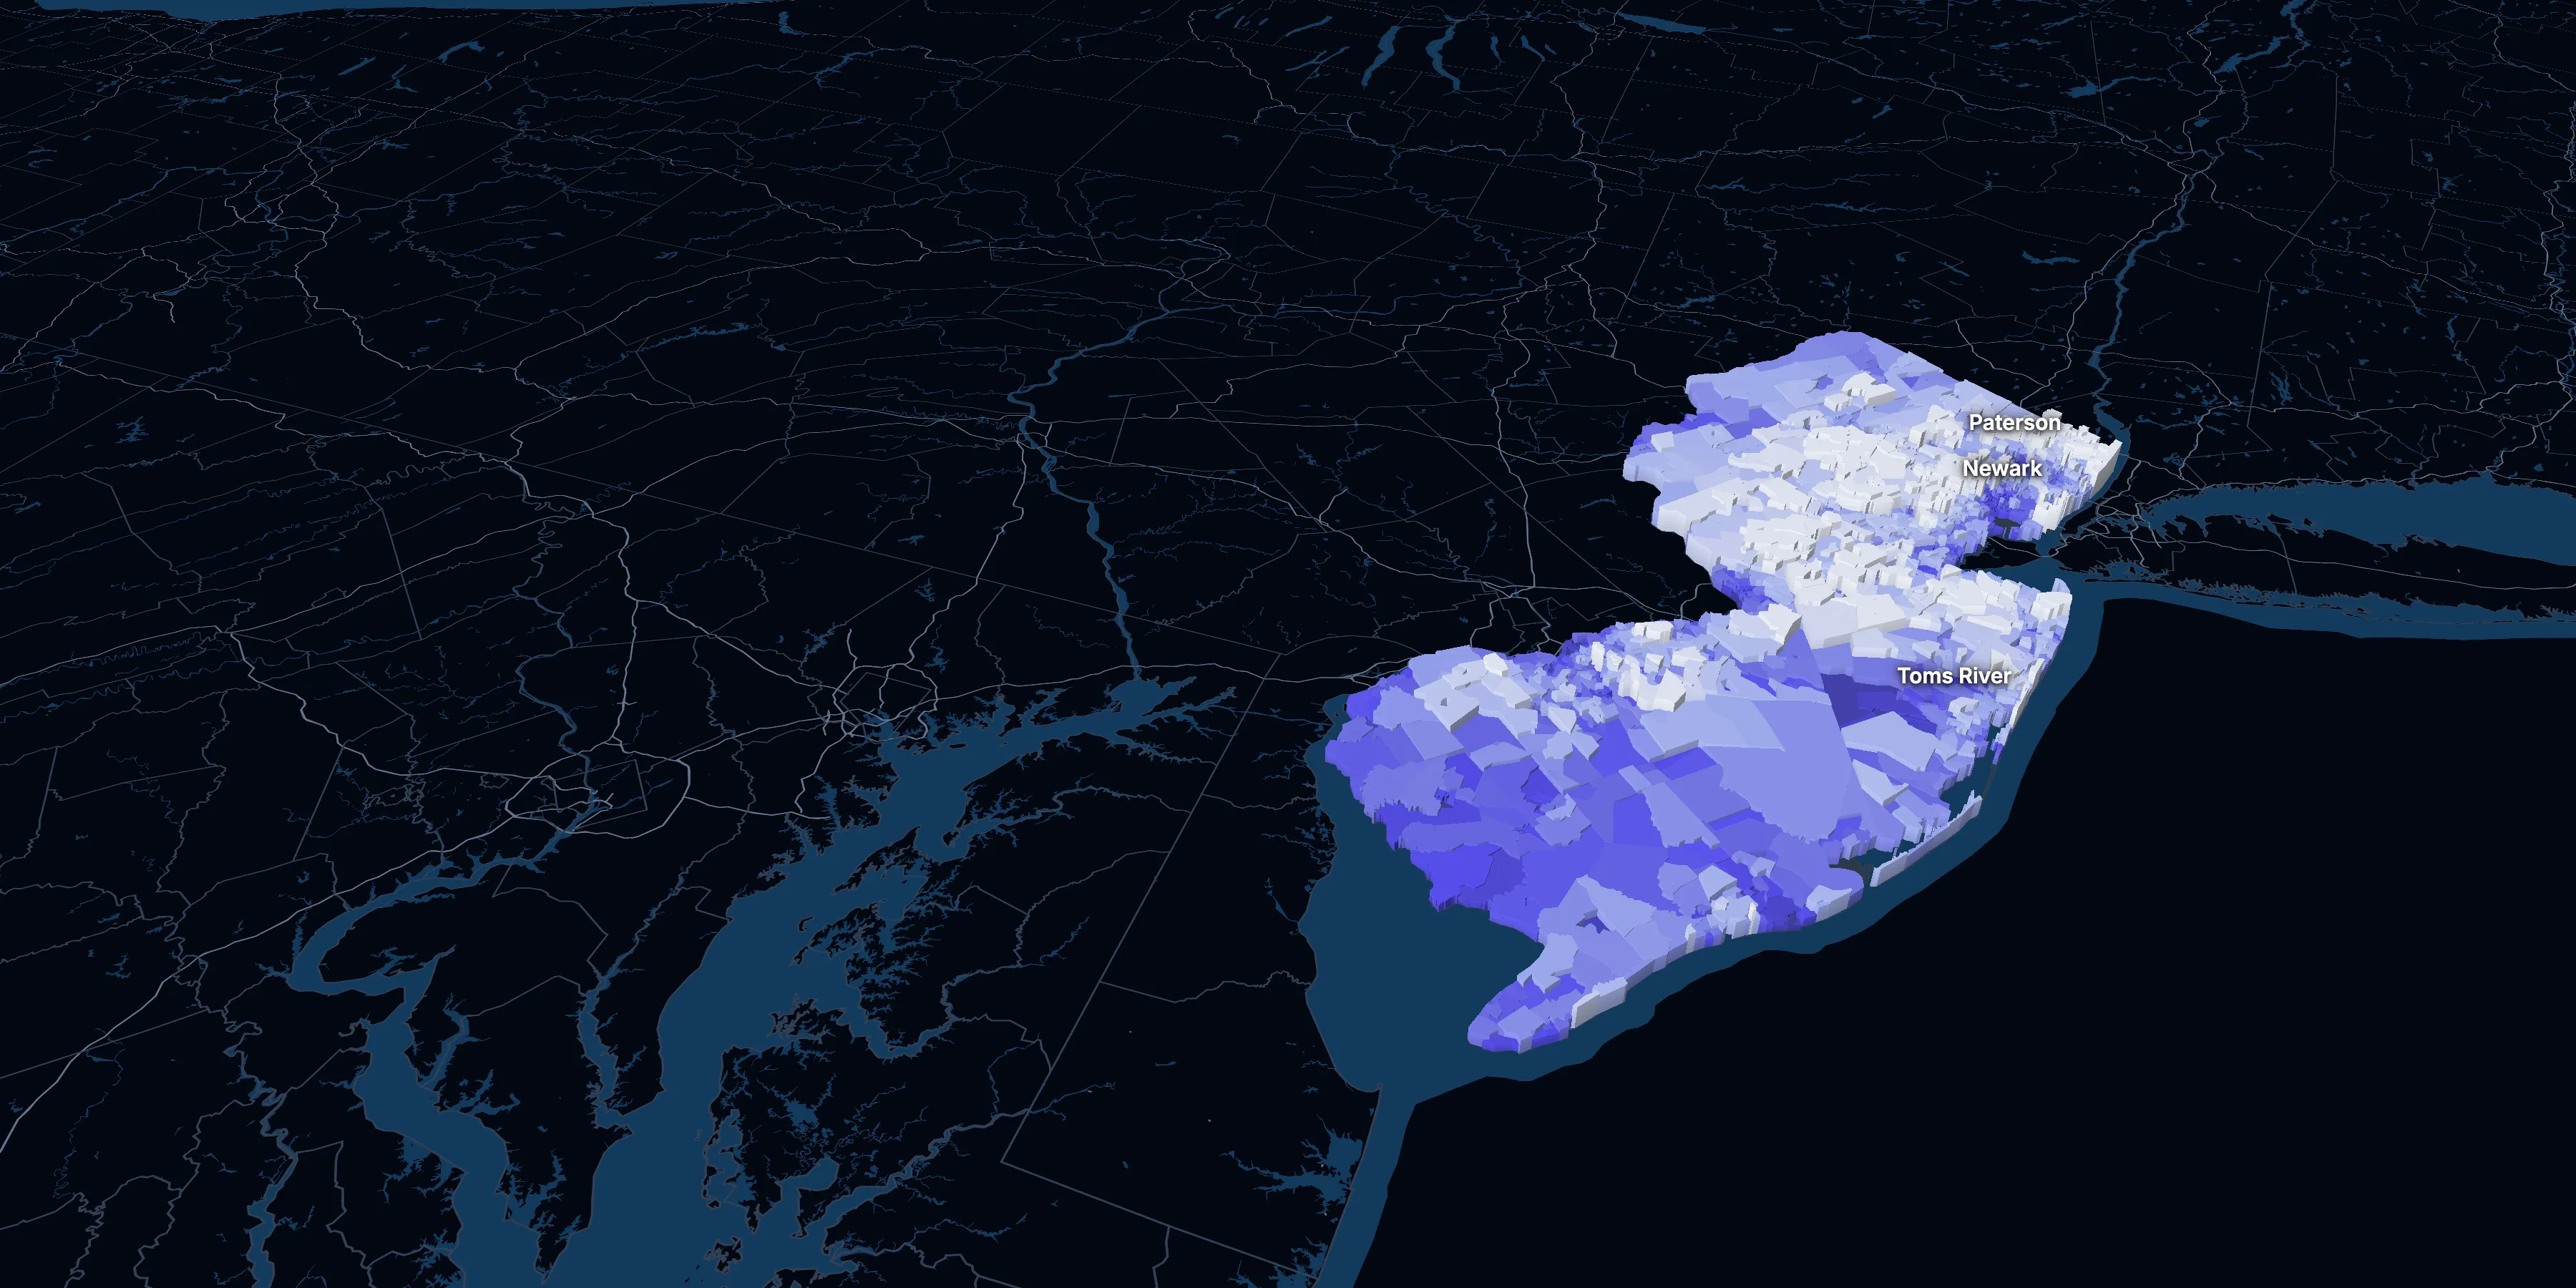
New Jersey: Population, demographics and census data
Home to 9,548,215 people, the 11th largest of the 50 states and DC. It grew 6.6% between 2015 and 2025.
- Population
- 9.55M. Census Bureau estimate · Rank 11 of the 50 states and DC
- Median household income
- $107,797 ±$1,374. US $84,780
- Median age
- 40.2 ±0.1. US 39.5
ACS 2025 1-year estimates, U.S. Census Bureau
Taller, lighter tracts have higher household incomes
About New Jersey
New Jersey’s median household income is $107,797 (±$1,374), higher than the US ($84,780), and its median age is 40.2 (±0.1), according to the ACS 2025 1-year estimates. Its largest city is Newark.
± is each figure’s margin of error, at 90% confidence, and † marks one too uncertain to lean on. Under each percentage in the tables is the number it counts. How the margins are worked out.
FIPS code 34
Highlights
What stands out in New Jersey
The numbers where New Jersey sits furthest from the nation, or past a recognized policy benchmark.
Past a policy benchmark
50.4%
Very highRenters paying 30% or more of income
That’s higher than the US (48.3%). HUD counts households paying 30% or more of income on housing as cost-burdened.
29.0%
Very highOwners paying 30% or more of income
That’s higher than the US (24.2%). HUD’s 30% standard, applied to homeowners. It’s the 3rd highest of the 50 states and DC.
36.8%
Very highHomes built before 1960
That’s higher than the US (24.0%). Older homes carry more lead-paint risk: the EPA found lead paint in 69% of homes built from 1940 to 1959. It’s the 7th highest of the 50 states and DC.
5.3%
ElevatedUnemployment rate
That’s higher than the US (4.9%). The Department of Labor uses 6% as its floor for a labor surplus area. It’s the 5th highest of the 50 states and DC.
+4 points
ElevatedRent growth ahead of income
After inflation, rent grew 13% from 2015 to 2025, and household income 9%. The dots show rent growth.
Furthest from the national picture
$107,797
Higher than the USMedian household income
That’s higher than the US ($84,780). It’s the 4th highest of the 50 states and DC.
2015 to 2025
How New Jersey changed in ten years
The state added 590,202 people. It got older, more foreign-born and better educated, and poverty fell 2.1 points.
Population, change since 2015
+6.6% in the state and +6.3% in the US.
Source: ACS 1-year, 2015 to 2025, table A00001.
Show data
| New Jersey | United States | |
|---|---|---|
| 2015 | 0.0% | 0.0% |
| 2016 | −0.2% | +0.5% |
| 2017 | +0.5% | +1.3% |
| 2018 | −0.6% | +1.8% |
| 2019 | −0.8% | +2.1% |
| 2021 | +3.5% | +3.3% |
| 2022 | +3.4% | +3.7% |
| 2023 | +3.7% | +4.2% |
| 2024 | +6.1% | +5.8% |
| 2025 | +6.6% | +6.3% |
Embed
Median household income, in 2025 dollars
+8.9% in the state and +10.9% in the US.
Source: ACS 1-year, 2015 to 2025, table A14006.
Show data
| New Jersey | United States | |
|---|---|---|
| 2015 | $98,946 | $76,413 |
| 2016 | $102,966 | $77,931 |
| 2017 | $106,044 | $79,891 |
| 2018 | $105,656 | $80,059 |
| 2019 | $108,868 | $83,427 |
| 2021 | $106,976 | $83,521 |
| 2022 | $106,729 | $82,811 |
| 2023 | $106,155 | $82,683 |
| 2024 | $107,789 | $84,339 |
| 2025 | $107,797 | $84,780 |
Embed
Living in poverty
−2.1 points in the state and −3.0 points in the US.
Source: ACS 1-year, 2015 to 2025, table A13004.
Show data
| New Jersey | United States | |
|---|---|---|
| 2015 | 10.8% | 14.7% |
| 2016 | 10.4% | 14.0% |
| 2017 | 10.0% | 13.4% |
| 2018 | 9.5% | 13.1% |
| 2019 | 9.2% | 12.3% |
| 2021 | 10.2% | 12.8% |
| 2022 | 9.7% | 12.6% |
| 2023 | 9.7% | 12.5% |
| 2024 | 9.2% | 12.1% |
| 2025 | 8.7% | 11.8% |
Embed
Bachelor’s degree or more
+7.5 points in the state and +6.7 points in the US.
Source: ACS 1-year, 2015 to 2025, table A12001.
Show data
| New Jersey | United States | |
|---|---|---|
| 2015 | 37.6% | 30.6% |
| 2016 | 38.6% | 31.3% |
| 2017 | 39.7% | 32.0% |
| 2018 | 40.8% | 32.6% |
| 2019 | 41.2% | 33.1% |
| 2021 | 43.1% | 35.0% |
| 2022 | 43.5% | 35.7% |
| 2023 | 43.8% | 36.2% |
| 2024 | 44.5% | 36.8% |
| 2025 | 45.0% | 37.4% |
Embed
Median gross rent, in 2025 dollars
+13.3% in the state and +18.5% in the US.
Source: ACS 1-year, 2015 to 2025, table A18009.
Show data
| New Jersey | United States | |
|---|---|---|
| 2015 | $1,663 | $1,314 |
| 2016 | $1,683 | $1,327 |
| 2017 | $1,700 | $1,340 |
| 2018 | $1,727 | $1,368 |
| 2019 | $1,747 | $1,393 |
| 2021 | $1,745 | $1,427 |
| 2022 | $1,723 | $1,440 |
| 2023 | $1,773 | $1,496 |
| 2024 | $1,860 | $1,537 |
| 2025 | $1,885 | $1,557 |
Embed
Median home value, in 2025 dollars
+20.1% in the state and +39.3% in the US.
Source: ACS 1-year, 2015 to 2025, table A10036.
Show data
| New Jersey | United States | |
|---|---|---|
| 2015 | $441,968 | $266,469 |
| 2016 | $443,915 | $277,278 |
| 2017 | $443,441 | $288,124 |
| 2018 | $444,651 | $296,908 |
| 2019 | $442,832 | $305,336 |
| 2021 | $466,978 | $337,116 |
| 2022 | $475,120 | $355,481 |
| 2023 | $490,447 | $361,931 |
| 2024 | $512,623 | $372,685 |
| 2025 | $530,800 | $371,100 |
Embed
ACS 1-year estimates. The dotted stretch of each line spans 2020, when the Census Bureau released no standard 1-year estimates. Dollar values are in 2025 dollars.
| Indicator | 2015 | 2025 | Change |
|---|---|---|---|
| Population | 8,958,013 | 9,548,215 | +6.6% |
| Median age | 39.6 | 40.2 | +0.6 years |
| 65 and over | 15.0% | 18.6% | +3.6 points |
| Born outside the US | 22.1% | 24.9% | +2.9 points |
| Hispanic or Latino | 19.7% | 24.0% | +4.3 points |
| Median household income | $98,946 | $107,797 | +8.9% |
| Living in poverty | 10.8% | 8.7% | −2.1 points |
| Bachelor’s degree or more | 37.6% | 45.0% | +7.5 points |
| Households that rent | 37.0% | 36.2% | −0.8 points |
| Median gross rent | $1,663 | $1,885 | +13.3% |
| Median home value | $441,968 | $530,800 | +20.1% |
2181 census tracts
New Jersey, tract by tract
State averages hide a lot. These census tracts are the closest the census comes to neighborhoods.
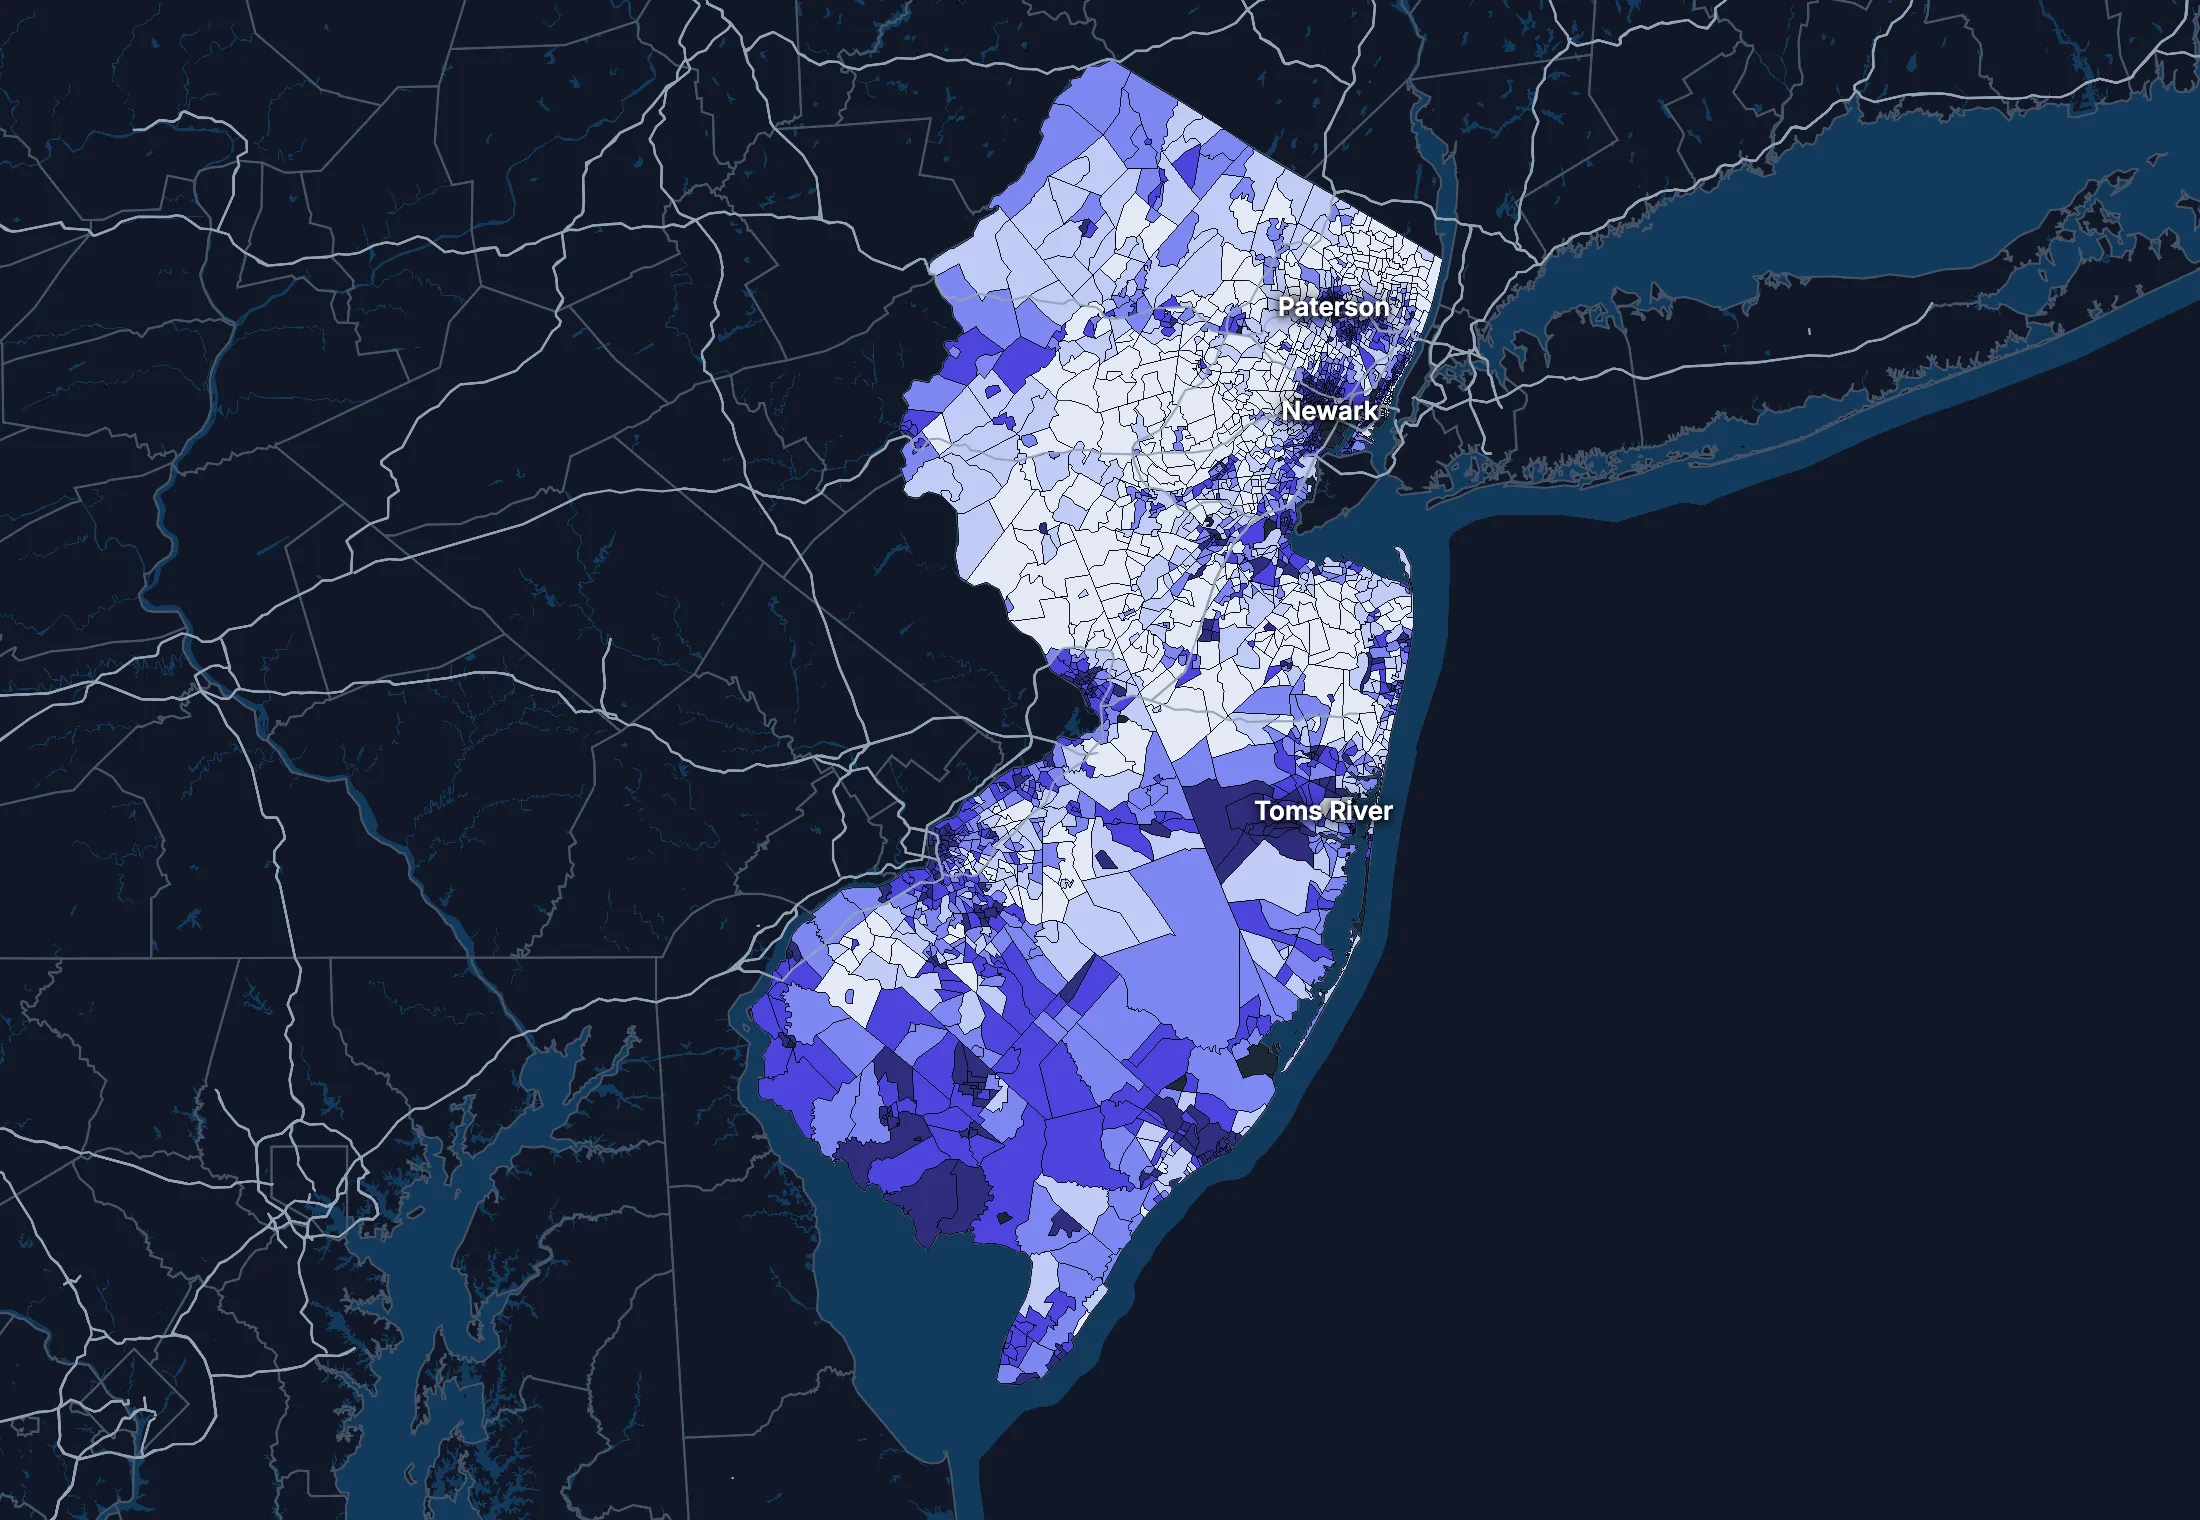
Where the state’s average misleads
Each tick is one census tract, and the dark line marks the state. Hover over a tick or tap it to see the tract.
Poverty
485 of 2161 tracts are at least 1.5 times the state’s overall 9.7%, and 737 are at two-thirds of it or less.
Highest: Tract 69, 100.0%. Lowest: Tract 5012.10, 0.0%.
Renters paying 30% or more of income
122 of 2021 tracts are at least 1.5 times the state’s overall 49.1%, and 334 are at two-thirds of it or less.
Highest: Tract 7028.05, 100.0%. Lowest: Tract 372.01, 0.0%.
Adults with a bachelor’s degree
351 of 2168 tracts are at least 1.5 times the state’s overall 43.6%, and 666 are at two-thirds of it or less.
Highest: Tract 77.01, 95.0%. Lowest: Tract 2239, 0.0%.
Median household income
383 of 2150 tracts are at least 1.5 times the typical tract’s $103,495, and 410 are at two-thirds of it or less.
Highest: Tract 202, $250,000 or more. Lowest: Tract 48.02, $15,943.
American Community Survey 2020–2024 5-year estimates, by census tract. Income is capped at $250,000+ by the Census Bureau.
People
Who lives in New Jersey
Its median age of 40.2 is higher than the US (39.5). 24.9% of residents were born outside the US, and 34.0% speak a language other than English at home.
Age
Source: ACS 2025 1-year, table A01001.
Show data
| New Jersey | United States | |
|---|---|---|
| Under 18 | 20.8% ±0.2% , number 1,986,925 ±18,240 | 21.0% ±<0.1% , number 71,689,151 ±111,800 |
| 18 to 24 | 8.7% ±0.2% , number 831,736 ±15,180 | 9.3% ±<0.1% , number 31,716,680 ±98,660 |
| 25 to 34 | 13.2% ±0.1% , number 1,259,748 ±5,636 | 13.6% ±<0.1% , number 46,357,354 ±55,690 |
| 35 to 44 | 13.7% ±0.2% , number 1,305,472 ±18,720 | 13.4% ±<0.1% , number 45,746,189 ±105,700 |
| 45 to 54 | 12.3% ±0.1% , number 1,174,152 ±5,816 | 11.8% ±<0.1% , number 40,257,563 ±53,540 |
| 55 to 64 | 12.8% ±0.2% , number 1,218,929 ±17,710 | 12.1% ±<0.1% , number 41,242,904 ±104,700 |
| 65 to 74 | 10.5% ±0.1% , number 1,005,559 ±14,270 | 10.8% ±<0.1% , number 36,895,650 ±91,520 |
| 75 and over | 8.0% ±0.1% , number 765,694 ±13,030 | 8.2% ±<0.1% , number 27,879,368 ±78,140 |
Embed
Race and ethnicity
Source: ACS 2025 1-year, table A04001.
Show data
| New Jersey | United States | |
|---|---|---|
| White, not Hispanic | 48.3% ±0.1% , number 4,609,262 ±9,777 | 55.0% ±<0.1% , number 187,959,031 ±58,340 |
| Hispanic or Latino | 24.0% , number 2,292,134 | 20.5% ±<0.1% , number 69,975,516 ±13,270 |
| Black, not Hispanic | 11.9% ±0.2% , number 1,131,863 ±14,910 | 11.7% ±<0.1% , number 40,096,453 ±106,200 |
| Asian, not Hispanic | 11.0% ±0.1% , number 1,053,679 ±9,557 | 6.5% ±<0.1% , number 22,096,709 ±58,340 |
| Other or multiracial | 4.8% ±0.2% , number 461,277 ±20,890 | 6.3% ±<0.1% , number 21,657,150 ±150,100 |
Embed
Language spoken at home
Source: ACS 2025 1-year, table C16001.
Show data
| New Jersey | United States | |
|---|---|---|
| English only | 66.0% ±0.4% , number 5,964,988 ±37,850 | 77.1% ±0.1% , number 249,390,588 ±275,300 |
| Spanish | 17.7% ±0.3% , number 1,600,355 ±24,090 | 13.9% ±0.1% , number 44,921,985 ±177,800 |
| Other Indo-European | 9.0% ±0.3% , number 817,082 ±27,510 | 4.0% ±<0.1% , number 12,862,980 ±113,500 |
| Asian and Pacific Island | 5.3% ±0.2% , number 475,354 ±19,370 | 3.8% ±<0.1% , number 12,288,841 ±99,740 |
| Arabic and other | 1.9% ±0.2% , number 174,618 ±14,800 | 1.3% ±<0.1% , number 4,116,949 ±71,480 |
Embed
Marital status
Source: ACS 2025 1-year, table A11001.
Show data
| New Jersey | United States | |
|---|---|---|
| Now married | 49.1% ±0.4% , number 3,888,346 ±28,700 | 47.9% ±0.1% , number 135,567,564 ±223,300 |
| Never married | 35.7% ±0.3% , number 2,830,586 ±22,580 | 34.8% ±0.1% , number 98,647,238 ±152,600 |
| Divorced | 8.4% ±0.2% , number 669,108 ±15,760 | 10.2% ±<0.1% , number 28,879,967 ±112,900 |
| Widowed | 5.3% ±0.1% , number 417,924 ±9,387 | 5.5% ±<0.1% , number 15,599,094 ±69,430 |
| Separated | 1.4% ±0.1% , number 114,718 ±7,539 | 1.6% ±<0.1% , number 4,441,399 ±49,160 |
Embed
Where people lived a year ago
Source: ACS 2025 1-year, table A08001.
Show data
| New Jersey | United States | |
|---|---|---|
| Same home | 90.9% ±0.4% , number 8,590,802 ±36,670 | 88.4% ±0.1% , number 298,889,697 ±214,800 |
| Same county | 4.1% ±0.3% , number 385,486 ±23,890 | 6.0% ±<0.1% , number 20,202,671 ±166,300 |
| Another county in the state | 2.5% ±0.2% , number 237,313 ±17,650 | 3.0% ±<0.1% , number 10,168,097 ±89,190 |
| Another state | 1.7% ±0.2% , number 162,955 ±15,680 | 2.1% ±<0.1% , number 7,025,589 ±81,660 |
| Another country | 0.7% ±0.1% , number 69,485 ±9,683 | 0.6% ±<0.1% , number 1,984,943 ±47,210 |
Embed
Top countries of birth, among those born abroad
Source: ACS 2025 1-year, table A07001.
Show data
| New Jersey | |
|---|---|
| India | 13.0% , number 309,027 |
| Dominican Republic | 9.8% , number 233,625 |
| Ecuador | 5.4% , number 128,655 |
| Mexico | 4.7% , number 110,742 |
| Colombia | 4.5% , number 107,386 |
| Philippines | 3.9% , number 91,950 |
Embed
All the numbers
| Indicator | New Jersey | US | Rank among states* | Table |
|---|---|---|---|---|
| Population | 9,548,215 | 341,784,859 | 11th | A00001 |
| People per square mile | 1,298 | 97 | 2nd | A00002 |
| Land area (square miles) | 7,355 | – | – | A00002 |
| Median age | 40.2 ±0.1 | 39.5 ±0.1 | 16th | A01004 |
| Under 18 | 20.8% ±0.2% , number 1,986,925 ±18,240 | 21.0% ±<0.1% , number 71,689,151 ±111,800 | 26th | B02002 |
| 65 and over | 18.6% ±0.2% , number 1,771,253 ±19,330 | 19.0% ±<0.1% , number 64,775,018 ±120,300 | 30th | B02002 |
| Born outside the US | 24.9% ±0.3% , number 2,380,189 ±31,790 | 14.7% ±0.1% , number 50,409,320 ±204,800 | 2nd | A06001 |
| Speak a language other than English at home | 34.0% ±0.4% , number 3,067,409 ±43,940 | 22.9% ±0.1% , number 74,190,755 ±244,000 | 3rd | C16001 |
| Veterans (adults) | 3.4% ±0.1% , number 254,840 ±10,810 | 5.9% ±<0.1% , number 15,746,228 ±85,320 | 49th | A16002 |
| Living with a disability | 11.1% ±0.2% , number 1,049,020 ±19,000 | 13.7% ±<0.1% , number 46,271,455 ±126,000 | 50th | B18101 |
| Women 15–50 who had a baby in the past year | 5.6% ±0.4% , number 125,370 ±8,315 | 5.0% ±0.1% , number 4,016,759 ±44,040 | 24th | B13002 |
| Lived in the same home a year ago | 90.9% ±0.4% , number 8,590,802 ±36,670 | 88.4% ±0.1% , number 298,889,697 ±214,800 | 1st | A08001 |
| White, not Hispanic | 48.3% ±0.1% , number 4,609,262 ±9,777 | 55.0% ±<0.1% , number 187,959,031 ±58,340 | 42nd | A04001 |
| Hispanic or Latino | 24.0% , number 2,292,134 | 20.5% ±<0.1% , number 69,975,516 ±13,270 | 8th | A04001 |
| Black, not Hispanic | 11.9% ±0.2% , number 1,131,863 ±14,910 | 11.7% ±<0.1% , number 40,096,453 ±106,200 | 17th | A04001 |
| Asian, not Hispanic | 11.0% ±0.1% , number 1,053,679 ±9,557 | 6.5% ±<0.1% , number 22,096,709 ±58,340 | 3rd | A04001 |
*1 is the highest. Population is ranked among all states, and the rest among those of 1,000 people or more, whose figures can be ranked. Ranks use 5-year estimates, the only ones covering every state, so they can differ slightly from the figures here.
Income and work
Higher incomes than the US
The median household income is $107,797, higher than the US ($84,780). 8.7% of people live in poverty, and 7.7% have no health insurance, lower than the US (8.4%).
Household income
Source: ACS 2025 1-year, table A14001.
Show data
| New Jersey | United States | |
|---|---|---|
| Under $25,000 | 10.7% ±0.4% , number 383,145 ±14,990 | 14.0% ±0.1% , number 18,727,548 ±88,990 |
| $25,000 to $49,999 | 12.0% ±0.4% , number 428,174 ±14,840 | 15.4% ±0.1% , number 20,665,585 ±101,400 |
| $50,000 to $74,999 | 12.4% ±0.4% , number 443,504 ±13,740 | 15.3% ±0.1% , number 20,513,565 ±88,500 |
| $75,000 to $99,999 | 11.2% ±0.4% , number 400,901 ±13,840 | 12.5% ±0.1% , number 16,814,245 ±87,520 |
| $100,000 to $149,999 | 18.1% ±0.5% , number 646,515 ±16,600 | 17.9% ±0.1% , number 24,018,984 ±99,670 |
| $150,000 to $199,999 | 12.5% ±0.4% , number 443,847 ±13,310 | 10.1% ±0.1% , number 13,521,827 ±70,660 |
| $200,000 or more | 23.0% ±0.5% , number 818,922 ±17,190 | 14.8% ±0.1% , number 19,801,668 ±84,120 |
Embed
What residents do for work
Source: ACS 2025 1-year, table A17004.
Show data
| New Jersey | United States | |
|---|---|---|
| Education and health care | 25.1% ±0.4% , number 1,238,910 ±21,690 | 24.4% ±0.1% , number 40,862,193 ±140,800 |
| Professional and business services | 14.9% ±0.4% , number 737,483 ±19,960 | 12.8% ±0.1% , number 21,375,231 ±87,110 |
| Retail trade | 10.6% ±0.3% , number 525,833 ±15,500 | 10.6% ±0.1% , number 17,781,181 ±96,660 |
| Finance, insurance and real estate | 8.6% ±0.3% , number 423,330 ±13,920 | 6.6% ±<0.1% , number 11,025,569 ±68,570 |
| Manufacturing | 7.7% ±0.3% , number 381,919 ±13,190 | 9.6% ±0.1% , number 16,064,394 ±91,270 |
| Arts, food and lodging | 7.4% ±0.3% , number 363,661 ±15,000 | 8.9% ±0.1% , number 14,811,502 ±87,840 |
| Transportation and warehousing | 6.6% ±0.3% , number 324,973 ±14,310 | 5.9% ±<0.1% , number 9,832,211 ±73,020 |
| Construction | 5.8% ±0.2% , number 287,233 ±12,250 | 6.7% ±<0.1% , number 11,254,981 ±79,620 |
Embed
Where workers come from and go
New Jersey has 4,162,765 jobs and 4,505,527 employed residents. 409,928 people commute in to work and 752,690 commute out, while 3,752,837 both live and work here. The most commuters come from New York.
Most commuters come from
- New York: 195,365
- Pennsylvania: 159,087
- Delaware: 10,838
Most residents commute to
- New York: 530,382
- Pennsylvania: 157,323
- Delaware: 14,355
Show data
| New Jersey | |
|---|---|
| Live and work here | 3,752,837 |
| Work here, live elsewhere | 409,928 |
| Live here, work elsewhere | 752,690 |
Embed
All the numbers
| Indicator | New Jersey | US | Rank among states* | Table |
|---|---|---|---|---|
| Median household income | $107,797 ±$1,374 | $84,780 ±$215 | 4th | A14006 |
| Income per person | $56,593 ±$607 | $47,171 ±$115 | 4th | A14024 |
| Income inequality (Gini index) | 0.476 ±0.004 | 0.482 ±0.001 | 12th | A14028 |
| Living in poverty | 8.7% ±0.4% , number 817,486 ±37,820 | 11.8% ±0.1% , number 39,264,183 ±277,400 | 46th | A13004 |
| Unemployment rate | 5.3% ±0.2% , number 274,590 ±12,740 | 4.9% ±<0.1% , number 8,574,594 ±64,350 | 5th | A17005 |
| No health insurance | 7.7% ±0.2% , number 725,325 ±23,210 | 8.4% ±<0.1% , number 28,323,306 ±152,000 | 24th | A20001 |
*1 is the highest. Population is ranked among all states, and the rest among those of 1,000 people or more, whose figures can be ranked. Ranks use 5-year estimates, the only ones covering every state, so they can differ slightly from the figures here.
Education
More college degrees than the US
45.0% of adults 25 and over have a bachelor’s degree or more, higher than the US (37.4%).
Highest level of education
Source: ACS 2025 1-year, table A12001.
Show data
| New Jersey | United States | |
|---|---|---|
| Less than high school | 8.6% ±0.3% , number 576,205 ±17,330 | 9.4% ±0.1% , number 22,321,002 ±120,500 |
| High school only | 24.7% ±0.4% , number 1,660,983 ±24,560 | 25.6% ±0.1% , number 61,096,726 ±203,400 |
| Some college | 21.7% ±0.4% , number 1,460,999 ±28,010 | 27.7% ±0.1% , number 65,920,977 ±173,500 |
| Bachelor’s degree | 26.2% ±0.3% , number 1,766,165 ±20,940 | 22.3% ±0.1% , number 53,224,312 ±196,700 |
| Graduate degree | 18.8% ±0.3% , number 1,265,202 ±22,070 | 15.0% ±0.1% , number 35,816,011 ±159,400 |
Embed
All the numbers
| Indicator | New Jersey | US | Rank among states* | Table |
|---|---|---|---|---|
| Bachelor’s degree or more | 45.0% ±0.5% , number 3,031,367 ±30,420 | 37.4% ±0.1% , number 89,040,323 ±253,200 | 5th | A12001 |
| High school graduate or more | 91.4% ±0.7% , number 6,153,349 ±48,090 | 90.6% ±0.2% , number 216,058,026 ±368,200 | 30th | A12001 |
*1 is the highest. Population is ranked among all states, and the rest among those of 1,000 people or more, whose figures can be ranked. Ranks use 5-year estimates, the only ones covering every state, so they can differ slightly from the figures here.
Housing
Home values outran incomes
36.2% of households rent, higher than the US (34.7%). The median home is worth $530,800 and the median rent is $1,885. After inflation, home values rose 20% from 2015 to 2025, while household income rose 9%.
Housing costs and income, 2015 to 2025, after inflation
Source: ACS 1-year, table A10036, A18009, A14006.
Show data
| New Jersey | United States | |
|---|---|---|
| Median home value | +20.1% | +39.3% |
| Median rent | +13.3% | +18.5% |
| Median household income | +8.9% | +10.9% |
Embed
Types of homes
Source: ACS 2025 1-year, table A10032.
Show data
| New Jersey | United States | |
|---|---|---|
| Single-family, detached | 52.3% ±0.4% , number 2,001,358 ±15,560 | 60.9% ±0.1% , number 90,335,844 ±173,300 |
| Single-family, attached | 10.3% ±0.3% , number 395,932 ±11,490 | 6.4% ±<0.1% , number 9,527,703 ±51,230 |
| 2 to 4 units | 14.5% ±0.4% , number 554,531 ±15,920 | 7.5% ±0.1% , number 11,109,005 ±75,790 |
| 5 to 19 units | 9.1% ±0.3% , number 348,213 ±12,970 | 8.7% ±0.1% , number 12,829,882 ±97,590 |
| 20 or more units | 12.8% ±0.3% , number 491,204 ±13,140 | 11.1% ±0.1% , number 16,381,450 ±92,310 |
| Mobile homes and other | 0.9% ±0.1% , number 36,306 ±4,325 | 5.4% ±<0.1% , number 8,045,083 ±53,680 |
Embed
When homes were built
Source: ACS 2025 1-year, table A10055.
Show data
| New Jersey | United States | |
|---|---|---|
| 2010 or later | 9.2% ±0.3% , number 329,250 ±12,480 | 15.1% ±0.1% , number 20,257,912 ±101,300 |
| 2000 to 2009 | 9.6% ±0.4% , number 341,275 ±12,880 | 13.8% ±0.1% , number 18,535,840 ±92,260 |
| 1980 to 1999 | 19.8% ±0.4% , number 706,616 ±15,490 | 24.1% ±0.1% , number 32,332,570 ±118,900 |
| 1960 to 1979 | 24.6% ±0.5% , number 875,314 ±16,960 | 22.9% ±0.1% , number 30,726,302 ±110,000 |
| Before 1960 | 36.8% ±0.6% , number 1,312,553 ±22,870 | 24.0% ±0.1% , number 32,210,798 ±121,500 |
Embed
All the numbers
| Indicator | New Jersey | US | Rank among states* | Table |
|---|---|---|---|---|
| Housing units | 3,827,544 | – | – | A10001 |
| Households | 3,565,008 ±10,950 | – | – | A10008 |
| People per household | 2.63 ±0.01 | 2.49 ±0.01 | 6th | A10003 |
| Households that rent | 36.2% ±0.5% , number 1,289,291 ±17,120 | 34.7% ±0.1% , number 46,551,688 ±193,200 | 12th | A10060 |
| Vacant homes | 6.9% ±0.3% , number 262,536 ±10,990 | 9.6% ±0.1% , number 14,165,545 ±137,100 | 49th | A10047, A10060 |
| Median gross rent | $1,885 ±$19 | $1,557 ±$4 | 7th | A18009 |
| Median home value | $530,800 ±$3,638 | $371,100 ±$646 | 9th | A10036 |
| Renters paying 30% or more of income | 50.4% ±1.4% , number 649,449 ±19,600 | 48.3% ±0.2% , number 22,486,693 ±122,100 | 9th | A18002 |
| Owners paying 30% or more of income | 29.0% ±0.7% , number 660,011 ±16,290 | 24.2% ±0.1% , number 21,201,943 ±93,050 | 3rd | A10040 |
| Homes built before 1960 | 36.8% ±0.6% , number 1,312,553 ±22,870 | 24.0% ±0.1% , number 32,210,798 ±121,500 | 7th | A10055 |
*1 is the highest. Population is ranked among all states, and the rest among those of 1,000 people or more, whose figures can be ranked. Ranks use 5-year estimates, the only ones covering every state, so they can differ slightly from the figures here.
Getting around
How people get around
63.8% of workers drive alone and 13.0% work from home. 47.8% of those who travel to work spend 30 minutes or more getting there, and 11.2% of households have no vehicle.
How people get to work
Source: ACS 2025 1-year, table A09005.
Show data
| New Jersey | United States | |
|---|---|---|
| Drive alone | 63.8% ±0.5% , number 3,080,468 ±27,950 | 69.8% ±0.1% , number 115,297,377 ±192,900 |
| Carpool | 8.1% ±0.3% , number 392,555 ±15,580 | 8.9% ±0.1% , number 14,712,170 ±97,240 |
| Public transit | 10.6% ±0.3% , number 512,799 ±14,010 | 4.3% ±<0.1% , number 7,100,386 ±63,330 |
| Walk | 2.6% ±0.2% , number 127,337 ±8,712 | 2.4% ±<0.1% , number 4,016,469 ±41,070 |
| Work from home | 13.0% ±0.3% , number 627,095 ±16,580 | 12.9% ±0.1% , number 21,288,393 ±105,700 |
| Other | 1.8% ±0.2% , number 87,923 ±7,263 | 1.7% ±<0.1% , number 2,799,658 ±41,510 |
Embed
Time spent getting to work
Source: ACS 2025 1-year, table B09001.
Show data
| New Jersey | United States | |
|---|---|---|
| Under 10 minutes | 9.3% ±0.3% , number 389,516 ±14,740 | 12.0% ±0.1% , number 17,199,225 ±93,440 |
| 10 to 19 minutes | 23.6% ±0.5% , number 990,633 ±22,160 | 27.8% ±0.1% , number 40,059,540 ±137,700 |
| 20 to 29 minutes | 19.3% ±0.5% , number 811,753 ±21,660 | 21.0% ±0.1% , number 30,221,743 ±111,100 |
| 30 to 39 minutes | 17.1% ±0.4% , number 716,609 ±17,410 | 17.1% ±0.1% , number 24,659,138 ±103,800 |
| 40 to 59 minutes | 15.2% ±0.4% , number 639,248 ±18,050 | 12.6% ±0.1% , number 18,104,709 ±97,070 |
| 60 minutes or more | 15.6% ±0.4% , number 653,323 ±18,030 | 9.5% ±0.1% , number 13,681,705 ±84,440 |
Embed
Vehicles per household
Source: ACS 2025 1-year, table A10030.
Show data
| New Jersey | United States | |
|---|---|---|
| None | 11.2% ±0.4% , number 398,119 ±12,540 | 8.8% ±0.1% , number 11,781,997 ±77,240 |
| One | 34.6% ±0.6% , number 1,233,704 ±21,120 | 33.1% ±0.1% , number 44,424,682 ±160,700 |
| Two | 35.7% ±0.5% , number 1,273,782 ±18,530 | 36.0% ±0.1% , number 48,200,889 ±176,800 |
| Three or more | 18.5% ±0.4% , number 659,403 ±15,700 | 22.1% ±0.1% , number 29,655,854 ±113,300 |
Embed
All the numbers
| Indicator | New Jersey | US | Rank among states* | Table |
|---|---|---|---|---|
| Drive to work alone | 63.8% ±0.5% , number 3,080,468 ±27,950 | 69.8% ±0.1% , number 115,297,377 ±192,900 | 48th | A09005 |
| Take public transit | 10.6% ±0.3% , number 512,799 ±14,010 | 4.3% ±<0.1% , number 7,100,386 ±63,330 | 3rd | A09005 |
| Work from home | 13.0% ±0.3% , number 627,095 ±16,580 | 12.9% ±0.1% , number 21,288,393 ±105,700 | 14th | A09005 |
| Commute 30 minutes or more | 47.8% ±0.7% , number 2,009,180 ±30,890 | 39.2% ±0.1% , number 56,445,552 ±165,300 | 4th | B09001 |
| Households with no vehicle | 11.2% ±0.3% , number 398,119 ±11,840 | 8.8% ±<0.1% , number 11,781,997 ±64,240 | 4th | A10030 |
*1 is the highest. Population is ranked among all states, and the rest among those of 1,000 people or more, whose figures can be ranked. Ranks use 5-year estimates, the only ones covering every state, so they can differ slightly from the figures here.
Places
The largest cities in New Jersey
Population, from the latest estimates available. Figures cover the whole of each place.
Largest places
- Newark: 323,800
- Jersey City: 302,004
- Paterson: 161,794
- Elizabeth: 141,676
- Toms River: 98,624
- Trenton: 91,495
- Clifton: 91,124
- Bayonne: 74,747
States like this one
- Washington: 7,816,116
- Massachusetts: 7,044,056
- Maryland: 6,206,011
- Connecticut: 3,624,508
States at least a third this size, with the closest income, education, age, housing and origins.
Every county and place in New Jersey
Find any county, city, town, metro area, ZIP code, school district or district in New Jersey.
Counties
Each of the 21 counties with its population, from ACS 2020–2024 5-year estimates.
- Atlantic County276,270
- Bergen County962,316
- Burlington County467,805
- Camden County527,257
- Cape May County94,941
- Cumberland County153,305
- Essex County863,002
- Gloucester County306,954
- Hudson County718,323
- Hunterdon County130,160
- Mercer County385,864
- Middlesex County871,290
- Monmouth County645,353
- Morris County514,528
- Ocean County654,362
- Passaic County521,012
- Salem County65,275
- Somerset County349,846
- Sussex County145,807
- Union County579,290
- Warren County110,849
Cities, towns and other places
Each of the 700 with its population, from ACS 2020–2024 5-year estimates. Census-designated places are communities without a local government of their own, drawn by the Census Bureau so they can be counted.
- Absecon9,170
- Absecon Highlands1,288
- Allamuchy91
- Allendale6,865
- Allenhurst376
- Allentown1,702
- Allenwood757
- Alloway1,455
- Alpha2,436
- Alpine1,588
- Ampere North5,029
- Anderson607
- Andover728
- Annandale1,568
- Arrowhead Lake101
- Asbury241
- Asbury Park15,295
- Ashland9,320
- Atco8,164
- Atlantic City38,632
- Atlantic Highlands4,410
- Auburn1,100
- Audubon8,730
- Audubon Park1,001
- Avalon1,488
- Avenel17,121
- Avon-by-the-Sea2,030
- Barclay4,607
- Bargaintown5,377
- Barnegat3,360
- Barnegat Light500
- Barrington7,076
- Basking Ridge7,917
- Bay Head1,205
- Bayonne71,553
- Beach Haven1,055
- Beach Haven West5,120
- Beachwood11,088
- Beattystown4,917
- Beckett5,017
- Bedminster1,670
- Beesleys Point1,335
- Belford1,636
- Belle Mead6,394
- Belleplain495
- Bellmawr11,737
- Belmar5,869
- Belvidere2,538
- Bergenfield28,450
- Berlin7,539
- Bernardsville7,916
- Beverly2,514
- Blackwells Mills10,301
- Blackwood4,443
- Blairstown344
- Blawenburg85
- Bloomingdale7,716
- Bloomsbury841
- Bogota9,360
- Boonton8,854
- Bordentown4,026
- Bound Brook12,219
- Bradley Beach4,158
- Bradley Gardens14,165
- Brainards98
- Branchville814
- Brass Castle1,936
- Bridgeport228
- Bridgeton27,001
- Bridgeville104
- Bridgewater Center6,505
- Brielle4,956
- Brigantine7,674
- Broadway115
- Brookdale9,960
- Brookfield673
- Brooklawn1,780
- Brookside1,465
- Browns Mills9,672
- Brownville2,377
- Budd Lake10,650
- Buena4,520
- Burleigh159
- Burlington9,993
- Butler8,133
- Buttzville198
- Byram Center2,188
- Caldwell9,003
- Califon930
- Camden71,496
- Cape May2,767
- Cape May Court House5,628
- Cape May Point138
- Carlls Corner868
- Carlstadt6,378
- Carneys Point8,050
- Carteret25,496
- Cedar Glen Lakes1,519
- Cedar Glen West1,504
- Cedar Knolls4,882
- Cedarville661
- Centre Grove1,339
- Chatham9,407
- Cherry Hill Mall14,541
- Chesilhurst1,409
- Chester1,512
- Clayton8,921
- Clearbrook2,375
- Clementon5,410
- Cliffside Park25,781
- Cliffwood Beach3,056
- Clifton89,379
- Clinton2,789
- Closter8,606
- Clyde129
- Collings Lakes1,988
- Collingswood14,205
- Cologne1,083
- Colonia18,587
- Columbia174
- Concordia2,611
- Connecticut Farms516
- Cookstown646
- Corbin City662
- Country Lake Estates5,055
- Cranbury2,185
- Crandon Lakes1,293
- Cranford1,937
- Cream Ridge727
- Cresskill9,174
- Crestwood Village7,830
- Crosswicks900
- Cumberland-Hesstown90
- Dayton7,952
- Deal686
- Deans1,154
- Deerfield Street322
- Delaware101
- Delaware Park374
- Delmont223
- Demarest4,911
- Dennisville736
- Diamond Beach350
- Dividing Creek652
- Dorchester137
- Dorothy1,225
- Dover18,563
- Dover Beaches North1,586
- Dover Beaches South1,601
- Dumont18,279
- Dunellen7,911
- Dutch Neck96
- East Franklin11,070
- East Freehold5,096
- East Millstone698
- East Newark2,497
- East Orange70,090
- East Rocky Hill235
- East Rutherford10,313
- East Vineland1,429
- Eatontown13,575
- Echelon13,284
- Edgewater14,759
- Egg Harbor City4,400
- Elizabeth137,302
- Ellisburg4,829
- Elmer1,176
- Elmwood Park21,412
- Elwood733
- Emerson7,305
- Encore at Monroe872
- Englewood29,638
- Englewood Cliffs5,362
- English Creek2,548
- Englishtown1,989
- Erma1,959
- Essex Fells2,361
- Estell Manor1,565
- Fair Haven6,170
- Fair Lawn35,610
- Fairton930
- Fairview borough15,099
- Fairview CDP3,892
- Fanwood7,799
- Far Hills948
- Farmingdale1,449
- Fieldsboro649
- Finderne6,489
- Finesville301
- Flagtown930
- Flanders8,809
- Flemington4,896
- Florence5,242
- Florham Park13,564
- Folsom1,773
- Fords12,771
- Forked River5,196
- Forsgate2,102
- Fort Dix7,984
- Fort Lee40,067
- Fortescue120
- Franklin4,968
- Franklin Center6,646
- Franklin Lakes11,084
- Franklin Park13,211
- Franklinville1,904
- Freehold12,507
- Frenchtown1,752
- Gandys Beach43
- Garfield32,783
- Garwood4,885
- Germania890
- Gibbsboro2,435
- Gibbstown3,685
- Gillette2,833
- Glassboro23,717
- Glen Gardner1,916
- Glen Ridge7,943
- Glen Rock12,154
- Glendora5,431
- Gloucester City11,509
- Golden Triangle5,765
- Goshen340
- Gouldtown1,546
- Great Meadows604
- Great Notch4,008
- Green Knoll6,789
- Green Village1,130
- Greentree11,537
- Greenwich (Cumberland County)175
- Greenwich (Warren County)2,679
- Grenloch666
- Griggstown812
- Groveville3,100
- Guttenberg11,754
- Hackensack46,057
- Hackettstown10,140
- Haddon Heights7,516
- Haddonfield12,595
- Hainesburg239
- Haledon8,980
- Hamburg3,308
- Hamilton Square11,622
- Hammonton14,840
- Hampton1,020
- Hancocks Bridge320
- Harlingen593
- Harmony263
- Harrington Park4,954
- Harrison20,369
- Harrisonville227
- Harvey Cedars487
- Hasbrouck Heights12,115
- Haworth3,363
- Hawthorne19,628
- Heathcote7,717
- Heislerville198
- Helmetta2,459
- Hewitt2,417
- Hi-Nella855
- Hibernia115
- High Bridge3,580
- Highland Lakes3,852
- Highland Park15,121
- Highlands4,518
- Hightstown5,920
- Hillsborough22,585
- Hillsdale10,144
- Ho-Ho-Kus4,270
- Hoboken58,668
- Holiday City South4,270
- Holiday City-Berkeley12,995
- Holiday Heights2,121
- Hopatcong14,565
- Hope185
- Hopelawn3,496
- Hopewell1,823
- Hutchinson114
- Interlaken939
- Iselin19,551
- Island Heights1,720
- Jamesburg5,770
- Jersey City294,078
- Jobstown286
- Johnsonburg406
- Juliustown313
- Kean University1,362
- Keansburg9,719
- Kearny40,614
- Keasbey2,252
- Kendall Park10,011
- Kenilworth8,401
- Kenvil1,722
- Keyport7,171
- Kingston1,670
- Kingston Estates6,668
- Kinnelon10,013
- Lake Como1,619
- Lake Hiawatha11,018
- Lake Hopatcong10,259
- Lake Mohawk9,508
- Lake Telemark1,506
- Lakehurst2,681
- Lakeside-Beebe Run222
- Lakewood69,585
- Lambertville4,153
- Lamington362
- Landing4,737
- Laurel Heights474
- Laurel Lake2,641
- Laurel Springs2,044
- Laurence Harbor6,191
- Lavallette1,865
- Lawnside3,200
- Lawrenceville3,924
- Layton967
- Lebanon1,675
- Ledgewood5,377
- Leeds Point77
- Leesburg431
- Leisure Knoll2,668
- Leisure Village5,751
- Leisure Village East4,247
- Leisure Village West3,969
- Leisuretowne3,564
- Leonardo2,493
- Leonia9,336
- Liberty Corner2,325
- Lincoln Park10,957
- Lincroft6,939
- Linden44,192
- Lindenwold21,719
- Linwood6,992
- Little Ferry10,996
- Little Silver6,105
- Llewellyn Park560
- Loch Arbour185
- Lodi26,082
- Long Branch32,530
- Long Valley1,720
- Longport901
- Lopatcong Overlook453
- Lower Berkshire Valley449
- Lyons5,187
- Macopin2,170
- Madison16,447
- Madison Park9,124
- Magnolia4,354
- Malaga1,693
- Manahawkin2,392
- Manasquan5,922
- Mantoloking481
- Manville10,921
- Margate City5,234
- Marksboro193
- Marlboro76
- Marlton10,922
- Marmora2,039
- Marshallville480
- Martinsville11,559
- Matawan9,710
- Mauricetown365
- Mays Landing6,406
- Maywood10,093
- McGuire AFB4,400
- McKee City10,731
- Medford Lakes4,297
- Mendham4,973
- Menlo Park Terrace3,062
- Mercerville13,535
- Merchantville3,905
- Metuchen15,144
- Mickleton1,786
- Middlebush2,049
- Middlesex14,645
- Midland Park7,019
- Milford1,166
- Millington3,220
- Millstone655
- Milltown7,059
- Millville27,511
- Milmay748
- Mizpah473
- Money Island25
- Monmouth Beach3,207
- Monmouth Junction9,141
- Monroe Manor2,286
- Montclair State University2,853
- Montvale8,901
- Moonachie3,126
- Moorestown-Lenola14,625
- Morganville5,902
- Morris Plains6,315
- Morristown20,453
- Mount Arlington5,935
- Mount Ephraim4,669
- Mount Hermon207
- Mount Hope3,120
- Mount Royal1,155
- Mount Tabor1,184
- Mountain Lake574
- Mountain Lakes4,585
- Mountainside7,049
- Mullica Hill4,591
- Mystic Island8,259
- National Park3,044
- Navesink1,867
- Neptune City4,606
- Nesco555
- Neshanic626
- Neshanic Station5,640
- Netcong3,659
- New Brunswick56,345
- New Egypt2,050
- New Gretna314
- New Milford16,995
- New Providence13,727
- New Vernon743
- New Village335
- Newark310,178
- Newfield1,844
- Newfoundland1,361
- Newport533
- Newton8,369
- Newtonville675
- North Arlington16,461
- North Beach Haven2,277
- North Caldwell6,656
- North Cape May3,731
- North Haledon8,778
- North Middletown3,035
- North Plainfield22,809
- North Wildwood3,602
- Northfield8,456
- Northvale4,829
- Norwood5,724
- Oak Ridge10,954
- Oak Valley4,413
- Oakhurst3,538
- Oakland12,768
- Oaklyn3,947
- Ocean Acres19,204
- Ocean City11,261
- Ocean Gate1,599
- Ocean Grove3,092
- Ocean View728
- Oceanport6,195
- Oceanville631
- Ogdensburg2,160
- Old Bridge28,236
- Old Tappan6,008
- Oldwick462
- Olivet1,573
- Oradell8,235
- Othello132
- Oxford1,122
- Packanack Lake6,321
- Palermo2,696
- Palisades Park20,290
- Palmyra7,485
- Panther Valley4,553
- Paramus26,568
- Park Ridge9,406
- Parsippany21,345
- Passaic70,002
- Paterson158,735
- Paulsboro6,248
- Peapack and Gladstone2,571
- Pedricktown424
- Pemberton1,312
- Pemberton Heights2,619
- Pennington2,827
- Penns Grove4,882
- Pennsville12,233
- Perth Amboy55,855
- Phillipsburg15,299
- Pine Beach2,306
- Pine Brook5,961
- Pine Hill10,802
- Pine Lake Park9,795
- Pine Ridge at Crestwood2,719
- Pines Lake2,882
- Pitman8,856
- Plainfield55,236
- Plainsboro Center2,773
- Pleasant Plains468
- Pleasantdale2,145
- Pleasantville20,712
- Pluckemin489
- Point Pleasant19,334
- Point Pleasant Beach4,855
- Pomona7,995
- Pompton Lakes11,047
- Pompton Plains10,971
- Port Colden332
- Port Elizabeth261
- Port Monmouth3,046
- Port Morris858
- Port Murray138
- Port Norris1,612
- Port Reading3,511
- Port Republic1,076
- Pottersville245
- Preakness18,520
- Presidential Lakes Estates1,947
- Princeton30,756
- Princeton Junction2,025
- Princeton Meadows15,561
- Prospect Park6,319
- Quinton432
- Rahway30,109
- Rainbow Lakes1,375
- Ramapo College of New Jersey2,018
- Ramblewood6,611
- Ramsey14,805
- Ramtown6,203
- Raritan8,368
- Red Bank12,862
- Regency at Monroe1,991
- Renaissance at Monroe581
- Richland639
- Richwood3,197
- Ridgefield11,498
- Ridgefield Park13,235
- Ridgewood26,308
- Ringoes934
- Ringwood11,657
- Rio Grande3,485
- River Edge12,091
- Riverdale4,112
- Riverton2,770
- Roadstown201
- Robbinsville Center3,777
- Robertsville12,035
- Rockaway6,613
- Rockleigh459
- Rocky Hill819
- Roebling3,452
- Roosevelt996
- Roseland6,268
- Roselle22,646
- Roselle Park14,093
- Rosenhayn1,308
- Ross Corner24
- Rossmoor3,350
- Rumson7,241
- Runnemede8,355
- Rutgers University-Busch Campus5,920
- Rutgers University-Livingston Campus3,258
- Rutherford18,894
- Saddle River3,389
- Salem5,322
- Sayreville45,838
- Sea Bright1,718
- Sea Girt1,980
- Sea Isle City2,000
- Seabrook Farms1,448
- Seaside Heights2,478
- Seaside Park1,793
- Seaville2,589
- Secaucus21,778
- Seeley85
- Sewaren3,248
- Sewell2,982
- Shark River Hills2,974
- Sheppards Mill61
- Shiloh228
- Ship Bottom957
- Short Hills14,923
- Shrewsbury4,179
- Sicklerville44,998
- Silver Lake (Cumberland County)2,011
- Silver Lake (Essex County)3,917
- Silver Lake (Warren County)284
- Silver Ridge1,279
- Singac4,207
- Six Mile Run2,882
- Skillman345
- Smithville9,545
- Somerdale5,581
- Somers Point10,515
- Somerset22,720
- Somerville13,410
- South Amboy9,989
- South Bound Brook4,867
- South Dennis1,528
- South Plainfield24,473
- South River16,124
- South Seaville564
- South Toms River3,716
- Spotswood8,171
- Spring Lake2,779
- Spring Lake Heights4,861
- Springdale15,173
- Springfield1,304
- Stanhope3,552
- Stewartsville710
- Stirling2,599
- Stockton446
- Stockton University2,621
- Stone Harbor893
- Stonebridge1,966
- Stratford7,018
- Strathmere266
- Strathmore6,708
- Succasunna9,799
- Summit22,705
- Sunset Lake1,194
- Surf City1,195
- Sussex2,145
- Swedesboro2,733
- Sweetwater1,067
- Tavistock4
- Ten Mile Run2,492
- Tenafly15,319
- Teterboro136
- The College of New Jersey3,658
- The Hills10,785
- The Ponds1,097
- Thorofare2,348
- Three Bridges630
- Tinton Falls19,361
- Titusville501
- Toms River94,956
- Totowa10,959
- Towaco5,612
- Trenton90,338
- Troy Hills5,179
- Tuckahoe175
- Tuckerton3,654
- Turnersville3,136
- Twin Rivers8,382
- Union2,774
- Union Beach5,707
- Union City66,463
- Upper Greenwood Lake3,319
- Upper Montclair12,457
- Upper Pohatcong1,876
- Upper Saddle River8,439
- Upper Stewartsville128
- Vauxhall6,157
- Ventnor City9,265
- Vernon Center1,503
- Vernon Valley1,532
- Victory Gardens1,759
- Victory Lakes1,577
- Vienna999
- Villas9,735
- Vincentown531
- Vineland61,006
- Vista Center2,133
- Voorhees2,000
- Waldwick10,164
- Wallington11,889
- Wanamassa4,279
- Wanaque11,206
- Waretown2,076
- Washington7,334
- Washington Crossing536
- Watchung6,485
- Watsessing8,232
- Wenonah2,261
- West Belmar2,862
- West Berlin2,285
- West Cape May1,011
- West Freehold14,883
- West Long Branch8,586
- West New York52,004
- West Park1,079
- West Wildwood588
- Westfield31,111
- Westmont14,195
- Weston2,105
- Westville4,310
- Westwood11,283
- Wharton7,318
- Whippany8,970
- White Horse10,507
- White House Station3,963
- White Meadow Lake8,842
- Whitesboro2,766
- Whittingham2,480
- Wildwood5,130
- Wildwood Crest3,077
- William Paterson University of New Jersey1,133
- Williamstown14,705
- Windsor325
- Wood-Ridge10,218
- Woodbine2,023
- Woodbridge20,756
- Woodbury10,042
- Woodbury Heights3,117
- Woodcliff Lake6,152
- Woodland Park13,355
- Woodlynne2,920
- Woodstown3,715
- Wrightstown448
- Yardville6,301
- Yorketown7,261
- Zarephath17
Metro and micro areas
Each of the 6 that reach into New Jersey, with its whole population, from ACS 2020–2024 5-year estimates. Metro and micro areas are counties tied together by commuting, drawn by the Office of Management and Budget.
ZIP codes
Each of the 595 with people in it, by the town it's centered in, from ACS 2020–2024 5-year estimates. These are the Census Bureau's ZIP Code Tabulation Areas, which follow the Postal Service's ZIP codes as closely as census blocks allow.
- 07001Avenel17,121
- 07002Bayonne71,553
- 07003Glen Ridge53,771
- 07004Pine Brook7,824
- 07005Boonton15,307
- 07006Caldwell26,654
- 07008Carteret25,526
- 07009Great Notch13,535
- 07010Cliffside Park25,781
- 07011Clifton38,587
- 07012Clifton14,653
- 07013Clifton30,811
- 07014Clifton4,975
- 07016Cranford24,074
- 07017East Orange40,910
- 07018East Orange28,924
- 07020Edgewater14,759
- 07021Essex Fells2,361
- 07022Fairview borough15,099
- 07023Fanwood7,799
- 07024Fort Lee40,024
- 07026Garfield32,783
- 07027Garwood4,885
- 07028Glen Ridge8,022
- 07029Harrison22,866
- 07030Hoboken58,668
- 07031North Arlington16,461
- 07032Kearny40,614
- 07033Kenilworth8,401
- 07034Lake Hiawatha11,018
- 07035Lincoln Park11,120
- 07036Linden45,671
- 07039Roseland31,488
- 07040Vauxhall25,613
- 07041Vauxhall7,532
- 07042Glen Ridge27,326
- 07043Upper Montclair13,256
- 07044Essex Fells14,545
- 07045Boonton10,561
- 07046Mountain Lakes4,585
- 07047West New York61,250
- 07050East Orange34,181
- 07052Llewellyn Park48,620
- 07054Troy Hills29,480
- 07055Passaic70,002
- 07057Wallington11,889
- 07058Pine Brook5,946
- 07059Millington16,811
- 07060Plainfield48,363
- 07062Plainfield15,399
- 07063Plainfield14,235
- 07064Port Reading3,481
- 07065Rahway30,109
- 07066Rahway15,622
- 07067Colonia18,587
- 07068Roseland6,268
- 07069Watchung6,623
- 07070Rutherford18,894
- 07071North Arlington22,463
- 07072Carlstadt6,378
- 07073East Rutherford10,313
- 07074Moonachie3,126
- 07075Wood-Ridge10,218
- 07076Fanwood24,843
- 07077Sewaren3,248
- 07078Short Hills14,613
- 07079Vauxhall18,539
- 07080South Plainfield24,411
- 07081Springfield17,171
- 07082Towaco5,723
- 07083Union58,170
- 07086Union City17,295
- 07087Union City66,463
- 07088Vauxhall2,901
- 07090Westfield31,111
- 07092Mountainside7,049
- 07093West New York63,758
- 07094Secaucus21,778
- 07095Woodbridge20,756
- 07102Newark12,358
- 07103Newark37,293
- 07104Newark52,266
- 07105Newark57,093
- 07106Newark36,383
- 07107Newark43,293
- 07108Newark28,790
- 07109Silver Lake37,984
- 07110Brookdale29,980
- 07111Union60,867
- 07112Newark29,456
- 07114Newark13,670
- 07201Elizabeth28,467
- 07202Elizabeth44,968
- 07203Roselle22,646
- 07204Roselle Park14,093
- 07205Kean University22,349
- 07206Elizabeth31,930
- 07208Elizabeth31,937
- 07302Jersey City56,220
- 07304Jersey City51,306
- 07305Jersey City72,161
- 07306Jersey City54,017
- 07307Jersey City42,645
- 07310Jersey City16,015
- 07311Jersey City1,714
- 07401Allendale6,865
- 07403Bloomingdale7,685
- 07405Kinnelon17,983
- 07407Elmwood Park21,412
- 07410Fair Lawn35,610
- 07416Franklin5,851
- 07417Franklin Lakes11,112
- 07418Vernon Valley2,559
- 07419Hamburg9,693
- 07420Wanaque5,316
- 07421Hewitt6,977
- 07422Highland Lakes5,280
- 07423Ho-Ho-Kus4,270
- 07424Woodland Park28,085
- 07430Ramapo College of New Jersey25,491
- 07432Midland Park7,019
- 07435Newfoundland2,703
- 07436Oakland12,740
- 07438Oak Ridge11,160
- 07439Ogdensburg2,160
- 07440Pompton Plains4,670
- 07442Pompton Lakes11,047
- 07444Pompton Plains10,971
- 07446Ramsey14,805
- 07450Ridgewood26,308
- 07452Glen Rock12,154
- 07456Ringwood11,657
- 07457Riverdale4,112
- 07458Saddle River11,828
- 07460Highland Lakes3,181
- 07461Sussex18,731
- 07462Vernon Center7,195
- 07463Waldwick10,164
- 07465Wanaque5,921
- 07470Packanack Lake54,112
- 07480Newfoundland14,966
- 07481Midland Park17,050
- 07501Paterson35,481
- 07502Paterson17,158
- 07503Paterson19,170
- 07504Paterson13,123
- 07505Paterson4,691
- 07506Hawthorne19,628
- 07508North Haledon23,762
- 07512Totowa10,959
- 07513Paterson11,576
- 07514Paterson20,647
- 07522Paterson23,040
- 07524Paterson13,808
- 07601Hackensack46,057
- 07603Bogota9,360
- 07604Hasbrouck Heights12,115
- 07605Leonia9,379
- 07606Teterboro2,770
- 07607Maywood10,093
- 07608Teterboro136
- 07620Alpine1,588
- 07621Bergenfield28,450
- 07624Closter8,606
- 07626Cresskill9,174
- 07627Demarest4,911
- 07628Dumont18,279
- 07630Emerson7,305
- 07631Englewood29,638
- 07632Englewood Cliffs5,362
- 07640Harrington Park4,954
- 07641Haworth3,363
- 07642Hillsdale10,144
- 07643Little Ferry10,996
- 07644Lodi26,082
- 07645Montvale8,901
- 07646New Milford16,995
- 07647Northvale5,288
- 07648Norwood5,724
- 07649Oradell8,235
- 07650Palisades Park20,290
- 07652Paramus26,568
- 07656Park Ridge9,406
- 07657Ridgefield11,498
- 07660Ridgefield Park13,235
- 07661River Edge12,091
- 07662Maywood5,869
- 07663Elmwood Park14,419
- 07666Bogota41,876
- 07670Tenafly15,319
- 07675Old Tappan27,349
- 07676Hillsdale9,323
- 07677Woodcliff Lake6,152
- 07701Fairview CDP24,376
- 07702Shrewsbury4,179
- 07704Fair Haven6,170
- 07711Allenhurst1,641
- 07712Wanamassa40,194
- 07716Navesink8,893
- 07717Avon-by-the-Sea2,030
- 07718Belford6,658
- 07719West Belmar22,138
- 07720Bradley Beach4,158
- 07721Cliffwood Beach4,277
- 07722Lincroft9,990
- 07723Deal884
- 07724Eatontown24,016
- 07726Englishtown44,764
- 07727Farmingdale7,787
- 07728West Freehold55,984
- 07730Keyport17,534
- 07731Ramtown40,322
- 07732Highlands4,527
- 07733Morganville17,166
- 07734Keansburg12,925
- 07735Laurence Harbor19,159
- 07737Leonardo3,945
- 07738Lincroft6,939
- 07739Little Silver6,105
- 07740Long Branch32,917
- 07746Robertsville18,476
- 07747Matawan32,330
- 07748Port Monmouth28,633
- 07750Monmouth Beach3,207
- 07751Morganville21,109
- 07753Shark River Hills37,297
- 07755Oakhurst5,613
- 07756Ocean Grove3,092
- 07757Oceanport6,195
- 07758Port Monmouth4,076
- 07760Rumson9,692
- 07762Spring Lake8,262
- 07764West Long Branch8,586
- 07801Wharton27,128
- 07803Kenvil4,048
- 07821Andover9,662
- 07822Ross Corner827
- 07823Belvidere7,451
- 07825Blairstown9,210
- 07826Crandon Lakes5,967
- 07827Layton4,109
- 07828Budd Lake15,461
- 07830Califon7,379
- 07831Anderson36
- 07832Hainesburg3,593
- 07833Delaware70
- 07834Mount Tabor18,385
- 07836Flanders11,694
- 07838Great Meadows3,727
- 07840Hackettstown32,105
- 07842Hibernia56
- 07843Hopatcong11,098
- 07844Hope111
- 07846Johnsonburg45
- 07847Kenvil1,776
- 07848Ross Corner4,257
- 07849Lake Hopatcong8,380
- 07850Landing6,828
- 07851Layton263
- 07852Ledgewood4,233
- 07853Long Valley12,339
- 07856Lower Berkshire Valley4,774
- 07857Netcong3,728
- 07860Newton26,047
- 07863Port Murray3,819
- 07865Port Murray2,825
- 07866Lake Telemark22,663
- 07869Victory Gardens26,022
- 07870Beattystown34
- 07871Lake Mohawk21,437
- 07874Byram Center8,752
- 07876Succasunna9,641
- 07878Mount Tabor766
- 07880Vienna173
- 07881Crandon Lakes4
- 07882Brass Castle15,115
- 07885Lower Berkshire Valley11,806
- 07901Summit24,314
- 07920Lyons28,753
- 07921Bedminster7,700
- 07922New Providence12,195
- 07924Bernardsville7,713
- 07926Brookside161
- 07927Cedar Knolls4,882
- 07928New Providence19,974
- 07930Chester8,648
- 07931Far Hills2,985
- 07932Florham Park11,977
- 07933Gillette2,995
- 07934Peapack and Gladstone1,293
- 07935Green Village584
- 07936Roseland11,152
- 07939Lyons322
- 07940Madison17,610
- 07945Mendham9,690
- 07946Stirling2,982
- 07950Morris Plains21,651
- 07960Morristown46,702
- 07961Florham Park333
- 07970Brookside215
- 07974New Providence13,349
- 07976New Vernon389
- 07977Peapack and Gladstone917
- 07979Pottersville214
- 07980Stirling2,675
- 07981Whippany9,030
- 08001Alloway854
- 08002Cherry Hill Mall24,015
- 08003Springdale31,809
- 08004Atco11,429
- 08005Ocean Acres26,866
- 08006Barnegat Light500
- 08007Barrington5,417
- 08008North Beach Haven6,837
- 08009Berlin14,346
- 08010Beverly11,861
- 08011Pemberton56
- 08012Grenloch41,812
- 08014Bridgeport298
- 08015Country Lake Estates19,567
- 08016Burlington34,920
- 08019907
- 08020Mount Royal2,480
- 08021Clementon49,305
- 08022Jobstown9,172
- 08023Pennsville375
- 08026Gibbsboro2,435
- 08027Gibbstown4,984
- 08028Glassboro25,098
- 08029Glendora5,459
- 08030Gloucester City13,217
- 08031Bellmawr11,737
- 08032Grenloch242
- 08033Haddonfield17,763
- 08034Barclay20,901
- 08035Haddon Heights7,551
- 08036Vincentown6,065
- 08037Hammonton23,514
- 08038Hancocks Bridge351
- 08039Harrisonville38
- 08041Jobstown650
- 08042Juliustown131
- 08043Gibbsboro31,191
- 08045Lawnside3,200
- 08046Beverly31,981
- 08048Vincentown12,882
- 08049Magnolia5,282
- 08050Manahawkin28,053
- 08051Wenonah12,474
- 08052Cherry Hill Mall20,127
- 08053Marlton48,179
- 08054Ramblewood46,026
- 08055Medford Lakes29,109
- 08056Mickleton5,434
- 08057Moorestown-Lenola21,529
- 08059Mount Ephraim5,805
- 08060Jobstown25,835
- 08061Mount Royal4,508
- 08062Mullica Hill17,935
- 08063National Park3,051
- 08064Presidential Lakes Estates17
- 08065Palmyra7,485
- 08066Paulsboro7,760
- 08067Pedricktown1,711
- 08068Pemberton Heights6,613
- 08069Carneys Point13,413
- 08070Pennsville12,511
- 08071Pitman9,461
- 08072Quinton164
- 08073Beverly20
- 08074Richwood160
- 08075Beverly30,615
- 08077Riverton20,613
- 08078Runnemede8,051
- 08079Quinton10,762
- 08080Sewell38,159
- 08081Sicklerville50,264
- 08083Somerdale9,606
- 08084Stratford7,018
- 08085Swedesboro22,340
- 08086Thorofare9,001
- 08087Mystic Island25,342
- 08088Leisuretowne24,215
- 08089Chesilhurst4,231
- 08090Wenonah9,815
- 08091West Berlin5,963
- 08092Beach Haven West3,119
- 08093Westville9,438
- 08094Victory Lakes41,595
- 08096Woodbury35,336
- 08097Woodbury Heights3,062
- 08098Woodstown9,680
- 08102Camden8,292
- 08103Camden12,573
- 08104Camden22,148
- 08105Camden26,483
- 08106Audubon9,731
- 08107Oaklyn13,574
- 08108Collingswood18,654
- 08109Merchantville24,022
- 08110Merchantville19,158
- 08201Absecon10,412
- 08202Avalon1,612
- 08203Brigantine7,674
- 08204North Cape May16,573
- 08205Oceanville28,877
- 08210Goshen17,143
- 08212Cape May Point138
- 08215Egg Harbor City13,545
- 08217Elwood44
- 08221Linwood6,992
- 08223Marmora4,048
- 08224New Gretna223
- 08225Northfield8,456
- 08226Ocean City11,261
- 08230Seaville5,700
- 08232Pleasantville19,887
- 08234English Creek47,339
- 08240Stockton University2,648
- 08241Port Republic1,076
- 08242Rio Grande4,141
- 08243Sea Isle City2,000
- 08244Somers Point10,659
- 08245South Dennis23
- 08246South Seaville57
- 08247Stone Harbor965
- 08248Strathmere266
- 08251Villas10,503
- 08260West Wildwood12,959
- 08270Woodbine8,362
- 08302West Park47,279
- 08310Buena968
- 08311Cedarville1,746
- 08312Clayton8,556
- 08314Delmont454
- 08316Dorchester137
- 08317Dorothy1,246
- 08318Olivet11,961
- 08319Estell Manor1,205
- 08320Centre Grove1,021
- 08321Fortescue133
- 08322Franklinville10,202
- 08323Greenwich731
- 08324Heislerville210
- 08326Buena1,435
- 08327Dorchester3,408
- 08328Malaga1,476
- 08329Mauricetown159
- 08330Mays Landing29,972
- 08332Millville35,228
- 08340Cumberland-Hesstown725
- 08341Buena2,101
- 08343Elmer4,729
- 08344Newfield5,564
- 08345Newport825
- 08346Newtonville283
- 08348Port Elizabeth154
- 08349Port Norris2,441
- 08350Richland639
- 08352Rosenhayn112
- 08353Shiloh228
- 08360Vineland45,038
- 08361Vineland18,206
- 08401Atlantic City38,925
- 08402Margate City5,234
- 08403Longport1,046
- 08406Ventnor City8,972
- 08501Allentown6,364
- 08502Harlingen11,849
- 08505Bordentown19,142
- 08510Roosevelt5,386
- 08511Cookstown976
- 08512Cranbury12,928
- 08514Cream Ridge4,917
- 08515Crosswicks8,373
- 08518Florence6,508
- 08520Hightstown29,504
- 08525Hopewell4,522
- 08527Vista Center58,991
- 08528Kingston321
- 08530Lambertville8,119
- 08533Cookstown7,563
- 08534Pennington13,272
- 08535Roosevelt4,999
- 08536Plainsboro Center20,817
- 08540Princeton50,388
- 08542Princeton2,533
- 08544Princeton4,392
- 08550Princeton Junction21,067
- 08551Ringoes5,873
- 08553Rocky Hill819
- 08554Roebling3,527
- 08555Roosevelt996
- 08558Blawenburg7,648
- 08559Stockton4,836
- 08560Titusville3,245
- 08561Windsor325
- 08562McGuire AFB4,201
- 08608Trenton1,250
- 08609Trenton15,938
- 08610White Horse33,465
- 08611White Horse31,995
- 08618The College of New Jersey35,634
- 08619Mercerville24,089
- 08620Groveville11,621
- 08628The College of New Jersey9,831
- 08629Trenton13,013
- 08638The College of New Jersey22,816
- 08640Fort Dix7,984
- 08641McGuire AFB4,400
- 08648Lawrenceville31,323
- 08690Hamilton Square18,841
- 08691Robbinsville Center16,607
- 08701Lakewood139,149
- 08720Allenwood735
- 08721Beachwood22,783
- 08722Beachwood11,088
- 08723Leisure Village East32,141
- 08724Ramtown42,345
- 08730Brielle4,956
- 08731Holiday Heights21,629
- 08732Island Heights1,558
- 08733Lakehurst2,816
- 08734Forked River7,879
- 08735Dover Beaches North3,451
- 08736Manasquan13,223
- 08738Mantoloking1,381
- 08740Ocean Gate1,599
- 08741Pine Beach2,709
- 08742Point Pleasant25,732
- 08750Sea Girt3,483
- 08751Dover Beaches South4,185
- 08752Forked River2,338
- 08753Toms River65,448
- 08755Toms River29,670
- 08757Holiday City-Berkeley36,087
- 08758Waretown7,868
- 08759Crestwood Village34,237
- 08801Annandale7,267
- 08802Asbury4,552
- 08804Bloomsbury3,465
- 08805Bound Brook14,066
- 08807Green Knoll39,560
- 08809Clinton6,703
- 08810Dayton7,952
- 08812Dunellen14,224
- 08816Milltown49,360
- 08817Highland Park49,020
- 08820Metuchen39,978
- 08821Flagtown283
- 08822Flemington32,556
- 08823Pleasant Plains8,884
- 08824Kendall Park13,366
- 08825Frenchtown4,735
- 08826Glen Gardner5,459
- 08827Hampton4,346
- 08828Helmetta2,459
- 08829High Bridge3,580
- 08830Iselin19,551
- 08831Whittingham55,658
- 08832Keasbey2,252
- 08833Lebanon9,184
- 08835Manville10,921
- 08836Martinsville3,855
- 08837Keasbey19,437
- 08840Metuchen18,206
- 08844Hillsborough44,463
- 08846Middlesex14,645
- 08848Milford8,134
- 08850Milltown8,538
- 08852Monmouth Junction18,062
- 08853Neshanic Station5,634
- 08854Rutgers University-Busch Campus61,088
- 08857Old Bridge40,891
- 08858Oldwick20
- 08859Sayreville25,448
- 08861Perth Amboy59,351
- 08863Fords12,771
- 08865Lopatcong Overlook31,427
- 08867Clinton5,204
- 08869Raritan8,368
- 08872Sayreville20,204
- 08873Middlebush56,327
- 08876Bradley Gardens23,380
- 08879Sayreville23,556
- 08880South Bound Brook4,867
- 08882South River16,124
- 08884Spotswood8,187
- 08886Stewartsville6,435
- 08887Three Bridges1,380
- 08889White House Station10,193
- 08890Zarephath17
- 08901New Brunswick57,263
- 08902Franklin Park43,932
- 08904Highland Park15,121
Towns and townships
Each of the 241 with people in it, from ACS 2020–2024 5-year estimates: the county subdivisions that are governments of their own. A city, borough or village that is one too is listed with the places above.
- Aberdeen township19,332
- Alexandria township4,824
- Allamuchy township5,427
- Alloway township3,299
- Andover township5,801
- Barnegat township25,165
- Bass River township988
- Bedminster township8,283
- Belleville township38,065
- Berkeley Heights township13,426
- Berkeley township44,634
- Berlin township5,963
- Bernards township28,114
- Bethlehem township3,760
- Blairstown township5,741
- Bloomfield township53,793
- Boonton township4,423
- Bordentown township12,120
- Branchburg township15,140
- Brick township75,482
- Bridgewater township46,268
- Buena Vista township7,103
- Burlington township24,127
- Byram township8,119
- Carneys Point township8,665
- Cedar Grove township13,475
- Chatham township11,102
- Cherry Hill township76,725
- Chester township7,748
- Chesterfield township9,150
- Cinnaminson township17,415
- City of Orange township34,281
- Clark township15,622
- Clinton township13,350
- Colts Neck township9,953
- Commercial township4,674
- Cranbury township4,012
- Cranford township24,074
- Deerfield township3,160
- Delanco township4,872
- Delaware township4,577
- Delran township18,148
- Dennis township6,205
- Denville township17,205
- Deptford township32,263
- Downe township1,638
- Eagleswood township1,647
- East Amwell township3,940
- East Brunswick township49,945
- East Greenwich township12,187
- East Hanover township11,152
- East Windsor township30,062
- Eastampton township6,352
- Edgewater Park township9,003
- Edison township108,164
- Egg Harbor township48,073
- Elk township4,450
- Elsinboro township841
- Evesham township48,179
- Ewing township35,604
- Fairfield township (Cumberland County)5,422
- Fairfield township (Essex County)7,824
- Florence township12,935
- Frankford township5,322
- Franklin township (Gloucester County)16,490
- Franklin township (Hunterdon County)3,283
- Franklin township (Somerset County)68,907
- Franklin township (Warren County)2,992
- Fredon township3,281
- Freehold township35,651
- Frelinghuysen township2,137
- Galloway township37,996
- Gloucester township66,282
- Green Brook township7,028
- Green township3,657
- Greenwich township (Cumberland County)731
- Greenwich township (Gloucester County)4,984
- Greenwich township (Warren County)5,512
- Haddon township15,469
- Hainesport township6,065
- Hamilton township (Atlantic County)28,204
- Hamilton township (Mercer County)92,506
- Hampton township4,912
- Hanover township14,769
- Harding township3,896
- Hardwick township1,423
- Hardyston township8,322
- Harmony township2,517
- Harrison township13,790
- Hazlet township20,470
- Hillsborough township44,091
- Hillside township22,349
- Holland township5,204
- Holmdel township17,436
- Hope township1,818
- Hopewell township (Cumberland County)4,386
- Hopewell township (Mercer County)17,595
- Howell township53,926
- Independence township5,536
- Irvington township60,867
- Jackson township59,980
- Jefferson township20,587
- Kingwood township3,835
- Knowlton township2,919
- Lacey township29,508
- Lafayette township2,344
- Lakewood township139,019
- Lawrence township (Cumberland County)3,087
- Lawrence township (Mercer County)32,313
- Lebanon township6,234
- Liberty township2,680
- Little Egg Harbor township21,285
- Little Falls township14,790
- Livingston township31,488
- Logan township6,055
- Long Beach township3,143
- Long Hill township8,652
- Lopatcong township9,321
- Lower Alloways Creek township1,714
- Lower township21,956
- Lumberton township12,882
- Lyndhurst township22,463
- Mahwah township25,491
- Manalapan township40,693
- Manchester township45,880
- Mannington township1,913
- Mansfield township (Burlington County)8,974
- Mansfield township (Warren County)7,778
- Mantua township15,404
- Maple Shade township20,076
- Maplewood township25,613
- Marlboro township41,648
- Maurice River township5,350
- Medford township24,812
- Mendham township6,018
- Middle township20,277
- Middletown township66,883
- Millburn township22,145
- Millstone township10,385
- Mine Hill township4,048
- Monroe township (Gloucester County)37,648
- Monroe township (Middlesex County)49,032
- Montague township3,833
- Montclair township40,341
- Montgomery township23,841
- Montville township22,876
- Moorestown township21,548
- Morris township23,424
- Mount Holly township10,056
- Mount Laurel township46,026
- Mount Olive township29,149
- Mullica township5,832
- Neptune township28,265
- New Hanover township7,231
- North Bergen township61,250
- North Brunswick township44,375
- North Hanover township8,011
- Nutley township30,012
- Ocean township (Monmouth County)27,896
- Ocean township (Ocean County)9,014
- Old Bridge township68,406
- Oldmans township1,839
- Oxford township2,665
- Parsippany-Troy Hills township56,397
- Pemberton township27,030
- Pennsauken township37,275
- Pennsville township12,754
- Pequannock township15,641
- Pilesgrove township4,220
- Piscataway township61,297
- Pittsgrove township8,854
- Plainsboro township24,167
- Plumsted township8,659
- Pohatcong township3,266
- Quinton township2,615
- Randolph township26,604
- Raritan township24,361
- Readington township16,278
- River Vale township10,058
- Riverside township8,055
- Robbinsville township15,641
- Rochelle Park township5,869
- Rockaway township26,189
- Roxbury township23,211
- Saddle Brook township14,419
- Sandyston township1,928
- Scotch Plains township24,843
- Shamong township6,497
- Shrewsbury township1,156
- South Brunswick township47,137
- South Hackensack township2,770
- South Harrison township3,428
- South Orange Village township18,474
- Southampton township10,372
- Sparta township20,077
- Springfield township (Burlington County)3,257
- Springfield township (Union County)17,171
- Stafford township29,834
- Stillwater township4,052
- Stow Creek township1,312
- Tabernacle township6,854
- Teaneck township41,876
- Tewksbury township5,893
- Toms River township98,143
- Union township (Hunterdon County)6,430
- Union township (Union County)61,071
- Upper Deerfield township7,799
- Upper Freehold township7,250
- Upper Pittsgrove township3,466
- Upper township12,525
- Vernon township22,605
- Verona township14,545
- Voorhees township31,191
- Wall township26,541
- Walpack township4
- Wantage township10,941
- Warren township16,186
- Washington township (Bergen County)9,323
- Washington township (Burlington County)489
- Washington township (Gloucester County)49,220
- Washington township (Morris County)18,265
- Washington township (Warren County)6,691
- Waterford township10,451
- Wayne township53,756
- Weehawken township17,295
- West Amwell township3,027
- West Caldwell township10,995
- West Deptford township22,416
- West Milford township24,705
- West Orange township48,585
- West Windsor township30,479
- Westampton township9,198
- Weymouth township2,675
- White township4,679
- Willingboro township32,103
- Winfield township1,479
- Winslow township40,090
- Woodbridge township104,355
- Woodland township1,486
- Woolwich township13,526
- Wyckoff township17,050
School districts
Each of the 557 with people in it, from ACS 2020–2024 5-year estimates. Elementary districts teach the lower grades and secondary districts the upper ones, under them; the rest are unified, teaching every grade.
- Absecon City School District9,170
- Alexandria Township School Districtelementary4,824
- Allamuchy Township School District5,427
- Allendale Borough School Districtelementary6,865
- Allenhurst Borough School District376
- Alloway Township School District3,299
- Alpha Borough School District2,436
- Alpine Borough School District1,588
- Andover Regional School District6,529
- Asbury Park City School District15,295
- Atlantic City School District38,632
- Atlantic Highlands Borough School Districtelementary4,410
- Audubon Borough School District9,731
- Avalon Borough School District1,488
- Avon-by-the-Sea Borough School District2,030
- Barnegat Township School District25,165
- Barrington Borough School District7,076
- Bass River Township School Districtelementary988
- Bay Head Borough School District1,205
- Bayonne City School District71,553
- Beach Haven Borough School Districtelementary1,055
- Bedminster Township School District8,283
- Belleville Town School District38,065
- Bellmawr Borough School Districtelementary11,737
- Belmar Borough School District5,869
- Belvidere Town School District2,538
- Bergenfield Borough School District28,450
- Berkeley Heights Township School District13,426
- Berkeley Township School Districtelementary44,634
- Berlin Borough School Districtelementary7,539
- Berlin Township School District5,963
- Bernards Township School District28,114
- Bethlehem Township School Districtelementary3,760
- Beverly City School District2,514
- Black Horse Pike Regional School Districtsecondary86,374
- Blairstown Township School Districtelementary7,164
- Bloomfield Township School District53,793
- Bloomingdale Borough School District7,716
- Bloomsbury Borough School District841
- Bogota Borough School District9,360
- Boonton Town School District8,854
- Boonton Township School District4,423
- Bordentown Regional School District16,795
- Bound Brook Borough School District12,219
- Bradley Beach Borough School District4,158
- Branchburg Township School District15,140
- Brick Township School District75,482
- Bridgeton City School District27,001
- Bridgewater-Raritan Regional School District54,636
- Brielle Borough School District4,956
- Brigantine City School District7,674
- Brooklawn Borough School District1,780
- Buena Regional School District11,623
- Burlington City School District9,993
- Burlington Township School District24,127
- Butler Borough School District8,133
- Byram Township School Districtelementary8,119
- Caldwell-West Caldwell School District19,998
- Califon Borough School Districtelementary930
- Camden City School District71,496
- Cape May City School Districtelementary2,767
- Cape May Point Borough School District138
- Carlstadt Borough School Districtelementary6,378
- Carlstadt-East Rutherford School Districtsecondary16,691
- Carteret Borough School District25,496
- Cedar Grove Township School District13,475
- Central Regional School Districtsecondary52,224
- Cherry Hill Township School District76,725
- Chesilhurst Borough School District1,409
- Chester Township School Districtelementary9,260
- Chesterfield Township School Districtelementary9,150
- Cinnaminson Township School District17,415
- Clark Township School District15,622
- Clayton Borough School District8,921
- Clearview Regional School Districtsecondary29,194
- Clementon Borough School District5,410
- Cliffside Park Borough School District25,781
- Clifton City School District89,379
- Clinton Town-Glen Gardner School Districtelementary4,705
- Clinton Township School Districtelementary13,350
- Closter Borough School Districtelementary8,606
- Collingswood Borough School District14,205
- Colts Neck Township School Districtelementary9,990
- Commercial Township School District4,674
- Corbin City School District662
- Cranbury Township School District4,012
- Cranford Township School District24,074
- Cresskill Borough School District9,174
- Cumberland Regional School Districtsecondary23,038
- Deal Borough School District686
- Deerfield Township School Districtelementary3,160
- Delanco Township School District4,872
- Delaware Township School Districtelementary4,577
- Delaware Valley Regional School Districtsecondary16,781
- Delran Township School District18,148
- Delsea Regional High School School Districtsecondary20,940
- Demarest Borough School Districtelementary4,911
- Dennis Township School District6,205
- Denville Township School Districtelementary17,205
- Deptford Township School District32,263
- Dover Town School District20,322
- Downe Township School District1,638
- Dumont Borough School District18,279
- Dunellen Borough School District7,911
- Eagleswood Township School Districtelementary1,647
- East Amwell Township School Districtelementary3,940
- East Brunswick Township School District49,945
- East Greenwich Township School Districtelementary12,187
- East Hanover Township School Districtelementary11,152
- East Newark Borough School District2,497
- East Orange City School District70,090
- East Rutherford Borough School Districtelementary10,313
- East Windsor Regional School District35,982
- Eastampton Township School Districtelementary6,352
- Eastern Camden County Regional School Districtsecondary41,165
- Eatontown Borough School Districtelementary13,575
- Edgewater Borough School District14,759
- Edgewater Park Township School District9,003
- Edison Township School District108,164
- Egg Harbor City School Districtelementary4,400
- Egg Harbor Township School District48,073
- Elizabeth City School District137,302
- Elk Township School Districtelementary4,450
- Elmwood Park Borough School District21,412
- Elsinboro Township School District841
- Emerson Borough School District7,305
- Englewood City School District29,638
- Englewood Cliffs Borough School District5,362
- Essex Fells Borough School Districtelementary2,361
- Estell Manor City School District1,565
- Evesham Township School Districtelementary48,179
- Ewing Township School District35,604
- Fair Haven Borough School Districtelementary6,170
- Fair Lawn Borough School District35,610
- Fairfield Township School District (Cumberland County)elementary5,422
- Fairfield Township School District (Essex County)elementary7,824
- Fairview Borough School District15,099
- Farmingdale Borough School Districtelementary1,449
- Flemington-Raritan Regional School Districtelementary29,257
- Florence Township School District12,935
- Florham Park Borough School Districtelementary13,564
- Folsom Borough School District1,773
- Fort Lee Borough School District40,067
- Frankford Township School Districtelementary6,136
- Franklin Borough School Districtelementary4,968
- Franklin Lakes Borough School Districtelementary11,084
- Franklin Township School District68,907
- Franklin Township School District (Gloucester County)elementary16,490
- Franklin Township School District (Hunterdon County)elementary3,283
- Franklin Township School District (Warren County)elementary2,992
- Fredon Township School Districtelementary3,281
- Freehold Borough School Districtelementary12,507
- Freehold Regional School Districtsecondary197,816
- Freehold Township School Districtelementary35,651
- Frelinghuysen Township School Districtelementary2,137
- Frenchtown Borough School Districtelementary1,752
- Galloway Township School Districtelementary37,996
- Garfield City School District32,783
- Garwood Borough School District4,885
- Gateway Regional School Districtsecondary12,732
- Gibbsboro Borough School Districtelementary2,435
- Glassboro Borough School District23,717
- Glen Ridge Borough School District7,943
- Glen Rock Borough School District12,154
- Gloucester City School District11,509
- Gloucester Township School Districtelementary66,282
- Great Meadows Regional School District8,216
- Greater Egg Harbor Regional School Districtsecondary76,432
- Green Brook Township School District7,028
- Green Township School District3,657
- Greenwich Township School Districtelementary731
- Greenwich Township School District (Gloucester County)4,984
- Greenwich Township School District (Warren County)5,512
- Guttenberg Town School District11,754
- Hackensack City School District46,057
- Hackettstown Town School District10,140
- Haddon Heights Borough School District7,516
- Haddon Township School District15,469
- Haddonfield Borough School District12,599
- Hainesport Township School Districtelementary6,065
- Haledon Borough School Districtelementary8,980
- Hamburg Borough School Districtelementary3,308
- Hamilton Township School District92,506
- Hamilton Township School Districtelementary28,204
- Hammonton Town School District14,840
- Hampton Borough School Districtelementary1,020
- Hampton Township School Districtelementary4,912
- Hanover Park Regional School Districtsecondary39,485
- Hanover Township School Districtelementary14,769
- Harding Township School District3,896
- Hardyston Township School Districtelementary8,322
- Harmony Township School District2,517
- Harrington Park Borough School Districtelementary4,954
- Harrison Town School District20,369
- Harrison Township School Districtelementary13,790
- Hasbrouck Heights Borough School District12,251
- Haworth Borough School Districtelementary3,363
- Hawthorne Borough School District19,628
- Hazlet Township School District20,470
- Henry Hudson Regional School Districtsecondary8,928
- Hi-Nella Borough School District855
- High Bridge Borough School Districtelementary3,580
- High Point Regional School Districtsecondary21,566
- Highland Park Borough School District15,121
- Highlands Borough School Districtelementary4,518
- Hillsborough Township School District44,746
- Hillsdale Borough School Districtelementary10,144
- Hillside Township School District22,349
- Ho-Ho-Kus Borough School District4,270
- Hoboken City School District58,668
- Holland Township School Districtelementary5,204
- Holmdel Township School District17,436
- Hopatcong Borough School District14,565
- Hope Township School District1,818
- Hopewell Township School Districtelementary4,614
- Hopewell Valley Regional School District22,245
- Howell Township School Districtelementary53,889
- Hunterdon Central Regional School Districtsecondary54,052
- Interlaken Borough School District939
- Irvington Township School District60,867
- Island Heights Borough School Districtelementary1,720
- Jackson Township School District59,980
- Jamesburg Borough School District5,770
- Jefferson Township School District20,587
- Jersey City School District294,078
- Joint Base McGuire-Dix-Lakehurst12,384
- Keansburg Borough School District9,719
- Kearny Town School District40,614
- Kenilworth Borough School District8,401
- Keyport Borough School District7,171
- Kingsway Regional School Districtsecondary31,874
- Kingwood Township School Districtelementary3,835
- Kinnelon Borough School District10,013
- Kittatinny Regional School Districtsecondary14,177
- Knowlton Township School Districtelementary2,919
- Lacey Township School District29,508
- Lafayette Township School Districtelementary2,344
- Lake Como Borough School District1,619
- Lakehurst Borough School District2,681
- Lakeland Regional School Districtsecondary22,863
- Lakewood Township School District139,019
- Laurel Springs Borough School District2,044
- Lavallette Borough School District1,865
- Lawnside Borough School District3,200
- Lawrence Township School District (Cumberland County)3,087
- Lawrence Township School District (Mercer County)32,313
- Lebanon Borough School Districtelementary1,675
- Lebanon Township School Districtelementary6,234
- Lenape Regional School Districtsecondary148,523
- Lenape Valley Regional School Districtsecondary15,330
- Leonia Borough School District9,336
- Lincoln Park Borough School District10,957
- Linden City School District44,192
- Lindenwold Borough School District21,719
- Linwood City School Districtelementary6,992
- Little Egg Harbor Township School Districtelementary21,285
- Little Falls Township School Districtelementary14,790
- Little Ferry Borough School District10,996
- Little Silver Borough School Districtelementary6,105
- Livingston Township School District31,488
- Loch Arbour School District185
- Lodi Borough School District26,082
- Logan Township School District6,055
- Long Beach Island School Districtelementary6,282
- Long Branch City School District32,530
- Long Hill Township School Districtelementary8,652
- Longport Borough School District901
- Lopatcong Township School District9,321
- Lower Alloways Creek Township School District1,714
- Lower Cape May Regional School Districtsecondary25,734
- Lower Township School Districtelementary21,956
- Lumberton Township School Districtelementary12,882
- Lyndhurst Township School District22,463
- Madison Borough School District16,447
- Magnolia Borough School Districtelementary4,354
- Mahwah Township School District25,491
- Mainland Regional School Districtsecondary25,963
- Manalapan-Englishtown Regional School Districtelementary42,682
- Manasquan Borough School District5,922
- Manchester Township School District45,880
- Mannington Township School District1,913
- Mansfield Township School District (Burlington County)elementary8,974
- Mansfield Township School District (Warren County)elementary7,778
- Mantua Township School Districtelementary15,404
- Manville Borough School District10,921
- Maple Shade Township School District20,076
- Margate City School District5,234
- Marlboro Township School Districtelementary41,648
- Matawan-Aberdeen Regional School District29,042
- Maurice River Township School District5,350
- Maywood Borough School District10,093
- Medford Lakes Borough School Districtelementary4,297
- Medford Township School Districtelementary24,812
- Mendham Borough School Districtelementary4,973
- Mendham Township School Districtelementary6,018
- Merchantville Borough School District3,905
- Metuchen Borough School District15,144
- Middle Township School District20,277
- Middlesex Borough School District14,645
- Middletown Township School District66,883
- Midland Park Borough School District7,019
- Milford Borough School Districtelementary1,166
- Millburn Township School District22,145
- Millstone Township School District10,385
- Milltown Borough School District7,059
- Millville City School District27,511
- Mine Hill Township School District4,048
- Monmouth Beach Borough School Districtelementary3,207
- Monmouth Regional School Districtsecondary34,092
- Monroe Township School District (Gloucester County)37,648
- Monroe Township School District (Middlesex County)49,032
- Montague Township School District3,833
- Montclair Town School District40,341
- Montgomery Township School District24,660
- Montvale Borough School Districtelementary8,901
- Montville Township School District22,876
- Moonachie Borough School District3,126
- Moorestown Township School District21,548
- Morris Hills Regional School Districtsecondary57,325
- Morris Plains Borough School District6,315
- Morris Township School District43,877
- Mount Arlington Borough School District5,935
- Mount Ephraim Borough School District4,669
- Mount Holly Township School Districtelementary10,056
- Mount Laurel Township School Districtelementary46,026
- Mount Olive Township School District29,149
- Mountain Lakes Borough School District4,585
- Mountainside Borough School District7,049
- Mullica Township School Districtelementary5,832
- National Park Borough School Districtelementary3,044
- Neptune City School District4,606
- Neptune Township School District28,265
- Netcong Borough School Districtelementary3,659
- New Brunswick City School District56,345
- New Hanover Township School District990
- New Milford Borough School District16,995
- New Providence Borough School District13,727
- Newark City School District310,178
- Newfield Elementary School District1,844
- Newton Town School District8,369
- North Arlington Borough School District16,461
- North Bergen Township School District61,250
- North Brunswick Township School District44,375
- North Caldwell Borough School Districtelementary6,656
- North Haledon Borough School Districtelementary8,778
- North Hanover Township School Districtelementary4,461
- North Hunterdon-Voorhees Regional School Districtsecondary50,860
- North Plainfield Borough School District22,809
- North Warren Regional School Districtsecondary12,220
- North Wildwood City School District3,602
- Northern Burlington Regional School Districtsecondary25,842
- Northern Highlands Regional School Districtsecondary15,304
- Northern Valley Regional School Districtsecondary38,395
- Northfield City School Districtelementary8,456
- Northvale Borough School Districtelementary4,829
- Norwood Borough School Districtelementary5,724
- Nutley Town School District30,012
- Oakland Borough School Districtelementary12,768
- Oaklyn Borough School District3,947
- Ocean City School District11,261
- Ocean Gate Borough School Districtelementary1,599
- Ocean Township School District (Monmouth County)27,896
- Ocean Township School District (Ocean County)9,014
- Oceanport Borough School Districtelementary7,913
- Ogdensburg Borough School Districtelementary2,160
- Old Bridge Township School District68,406
- Old Tappan Borough School Districtelementary6,008
- Oldmans Township School District1,839
- Oradell Borough School Districtelementary8,235
- Orange City Township School District34,281
- Oxford Township School District2,665
- Palisades Park Borough School District20,290
- Palmyra Borough School District7,485
- Paramus Borough School District26,568
- Park Ridge Borough School District9,406
- Parsippany-Troy Hills Township School District56,397
- Pascack Valley Regional School Districtsecondary35,255
- Passaic City School District70,002
- Passaic County Manchester Regional School Districtsecondary24,077
- Passaic Valley Regional School Districtsecondary39,104
- Paterson City School District158,735
- Paulsboro Borough School District6,248
- Pemberton Township School District26,197
- Penns Grove-Carneys Point Regional School District13,547
- Pennsauken Township School District37,275
- Pennsville Township School District12,754
- Pequannock Township School District15,641
- Perth Amboy City School District55,855
- Phillipsburg Town School District15,299
- Pine Hill Borough School District10,802
- Pinelands Regional School Districtsecondary27,574
- Piscataway Township School District61,297
- Pitman Borough School District8,856
- Pittsgrove Township School District10,030
- Plainfield City School District55,236
- Pleasantville City School District20,712
- Plumsted Township School District8,659
- Pohatcong Township School District3,266
- Point Pleasant Beach Borough School District5,336
- Point Pleasant Borough School District19,334
- Pompton Lakes Borough School District11,047
- Port Republic City School District1,076
- Princeton Public Schools30,756
- Prospect Park Borough School Districtelementary6,319
- Quinton Township School District2,615
- Rahway City School District30,109
- Ramapo-Indian Hill Regional School Districtsecondary40,902
- Ramsey Borough School District14,805
- Rancocas Valley Regional School Districtsecondary44,553
- Randolph Township School District26,604
- Readington Township School Districtelementary16,278
- Red Bank Borough School Districtelementary12,862
- Red Bank Regional School Districtsecondary23,146
- Ridgefield Borough School District11,498
- Ridgefield Park Township School District13,235
- Ridgewood Village School District26,308
- Ringwood Borough School Districtelementary11,657
- River Dell Regional School Districtsecondary20,326
- River Edge Borough School Districtelementary12,091
- River Vale Township School Districtelementary10,058
- Riverdale Borough School District4,112
- Riverside Township School District8,055
- Riverton Borough School District2,770
- Robbinsville Township School District15,641
- Rochelle Park Township School District5,869
- Rockaway Borough School Districtelementary6,613
- Rockaway Township School Districtelementary26,189
- Rockleigh Borough School District459
- Roosevelt Borough School District996
- Roseland Borough School Districtelementary6,268
- Roselle Borough School District22,646
- Roselle Park Borough School District14,093
- Roxbury Township School District23,211
- Rumson Borough School Districtelementary7,241
- Rumson-Fair Haven Regional School Districtsecondary13,411
- Runnemede Borough School Districtelementary8,355
- Rutherford Borough School District18,894
- Saddle Brook Township School District14,419
- Saddle River Borough School District3,389
- Salem City School District5,322
- Sandyston-Walpack Township School Districtelementary1,932
- Sayreville Borough School District45,838
- Scotch Plains-Fanwood Regional School District32,642
- Sea Girt Borough School District1,980
- Sea Isle City School District2,000
- Seaside Heights Borough School Districtelementary2,478
- Seaside Park Borough School Districtelementary1,793
- Secaucus Town School District21,778
- Shamong Township School Districtelementary6,497
- Shore Regional School Districtsecondary19,706
- Shrewsbury Borough School Districtelementary4,179
- Somerdale Borough School Districtelementary5,581
- Somers Point City School Districtelementary10,515
- Somerset Hills Regional School District11,435
- Somerville Borough School District13,410
- South Amboy City School District9,989
- South Bound Brook Borough School District4,867
- South Brunswick Township School District47,137
- South Hackensack Township School District2,770
- South Harrison Township School Districtelementary3,428
- South Hunterdon Regional School District7,626
- South Orange-Maplewood School District44,087
- South Plainfield Borough School District24,473
- South River Borough School District16,124
- Southampton Township School Districtelementary10,372
- Southern Regional School Districtsecondary37,171
- Sparta Township School District20,077
- Spotswood Borough School District10,630
- Spring Lake Borough School District2,779
- Spring Lake Heights Borough School District4,861
- Springfield Township School District17,171
- Springfield Township School Districtelementary3,257
- Stafford Township School Districtelementary29,834
- Stanhope Borough School Districtelementary3,552
- Sterling High School School Districtsecondary16,953
- Stillwater Township School Districtelementary4,052
- Stone Harbor Borough School District893
- Stow Creek Township School Districtelementary1,312
- Stratford Borough School Districtelementary7,018
- Summit City School District22,705
- Sussex-Wantage Regional School Districtelementary13,086
- Swedesboro-Woolwich School Districtelementary16,259
- Tabernacle Township School Districtelementary6,854
- Teaneck Township School District41,876
- Tenafly Borough School District15,319
- Tewksbury Township School Districtelementary5,893
- The Chathams School District20,509
- Tinton Falls Borough School Districtelementary20,517
- Toms River Regional School District115,253
- Totowa Borough School Districtelementary10,959
- Trenton City School District90,338
- Tuckerton Borough School Districtelementary3,654
- Union Beach Borough School District5,707
- Union City School District66,463
- Union Township School District61,071
- Union Township School Districtelementary6,430
- Upper Deerfield Township School Districtelementary7,799
- Upper Freehold Regional School District8,952
- Upper Pittsgrove Township School District3,466
- Upper Saddle River Borough School Districtelementary8,439
- Upper Township School District12,525
- Ventnor City School District9,265
- Vernon Township School District22,605
- Verona Borough School District14,545
- Vineland City School District61,006
- Voorhees Township School Districtelementary31,191
- Waldwick Borough School District10,164
- Wall Township School District26,541
- Wallington Borough School District11,889
- Wallkill Valley Regional School Districtsecondary18,758
- Wanaque Borough School Districtelementary11,206
- Warren Hills Regional School Districtsecondary24,795
- Warren Township School Districtelementary16,186
- Washington Borough School Districtelementary7,334
- Washington Township School District (Burlington County)489
- Washington Township School District (Gloucester County)49,220
- Washington Township School District (Morris County)elementary18,265
- Washington Township School District (Warren County)elementary6,691
- Watchung Borough School Districtelementary6,485
- Watchung Hills Regional School Districtsecondary31,323
- Waterford Township School District10,451
- Wayne Township School District53,756
- Weehawken Township School District17,295
- Wenonah Borough School Districtelementary2,261
- West Cape May Borough School Districtelementary1,011
- West Deptford Township School District22,416
- West Essex Regional School Districtsecondary23,109
- West Long Branch Borough School Districtelementary8,586
- West Milford Township School District24,705
- West Morris Regional School Districtsecondary38,516
- West New York Town School District52,004
- West Orange Town School District48,585
- West Wildwood Borough School District588
- West Windsor-Plainsboro Regional School District54,646
- Westampton Township School Districtelementary9,198
- Westfield Town School District31,111
- Westville Borough School Districtelementary4,310
- Westwood Regional School District20,606
- Weymouth Township School District2,675
- Wharton Borough School Districtelementary7,318
- White Township School District4,679
- Wildwood City School District5,130
- Wildwood Crest Borough School District3,077
- Willingboro Township School District32,103
- Winfield Township School District1,479
- Winslow Township School District40,090
- Wood-Ridge Borough School District10,218
- Woodbine Borough School District2,023
- Woodbridge Township School District104,355
- Woodbury City School District10,042
- Woodbury Heights Borough School Districtelementary3,117
- Woodcliff Lake Borough School Districtelementary6,152
- Woodland Park Borough School Districtelementary13,355
- Woodland Township School Districtelementary1,486
- Woodlynne Borough School District2,920
- Woodstown-Pilesgrove Regional School District7,935
- Wyckoff Township School Districtelementary17,050
Congressional districts
As drawn for the 119th Congress (2025–2027).
- Congressional District 1778,642
- Congressional District 2783,815
- Congressional District 3783,491
- Congressional District 4788,486
- Congressional District 5778,374
- Congressional District 6780,307
- Congressional District 7783,203
- Congressional District 8763,596
- Congressional District 9767,600
- Congressional District 10777,942
- Congressional District 11779,403
- Congressional District 12778,950
State senate districts
The upper chamber’s districts, as drawn in 2024.
- State Senate District 1235,532
- State Senate District 2232,900
- State Senate District 3239,221
- State Senate District 4235,057
- State Senate District 5236,595
- State Senate District 6237,928
- State Senate District 7233,789
- State Senate District 8232,774
- State Senate District 9235,632
- State Senate District 10231,570
- State Senate District 11230,350
- State Senate District 12228,411
- State Senate District 13230,346
- State Senate District 14227,110
- State Senate District 15232,709
- State Senate District 16229,368
- State Senate District 17235,791
- State Senate District 18236,030
- State Senate District 19241,533
- State Senate District 20229,420
- State Senate District 21231,039
- State Senate District 22240,256
- State Senate District 23240,856
- State Senate District 24240,314
- State Senate District 25240,101
- State Senate District 26228,053
- State Senate District 27238,170
- State Senate District 28228,136
- State Senate District 29232,211
- State Senate District 30230,453
- State Senate District 31240,686
- State Senate District 32224,227
- State Senate District 33230,544
- State Senate District 34234,184
- State Senate District 35237,007
- State Senate District 36233,755
- State Senate District 37230,540
- State Senate District 38225,709
- State Senate District 39233,677
- State Senate District 40231,825
Assembly districts
The lower chamber’s districts, as drawn in 2024.
- Assembly District 01235,532
- Assembly District 02232,900
- Assembly District 03239,221
- Assembly District 04235,057
- Assembly District 05236,595
- Assembly District 06237,928
- Assembly District 07233,789
- Assembly District 08232,774
- Assembly District 09235,632
- Assembly District 10231,570
- Assembly District 11230,350
- Assembly District 12228,411
- Assembly District 13230,346
- Assembly District 14227,110
- Assembly District 15232,709
- Assembly District 16229,368
- Assembly District 17235,791
- Assembly District 18236,030
- Assembly District 19241,533
- Assembly District 20229,420
- Assembly District 21231,039
- Assembly District 22240,256
- Assembly District 23240,856
- Assembly District 24240,314
- Assembly District 25240,101
- Assembly District 26228,053
- Assembly District 27238,170
- Assembly District 28228,136
- Assembly District 29232,211
- Assembly District 30230,453
- Assembly District 31240,686
- Assembly District 32224,227
- Assembly District 33230,544
- Assembly District 34234,184
- Assembly District 35237,007
- Assembly District 36233,755
- Assembly District 37230,540
- Assembly District 38225,709
- Assembly District 39233,677
- Assembly District 40231,825
PUMAs
Public Use Microdata Areas: areas of 100,000 people or more that the state draws from census tracts, for the Census Bureau’s microdata.
- Atlantic County (East)–Atlantic City, Pleasantville, Northfield & Coast PUMA146,306
- Atlantic County (Outside Somers Point City)–West to Hammonton Town PUMA119,449
- Bergen County (Central)–Ridgewood Village, Glen Rock & Westwood PUMA107,002
- Bergen County (East)–Tenafly, Park Ridge, Englewood City & Cresskill PUMA128,300
- Bergen County (North Central)–Bergenfield, Paramus, Dumont & New Milford PUMA118,345
- Bergen County (Northwest)–Ramsey, Oakland & Franklin Lakes PUMA105,246
- Bergen County (South Central)–Hackensack & Teaneck PUMA110,528
- Bergen County (Southeast)–Fort Lee, Cliffside Park & Palisades Park PUMA136,830
- Bergen County (Southwest)–Rutherford, North Arlington & Hasbrouck Heights PUMA125,759
- Bergen County (West Central)–Fair Lawn, Garfield & Lodi PUMA130,306
- Burlington County (North)–Burlington City PUMA166,215
- Burlington County (South & East) PUMA136,652
- Burlington County (West Central) PUMA164,938
- Camden County (Central)–Lindenwold & Collingswood Boroughs PUMA107,061
- Camden County (East Central)–Haddonfield Borough PUMA122,950
- Camden County (North)–Camden & Gloucester Cities PUMA127,105
- Camden County (South & West)–Bellmawr & Pine Hill Boroughs PUMA170,141
- Cape May & Atlantic (South Central) Counties–Ocean City & Somers Point City PUMA105,456
- Cumberland County (South)–Vineland & Millville Cities PUMA111,112
- Essex County (Central)–Orange & East Orange PUMA104,371
- Essex County (Northeast)–Bloomfield PUMA121,870
- Essex County (Northwest)–Montclair PUMA113,143
- Essex County (South Central)–Irvington PUMA104,954
- Essex County (Southeast)–Newark (North & East) PUMA155,059
- Essex County (Southeast)–Newark (West & Southwest) PUMA155,119
- Essex County (Southwest)–West Orange & Livingston PUMA108,486
- Gloucester County (Northeast)–Woodbury City PUMA132,921
- Gloucester County (South & West)–Glassboro Borough PUMA174,033
- Hudson County (Central)–Jersey City (North) PUMA161,349
- Hudson County (Central)–Jersey City (South) PUMA132,729
- Hudson County (North)–West New York, Secaucus & North Bergen PUMA146,786
- Hudson County (Northeast)–Union City & Hoboken PUMA142,426
- Hudson County (South & West)–Bayonne, Kearney & Harrison PUMA135,033
- Hunterdon County PUMA130,160
- Mercer County (North)–Princeton Borough PUMA115,793
- Mercer County (Southwest) PUMA144,129
- Mercer County (West Central)–Trenton City PUMA125,942
- Middlesex County (Central)–New Brunswick & Highland Park PUMA157,767
- Middlesex County (East Central)–Perth Amboy & Sayreville PUMA111,682
- Middlesex County (North Central)–Metuchen & South Edison PUMA115,868
- Middlesex County (Northeast)–Carteret & North Woodbridge PUMA115,924
- Middlesex County (Northwest)–North Piscataway & South Plainfield PUMA118,698
- Middlesex County (Southeast) PUMA133,838
- Middlesex County (Southwest) PUMA117,513
- Monmouth County (Central) PUMA106,976
- Monmouth County (Northeast)–Red Bank, Northeast Middletown PUMA107,072
- Monmouth County (Northwest)–Matawan & Aberdeen PUMA100,922
- Monmouth County (Southeast)–Long Branch, Asbury Park & Eatontown PUMA115,655
- Monmouth County (Southeast)–Wall, Tinton Falls (South) PUMA103,555
- Monmouth County (Southwest)–Freehold, Manalapan PUMA111,173
- Morris County (East)–Lincoln Park Borough PUMA119,244
- Morris County (North)–Dover Town & Kinnelon Borough PUMA134,374
- Morris County (South)–Morristown, Madison & Florham Park PUMA128,029
- Morris County (West) PUMA132,881
- Ocean County (Central)–Toms River & Berkeley PUMA163,980
- Ocean County (Lakewood) PUMA139,019
- Ocean County (Northeast)–Brick & Point Pleasant PUMA106,719
- Ocean County (Northwest) PUMA117,200
- Ocean County (South) PUMA127,444
- Passaic County (Central)–Hawthorne PUMA114,752
- Passaic County (North)–Ringwood, Wanaque & Pompton Lakes PUMA106,266
- Passaic County (South)–Passaic & Clifton (SE) PUMA141,259
- Passaic County–Paterson PUMA158,735
- Salem & Cumberland (North) Counties–Bridgeton City PUMA107,468
- Somerset County (Central)–Bridgewater, Somerville & North Plainfield PUMA122,226
- Somerset County (North & West) PUMA112,354
- Somerset County (South) PUMA115,266
- Sussex County PUMA145,807
- Union County (North Central)–Union Twp & Roselle Park PUMA105,914
- Union County (Northeast)–Elizabeth PUMA137,302
- Union County (Northwest)–Summit & Cranford PUMA103,037
- Union County (Southeast)–Linden, Rahway & Roselle PUMA114,048
- Union County (Southwest)–Plainfield & Westfield PUMA118,989
- Warren County PUMA110,849
Urban areas
Each that reaches into New Jersey, with its whole population. Urban areas are the densely settled land the Census Bureau draws after each census, whatever the city lines.
- Allentown–Bethlehem, PA–NJ632,251
- Atlantic City–Ocean City–Villas, NJ297,157
- Bridgeton, NJ35,626
- Browns Mills, NJ28,826
- Clinton, NJ15,419
- Flemington–Raritan, NJ25,479
- Hamburg–Vernon–Highland Lakes, NJ27,341
- Hammonton, NJ12,407
- Lake Mohawk, NJ12,675
- Lambertville, NJ–PA9,915
- Leisuretowne, NJ4,968
- Mystic Island–Little Egg Harbor, NJ23,247
- New York–Jersey City–Newark, NY–NJ19.1M
- Newton, NJ12,346
- Oak Ridge, NJ8,738
- Panther Valley, NJ4,553
- Philadelphia, PA–NJ–DE–MD5.73M
- Salem, NJ6,083
- Trenton, NJ370,545
- Vineland, NJ86,469
- Washington, NJ10,014
- West Milford, NJ–NY17,757
Tribal areas
Each that reaches into New Jersey, with its whole population.
Turn New Jersey into your planning report.
Social Explorer Studio builds an editable profile of any place, with tables and charts beside the county and state, and exports to Word, PDF and Excel.
Questions about New Jersey
What is the population of New Jersey?
9,548,215 people, according to the ACS 2025 1-year estimates, which the Census Bureau adjusts to match its own population estimate. That’s the 11th largest of the 50 states and DC.
What is the FIPS code for New Jersey?
34. Every county’s and place’s FIPS code in New Jersey starts with it. The Census Bureau’s full geographic identifier (GEOID) is 0400000US34.
What is the largest city in New Jersey?
Newark, with 323,800 people. Other large places here include Jersey City, Paterson and Elizabeth.
What is the median household income in New Jersey?
$107,797 (±$1,374), according to the ACS 2025 1-year estimates, higher than the US ($84,780).
What is the median age in New Jersey?
40.2 years (±0.1), according to the ACS 2025 1-year estimates, higher than the US (39.5).
How much does housing cost in New Jersey?
New Jersey’s median home value is $530,800 (±$3,638) and its median gross rent is $1,885 (±$19) a month, according to the ACS 2025 1-year estimates. 50.4% (±1.4%) of its renters pay 30% or more of their income on rent.
Is New Jersey growing?
New Jersey’s population grew 6.6%, from 8,958,013 in 2015 to 9,548,215 in 2025, according to the ACS 1-year estimates.
Where do people who work in New Jersey live?
3,752,837 of its 4,162,765 jobs are held by people who live here. Of those who commute in, the most come from New York, Pennsylvania, Delaware.
Where does this census data come from?
The U.S. Census Bureau’s American Community Survey, through Social Explorer’s tables: the latest 1-year estimates where they exist, for the most recent numbers, and 5-year estimates otherwise. Each table lists its code, so you can find it again.
Is this data free to use?
Yes. You can read it, cite it, download the CSV and embed the charts, with no account. To map other variables, compare your own areas or build a report, see Social Explorer’s plans in a live demo.
Sources and how to cite
American Community Survey 2025 1-year estimates, or 2020–2024 5-year estimates where noted, U.S. Census Bureau, from Social Explorer’s tables A00001, A00002, A01004, A04001, A06001, A08001, A09005, A10001, A10003, A10008, A10030, A10036, A10040, A10047, A10055, A10060, A12001, A13004, A14006, A14024, A14028, A16002, A17005, A18002, A18009, A20001, B02002, B09001, B13002, B18101, C16001. Maps by census tract use 2020–2024 5-year estimates, since the 1-year survey doesn’t cover tracts. Commuting: LEHD LODES 2023. These are estimates from a sample, each with its margin of error. Data retrieved November 14, 2026. How these profiles are made.
U.S. Census Bureau, American Community Survey 2025 1-year estimates, or 2020–2024 5-year estimates where noted, via Social Explorer. “New Jersey.” https://www.socialexplorer.com/places/new-jersey. Accessed November 14, 2026.