

South Carolina: Population, demographics and census data
Home to 5,570,274 people, the 23rd largest of the 50 states and DC. It grew 13.8% between 2015 and 2025.
- Population
- 5.57M. Census Bureau estimate · Rank 23 of the 50 states and DC
- Median household income
- $73,672 ±$1,216. US $84,780
- Median age
- 41.3 ±0.2. US 39.5
ACS 2025 1-year estimates, U.S. Census Bureau
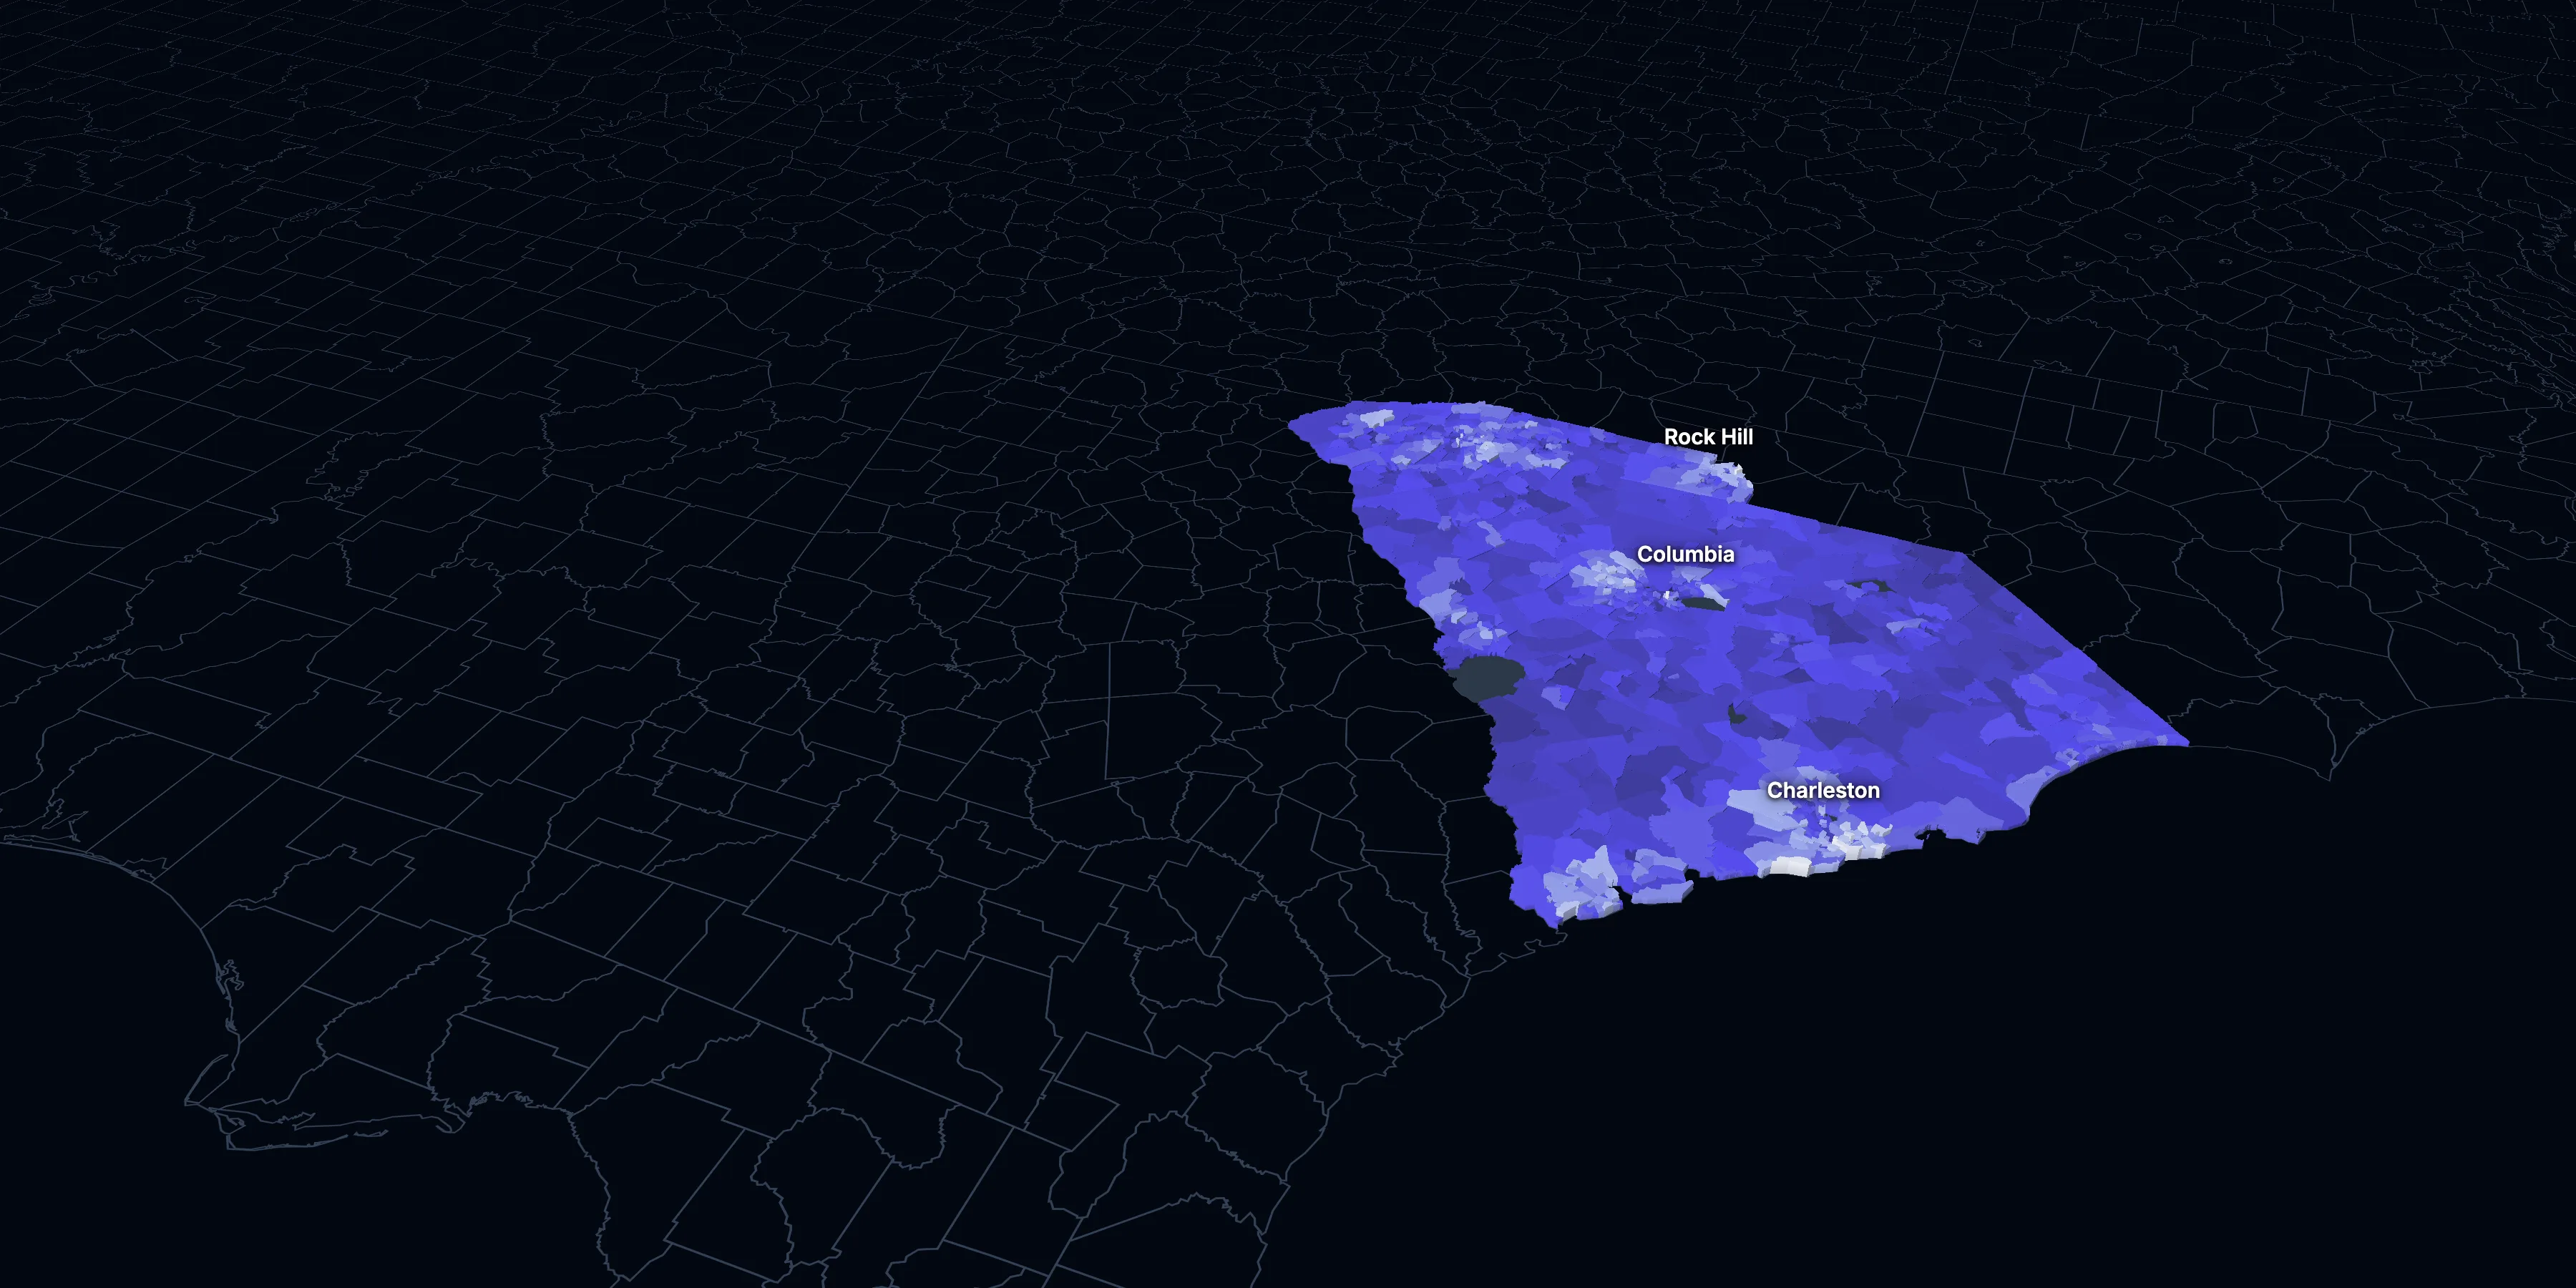
Taller, lighter tracts have higher household incomes
About South Carolina
South Carolina’s median household income is $73,672 (±$1,216), lower than the US ($84,780), and its median age is 41.3 (±0.2), according to the ACS 2025 1-year estimates. Its largest city is Charleston.
± is each figure’s margin of error, at 90% confidence, and † marks one too uncertain to lean on. Under each percentage in the tables is the number it counts. How the margins are worked out.
FIPS code 45
Highlights
What stands out in South Carolina
The numbers where South Carolina sits furthest from the nation, or past a recognized policy benchmark.
Past a policy benchmark
+10 points
HighRent growth ahead of income
After inflation, rent grew 24% from 2015 to 2025, and household income 14%. The dots show rent growth.
Furthest from the national picture
8.0%
Higher than the USVeterans (adults)
That’s higher than the US (5.9%). It’s the 6th highest of the 50 states and DC.
9.4%
Very lowSpeak a language other than English at home
That’s lower than the US (22.9%).
6.6%
Very lowBorn outside the US
That’s lower than the US (14.7%).
28.2%
Lower than the USHouseholds that rent
That’s lower than the US (34.7%).
22.9%
2× the USBlack, not Hispanic
That’s higher than the US (11.7%). It’s the 7th highest of the 50 states and DC.
2015 to 2025
How South Carolina changed in ten years
The state added 674,128 people. It got older, more foreign-born and better educated, and poverty fell 3.4 points.
Population, change since 2015
+13.8% in the state and +6.3% in the US.
Source: ACS 1-year, 2015 to 2025, table A00001.
Show data
| South Carolina | United States | |
|---|---|---|
| 2015 | 0.0% | 0.0% |
| 2016 | +1.3% | +0.5% |
| 2017 | +2.6% | +1.3% |
| 2018 | +3.8% | +1.8% |
| 2019 | +5.2% | +2.1% |
| 2021 | +6.0% | +3.3% |
| 2022 | +7.9% | +3.7% |
| 2023 | +9.8% | +4.2% |
| 2024 | +11.9% | +5.8% |
| 2025 | +13.8% | +6.3% |
Embed
Median household income, in 2025 dollars
+13.8% in the state and +10.9% in the US.
Source: ACS 1-year, 2015 to 2025, table A14006.
Show data
| South Carolina | United States | |
|---|---|---|
| 2015 | $64,717 | $76,413 |
| 2016 | $66,954 | $77,931 |
| 2017 | $66,960 | $79,891 |
| 2018 | $67,610 | $80,059 |
| 2019 | $71,385 | $83,427 |
| 2021 | $71,063 | $83,521 |
| 2022 | $71,024 | $82,811 |
| 2023 | $72,135 | $82,683 |
| 2024 | $74,775 | $84,339 |
| 2025 | $73,672 | $84,780 |
Embed
Living in poverty
−3.4 points in the state and −3.0 points in the US.
Source: ACS 1-year, 2015 to 2025, table A13004.
Show data
| South Carolina | United States | |
|---|---|---|
| 2015 | 16.6% | 14.7% |
| 2016 | 15.3% | 14.0% |
| 2017 | 15.4% | 13.4% |
| 2018 | 15.3% | 13.1% |
| 2019 | 13.8% | 12.3% |
| 2021 | 14.6% | 12.8% |
| 2022 | 14.0% | 12.6% |
| 2023 | 13.9% | 12.5% |
| 2024 | 13.3% | 12.1% |
| 2025 | 13.3% | 11.8% |
Embed
Bachelor’s degree or more
+7.6 points in the state and +6.7 points in the US.
Source: ACS 1-year, 2015 to 2025, table A12001.
Show data
| South Carolina | United States | |
|---|---|---|
| 2015 | 26.8% | 30.6% |
| 2016 | 27.2% | 31.3% |
| 2017 | 28.0% | 32.0% |
| 2018 | 28.3% | 32.6% |
| 2019 | 29.6% | 33.1% |
| 2021 | 31.5% | 35.0% |
| 2022 | 32.6% | 35.7% |
| 2023 | 32.9% | 36.2% |
| 2024 | 33.3% | 36.8% |
| 2025 | 34.5% | 37.4% |
Embed
Median gross rent, in 2025 dollars
+24.3% in the state and +18.5% in the US.
Source: ACS 1-year, 2015 to 2025, table A18009.
Show data
| South Carolina | United States | |
|---|---|---|
| 2015 | $1,122 | $1,314 |
| 2016 | $1,138 | $1,327 |
| 2017 | $1,123 | $1,340 |
| 2018 | $1,153 | $1,368 |
| 2019 | $1,171 | $1,393 |
| 2021 | $1,169 | $1,427 |
| 2022 | $1,201 | $1,440 |
| 2023 | $1,245 | $1,496 |
| 2024 | $1,315 | $1,537 |
| 2025 | $1,395 | $1,557 |
Embed
Median home value, in 2025 dollars
+50.4% in the state and +39.3% in the US.
Source: ACS 1-year, 2015 to 2025, table A10036.
Show data
| South Carolina | United States | |
|---|---|---|
| 2015 | $203,585 | $266,469 |
| 2016 | $208,161 | $277,278 |
| 2017 | $214,239 | $288,124 |
| 2018 | $220,774 | $296,908 |
| 2019 | $228,272 | $305,336 |
| 2021 | $255,772 | $337,116 |
| 2022 | $282,037 | $355,481 |
| 2023 | $290,332 | $361,931 |
| 2024 | $309,537 | $372,685 |
| 2025 | $306,200 | $371,100 |
Embed
ACS 1-year estimates. The dotted stretch of each line spans 2020, when the Census Bureau released no standard 1-year estimates. Dollar values are in 2025 dollars.
| Indicator | 2015 | 2025 | Change |
|---|---|---|---|
| Population | 4,896,146 | 5,570,274 | +13.8% |
| Median age | 39.0 | 41.3 | +2.3 years |
| 65 and over | 16.2% | 21.1% | +4.8 points |
| Born outside the US | 4.8% | 6.6% | +1.9 points |
| Hispanic or Latino | 5.4% | 8.4% | +3.1 points |
| Median household income | $64,717 | $73,672 | +13.8% |
| Living in poverty | 16.6% | 13.3% | −3.4 points |
| Bachelor’s degree or more | 26.8% | 34.5% | +7.6 points |
| Households that rent | 31.9% | 28.2% | −3.7 points |
| Median gross rent | $1,122 | $1,395 | +24.3% |
| Median home value | $203,585 | $306,200 | +50.4% |
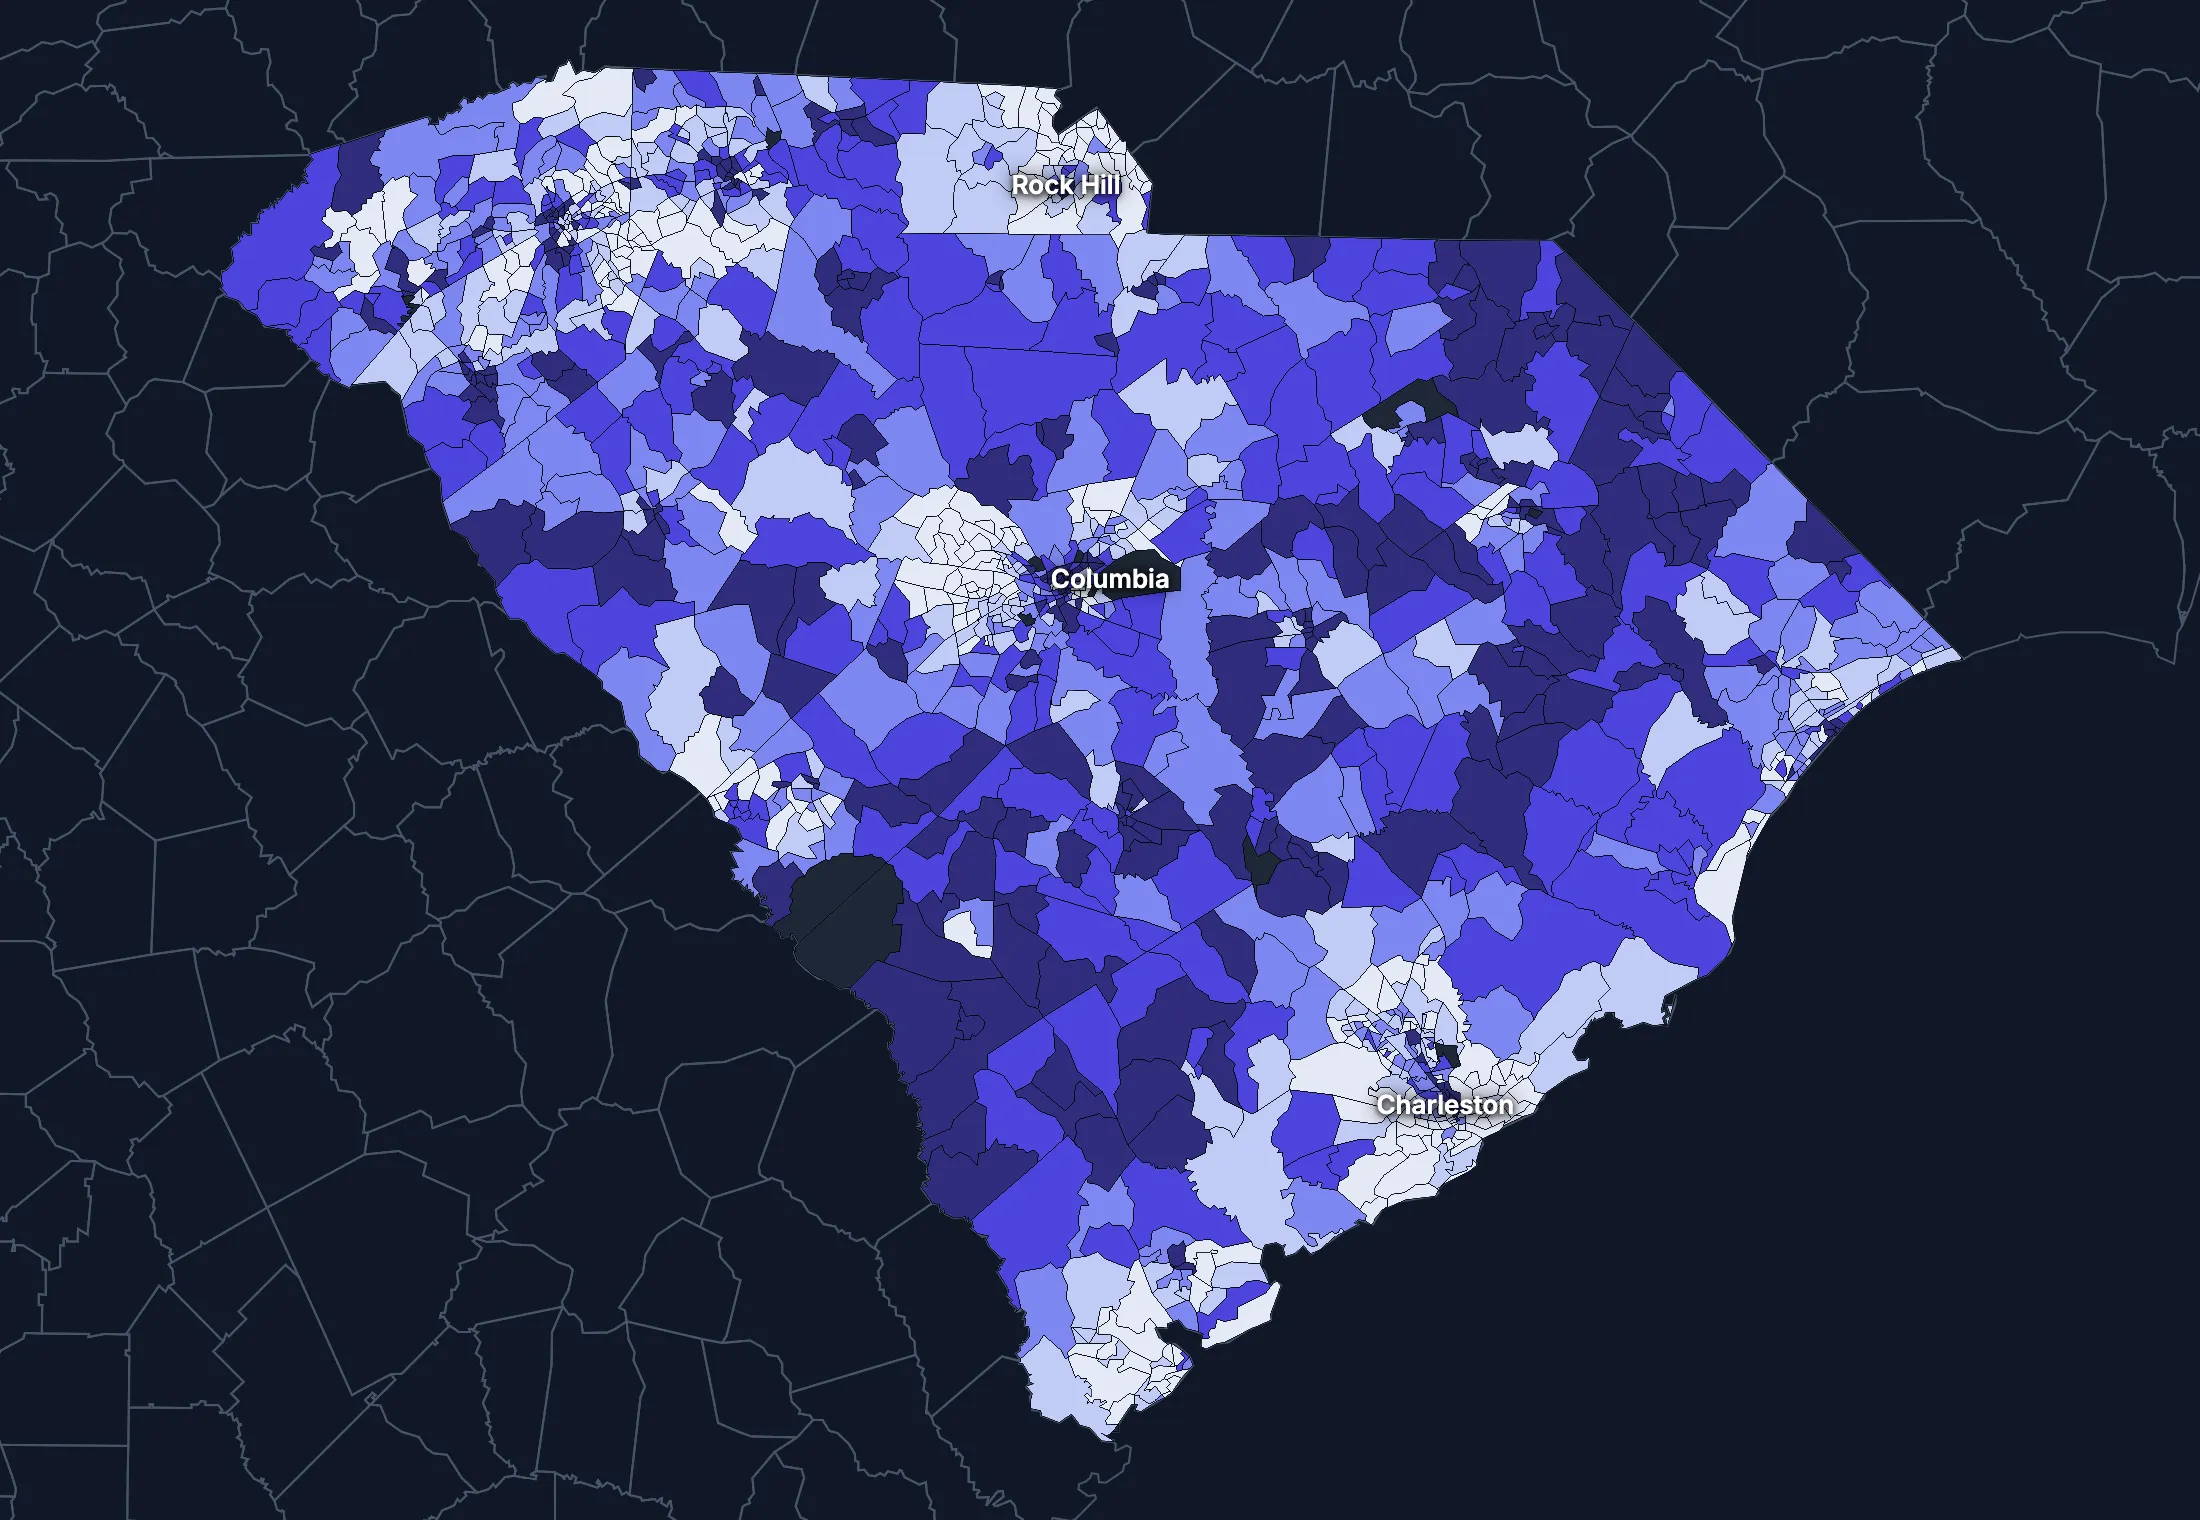
1323 census tracts
South Carolina, tract by tract
State averages hide a lot. These census tracts are the closest the census comes to neighborhoods.
Where the state’s average misleads
Each tick is one census tract, and the dark line marks the state. Hover over a tick or tap it to see the tract.
Poverty
321 of 1305 tracts are at least 1.5 times the state’s overall 14.1%, and 416 are at two-thirds of it or less.
Highest: Tract 108.06, 100.0%. Lowest: Tract 10, 0.0%.
Renters paying 30% or more of income
89 of 1256 tracts are at least 1.5 times the state’s overall 46.4%, and 313 are at two-thirds of it or less.
Highest: Tract 9205.04, 100.0%. Lowest: Tract 209.03, 0.0%.
Adults with a bachelor’s degree
224 of 1309 tracts are at least 1.5 times the state’s overall 32.1%, and 542 are at two-thirds of it or less.
Highest: Tract 23, 94.2%. Lowest: Tract 9203.01, 0.0%.
Median household income
194 of 1298 tracts are at least 1.5 times the typical tract’s $64,475, and 189 are at two-thirds of it or less.
Highest: Tract 2, $250,000 or more. Lowest: Tract 208, $11,833.
American Community Survey 2020–2024 5-year estimates, by census tract. Income is capped at $250,000+ by the Census Bureau.
People
Who lives in South Carolina
Its median age of 41.3 is higher than the US (39.5). 6.6% of residents were born outside the US, and 9.4% speak a language other than English at home.
Age
Source: ACS 2025 1-year, table A01001.
Show data
| South Carolina | United States | |
|---|---|---|
| Under 18 | 20.5% ±0.3% , number 1,144,386 ±16,560 | 21.0% ±<0.1% , number 71,689,151 ±111,800 |
| 18 to 24 | 8.9% ±0.2% , number 496,224 ±12,410 | 9.3% ±<0.1% , number 31,716,680 ±98,660 |
| 25 to 34 | 12.5% ±0.2% , number 697,400 ±9,948 | 13.6% ±<0.1% , number 46,357,354 ±55,690 |
| 35 to 44 | 12.6% ±0.3% , number 703,897 ±14,950 | 13.4% ±<0.1% , number 45,746,189 ±105,700 |
| 45 to 54 | 11.6% ±0.2% , number 645,309 ±9,390 | 11.8% ±<0.1% , number 40,257,563 ±53,540 |
| 55 to 64 | 12.7% ±0.2% , number 709,720 ±13,610 | 12.1% ±<0.1% , number 41,242,904 ±104,700 |
| 65 to 74 | 12.1% ±0.2% , number 675,189 ±12,060 | 10.8% ±<0.1% , number 36,895,650 ±91,520 |
| 75 and over | 8.9% ±0.2% , number 498,149 ±10,910 | 8.2% ±<0.1% , number 27,879,368 ±78,140 |
Embed
Race and ethnicity
Source: ACS 2025 1-year, table A04001.
Show data
| South Carolina | United States | |
|---|---|---|
| White, not Hispanic | 61.0% ±0.2% , number 3,398,907 ±8,560 | 55.0% ±<0.1% , number 187,959,031 ±58,340 |
| Hispanic or Latino | 8.4% ±<0.1% , number 469,890 ±1,680 | 20.5% ±<0.1% , number 69,975,516 ±13,270 |
| Black, not Hispanic | 22.9% ±0.2% , number 1,275,320 ±12,520 | 11.7% ±<0.1% , number 40,096,453 ±106,200 |
| Asian, not Hispanic | 1.9% ±0.1% , number 103,858 ±4,745 | 6.5% ±<0.1% , number 22,096,709 ±58,340 |
| Other or multiracial | 5.8% ±0.3% , number 322,299 ±14,640 | 6.3% ±<0.1% , number 21,657,150 ±150,100 |
Embed
Language spoken at home
Source: ACS 2025 1-year, table C16001.
Show data
| South Carolina | United States | |
|---|---|---|
| English only | 90.6% ±0.3% , number 4,786,429 ±16,450 | 77.1% ±0.1% , number 249,390,588 ±275,300 |
| Spanish | 5.9% ±0.2% , number 309,999 ±11,640 | 13.9% ±0.1% , number 44,921,985 ±177,800 |
| Other Indo-European | 1.9% ±0.2% , number 101,786 ±9,509 | 4.0% ±<0.1% , number 12,862,980 ±113,500 |
| Asian and Pacific Island | 1.1% ±0.1% , number 59,688 ±7,029 | 3.8% ±<0.1% , number 12,288,841 ±99,740 |
| Arabic and other | 0.4% ±0.1% , number 23,257 ±5,046 | 1.3% ±<0.1% , number 4,116,949 ±71,480 |
Embed
Marital status
Source: ACS 2025 1-year, table A11001.
Show data
| South Carolina | United States | |
|---|---|---|
| Now married | 49.3% ±0.6% , number 2,283,393 ±27,070 | 47.9% ±0.1% , number 135,567,564 ±223,300 |
| Never married | 31.9% ±0.4% , number 1,479,329 ±19,150 | 34.8% ±0.1% , number 98,647,238 ±152,600 |
| Divorced | 10.3% ±0.3% , number 477,746 ±14,480 | 10.2% ±<0.1% , number 28,879,967 ±112,900 |
| Widowed | 6.5% ±0.2% , number 300,670 ±9,527 | 5.5% ±<0.1% , number 15,599,094 ±69,430 |
| Separated | 1.9% ±0.1% , number 89,542 ±6,465 | 1.6% ±<0.1% , number 4,441,399 ±49,160 |
Embed
Where people lived a year ago
Source: ACS 2025 1-year, table A08001.
Show data
| South Carolina | United States | |
|---|---|---|
| Same home | 87.0% ±0.5% , number 4,790,946 ±26,220 | 88.4% ±0.1% , number 298,889,697 ±214,800 |
| Same county | 5.8% ±0.3% , number 321,656 ±18,240 | 6.0% ±<0.1% , number 20,202,671 ±166,300 |
| Another county in the state | 2.9% ±0.2% , number 159,297 ±12,170 | 3.0% ±<0.1% , number 10,168,097 ±89,190 |
| Another state | 3.8% ±0.2% , number 209,146 ±13,400 | 2.1% ±<0.1% , number 7,025,589 ±81,660 |
| Another country | 0.5% ±0.1% , number 26,381 ±6,637 | 0.6% ±<0.1% , number 1,984,943 ±47,210 |
Embed
Top countries of birth, among those born abroad
Source: ACS 2025 1-year, table A07001.
Show data
| South Carolina | |
|---|---|
| Mexico | 18.4% , number 67,805 |
| Honduras | 5.8% , number 21,390 |
| India | 5.3% , number 19,723 |
| Colombia | 3.7% , number 13,744 |
| Philippines | 3.3% , number 12,345 |
| Germany | 3.2% , number 11,913 |
Embed
All the numbers
| Indicator | South Carolina | US | Rank among states* | Table |
|---|---|---|---|---|
| Population | 5,570,274 | 341,784,859 | 23rd | A00001 |
| People per square mile | 185 | 97 | 20th | A00002 |
| Land area (square miles) | 30,064 | – | – | A00002 |
| Median age | 41.3 ±0.2 | 39.5 ±0.1 | 13th | A01004 |
| Under 18 | 20.5% ±0.3% , number 1,144,386 ±16,560 | 21.0% ±<0.1% , number 71,689,151 ±111,800 | 32nd | B02002 |
| 65 and over | 21.1% ±0.3% , number 1,173,338 ±16,270 | 19.0% ±<0.1% , number 64,775,018 ±120,300 | 13th | B02002 |
| Born outside the US | 6.6% ±0.3% , number 368,976 ±14,640 | 14.7% ±0.1% , number 50,409,320 ±204,800 | 36th | A06001 |
| Speak a language other than English at home | 9.4% ±0.3% , number 494,730 ±17,350 | 22.9% ±0.1% , number 74,190,755 ±244,000 | 37th | C16001 |
| Veterans (adults) | 8.0% ±0.2% , number 350,835 ±9,964 | 5.9% ±<0.1% , number 15,746,228 ±85,320 | 6th | A16002 |
| Living with a disability | 15.3% ±0.3% , number 834,555 ±16,960 | 13.7% ±<0.1% , number 46,271,455 ±126,000 | 13th | B18101 |
| Women 15–50 who had a baby in the past year | 5.7% ±0.5% , number 72,377 ±5,997 | 5.0% ±0.1% , number 4,016,759 ±44,040 | 17th | B13002 |
| Lived in the same home a year ago | 87.0% ±0.5% , number 4,790,946 ±26,220 | 88.4% ±0.1% , number 298,889,697 ±214,800 | 29th | A08001 |
| White, not Hispanic | 61.0% ±0.2% , number 3,398,907 ±8,560 | 55.0% ±<0.1% , number 187,959,031 ±58,340 | 31st | A04001 |
| Hispanic or Latino | 8.4% ±<0.1% , number 469,890 ±1,680 | 20.5% ±<0.1% , number 69,975,516 ±13,270 | 34th | A04001 |
| Black, not Hispanic | 22.9% ±0.2% , number 1,275,320 ±12,520 | 11.7% ±<0.1% , number 40,096,453 ±106,200 | 7th | A04001 |
| Asian, not Hispanic | 1.9% ±0.1% , number 103,858 ±4,745 | 6.5% ±<0.1% , number 22,096,709 ±58,340 | 38th | A04001 |
*1 is the highest. Population is ranked among all states, and the rest among those of 1,000 people or more, whose figures can be ranked. Ranks use 5-year estimates, the only ones covering every state, so they can differ slightly from the figures here.
Income and work
Lower incomes than the US
The median household income is $73,672, lower than the US ($84,780). 13.3% of people live in poverty, and 10.2% have no health insurance, higher than the US (8.4%).
Household income
Source: ACS 2025 1-year, table A14001.
Show data
| South Carolina | United States | |
|---|---|---|
| Under $25,000 | 15.9% ±0.6% , number 364,831 ±13,510 | 14.0% ±0.1% , number 18,727,548 ±88,990 |
| $25,000 to $49,999 | 17.7% ±0.6% , number 405,861 ±13,470 | 15.4% ±0.1% , number 20,665,585 ±101,400 |
| $50,000 to $74,999 | 17.2% ±0.6% , number 393,920 ±12,910 | 15.3% ±0.1% , number 20,513,565 ±88,500 |
| $75,000 to $99,999 | 12.8% ±0.4% , number 293,897 ±10,160 | 12.5% ±0.1% , number 16,814,245 ±87,520 |
| $100,000 to $149,999 | 17.8% ±0.6% , number 408,176 ±13,240 | 17.9% ±0.1% , number 24,018,984 ±99,670 |
| $150,000 to $199,999 | 8.4% ±0.4% , number 191,852 ±8,602 | 10.1% ±0.1% , number 13,521,827 ±70,660 |
| $200,000 or more | 10.4% ±0.4% , number 237,813 ±8,293 | 14.8% ±0.1% , number 19,801,668 ±84,120 |
Embed
What residents do for work
Source: ACS 2025 1-year, table A17004.
Show data
| South Carolina | United States | |
|---|---|---|
| Education and health care | 22.9% ±0.6% , number 597,042 ±17,450 | 24.4% ±0.1% , number 40,862,193 ±140,800 |
| Professional and business services | 11.9% ±0.5% , number 309,905 ±13,850 | 12.8% ±0.1% , number 21,375,231 ±87,110 |
| Manufacturing | 11.6% ±0.4% , number 303,721 ±10,190 | 9.6% ±0.1% , number 16,064,394 ±91,270 |
| Retail trade | 11.5% ±0.5% , number 299,389 ±13,050 | 10.6% ±0.1% , number 17,781,181 ±96,660 |
| Arts, food and lodging | 9.5% ±0.4% , number 246,867 ±11,770 | 8.9% ±0.1% , number 14,811,502 ±87,840 |
| Construction | 7.6% ±0.4% , number 197,729 ±10,240 | 6.7% ±<0.1% , number 11,254,981 ±79,620 |
| Finance, insurance and real estate | 6.4% ±0.3% , number 166,965 ±9,032 | 6.6% ±<0.1% , number 11,025,569 ±68,570 |
| Transportation and warehousing | 5.5% ±0.4% , number 143,994 ±9,210 | 5.9% ±<0.1% , number 9,832,211 ±73,020 |
Embed
Where workers come from and go
South Carolina has 2,213,437 jobs and 2,287,711 employed residents. 123,040 people commute in to work and 197,314 commute out, while 2,090,397 both live and work here. The most commuters come from North Carolina.
Most commuters come from
- North Carolina: 68,193
- Georgia: 35,480
- Florida: 4,022
Most residents commute to
- North Carolina: 121,587
- Georgia: 44,359
- Florida: 5,433
Show data
| South Carolina | |
|---|---|
| Live and work here | 2,090,397 |
| Work here, live elsewhere | 123,040 |
| Live here, work elsewhere | 197,314 |
Embed
All the numbers
| Indicator | South Carolina | US | Rank among states* | Table |
|---|---|---|---|---|
| Median household income | $73,672 ±$1,216 | $84,780 ±$215 | 43rd | A14006 |
| Income per person | $42,152 ±$567 | $47,171 ±$115 | 41st | A14024 |
| Income inequality (Gini index) | 0.473 ±0.006 | 0.482 ±0.001 | 19th | A14028 |
| Living in poverty | 13.3% ±0.5% , number 720,328 ±26,240 | 11.8% ±0.1% , number 39,264,183 ±277,400 | 10th | A13004 |
| Unemployment rate | 4.6% ±0.3% , number 126,885 ±7,378 | 4.9% ±<0.1% , number 8,574,594 ±64,350 | 27th | A17005 |
| No health insurance | 10.2% ±0.3% , number 555,896 ±18,680 | 8.4% ±<0.1% , number 28,323,306 ±152,000 | 12th | A20001 |
*1 is the highest. Population is ranked among all states, and the rest among those of 1,000 people or more, whose figures can be ranked. Ranks use 5-year estimates, the only ones covering every state, so they can differ slightly from the figures here.
Education
College degrees close to the US
34.5% of adults 25 and over have a bachelor’s degree or more, lower than the US (37.4%).
Highest level of education
Source: ACS 2025 1-year, table A12001.
Show data
| South Carolina | United States | |
|---|---|---|
| Less than high school | 9.1% ±0.4% , number 359,432 ±14,540 | 9.4% ±0.1% , number 22,321,002 ±120,500 |
| High school only | 26.5% ±0.5% , number 1,043,165 ±21,050 | 25.6% ±0.1% , number 61,096,726 ±203,400 |
| Some college | 29.8% ±0.5% , number 1,172,977 ±20,970 | 27.7% ±0.1% , number 65,920,977 ±173,500 |
| Bachelor’s degree | 21.6% ±0.5% , number 847,286 ±19,450 | 22.3% ±0.1% , number 53,224,312 ±196,700 |
| Graduate degree | 12.9% ±0.4% , number 506,804 ±15,470 | 15.0% ±0.1% , number 35,816,011 ±159,400 |
Embed
All the numbers
| Indicator | South Carolina | US | Rank among states* | Table |
|---|---|---|---|---|
| Bachelor’s degree or more | 34.5% ±0.6% , number 1,354,090 ±24,850 | 37.4% ±0.1% , number 89,040,323 ±253,200 | 34th | A12001 |
| High school graduate or more | 90.9% ±1.0% , number 3,570,232 ±38,730 | 90.6% ±0.2% , number 216,058,026 ±368,200 | 34th | A12001 |
*1 is the highest. Population is ranked among all states, and the rest among those of 1,000 people or more, whose figures can be ranked. Ranks use 5-year estimates, the only ones covering every state, so they can differ slightly from the figures here.
Housing
Home values outran incomes
28.2% of households rent, lower than the US (34.7%). The median home is worth $306,200 and the median rent is $1,395. After inflation, home values rose 50% from 2015 to 2025, while household income rose 14%.
Housing costs and income, 2015 to 2025, after inflation
Source: ACS 1-year, table A10036, A18009, A14006.
Show data
| South Carolina | United States | |
|---|---|---|
| Median home value | +50.4% | +39.3% |
| Median rent | +24.3% | +18.5% |
| Median household income | +13.8% | +10.9% |
Embed
Types of homes
Source: ACS 2025 1-year, table A10032.
Show data
| South Carolina | United States | |
|---|---|---|
| Single-family, detached | 64.6% ±0.6% , number 1,665,432 ±15,920 | 60.9% ±0.1% , number 90,335,844 ±173,300 |
| Single-family, attached | 4.0% ±0.3% , number 103,251 ±6,885 | 6.4% ±<0.1% , number 9,527,703 ±51,230 |
| 2 to 4 units | 4.6% ±0.3% , number 119,200 ±8,439 | 7.5% ±0.1% , number 11,109,005 ±75,790 |
| 5 to 19 units | 7.2% ±0.3% , number 186,172 ±8,827 | 8.7% ±0.1% , number 12,829,882 ±97,590 |
| 20 or more units | 6.3% ±0.4% , number 162,060 ±9,586 | 11.1% ±0.1% , number 16,381,450 ±92,310 |
| Mobile homes and other | 13.3% ±0.4% , number 343,623 ±11,060 | 5.4% ±<0.1% , number 8,045,083 ±53,680 |
Embed
When homes were built
Source: ACS 2025 1-year, table A10055.
Show data
| South Carolina | United States | |
|---|---|---|
| 2010 or later | 25.0% ±0.7% , number 573,367 ±16,200 | 15.1% ±0.1% , number 20,257,912 ±101,300 |
| 2000 to 2009 | 17.9% ±0.5% , number 409,930 ±12,030 | 13.8% ±0.1% , number 18,535,840 ±92,260 |
| 1980 to 1999 | 27.7% ±0.7% , number 636,752 ±16,350 | 24.1% ±0.1% , number 32,332,570 ±118,900 |
| 1960 to 1979 | 18.6% ±0.6% , number 427,469 ±12,900 | 22.9% ±0.1% , number 30,726,302 ±110,000 |
| Before 1960 | 10.8% ±0.4% , number 248,832 ±9,342 | 24.0% ±0.1% , number 32,210,798 ±121,500 |
Embed
All the numbers
| Indicator | South Carolina | US | Rank among states* | Table |
|---|---|---|---|---|
| Housing units | 2,579,738 | – | – | A10001 |
| Households | 2,296,350 ±12,030 | – | – | A10008 |
| People per household | 2.36 ±0.01 | 2.49 ±0.01 | 27th | A10003 |
| Households that rent | 28.2% ±0.7% , number 646,966 ±15,960 | 34.7% ±0.1% , number 46,551,688 ±193,200 | 43rd | A10060 |
| Vacant homes | 11.0% ±0.5% , number 283,388 ±12,130 | 9.6% ±0.1% , number 14,165,545 ±137,100 | 12th | A10047, A10060 |
| Median gross rent | $1,395 ±$25 | $1,557 ±$4 | 30th | A18009 |
| Median home value | $306,200 ±$3,027 | $371,100 ±$646 | 33rd | A10036 |
| Renters paying 30% or more of income | 47.6% ±1.7% , number 307,668 ±13,530 | 48.3% ±0.2% , number 22,486,693 ±122,100 | 19th | A18002 |
| Owners paying 30% or more of income | 21.6% ±0.8% , number 356,996 ±12,760 | 24.2% ±0.1% , number 21,201,943 ±93,050 | 36th | A10040 |
| Homes built before 1960 | 10.8% ±0.4% , number 248,832 ±9,342 | 24.0% ±0.1% , number 32,210,798 ±121,500 | 45th | A10055 |
*1 is the highest. Population is ranked among all states, and the rest among those of 1,000 people or more, whose figures can be ranked. Ranks use 5-year estimates, the only ones covering every state, so they can differ slightly from the figures here.
Getting around
A driving state
75.5% of workers drive alone and 11.6% work from home. 39.0% of those who travel to work spend 30 minutes or more getting there, and 5.9% of households have no vehicle.
How people get to work
Source: ACS 2025 1-year, table A09005.
Show data
| South Carolina | United States | |
|---|---|---|
| Drive alone | 75.5% ±0.5% , number 1,962,150 ±21,520 | 69.8% ±0.1% , number 115,297,377 ±192,900 |
| Carpool | 9.2% ±0.4% , number 239,234 ±11,180 | 8.9% ±0.1% , number 14,712,170 ±97,240 |
| Public transit | 0.8% ±0.1% , number 20,472 ±2,951 | 4.3% ±<0.1% , number 7,100,386 ±63,330 |
| Walk | 1.6% ±0.2% , number 41,280 ±4,340 | 2.4% ±<0.1% , number 4,016,469 ±41,070 |
| Work from home | 11.6% ±0.4% , number 302,643 ±10,640 | 12.9% ±0.1% , number 21,288,393 ±105,700 |
| Other | 1.3% ±0.2% , number 33,984 ±4,262 | 1.7% ±<0.1% , number 2,799,658 ±41,510 |
Embed
Time spent getting to work
Source: ACS 2025 1-year, table B09001.
Show data
| South Carolina | United States | |
|---|---|---|
| Under 10 minutes | 11.0% ±0.4% , number 253,459 ±10,620 | 12.0% ±0.1% , number 17,199,225 ±93,440 |
| 10 to 19 minutes | 27.5% ±0.7% , number 632,794 ±17,290 | 27.8% ±0.1% , number 40,059,540 ±137,700 |
| 20 to 29 minutes | 22.4% ±0.7% , number 515,212 ±16,060 | 21.0% ±0.1% , number 30,221,743 ±111,100 |
| 30 to 39 minutes | 18.4% ±0.6% , number 423,080 ±14,190 | 17.1% ±0.1% , number 24,659,138 ±103,800 |
| 40 to 59 minutes | 12.6% ±0.5% , number 288,864 ±12,130 | 12.6% ±0.1% , number 18,104,709 ±97,070 |
| 60 minutes or more | 8.0% ±0.4% , number 183,711 ±9,922 | 9.5% ±0.1% , number 13,681,705 ±84,440 |
Embed
Vehicles per household
Source: ACS 2025 1-year, table A10030.
Show data
| South Carolina | United States | |
|---|---|---|
| None | 5.9% ±0.4% , number 135,080 ±8,188 | 8.8% ±0.1% , number 11,781,997 ±77,240 |
| One | 32.4% ±0.7% , number 743,868 ±16,870 | 33.1% ±0.1% , number 44,424,682 ±160,700 |
| Two | 38.3% ±0.7% , number 880,196 ±16,820 | 36.0% ±0.1% , number 48,200,889 ±176,800 |
| Three or more | 23.4% ±0.6% , number 537,206 ±14,300 | 22.1% ±0.1% , number 29,655,854 ±113,300 |
Embed
All the numbers
| Indicator | South Carolina | US | Rank among states* | Table |
|---|---|---|---|---|
| Drive to work alone | 75.5% ±0.5% , number 1,962,150 ±21,520 | 69.8% ±0.1% , number 115,297,377 ±192,900 | 10th | A09005 |
| Take public transit | 0.8% ±0.1% , number 20,472 ±2,951 | 4.3% ±<0.1% , number 7,100,386 ±63,330 | 44th | A09005 |
| Work from home | 11.6% ±0.4% , number 302,643 ±10,640 | 12.9% ±0.1% , number 21,288,393 ±105,700 | 36th | A09005 |
| Commute 30 minutes or more | 39.0% ±0.8% , number 895,655 ±21,140 | 39.2% ±0.1% , number 56,445,552 ±165,300 | 18th | B09001 |
| Households with no vehicle | 5.9% ±0.3% , number 135,080 ±7,757 | 8.8% ±<0.1% , number 11,781,997 ±64,240 | 34th | A10030 |
*1 is the highest. Population is ranked among all states, and the rest among those of 1,000 people or more, whose figures can be ranked. Ranks use 5-year estimates, the only ones covering every state, so they can differ slightly from the figures here.
Places
The largest cities in South Carolina
Population, from the latest estimates available. Figures cover the whole of each place.
Largest places
- Charleston: 162,010
- Columbia: 146,588
- North Charleston: 129,226
- Mount Pleasant: 95,476
- Rock Hill: 75,908
- Greenville: 75,319
- Summerville: 51,654
- Goose Creek: 48,078
Every county and place in South Carolina
Find any county, city, town, metro area, ZIP code, school district or district in South Carolina.
Counties
Each of the 46 counties with its population, from ACS 2020–2024 5-year estimates.
- Abbeville County24,420
- Aiken County174,160
- Allendale County7,661
- Anderson County210,478
- Bamberg County13,042
- Barnwell County20,521
- Beaufort County195,289
- Berkeley County246,802
- Calhoun County14,182
- Charleston County420,264
- Cherokee County56,647
- Chester County32,182
- Chesterfield County43,784
- Clarendon County30,986
- Colleton County38,783
- Darlington County62,558
- Dillon County27,862
- Dorchester County167,201
- Edgefield County27,476
- Fairfield County20,550
- Florence County137,117
- Georgetown County64,811
- Greenville County548,166
- Greenwood County69,489
- Hampton County18,254
- Horry County383,016
- Jasper County32,166
- Kershaw County68,314
- Lancaster County104,475
- Laurens County68,666
- Lee County16,166
- Lexington County304,887
- Marion County28,664
- Marlboro County25,975
- McCormick County9,760
- Newberry County38,435
- Oconee County80,469
- Orangeburg County83,253
- Pickens County134,629
- Richland County422,117
- Saluda County19,131
- Spartanburg County347,852
- Sumter County104,725
- Union County26,885
- Williamsburg County30,282
- York County293,673
Cities, towns and other places
Each of the 474 with its population, from ACS 2020–2024 5-year estimates. Census-designated places are communities without a local government of their own, drawn by the Census Bureau so they can be counted.
- Abbeville4,872
- Abney Crossroads208
- Adams Run469
- Aiken32,521
- Alcolu459
- Allendale2,653
- Anderson30,051
- Andrews3,485
- Antreville260
- Arcadia3,426
- Arcadia Lakes901
- Arial1,919
- Arkwright2,816
- Arthurtown3,272
- Ashwood50
- Atlantic Beach237
- Awendaw1,772
- Aynor1,112
- Bamberg2,996
- Barnwell4,613
- Batesburg-Leesville4,941
- Baxter Village4,542
- Beaufort13,747
- Beech Island1,578
- Belton4,458
- Belvedere5,180
- Ben Avon2,487
- Bennettsville7,751
- Berea16,862
- Bethune438
- Bishopville2,910
- Blacksburg2,063
- Blackville1,778
- Blenheim82
- Bluffton33,157
- Blythewood5,731
- Boiling Springs12,936
- Bonneau581
- Bonneau Beach1,516
- Bowman691
- Boykin122
- Bradley90
- Branchville1,084
- Briarcliffe Acres448
- Brookdale4,291
- Browntown88
- Brunson401
- Bucksport747
- Buffalo1,329
- Buford346
- Burnettown3,135
- Burton6,912
- Caesars Head11
- Calhoun Falls2,049
- Camden8,267
- Cameron427
- Camp Croft1,586
- Campobello776
- Cane Savannah1,551
- Capitol View4,374
- Carlisle494
- Carolina Forest26,263
- Cash754
- Catawba1,071
- Cateechee850
- Cayce13,741
- Centenary191
- Centerville7,049
- Central5,320
- Central Pacolet206
- Chapin1,394
- Charleston154,338
- Cheraw4,960
- Cherokee Falls36
- Cherryvale2,611
- Chesnee896
- Chester5,218
- Chesterfield1,465
- Chickasaw Point620
- City View746
- Clarks Hill133
- Clearwater3,319
- Clemson18,072
- Clemson University7,015
- Clifton792
- Clinton7,676
- Clio840
- Clover7,234
- Cokesbury267
- Columbia139,643
- Conestee776
- Converse463
- Conway27,263
- Coosawhatchie43
- Cope15
- Cordova118
- Coronaca37
- Cottageville1,196
- Coward853
- Cowpens1,840
- Cross Anchor98
- Cross Hill514
- Dacusville198
- Dale411
- Dalzell2,946
- Danwood392
- Darlington6,120
- Daufuskie Island619
- Daviston262
- DeBordieu Colony627
- Denmark3,117
- Dentsville15,209
- Dillon6,354
- Donalds355
- Dovesville1,120
- Drayton1,452
- Due West1,177
- Dunbar577
- Duncan4,310
- Dunean3,668
- Easley24,841
- East Camden4,194
- East Gaffney2,824
- East Sumter943
- Eastover485
- Edgefield4,010
- Edisto1,801
- Edisto Beach1,092
- Edmund1,161
- Ehrhardt389
- Elgin CDP2,360
- Elgin town2,080
- Elko296
- Elliott230
- Elloree1,035
- Enoree370
- Estill1,886
- Eureka Mill1,813
- Eutawville388
- Fair Play757
- Fairfax1,935
- Fairforest1,727
- Fairview Crossroads444
- Fingerville204
- Finklea340
- Five Forks18,656
- Florence40,408
- Floydale312
- Folly Beach1,267
- Forest Acres10,530
- Forestbrook7,479
- Foreston5
- Fort Lawn1,388
- Fort Mill30,775
- Fountain Inn12,020
- Fripp Island752
- Furman673
- Gadsden1,443
- Gaffney12,596
- Gantt15,401
- Garden City11,591
- Gaston1,803
- Gayle Mill974
- Georgetown8,565
- Gifford268
- Gilbert751
- Gillisonville378
- Glendale211
- Glenn Springs236
- Gloverville2,505
- Golden Grove2,913
- Goose Creek48,078
- Govan45
- Gramling95
- Graniteville2,056
- Gray Court783
- Great Falls1,690
- Greeleyville362
- Green Sea71
- Greenville72,935
- Greenwood22,536
- Greer41,536
- Grover345
- Hamer1,042
- Hampton2,636
- Hanahan21,452
- Harbor Island303
- Hardeeville10,871
- Harleyville592
- Hartsville7,419
- Heath Springs955
- Helena716
- Hemingway660
- Hickory Grove528
- Hilda468
- Hilltop2,950
- Hilton Head Island37,911
- Hodges193
- Holly Hill1,218
- Hollywood5,382
- Homeland Park6,632
- Homewood2,708
- Honea Path3,739
- Hopkins1,985
- India Hook3,960
- Inman3,166
- Inman Mills923
- Irmo11,813
- Irwin1,919
- Islandton56
- Isle of Palms4,362
- Iva972
- Jackson1,870
- Jacksonboro336
- James Island12,198
- Jamestown62
- Jefferson737
- Jenkinsville69
- Joanna1,306
- Johnsonville1,251
- Johnston2,132
- Jonesville1,118
- Judson2,515
- Keowee Key3,351
- Kershaw2,259
- Ketchuptown45
- Kiawah Island2,326
- Kingstree3,132
- Kline154
- La France678
- Ladson16,140
- Lake City5,988
- Lake Murray of Richland7,023
- Lake Secession1,268
- Lake View679
- Lake Wylie16,006
- Lakewood3,544
- Lamar1,196
- Lancaster8,921
- Landrum2,620
- Lane564
- Langley1,310
- Latta1,455
- Laurel Bay5,882
- Laurens9,336
- Lesslie3,077
- Lexington24,585
- Liberty3,350
- Lincolnville1,064
- Litchfield Beach9,044
- Little Mountain368
- Little River11,771
- Little Rock306
- Live Oak22
- Livingston152
- Lobeco109
- Lockhart405
- Lodge98
- Loris2,645
- Lowndesville206
- Lowrys303
- Lugoff9,786
- Luray311
- Lydia190
- Lyman6,547
- Lynchburg323
- Manning3,863
- Manville827
- Marion6,206
- Mauldin27,055
- Mayesville832
- Mayo2,305
- McBee818
- McClellanville690
- McColl2,200
- McConnells285
- McCormick2,506
- Meggett1,307
- Modoc577
- Monarch Mill1,822
- Moncks Corner15,485
- Monetta282
- Mount Carmel261
- Mount Croghan170
- Mount Pleasant93,993
- Mountville136
- Mulberry474
- Mullins3,914
- Murphys Estates1,064
- Murrells Inlet10,044
- Myrtle Beach38,371
- Neeses524
- New Ellenton2,837
- Newberry10,790
- Newport4,121
- Newry412
- Newtown972
- Nichols240
- Ninety Six2,521
- Norris784
- North675
- North Augusta25,653
- North Charleston119,913
- North Hartsville3,304
- North Myrtle Beach19,855
- North Santee649
- Northlake4,390
- Norway322
- Oak Grove12,256
- Oakland1,060
- Olanta806
- Olar139
- Olympia935
- Orangeburg13,253
- Oswego172
- Pacolet2,419
- Pageland2,489
- Pamplico1,134
- Parker12,898
- Parksville82
- Patrick331
- Pauline447
- Pawleys Island170
- Paxville453
- Peak108
- Pelion985
- Pelzer1,722
- Pendleton3,594
- Perry250
- Pickens3,155
- Piedmont5,462
- Pimlico1,765
- Pine Ridge CDP637
- Pine Ridge town2,596
- Pinewood668
- Pinopolis854
- Plum Branch95
- Pomaria152
- Port Royal15,579
- Powdersville10,771
- Princeton19
- Privateer2,472
- Promised Land143
- Prosperity1,318
- Quinby858
- Rains84
- Ravenel2,615
- Red Bank11,314
- Red Hill15,920
- Reevesville271
- Reidville2,194
- Rembert144
- Richburg397
- Ridge Spring842
- Ridgeland3,764
- Ridgeville1,740
- Ridgeway261
- Riverview2,121
- Rock Hill75,259
- Rockville121
- Roebuck2,902
- Rowesville393
- Ruby244
- Russellville392
- Salem177
- Salley288
- Saluda3,055
- Sandy Springs1,105
- Sangaree8,681
- Sans Souci7,665
- Santee1,076
- Saxon4,085
- Scotia97
- Scranton733
- Seabrook799
- Seabrook Island2,204
- Sellers192
- Seneca8,993
- Seven Oaks15,921
- Sharon431
- Sheldon610
- Shell Point1,439
- Shiloh124
- Silverstreet330
- Simpsonville26,144
- Six Mile931
- Slater-Marietta2,381
- Smoaks95
- Smyrna38
- Snelling219
- Socastee23,796
- Society Hill388
- South Congaree2,075
- South Sumter1,626
- South Union447
- Southern Shops3,797
- Spartanburg38,910
- Springdale CDP2,198
- Springdale town2,742
- Springfield468
- St. Andrews19,868
- St. Charles139
- St. George2,154
- St. Matthews1,645
- St. Stephen1,462
- Starr258
- Startex668
- Stateburg2,027
- Stuckey190
- Sullivan's Island2,087
- Summerton803
- Summerville51,654
- Summit533
- Sumter43,053
- Surfside Beach4,270
- Swansea744
- Sycamore68
- Tamassee35
- Tatum80
- Taylors24,505
- Tega Cay13,615
- The Cliffs Valley789
- Tigerville1,880
- Timmonsville2,045
- Tradesville174
- Travelers Rest8,370
- Trenton258
- Troy177
- Turbeville925
- Ulmer190
- Union8,079
- Unity244
- Utica1,339
- Valley Falls8,239
- Van Wyck951
- Vance166
- Varnville2,571
- Wade Hampton20,898
- Wagener1,193
- Walhalla4,157
- Wallace665
- Walterboro5,480
- Ward260
- Ware Place117
- Ware Shoals2,074
- Warrenville1,042
- Waterloo212
- Watts Mills1,942
- Wedgefield1,968
- Welcome6,527
- Wellford3,515
- West Columbia17,963
- West Pelzer1,320
- West Union370
- Westminster2,521
- White Knoll8,310
- Whitmire1,319
- Whitney3,685
- Wilkinson Heights2,012
- Williams100
- Williamston4,170
- Willington138
- Williston2,870
- Windsor307
- Winnsboro3,322
- Winnsboro Mills1,535
- Wisacky149
- Woodfield9,465
- Woodford115
- Woodruff4,538
- Wyboo3,639
- Yemassee1,178
- York8,969
- Zion76
Metro and micro areas
Each of the 16 that reach into South Carolina, with its whole population, from ACS 2020–2024 5-year estimates. Metro and micro areas are counties tied together by commuting, drawn by the Office of Management and Budget.
- Augusta-Richmond County, GA-SC Metro Area624,181
- Charleston-North Charleston, SC Metro Area834,267
- Charlotte-Concord-Gastonia, NC-SC Metro Area2.77M
- Columbia, SC Metro Area849,181
- Florence, SC Metro Area199,675
- Gaffney, SC Micro Area56,647
- Greenville-Anderson-Greer, SC Metro Area961,939
- Greenwood, SC Micro Area93,909
- Hilton Head Island-Bluffton-Port Royal, SC Metro Area227,455
- Murrells Inlet, SC Micro Area64,811
- Myrtle Beach-Conway-North Myrtle Beach, SC Metro Area383,016
- Newberry, SC Micro Area38,435
- Orangeburg, SC Micro Area83,253
- Seneca, SC Micro Area80,469
- Spartanburg, SC Metro Area374,737
- Sumter, SC Metro Area104,725
ZIP codes
Each of the 422 with people in it, by the town it's centered in, from ACS 2020–2024 5-year estimates. These are the Census Bureau's ZIP Code Tabulation Areas, which follow the Postal Service's ZIP codes as closely as census blocks allow.
- 29001Alcolu2,339
- 29003Bamberg5,610
- 29006Batesburg-Leesville9,199
- 29009Bethune2,451
- 29010Bishopville11,861
- 290141,595
- 290151,255
- 29016Blythewood30,454
- 29018Bowman3,559
- 29020East Camden23,266
- 29030Cameron2,045
- 29031Carlisle1,617
- 29032Bethune4,687
- 29033Cayce12,837
- 29036Chapin26,620
- 29037Silverstreet983
- 29038Cope2,362
- 29039Cordova2,941
- 29040Dalzell8,920
- 29042Denmark4,904
- 29044Eastover4,799
- 29045Elgin town31,372
- 29046Elliott22
- 29047Elloree3,537
- 29048Eutawville4,982
- 29051Turbeville758
- 29052Gadsden2,199
- 29053Gaston21,076
- 29054Gilbert11,174
- 29055Great Falls3,924
- 29056Greeleyville2,203
- 29058Heath Springs5,423
- 29059Holly Hill4,905
- 29061Hopkins12,538
- 29062Stateburg10
- 29063Irmo38,201
- 29065Jenkinsville605
- 29067Kershaw11,116
- 29069Lamar4,647
- 29070Summit15,657
- 29072Lexington69,407
- 29073White Knoll53,156
- 29074212
- 29075Little Mountain2,848
- 29078Lugoff16,283
- 29079Lydia58
- 29080Lynchburg2,601
- 29081Ehrhardt1,102
- 29082Lodge371
- 29101McBee2,497
- 29102Manning15,698
- 29104Mayesville1,732
- 29105Monetta1,621
- 29107Neeses2,646
- 29108Helena19,585
- 29111Turbeville1,401
- 29112North3,847
- 29113Norway1,875
- 29114Olanta1,786
- 29115Wilkinson Heights27,450
- 29117Orangeburg595
- 29118Brookdale15,135
- 29122Peak100
- 29123Pelion7,938
- 29125Pinewood2,861
- 29126Pomaria2,703
- 29127Prosperity9,920
- 29128Rembert4,460
- 29129Ridge Spring4,605
- 29130Ridgeway6,252
- 29133Rowesville1,262
- 29135St. Matthews8,294
- 29137Salley2,248
- 29138Saluda10,018
- 29142Santee4,744
- 29145Silverstreet594
- 29146Springfield1,226
- 29148North Santee6,033
- 29150Lakewood38,538
- 29152Sumter1,967
- 29153Mulberry14,434
- 29154Privateer29,454
- 29160Swansea7,419
- 29161Timmonsville9,688
- 29162Turbeville3,776
- 29163Vance1,573
- 29164Wagener4,830
- 29166Ward611
- 29168Wedgefield2,903
- 29169West Columbia21,647
- 29170Cayce21,247
- 29172Pine Ridge town8,974
- 29175Abney Crossroads235
- 29177Lake Murray of Richland177
- 29178Whitmire3,280
- 29180Winnsboro11,730
- 29201Columbia24,605
- 29203St. Andrews40,653
- 29204Columbia18,159
- 29205Columbia22,223
- 29206Forest Acres19,759
- 29207Columbia8,012
- 29208Columbia2,445
- 29209Capitol View38,041
- 29210St. Andrews39,962
- 29212Irmo27,657
- 29223Dentsville53,074
- 29225Columbia443
- 29229Dentsville51,861
- 29301Fairforest36,278
- 29302Camp Croft19,918
- 29303Valley Falls28,381
- 29306Arkwright16,714
- 29307Clifton19,115
- 29316Boiling Springs33,104
- 29320Arcadia603
- 29321Buffalo3,236
- 29322Campobello10,931
- 29323Chesnee15,573
- 29324Clifton32
- 29325Clinton14,362
- 29329Converse348
- 29330Cowpens8,572
- 29331Cross Anchor98
- 29332Cross Hill3,539
- 29333Drayton254
- 29334Duncan18,575
- 29335Cross Anchor5,472
- 29338Fingerville51
- 29340Cherokee Falls20,763
- 29341Gaffney20,647
- 29346Glendale211
- 29349Inman39,083
- 29351Joanna1,397
- 29353Jonesville3,675
- 29355Joanna841
- 29356Landrum8,946
- 29360Laurens22,085
- 29364Lockhart553
- 29365Lyman14,068
- 29368Mayo379
- 29369Roebuck16,503
- 29370Mountville542
- 29372Central Pacolet3,552
- 29373Pacolet320
- 29374Glenn Springs3,079
- 29375Reidville177
- 29376Pauline8,935
- 29377Wellford480
- 29378Saxon261
- 29379Monarch Mill17,607
- 29384Waterloo3,443
- 29385Lyman8,180
- 29388Woodruff16,868
- 29401Charleston9,339
- 29403Charleston22,533
- 29404North Charleston2,334
- 29405North Charleston26,254
- 29406North Charleston32,001
- 29407Charleston36,706
- 29409Charleston2,056
- 29410Hanahan21,314
- 29412Charleston39,256
- 29414Charleston44,727
- 29418North Charleston26,052
- 29420North Charleston23,959
- 29424Charleston1,243
- 29426Adams Run1,697
- 29429Awendaw4,479
- 29431Bonneau7,580
- 29432Branchville2,424
- 29434Pimlico755
- 29435Cottageville4,304
- 294364,000
- 29437Harleyville2,281
- 29438Edisto Beach2,826
- 29439Folly Beach1,125
- 29440Georgetown27,319
- 29445Goose Creek59,227
- 294461,184
- 29448Harleyville1,997
- 29449Meggett8,024
- 294503,309
- 29451Isle of Palms4,362
- 29452Jacksonboro318
- 29453Jamestown1,517
- 29455Kiawah Island27,576
- 29456North Charleston41,214
- 29458McClellanville2,505
- 29461Moncks Corner43,816
- 29464Mount Pleasant53,045
- 29466Mount Pleasant44,942
- 29468Russellville2,144
- 29469Pinopolis470
- 29470Ravenel5,639
- 29471Reevesville1,135
- 29472Ridgeville12,722
- 29474Cottageville1,420
- 29475Williams2,286
- 29477St. George7,176
- 29479St. Stephen6,031
- 29481Smoaks1,759
- 29482Sullivan's Island2,087
- 29483Summerville59,186
- 29485Summerville58,507
- 29486Sangaree53,975
- 29487Rockville2,703
- 29488Walterboro22,538
- 29492Charleston20,436
- 29493Williams156
- 29501Florence48,673
- 29505Danwood23,895
- 29506Quinby20,777
- 29510Andrews10,545
- 29511Aynor6,874
- 29512Bennettsville17,197
- 29516Blenheim882
- 29518Lake City1,121
- 29519Centenary99
- 29520Cheraw13,206
- 29525Clio1,665
- 29526Homewood54,130
- 29527Conway28,451
- 29530Coward2,641
- 29532Darlington19,857
- 29536Dillon14,907
- 29540Dovesville4,080
- 29541Danwood9,326
- 29543Zion415
- 29544Aynor8,252
- 29545Green Sea1,767
- 29546Daviston2,683
- 29547Hamer2,832
- 29550Hartsville29,924
- 29554Hemingway8,681
- 29555Johnsonville5,972
- 29556Kingstree10,559
- 29560Lake City12,277
- 29563Lake View1,884
- 29564Lane1,262
- 29565Latta7,109
- 29566Little River23,806
- 29567Clio550
- 29568Little River17,097
- 29569Loris17,788
- 29570McColl4,141
- 29571Marion13,457
- 29572Briarcliffe Acres12,124
- 29574Mullins9,413
- 29575Surfside Beach20,721
- 29576Murrells Inlet34,695
- 29577Myrtle Beach35,446
- 29579Carolina Forest56,915
- 29580Stuckey1,322
- 29581Nichols4,845
- 29582North Myrtle Beach20,158
- 29583Pamplico4,994
- 29584Patrick2,979
- 29585Murrells Inlet16,966
- 29588Socastee52,609
- 29589Rains65
- 29590Lane3,480
- 29591Scranton4,639
- 29592Sellers969
- 29593Society Hill1,692
- 29594Tatum80
- 29596Wallace1,910
- 29601Greenville13,790
- 29605Gantt40,717
- 29607Greenville46,209
- 29609Sans Souci32,292
- 29611Welcome32,365
- 29613Travelers Rest2,359
- 29614Greenville1,848
- 29615Wade Hampton38,811
- 29617Berea26,582
- 29620Abbeville11,612
- 29621Anderson46,482
- 29624Homeland Park13,498
- 29625Sandy Springs28,012
- 29626Centerville13,928
- 29627Belton18,274
- 29628Calhoun Falls2,526
- 29630Central15,982
- 29631Clemson16,849
- 29634Clemson University6,048
- 29635Caesars Head1,366
- 29638Donalds3,348
- 29639Due West1,751
- 29640Dacusville33,142
- 29642Easley36,852
- 29643Fair Play2,751
- 29644Fountain Inn22,907
- 29645Gray Court11,054
- 29646Greenwood27,902
- 29649Coronaca26,275
- 29650Greer42,493
- 29651Tigerville56,599
- 29653Hodges4,293
- 29654Honea Path11,095
- 29655Lake Secession7,555
- 29657Liberty16,390
- 29658306
- 29659Lowndesville163
- 29661Slater-Marietta6,657
- 29662Mauldin14,950
- 29664Tamassee1,553
- 29665Newry412
- 29666Ninety Six6,894
- 29667Norris240
- 29669Ware Place16,080
- 29670Pendleton11,084
- 29671Pickens18,666
- 29672Newry12,750
- 29673Golden Grove30,461
- 29676Salem6,016
- 29678Utica23,767
- 29680Simpsonville35,770
- 29681Five Forks68,650
- 29682Six Mile3,957
- 29683Slater-Marietta265
- 29684Starr5,913
- 296851,964
- 29686Tamassee989
- 29687Taylors44,861
- 29689Fair Play4,057
- 29690Tigerville26,358
- 29691Walhalla12,084
- 29692Ware Shoals5,536
- 29693Westminster15,114
- 29696West Union5,154
- 29697Williamston13,581
- 29702Blacksburg9,770
- 29704Catawba3,060
- 29706Gayle Mill18,742
- 29707Fort Mill37,629
- 29708Tega Cay43,515
- 29709Chesterfield5,988
- 29710Clover40,595
- 29712Catawba2,047
- 29714Fort Lawn3,462
- 29715Fort Mill46,865
- 29717Hickory Grove1,644
- 29718Jefferson4,133
- 29720Lancaster53,584
- 29726McConnells1,985
- 29727Mount Croghan2,300
- 29728Pageland9,043
- 29729Richburg2,247
- 29730Rock Hill58,199
- 29732Rock Hill57,675
- 29733Rock Hill1,468
- 29741Ruby1,504
- 29742Sharon2,492
- 29743Smyrna1,826
- 29745York34,909
- 29801Aiken31,108
- 29803New Ellenton40,699
- 298054,935
- 29809New Ellenton2,301
- 29810Allendale3,775
- 29812Barnwell11,132
- 29816Burnettown1,092
- 29817Blackville4,139
- 29819Bradley930
- 29821Clarks Hill1,141
- 29824Edgefield7,789
- 29826Elko241
- 29827Fairfax3,396
- 29828Gloverville489
- 29829Graniteville12,385
- 29831Jackson4,394
- 29832Johnston5,074
- 29834Langley259
- 29835McCormick6,887
- 29836326
- 29838Modoc830
- 29840Mount Carmel261
- 29841Belvedere32,342
- 29842Beech Island8,102
- 29843Olar934
- 29844Parksville111
- 29845Parksville837
- 29847Trenton5,554
- 29848889
- 29849Ulmer271
- 29851Gloverville9,070
- 29853Williston5,944
- 29856Windsor3,272
- 29860Murphys Estates18,201
- 29899McCormick710
- 29902Port Royal17,650
- 29904Beaufort1,600
- 29905Port Royal1,729
- 29906Burton25,342
- 29907Beaufort15,190
- 29909Shell Point24,003
- 29910Bluffton53,019
- 29911Brunson1,516
- 29912Coosawhatchie24
- 29915Daufuskie Island619
- 29916Yemassee1,470
- 29918Estill3,799
- 29920Fripp Island10,606
- 29921Furman618
- 29922Scotia772
- 29923Gifford268
- 29924Hampton4,447
- 29926Hilton Head Island24,458
- 29927Hardeeville11,373
- 29928Hilton Head Island15,785
- 29929Islandton1,276
- 29932Luray322
- 29934Gillisonville1,183
- 29935Port Royal3,513
- 29936Ridgeland14,989
- 29939Scotia81
- 29940Dale3,256
- 29941Seabrook329
- 29943224
- 29944Varnville4,416
- 29945Yemassee3,918
School districts
Each of the 77 with people in it, from ACS 2020–2024 5-year estimates. Elementary districts teach the lower grades and secondary districts the upper ones, under them; the rest are unified, teaching every grade.
- Abbeville County School District23,461
- Aiken County School District176,650
- Allendale County School District7,661
- Anderson School District 161,638
- Anderson School District 223,201
- Anderson School District 314,877
- Anderson School District 425,233
- Anderson School District 585,945
- Bamberg County School District13,042
- Barnwell County Consolidated School District8,989
- Barnwell School District 4511,532
- Beaufort County School District193,602
- Beaufort County School District within Beaufort Marine Corps Air Stationsecondary1,687
- Beaufort Marine Corps Air Station School Districtelementary1,687
- Berkeley County School District246,802
- Calhoun County School District14,182
- Charleston County School District420,264
- Cherokee County School District54,383
- Chester County School District32,182
- Chesterfield County School District43,784
- Clarendon County School District30,986
- Colleton County School District38,783
- Darlington County School District62,558
- Dillon School District 37,183
- Dillon School District 420,679
- Dorchester School District 2150,826
- Dorchester School District 416,375
- Edgefield County School District27,476
- Fairfield County School District20,550
- Florence School District 1106,531
- Florence School District 26,731
- Florence School District 318,408
- Florence School District 55,447
- Fort Jackson Schoolselementary12,064
- Georgetown County School District64,811
- Greenville County School District568,693
- Greenwood School District 5058,220
- Greenwood School District 517,246
- Greenwood School District 527,403
- Hampton County School District18,254
- Horry County School District383,016
- Jasper County School District32,166
- Kershaw County School District68,314
- Lancaster County School District104,475
- Laurens School District 5538,158
- Laurens School District 5620,194
- Lee County School District16,166
- Lexington School District 1154,535
- Lexington School District 265,921
- Lexington School District 314,001
- Lexington School District 418,223
- Lexington School District 5103,759
- Marion School District 1028,664
- Marlboro County School District25,975
- McCormick County School District9,760
- Newberry County School District38,435
- Oconee County School District80,469
- Orangeburg County School District83,253
- Pickens County School District134,629
- Richland County School District 2 within Fort Jacksonsecondary12,064
- Richland School District 1203,161
- Richland School District 2157,395
- Saluda County School District14,586
- Spartanburg School District 135,746
- Spartanburg School District 275,019
- Spartanburg School District 316,676
- Spartanburg School District 420,108
- Spartanburg School District 559,524
- Spartanburg School District 674,744
- Spartanburg School District 755,249
- Sumter County Consolidated School District104,725
- Union County School District26,885
- Williamsburg County School District30,282
- York School District 134,947
- York School District 249,212
- York School District 3119,134
- York School District 490,380
Congressional districts
As drawn for the 119th Congress (2025–2027).
- Congressional District 1763,792
- Congressional District 2749,271
- Congressional District 3750,357
- Congressional District 4765,409
- Congressional District 5758,357
- Congressional District 6745,526
- Congressional District 7763,513
State senate districts
The upper chamber’s districts, as drawn in 2024.
- State Senate District 1111,833
- State Senate District 2120,161
- State Senate District 3123,246
- State Senate District 4111,652
- State Senate District 5116,492
- State Senate District 6114,359
- State Senate District 7112,969
- State Senate District 8119,367
- State Senate District 9119,592
- State Senate District 10115,708
- State Senate District 11122,552
- State Senate District 12125,046
- State Senate District 13119,537
- State Senate District 14112,014
- State Senate District 15118,670
- State Senate District 16128,155
- State Senate District 17115,823
- State Senate District 18115,232
- State Senate District 19110,011
- State Senate District 20108,506
- State Senate District 21109,496
- State Senate District 22113,553
- State Senate District 23122,821
- State Senate District 24115,632
- State Senate District 25115,563
- State Senate District 26108,093
- State Senate District 27119,904
- State Senate District 28114,462
- State Senate District 29110,708
- State Senate District 30111,538
- State Senate District 31105,345
- State Senate District 32105,511
- State Senate District 33124,662
- State Senate District 34128,675
- State Senate District 35120,201
- State Senate District 36104,134
- State Senate District 37110,726
- State Senate District 38111,400
- State Senate District 39116,983
- State Senate District 40105,742
- State Senate District 41109,072
- State Senate District 42112,728
- State Senate District 43120,661
- State Senate District 44111,075
- State Senate District 45108,287
- State Senate District 46118,328
State house districts
The lower chamber’s districts, as drawn in 2024.
- State House District 144,147
- State House District 240,859
- State House District 342,475
- State House District 444,447
- State House District 544,314
- State House District 644,767
- State House District 740,337
- State House District 841,388
- State House District 943,347
- State House District 1042,299
- State House District 1141,071
- State House District 1240,304
- State House District 1340,444
- State House District 1442,296
- State House District 1542,976
- State House District 1643,343
- State House District 1746,319
- State House District 1844,085
- State House District 1941,936
- State House District 2043,679
- State House District 2145,376
- State House District 2241,803
- State House District 2339,240
- State House District 2444,193
- State House District 2539,186
- State House District 2646,846
- State House District 2745,954
- State House District 2844,843
- State House District 2944,889
- State House District 3041,888
- State House District 3143,219
- State House District 3242,733
- State House District 3342,157
- State House District 3445,066
- State House District 3547,789
- State House District 3643,245
- State House District 3744,450
- State House District 3844,838
- State House District 3942,509
- State House District 4040,557
- State House District 4141,504
- State House District 4239,551
- State House District 4338,636
- State House District 4446,492
- State House District 4541,072
- State House District 4642,897
- State House District 4741,855
- State House District 4843,368
- State House District 4939,901
- State House District 5040,925
- State House District 5139,786
- State House District 5244,775
- State House District 5342,704
- State House District 5438,292
- State House District 5540,828
- State House District 5649,854
- State House District 5739,762
- State House District 5847,214
- State House District 5940,892
- State House District 6042,456
- State House District 6143,918
- State House District 6239,758
- State House District 6339,865
- State House District 6441,750
- State House District 6542,004
- State House District 6643,534
- State House District 6740,211
- State House District 6846,938
- State House District 6939,932
- State House District 7042,858
- State House District 7140,923
- State House District 7239,764
- State House District 7341,109
- State House District 7442,417
- State House District 7542,793
- State House District 7643,829
- State House District 7744,353
- State House District 7841,044
- State House District 7939,385
- State House District 8041,262
- State House District 8140,437
- State House District 8245,059
- State House District 8341,007
- State House District 8441,195
- State House District 8541,306
- State House District 8642,232
- State House District 8747,486
- State House District 8841,694
- State House District 8941,616
- State House District 9042,316
- State House District 9139,085
- State House District 9242,376
- State House District 9340,260
- State House District 9443,960
- State House District 9539,724
- State House District 9644,938
- State House District 9742,397
- State House District 9840,753
- State House District 9942,566
- State House District 10044,177
- State House District 10141,427
- State House District 10246,663
- State House District 10339,950
- State House District 10444,810
- State House District 10542,828
- State House District 10647,006
- State House District 10743,485
- State House District 10842,129
- State House District 10944,648
- State House District 11040,487
- State House District 11144,596
- State House District 11245,472
- State House District 11343,514
- State House District 11446,358
- State House District 11539,869
- State House District 11641,957
- State House District 11746,472
- State House District 11843,224
- State House District 11942,750
- State House District 12045,978
- State House District 12143,947
- State House District 12243,450
- State House District 12341,570
- State House District 12443,026
PUMAs
Public Use Microdata Areas: areas of 100,000 people or more that the state draws from census tracts, for the Census Bureau’s microdata.
- Abbeville & Anderson (South) Counties–Belton City PUMA104,928
- Aiken County–Aiken & North Augusta Cities PUMA174,160
- Allendale, Bamberg, Colleton, Hampton & Beaufort (East) Counties–Port Royal Cities PUMA157,996
- Anderson (Central & Northeast) County–Anderson City PUMA129,970
- Barnwell, Calhoun & Orangeburg Counties PUMA117,956
- Berkeley (North & East) County–Moncks Corner City PUMA116,687
- Berkeley (South) County–Goose Creek &portions of Charleston Cities PUMA130,115
- Charleston (North) County–North Charleston City PUMA155,650
- Charleston (Northeast) County–Mount Pleasant Town PUMA114,286
- Charleston (West) County–Kiawah Island & Charleston Cities PUMA150,193
- Chester, Fairfield & Lancaster Counties PUMA157,207
- Chesterfield, Darlington & Marlboro Counties PUMA132,317
- Clarendon, Georgetown & Williamsburg Counties PUMA126,079
- Dillon, Marion and Horry (North) Counties–Loris City PUMA109,612
- Dorchester County PUMA167,336
- Edgefield, Greenwood, McCormick & Saluda Counties PUMA125,844
- Florence County PUMA137,117
- Greenville (South & East)–Outside Greenville & Greer (South) Cities PUMA119,903
- Greenville County (Central East)–Greer City (South & West) PUMA111,207
- Greenville County (Central)–Greenville & Mauldin Cities PUMA104,764
- Greenville County (North)–Greer (North & West) & Travelers Rest Cities PUMA108,504
- Greenville County (South & West)–Outside Greenville City PUMA103,788
- Horry (Central and North) County–North Myrtle Beach City PUMA153,552
- Horry (Central and South) County–Myrtle Beach City PUMA176,378
- Jasper and Beaufort (West) Counties–Bluffton and Hilton Head Cities PUMA147,199
- Laurens, Newberry & Union Counties PUMA133,986
- Lee & Sumter Counties PUMA120,891
- Lexington (North and East) County–Irmo (West) & West Columbia Cities PUMA162,747
- Lexington (South & West) County and Cayce PUMA142,152
- Pickens (East, Central, North) & Oconee (Northeast) Counties–Easley PUMA110,621
- Pickens (Southwest Corner) & Oconee (West, Central) Counties–Seneca & Clemson Cities PUMA104,477
- Richland (Northeast and North Central) & Kershaw Counties PUMA140,253
- Richland County (Central)–Columbia City PUMA117,372
- Richland County (Northwest and North Central)–Irmo (East) and Blythewood Cities PUMA127,058
- Richland County (South & Central)–Forest Acres & Dentsville Cities PUMA105,748
- Spartanburg County (Central)–Spartanburg City PUMA112,193
- Spartanburg County (North)–Landrum City PUMA119,113
- Spartanburg County (West and South)–Greer & Woodruff Cities PUMA116,546
- Union and York (West) Counties–York City PUMA120,132
- York County (East & South)–Fort Mill Town PUMA108,110
- York County (North & East)–Fort Mill Town PUMA122,078
Urban areas
Each that reaches into South Carolina, with its whole population. Urban areas are the densely settled land the Census Bureau draws after each census, whatever the city lines.
- Abbeville, SC5,026
- Anderson–Clemson, SC120,726
- Augusta-Richmond County, GA–SC433,178
- Batesburg-Leesville, SC4,729
- Beaufort–Port Royal, SC54,147
- Belton, SC5,343
- Bennettsville, SC8,541
- Bluffton East–Hilton Head Island, SC70,062
- Bluffton West, SC34,955
- Camden–Lugoff, SC32,436
- Chapin, SC5,312
- Charleston, SC706,699
- Charlotte, NC–SC1.43M
- Cheraw, SC7,203
- Chester, SC9,141
- Clinton, SC9,201
- Clover, SC7,672
- Columbia, SC603,675
- Dillon, SC8,768
- Florence, SC91,381
- Gaffney, SC18,476
- Georgetown, SC11,860
- Greenville, SC400,109
- Greenwood, SC41,091
- Hartsville, SC13,388
- Inman, SC12,298
- Kingstree, SC5,043
- Lake City, SC6,711
- Lancaster, SC24,056
- Landrum–Tryon, SC–NC4,924
- Laurens, SC11,354
- Litchfield Beach, SC15,462
- Manning, SC4,503
- Marion, SC6,806
- Mauldin–Simpsonville, SC169,226
- Mullins, SC4,565
- Myrtle Beach–North Myrtle Beach, SC–NC324,794
- Newberry, SC12,113
- Orangeburg, SC29,513
- Pickens, SC5,475
- Rock Hill, SC230,684
- Seabrook Island, SC3,661
- Seneca, SC22,490
- Spartanburg, SC205,258
- Sumter, SC67,459
- Union, SC9,712
- Walhalla, SC6,604
- Walterboro, SC8,829
- Williamston, SC10,711
- Winnsboro, SC4,431
- York, SC9,237
Tribal areas
Each that reaches into South Carolina, with its whole population.
Turn South Carolina into your planning report.
Social Explorer Studio builds an editable profile of any place, with tables and charts beside the county and state, and exports to Word, PDF and Excel.
Questions about South Carolina
What is the population of South Carolina?
5,570,274 people, according to the ACS 2025 1-year estimates, which the Census Bureau adjusts to match its own population estimate. That’s the 23rd largest of the 50 states and DC.
What is the FIPS code for South Carolina?
45. Every county’s and place’s FIPS code in South Carolina starts with it. The Census Bureau’s full geographic identifier (GEOID) is 0400000US45.
What is the largest city in South Carolina?
Charleston, with 162,010 people. Other large places here include Columbia, North Charleston and Mount Pleasant.
What is the median household income in South Carolina?
$73,672 (±$1,216), according to the ACS 2025 1-year estimates, lower than the US ($84,780).
What is the median age in South Carolina?
41.3 years (±0.2), according to the ACS 2025 1-year estimates, higher than the US (39.5).
How much does housing cost in South Carolina?
South Carolina’s median home value is $306,200 (±$3,027) and its median gross rent is $1,395 (±$25) a month, according to the ACS 2025 1-year estimates. 47.6% (±1.7%) of its renters pay 30% or more of their income on rent.
Is South Carolina growing?
South Carolina’s population grew 13.8%, from 4,896,146 in 2015 to 5,570,274 in 2025, according to the ACS 1-year estimates.
Where do people who work in South Carolina live?
2,090,397 of its 2,213,437 jobs are held by people who live here. Of those who commute in, the most come from North Carolina, Georgia, Florida.
Where does this census data come from?
The U.S. Census Bureau’s American Community Survey, through Social Explorer’s tables: the latest 1-year estimates where they exist, for the most recent numbers, and 5-year estimates otherwise. Each table lists its code, so you can find it again.
Is this data free to use?
Yes. You can read it, cite it, download the CSV and embed the charts, with no account. To map other variables, compare your own areas or build a report, see Social Explorer’s plans in a live demo.
Sources and how to cite
American Community Survey 2025 1-year estimates, or 2020–2024 5-year estimates where noted, U.S. Census Bureau, from Social Explorer’s tables A00001, A00002, A01004, A04001, A06001, A08001, A09005, A10001, A10003, A10008, A10030, A10036, A10040, A10047, A10055, A10060, A12001, A13004, A14006, A14024, A14028, A16002, A17005, A18002, A18009, A20001, B02002, B09001, B13002, B18101, C16001. Maps by census tract use 2020–2024 5-year estimates, since the 1-year survey doesn’t cover tracts. Commuting: LEHD LODES 2023. These are estimates from a sample, each with its margin of error. Data retrieved November 14, 2026. How these profiles are made.
U.S. Census Bureau, American Community Survey 2025 1-year estimates, or 2020–2024 5-year estimates where noted, via Social Explorer. “South Carolina.” https://www.socialexplorer.com/places/south-carolina. Accessed November 14, 2026.