

Missouri: Population, demographics and census data
Home to 6,270,541 people, the 19th largest of the 50 states and DC, anchored by Kansas City. It grew 3.1% between 2015 and 2025.
- Population
- 6.27M. Census Bureau estimate · Rank 19 of the 50 states and DC
- Median household income
- $75,485 ±$937. US $84,780
- Median age
- 39.8 ±0.2. US 39.5
ACS 2025 1-year estimates, U.S. Census Bureau
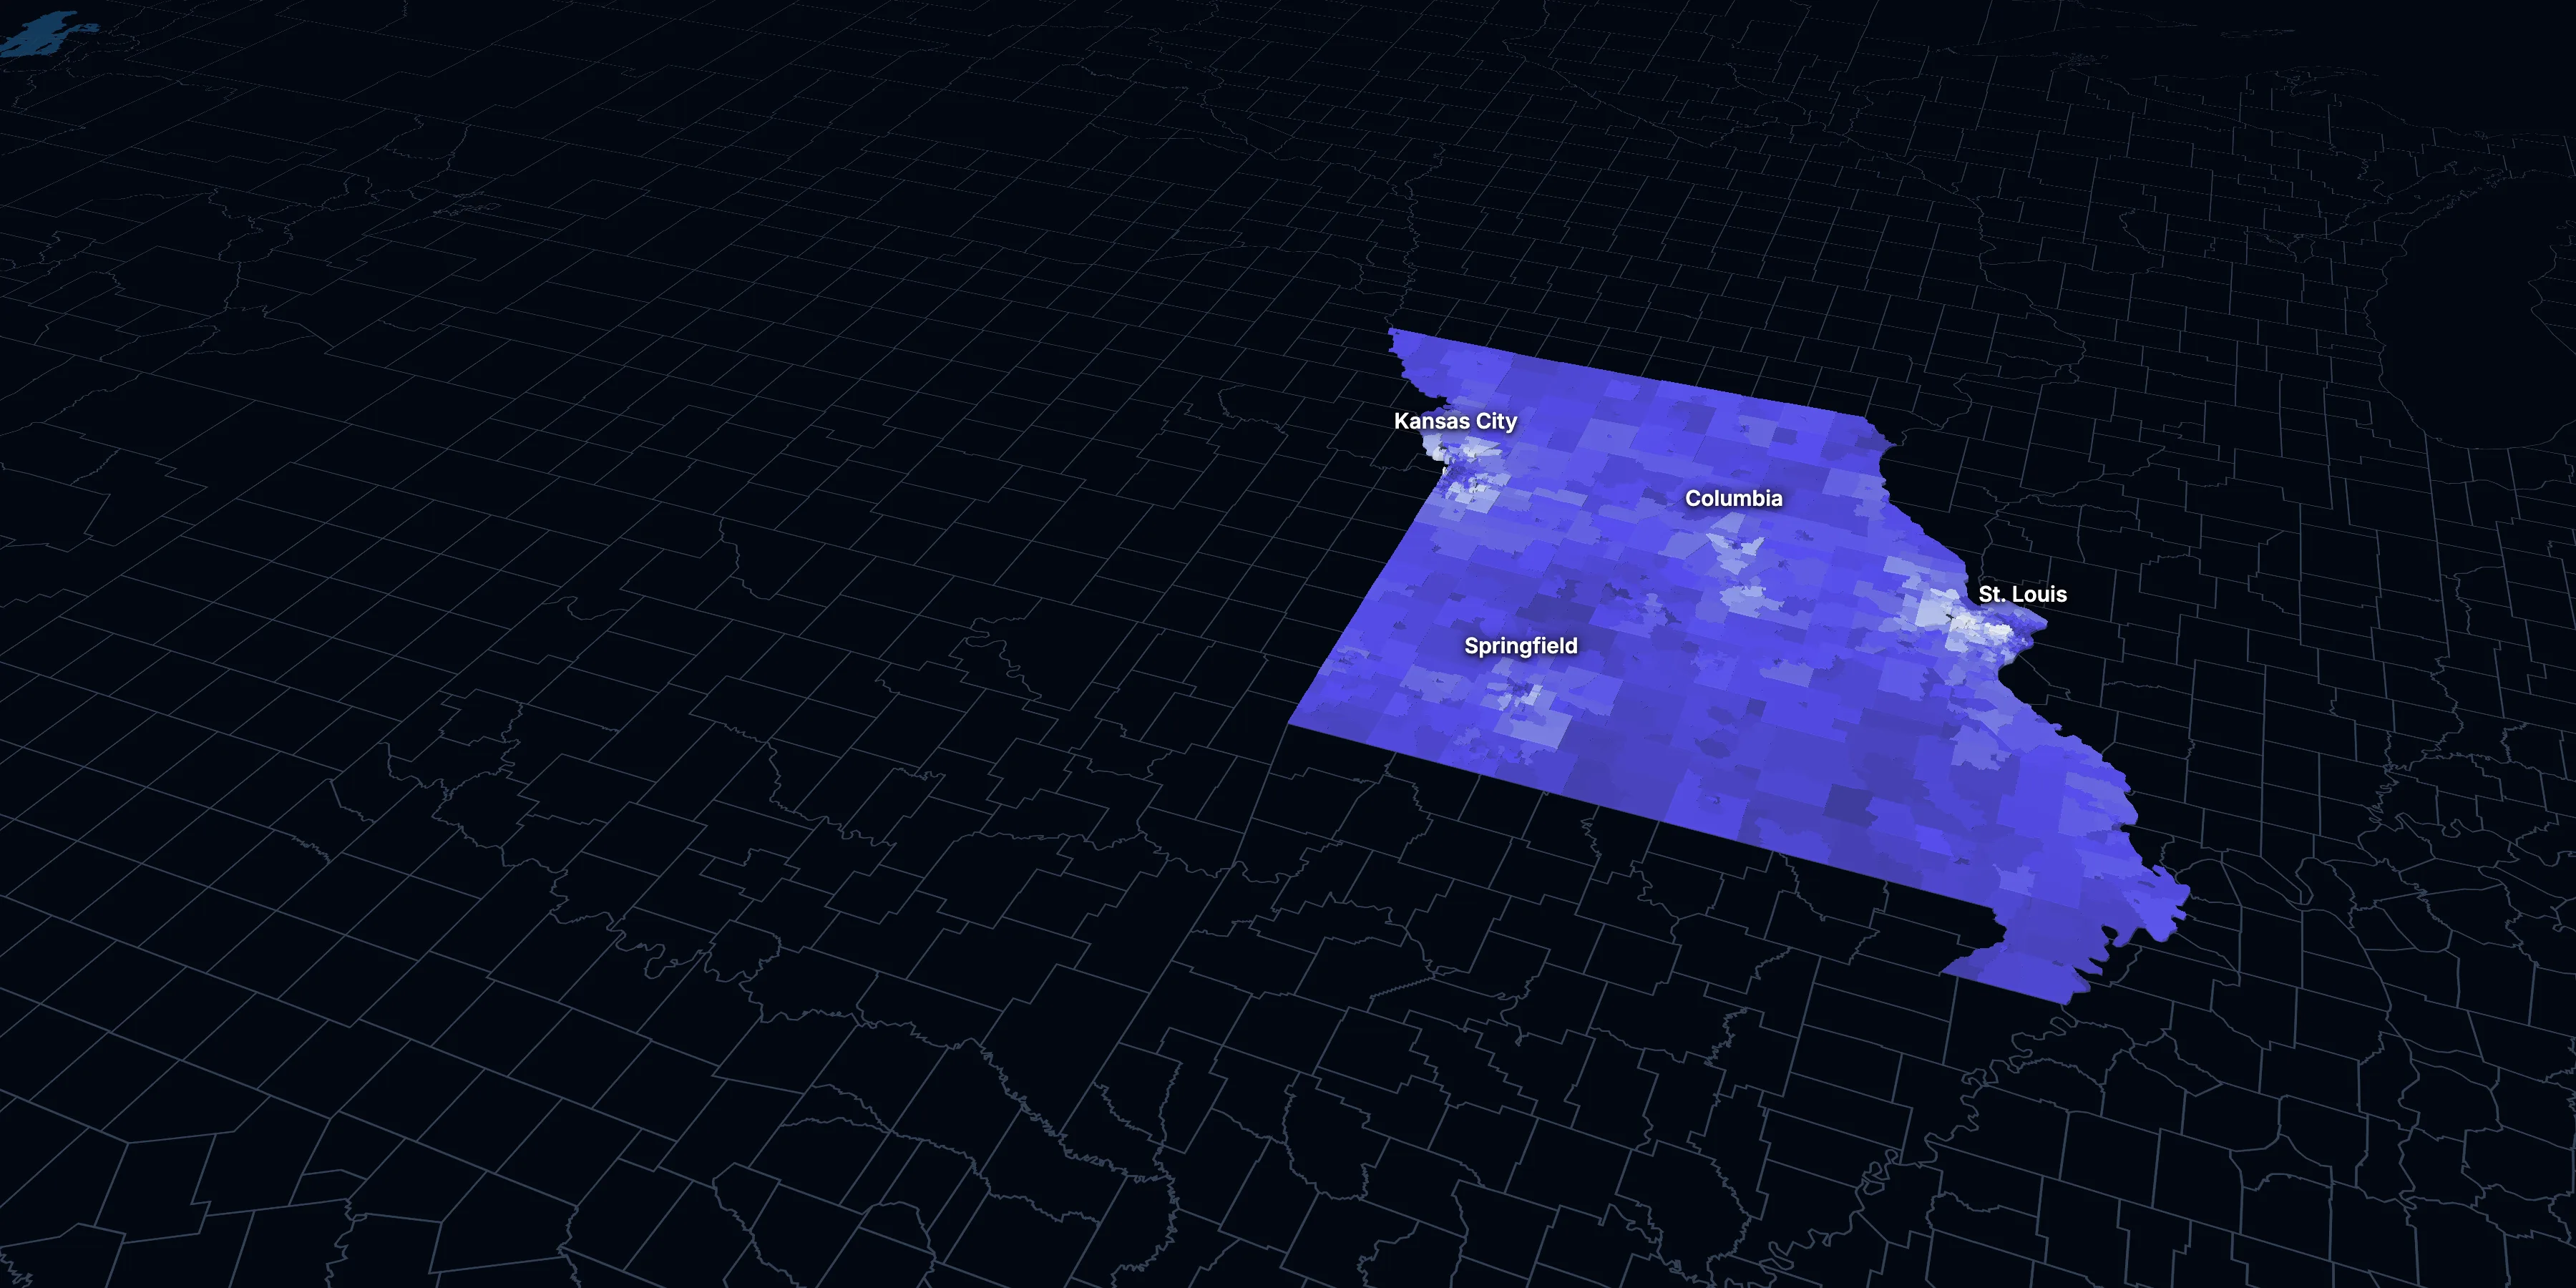
Taller, lighter tracts have higher household incomes
About Missouri
Missouri’s median household income is $75,485 (±$937), lower than the US ($84,780), and its median age is 39.8 (±0.2), according to the ACS 2025 1-year estimates. Its largest city is Kansas City.
± is each figure’s margin of error, at 90% confidence, and † marks one too uncertain to lean on. Under each percentage in the tables is the number it counts. How the margins are worked out.
FIPS code 29
Highlights
What stands out in Missouri
The numbers where Missouri sits furthest from the nation, or past a recognized policy benchmark.
Past a policy benchmark
25.3%
ElevatedHomes built before 1960
That’s higher than the US (24.0%). Older homes carry more lead-paint risk: the EPA found lead paint in 69% of homes built from 1940 to 1959.
Furthest from the national picture
6.9%
Very lowSpeak a language other than English at home
That’s lower than the US (22.9%). It’s the 7th lowest of the 50 states and DC.
4.7%
Very lowBorn outside the US
That’s lower than the US (14.7%).
$1,142
Lower than the USMedian gross rent
That’s lower than the US ($1,557).
2.34
Lower than the USPeople per household
That’s lower than the US (2.49).
32.0%
Lower than the USCommute 30 minutes or more
That’s lower than the US (39.2%).
2015 to 2025
How Missouri changed in ten years
The state added 186,869 people. It got older, more foreign-born and better educated, and poverty fell 3.3 points.
Population, change since 2015
+3.1% in the state and +6.3% in the US.
Source: ACS 1-year, 2015 to 2025, table A00001.
Show data
| Missouri | United States | |
|---|---|---|
| 2015 | 0.0% | 0.0% |
| 2016 | +0.2% | +0.5% |
| 2017 | +0.5% | +1.3% |
| 2018 | +0.7% | +1.8% |
| 2019 | +0.9% | +2.1% |
| 2021 | +1.4% | +3.3% |
| 2022 | +1.5% | +3.7% |
| 2023 | +1.8% | +4.2% |
| 2024 | +2.7% | +5.8% |
| 2025 | +3.1% | +6.3% |
Embed
Median household income, in 2025 dollars
+9.7% in the state and +10.9% in the US.
Source: ACS 1-year, 2015 to 2025, table A14006.
Show data
| Missouri | United States | |
|---|---|---|
| 2015 | $68,827 | $76,413 |
| 2016 | $69,990 | $77,931 |
| 2017 | $70,943 | $79,891 |
| 2018 | $70,418 | $80,059 |
| 2019 | $72,886 | $83,427 |
| 2021 | $74,092 | $83,521 |
| 2022 | $71,795 | $82,811 |
| 2023 | $72,923 | $82,683 |
| 2024 | $73,988 | $84,339 |
| 2025 | $75,485 | $84,780 |
Embed
Living in poverty
−3.3 points in the state and −3.0 points in the US.
Source: ACS 1-year, 2015 to 2025, table A13004.
Show data
| Missouri | United States | |
|---|---|---|
| 2015 | 14.8% | 14.7% |
| 2016 | 14.0% | 14.0% |
| 2017 | 13.4% | 13.4% |
| 2018 | 13.2% | 13.1% |
| 2019 | 12.9% | 12.3% |
| 2021 | 12.7% | 12.8% |
| 2022 | 13.2% | 12.6% |
| 2023 | 12.0% | 12.5% |
| 2024 | 12.3% | 12.1% |
| 2025 | 11.5% | 11.8% |
Embed
Bachelor’s degree or more
+5.8 points in the state and +6.7 points in the US.
Source: ACS 1-year, 2015 to 2025, table A12001.
Show data
| Missouri | United States | |
|---|---|---|
| 2015 | 27.8% | 30.6% |
| 2016 | 28.5% | 31.3% |
| 2017 | 29.1% | 32.0% |
| 2018 | 29.5% | 32.6% |
| 2019 | 30.2% | 33.1% |
| 2021 | 31.7% | 35.0% |
| 2022 | 32.2% | 35.7% |
| 2023 | 33.2% | 36.2% |
| 2024 | 33.5% | 36.8% |
| 2025 | 33.7% | 37.4% |
Embed
Median gross rent, in 2025 dollars
+9.3% in the state and +18.5% in the US.
Source: ACS 1-year, 2015 to 2025, table A18009.
Show data
| Missouri | United States | |
|---|---|---|
| 2015 | $1,045 | $1,314 |
| 2016 | $1,043 | $1,327 |
| 2017 | $1,059 | $1,340 |
| 2018 | $1,073 | $1,368 |
| 2019 | $1,059 | $1,393 |
| 2021 | $1,057 | $1,427 |
| 2022 | $1,057 | $1,440 |
| 2023 | $1,084 | $1,496 |
| 2024 | $1,103 | $1,537 |
| 2025 | $1,142 | $1,557 |
Embed
Median home value, in 2025 dollars
+34.0% in the state and +39.3% in the US.
Source: ACS 1-year, 2015 to 2025, table A10036.
Show data
| Missouri | United States | |
|---|---|---|
| 2015 | $202,489 | $266,469 |
| 2016 | $204,780 | $277,278 |
| 2017 | $207,486 | $288,124 |
| 2018 | $210,175 | $296,908 |
| 2019 | $213,291 | $305,336 |
| 2021 | $237,562 | $337,116 |
| 2022 | $245,037 | $355,481 |
| 2023 | $248,522 | $361,931 |
| 2024 | $262,926 | $372,685 |
| 2025 | $271,400 | $371,100 |
Embed
ACS 1-year estimates. The dotted stretch of each line spans 2020, when the Census Bureau released no standard 1-year estimates. Dollar values are in 2025 dollars.
| Indicator | 2015 | 2025 | Change |
|---|---|---|---|
| Population | 6,083,672 | 6,270,541 | +3.1% |
| Median age | 38.4 | 39.8 | +1.4 years |
| 65 and over | 15.6% | 19.7% | +4.0 points |
| Born outside the US | 4.0% | 4.7% | +0.7 points |
| Hispanic or Latino | 4.0% | 5.8% | +1.9 points |
| Median household income | $68,827 | $75,485 | +9.7% |
| Living in poverty | 14.8% | 11.5% | −3.3 points |
| Bachelor’s degree or more | 27.8% | 33.7% | +5.8 points |
| Households that rent | 33.9% | 30.9% | −2.9 points |
| Median gross rent | $1,045 | $1,142 | +9.3% |
| Median home value | $202,489 | $271,400 | +34.0% |
1654 census tracts
Missouri, tract by tract
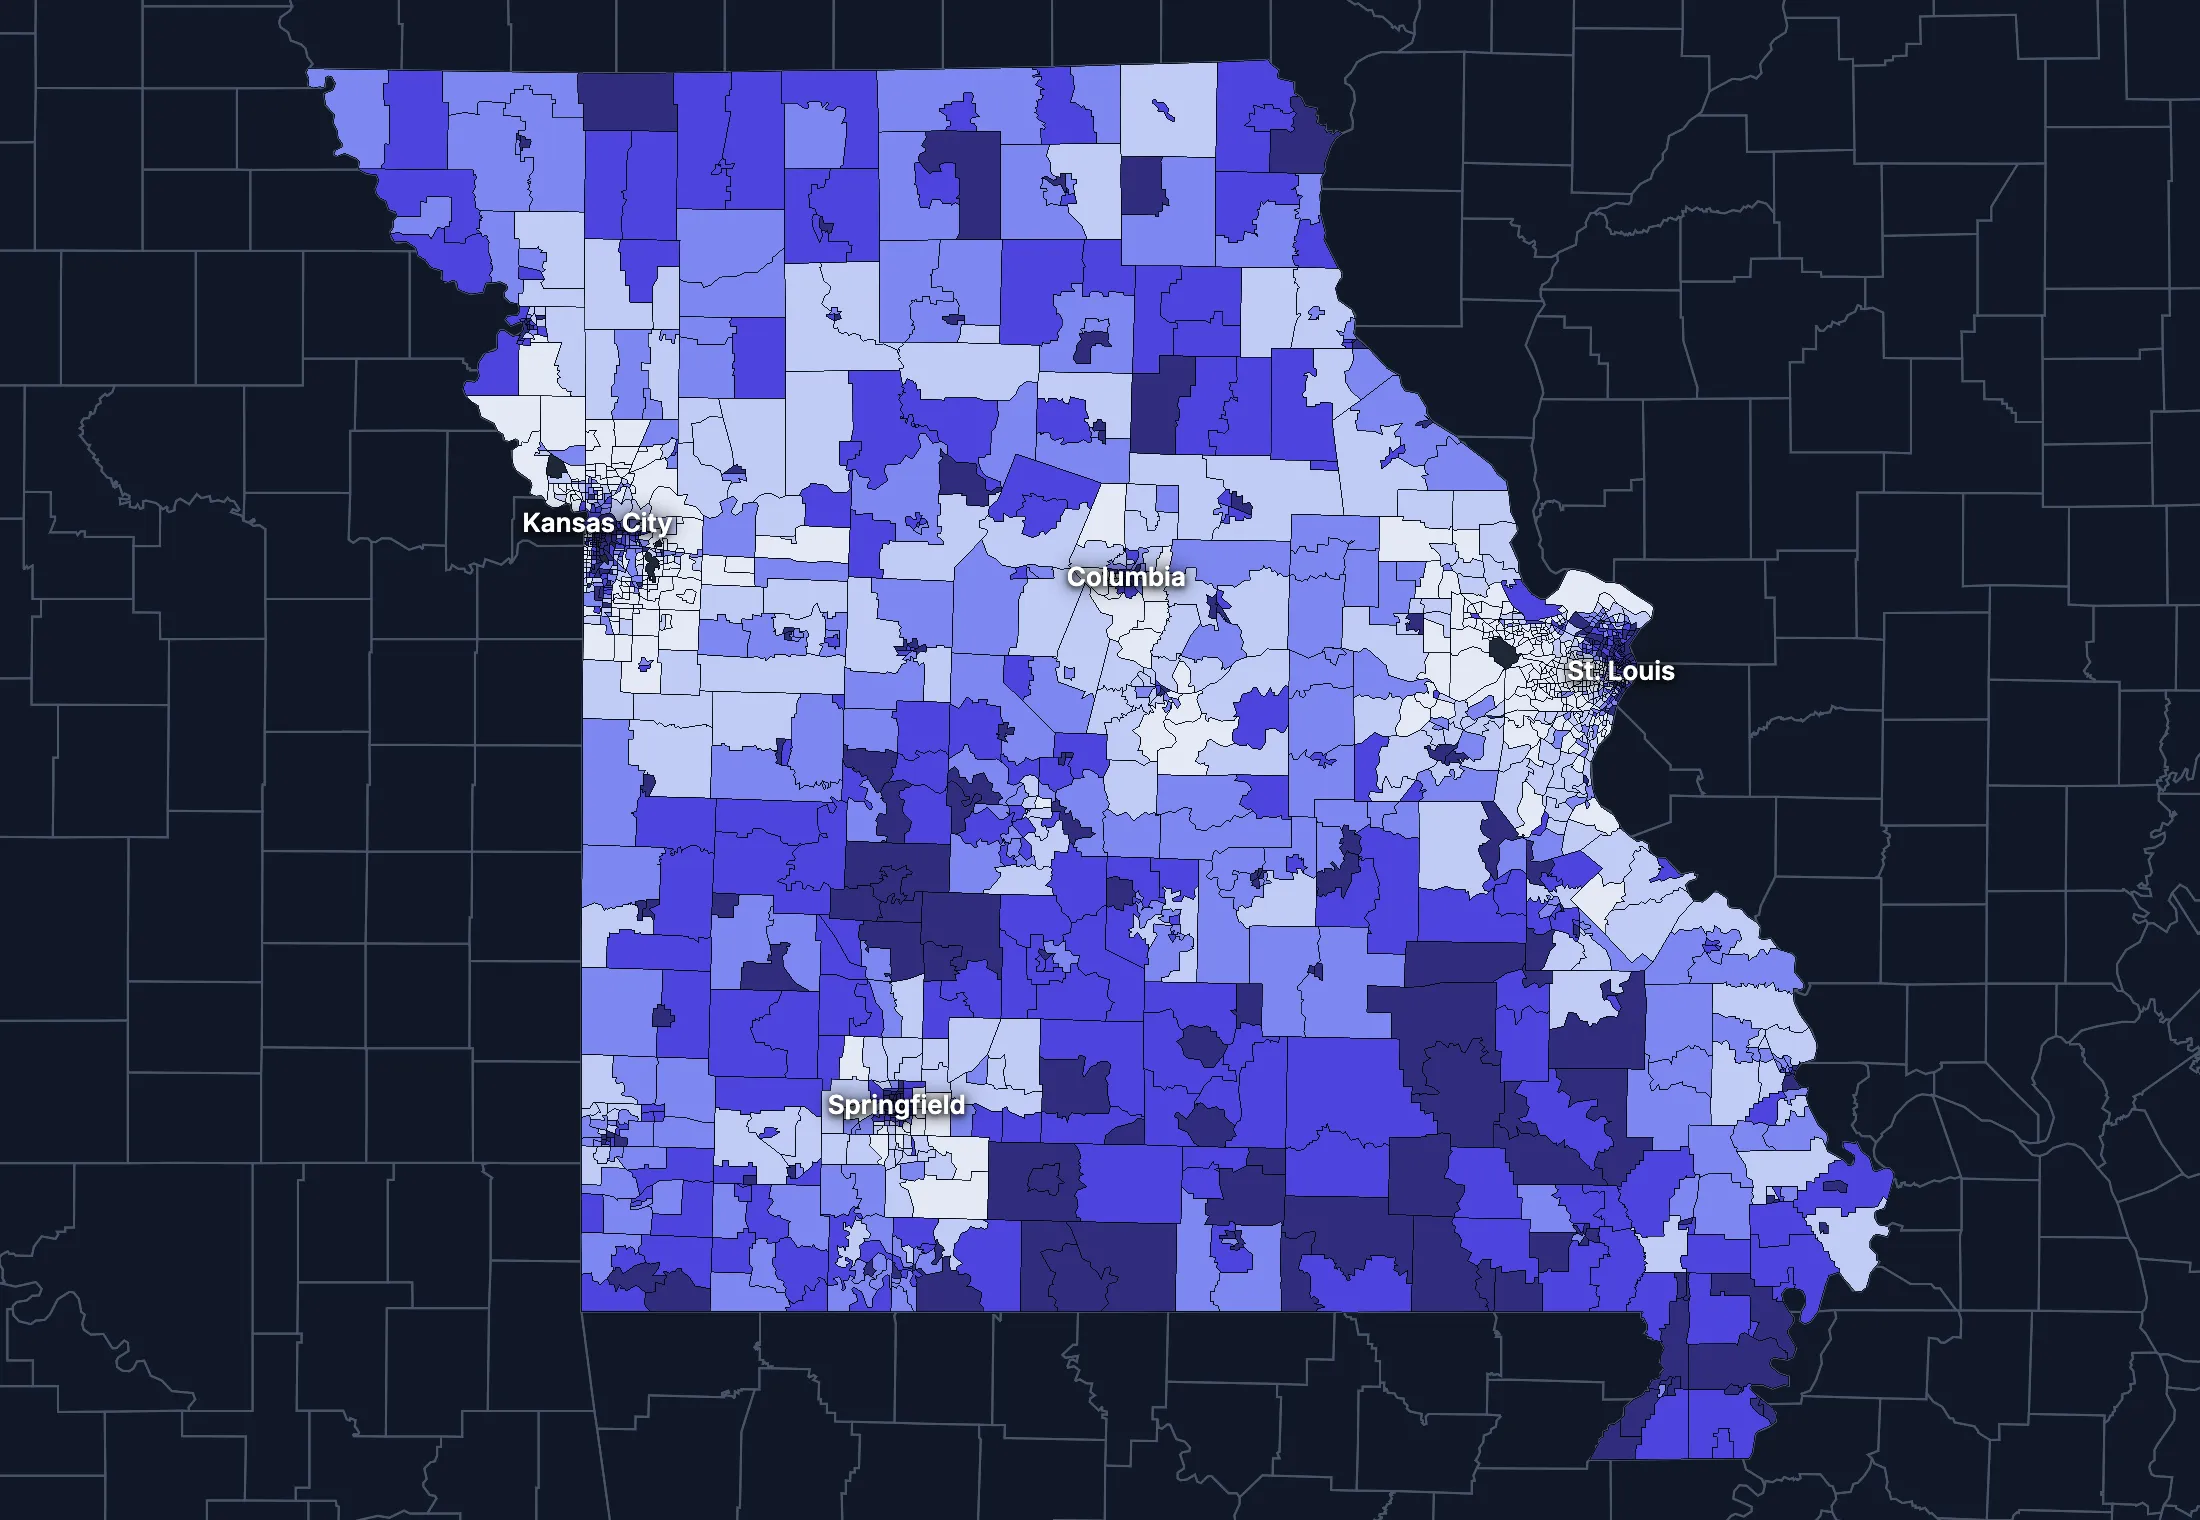
State averages hide a lot. These census tracts are the closest the census comes to neighborhoods.
Where the state’s average misleads
Each tick is one census tract, and the dark line marks the state. Hover over a tick or tap it to see the tract.
Poverty
399 of 1648 tracts are at least 1.5 times the state’s overall 12.6%, and 510 are at two-thirds of it or less.
Highest: Tract 5, 78.4%. Lowest: Tract 604.01, 0.0%.
Renters paying 30% or more of income
121 of 1602 tracts are at least 1.5 times the state’s overall 42.1%, and 444 are at two-thirds of it or less.
Highest: Tract 134.07, 100.0%. Lowest: Tract 9601.01, 0.0%.
Adults with a bachelor’s degree
281 of 1648 tracts are at least 1.5 times the state’s overall 32.4%, and 662 are at two-thirds of it or less.
Highest: Tract 2164.02, 95.6%. Lowest: Tract 154.01, 0.6%.
Median household income
253 of 1642 tracts are at least 1.5 times the typical tract’s $66,389, and 226 are at two-thirds of it or less.
Highest: Tract 2154, $250,000 or more. Lowest: Tract 154.02, $13,849.
American Community Survey 2020–2024 5-year estimates, by census tract. Income is capped at $250,000+ by the Census Bureau.
People
Who lives in Missouri
Its median age of 39.8 is higher than the US (39.5). 4.7% of residents were born outside the US, and 6.9% speak a language other than English at home.
Age
Source: ACS 2025 1-year, table A01001.
Show data
| Missouri | United States | |
|---|---|---|
| Under 18 | 21.6% ±0.2% , number 1,351,582 ±15,480 | 21.0% ±<0.1% , number 71,689,151 ±111,800 |
| 18 to 24 | 9.3% ±0.2% , number 585,921 ±12,020 | 9.3% ±<0.1% , number 31,716,680 ±98,660 |
| 25 to 34 | 12.9% ±0.1% , number 807,174 ±7,393 | 13.6% ±<0.1% , number 46,357,354 ±55,690 |
| 35 to 44 | 13.1% ±0.2% , number 819,805 ±13,440 | 13.4% ±<0.1% , number 45,746,189 ±105,700 |
| 45 to 54 | 11.4% ±0.1% , number 712,038 ±5,997 | 11.8% ±<0.1% , number 40,257,563 ±53,540 |
| 55 to 64 | 12.1% ±0.2% , number 761,711 ±13,360 | 12.1% ±<0.1% , number 41,242,904 ±104,700 |
| 65 to 74 | 11.3% ±0.2% , number 708,646 ±11,720 | 10.8% ±<0.1% , number 36,895,650 ±91,520 |
| 75 and over | 8.4% ±0.2% , number 523,664 ±9,608 | 8.2% ±<0.1% , number 27,879,368 ±78,140 |
Embed
Race and ethnicity
Source: ACS 2025 1-year, table A04001.
Show data
| Missouri | United States | |
|---|---|---|
| White, not Hispanic | 74.3% ±0.1% , number 4,658,511 ±6,767 | 55.0% ±<0.1% , number 187,959,031 ±58,340 |
| Hispanic or Latino | 5.8% ±<0.1% , number 365,304 ±2,844 | 20.5% ±<0.1% , number 69,975,516 ±13,270 |
| Black, not Hispanic | 10.7% ±0.1% , number 668,461 ±9,124 | 11.7% ±<0.1% , number 40,096,453 ±106,200 |
| Asian, not Hispanic | 2.3% ±0.1% , number 147,146 ±5,257 | 6.5% ±<0.1% , number 22,096,709 ±58,340 |
| Other or multiracial | 6.9% ±0.2% , number 431,119 ±13,350 | 6.3% ±<0.1% , number 21,657,150 ±150,100 |
Embed
Language spoken at home
Source: ACS 2025 1-year, table C16001.
Show data
| Missouri | United States | |
|---|---|---|
| English only | 93.1% ±0.3% , number 5,521,432 ±18,680 | 77.1% ±0.1% , number 249,390,588 ±275,300 |
| Spanish | 3.0% ±0.2% , number 180,153 ±10,820 | 13.9% ±0.1% , number 44,921,985 ±177,800 |
| Other Indo-European | 1.7% ±0.2% , number 100,369 ±9,516 | 4.0% ±<0.1% , number 12,862,980 ±113,500 |
| Asian and Pacific Island | 1.5% ±0.1% , number 87,220 ±7,782 | 3.8% ±<0.1% , number 12,288,841 ±99,740 |
| Arabic and other | 0.7% ±0.2% , number 42,146 ±9,031 | 1.3% ±<0.1% , number 4,116,949 ±71,480 |
Embed
Marital status
Source: ACS 2025 1-year, table A11001.
Show data
| Missouri | United States | |
|---|---|---|
| Now married | 49.1% ±0.5% , number 2,533,703 ±23,880 | 47.9% ±0.1% , number 135,567,564 ±223,300 |
| Never married | 31.8% ±0.3% , number 1,643,808 ±17,600 | 34.8% ±0.1% , number 98,647,238 ±152,600 |
| Divorced | 11.5% ±0.3% , number 595,141 ±15,590 | 10.2% ±<0.1% , number 28,879,967 ±112,900 |
| Widowed | 6.2% ±0.2% , number 319,438 ±8,314 | 5.5% ±<0.1% , number 15,599,094 ±69,430 |
| Separated | 1.4% ±0.1% , number 71,885 ±5,800 | 1.6% ±<0.1% , number 4,441,399 ±49,160 |
Embed
Where people lived a year ago
Source: ACS 2025 1-year, table A08001.
Show data
| Missouri | United States | |
|---|---|---|
| Same home | 88.0% ±0.4% , number 5,464,443 ±24,460 | 88.4% ±0.1% , number 298,889,697 ±214,800 |
| Same county | 5.9% ±0.3% , number 363,510 ±18,470 | 6.0% ±<0.1% , number 20,202,671 ±166,300 |
| Another county in the state | 3.7% ±0.2% , number 228,072 ±12,280 | 3.0% ±<0.1% , number 10,168,097 ±89,190 |
| Another state | 2.1% ±0.1% , number 131,995 ±9,181 | 2.1% ±<0.1% , number 7,025,589 ±81,660 |
| Another country | 0.3% ±0.1% , number 20,888 ±5,004 | 0.6% ±<0.1% , number 1,984,943 ±47,210 |
Embed
Top countries of birth, among those born abroad
Source: ACS 2025 1-year, table A07001.
Show data
| Missouri | |
|---|---|
| Mexico | 15.0% , number 44,217 |
| India | 9.0% , number 26,525 |
| Philippines | 6.0% , number 17,851 |
| Vietnam | 4.6% , number 13,498 |
| China, Excluding Hong Kong and Taiwan | 4.4% , number 12,956 |
| Korea | 2.6% , number 7,742 |
Embed
All the numbers
| Indicator | Missouri | US | Rank among states* | Table |
|---|---|---|---|---|
| Population | 6,270,541 | 341,784,859 | 19th | A00001 |
| People per square mile | 91 | 97 | 29th | A00002 |
| Land area (square miles) | 68,746 | – | – | A00002 |
| Median age | 39.8 ±0.2 | 39.5 ±0.1 | 27th | A01004 |
| Under 18 | 21.6% ±0.2% , number 1,351,582 ±15,480 | 21.0% ±<0.1% , number 71,689,151 ±111,800 | 19th | B02002 |
| 65 and over | 19.7% ±0.2% , number 1,232,310 ±15,160 | 19.0% ±<0.1% , number 64,775,018 ±120,300 | 23rd | B02002 |
| Born outside the US | 4.7% ±0.2% , number 295,406 ±13,290 | 14.7% ±0.1% , number 50,409,320 ±204,800 | 43rd | A06001 |
| Speak a language other than English at home | 6.9% ±0.3% , number 409,888 ±18,700 | 22.9% ±0.1% , number 74,190,755 ±244,000 | 45th | C16001 |
| Veterans (adults) | 6.8% ±0.2% , number 334,269 ±8,929 | 5.9% ±<0.1% , number 15,746,228 ±85,320 | 24th | A16002 |
| Living with a disability | 15.2% ±0.3% , number 939,995 ±15,730 | 13.7% ±<0.1% , number 46,271,455 ±126,000 | 12th | B18101 |
| Women 15–50 who had a baby in the past year | 5.3% ±0.4% , number 75,629 ±5,179 | 5.0% ±0.1% , number 4,016,759 ±44,040 | 21st | B13002 |
| Lived in the same home a year ago | 88.0% ±0.4% , number 5,464,443 ±24,460 | 88.4% ±0.1% , number 298,889,697 ±214,800 | 25th | A08001 |
| White, not Hispanic | 74.3% ±0.1% , number 4,658,511 ±6,767 | 55.0% ±<0.1% , number 187,959,031 ±58,340 | 13th | A04001 |
| Hispanic or Latino | 5.8% ±<0.1% , number 365,304 ±2,844 | 20.5% ±<0.1% , number 69,975,516 ±13,270 | 41st | A04001 |
| Black, not Hispanic | 10.7% ±0.1% , number 668,461 ±9,124 | 11.7% ±<0.1% , number 40,096,453 ±106,200 | 20th | A04001 |
| Asian, not Hispanic | 2.3% ±0.1% , number 147,146 ±5,257 | 6.5% ±<0.1% , number 22,096,709 ±58,340 | 35th | A04001 |
*1 is the highest. Population is ranked among all states, and the rest among those of 1,000 people or more, whose figures can be ranked. Ranks use 5-year estimates, the only ones covering every state, so they can differ slightly from the figures here.
Income and work
Lower incomes than the US
The median household income is $75,485, lower than the US ($84,780). 11.5% of people live in poverty, and 7.9% have no health insurance, lower than the US (8.4%).
Household income
Source: ACS 2025 1-year, table A14001.
Show data
| Missouri | United States | |
|---|---|---|
| Under $25,000 | 14.7% ±0.5% , number 383,692 ±12,130 | 14.0% ±0.1% , number 18,727,548 ±88,990 |
| $25,000 to $49,999 | 18.0% ±0.5% , number 468,439 ±14,060 | 15.4% ±0.1% , number 20,665,585 ±101,400 |
| $50,000 to $74,999 | 17.0% ±0.5% , number 442,400 ±12,180 | 15.3% ±0.1% , number 20,513,565 ±88,500 |
| $75,000 to $99,999 | 13.7% ±0.4% , number 357,385 ±10,400 | 12.5% ±0.1% , number 16,814,245 ±87,520 |
| $100,000 to $149,999 | 17.5% ±0.4% , number 455,944 ±11,350 | 17.9% ±0.1% , number 24,018,984 ±99,670 |
| $150,000 to $199,999 | 8.8% ±0.3% , number 228,885 ±7,225 | 10.1% ±0.1% , number 13,521,827 ±70,660 |
| $200,000 or more | 10.3% ±0.3% , number 267,874 ±9,040 | 14.8% ±0.1% , number 19,801,668 ±84,120 |
Embed
What residents do for work
Source: ACS 2025 1-year, table A17004.
Show data
| Missouri | United States | |
|---|---|---|
| Education and health care | 24.7% ±0.4% , number 757,437 ±14,090 | 24.4% ±0.1% , number 40,862,193 ±140,800 |
| Manufacturing | 11.3% ±0.4% , number 348,352 ±13,050 | 9.6% ±0.1% , number 16,064,394 ±91,270 |
| Retail trade | 11.1% ±0.4% , number 340,211 ±11,230 | 10.6% ±0.1% , number 17,781,181 ±96,660 |
| Professional and business services | 10.4% ±0.3% , number 319,445 ±10,290 | 12.8% ±0.1% , number 21,375,231 ±87,110 |
| Arts, food and lodging | 8.4% ±0.3% , number 257,707 ±8,735 | 8.9% ±0.1% , number 14,811,502 ±87,840 |
| Construction | 7.1% ±0.3% , number 219,171 ±8,957 | 6.7% ±<0.1% , number 11,254,981 ±79,620 |
| Finance, insurance and real estate | 7.1% ±0.3% , number 217,726 ±8,678 | 6.6% ±<0.1% , number 11,025,569 ±68,570 |
| Transportation and warehousing | 5.4% ±0.3% , number 165,743 ±9,179 | 5.9% ±<0.1% , number 9,832,211 ±73,020 |
Embed
Where workers come from and go
Missouri has 2,863,992 jobs and 2,835,149 employed residents. 244,670 people commute in to work and 215,827 commute out, while 2,619,322 both live and work here. The most commuters come from Kansas.
Most commuters come from
- Kansas: 101,361
- Illinois: 99,437
- Arkansas: 11,789
Most residents commute to
- Kansas: 128,316
- Illinois: 33,990
- Arkansas: 17,630
Show data
| Missouri | |
|---|---|
| Live and work here | 2,619,322 |
| Work here, live elsewhere | 244,670 |
| Live here, work elsewhere | 215,827 |
Embed
All the numbers
| Indicator | Missouri | US | Rank among states* | Table |
|---|---|---|---|---|
| Median household income | $75,485 ±$937 | $84,780 ±$215 | 41st | A14006 |
| Income per person | $42,815 ±$528 | $47,171 ±$115 | 39th | A14024 |
| Income inequality (Gini index) | 0.467 ±0.006 | 0.482 ±0.001 | 27th | A14028 |
| Living in poverty | 11.5% ±0.4% , number 703,944 ±21,920 | 11.8% ±0.1% , number 39,264,183 ±277,400 | 18th | A13004 |
| Unemployment rate | 3.6% ±0.2% , number 115,034 ±7,439 | 4.9% ±<0.1% , number 8,574,594 ±64,350 | 38th | A17005 |
| No health insurance | 7.9% ±0.3% , number 488,103 ±16,200 | 8.4% ±<0.1% , number 28,323,306 ±152,000 | 19th | A20001 |
*1 is the highest. Population is ranked among all states, and the rest among those of 1,000 people or more, whose figures can be ranked. Ranks use 5-year estimates, the only ones covering every state, so they can differ slightly from the figures here.
Education
Fewer college degrees than the US
33.7% of adults 25 and over have a bachelor’s degree or more, lower than the US (37.4%).
Highest level of education
Source: ACS 2025 1-year, table A12001.
Show data
| Missouri | United States | |
|---|---|---|
| Less than high school | 7.6% ±0.2% , number 330,044 ±10,280 | 9.4% ±0.1% , number 22,321,002 ±120,500 |
| High school only | 29.3% ±0.4% , number 1,269,486 ±19,110 | 25.6% ±0.1% , number 61,096,726 ±203,400 |
| Some college | 29.4% ±0.5% , number 1,273,853 ±20,010 | 27.7% ±0.1% , number 65,920,977 ±173,500 |
| Bachelor’s degree | 20.3% ±0.4% , number 878,791 ±15,650 | 22.3% ±0.1% , number 53,224,312 ±196,700 |
| Graduate degree | 13.4% ±0.3% , number 580,864 ±13,750 | 15.0% ±0.1% , number 35,816,011 ±159,400 |
Embed
All the numbers
| Indicator | Missouri | US | Rank among states* | Table |
|---|---|---|---|---|
| Bachelor’s degree or more | 33.7% ±0.5% , number 1,459,655 ±20,830 | 37.4% ±0.1% , number 89,040,323 ±253,200 | 33rd | A12001 |
| High school graduate or more | 92.4% ±0.8% , number 4,002,994 ±34,630 | 90.6% ±0.2% , number 216,058,026 ±368,200 | 22nd | A12001 |
*1 is the highest. Population is ranked among all states, and the rest among those of 1,000 people or more, whose figures can be ranked. Ranks use 5-year estimates, the only ones covering every state, so they can differ slightly from the figures here.
Housing
Home values outran incomes
30.9% of households rent, lower than the US (34.7%). The median home is worth $271,400 and the median rent is $1,142. After inflation, home values rose 34% from 2015 to 2025, while household income rose 10%.
Housing costs and income, 2015 to 2025, after inflation
Source: ACS 1-year, table A10036, A18009, A14006.
Show data
| Missouri | United States | |
|---|---|---|
| Median home value | +34.0% | +39.3% |
| Median rent | +9.3% | +18.5% |
| Median household income | +9.7% | +10.9% |
Embed
Types of homes
Source: ACS 2025 1-year, table A10032.
Show data
| Missouri | United States | |
|---|---|---|
| Single-family, detached | 70.6% ±0.6% , number 2,031,884 ±17,370 | 60.9% ±0.1% , number 90,335,844 ±173,300 |
| Single-family, attached | 4.1% ±0.2% , number 118,915 ±6,912 | 6.4% ±<0.1% , number 9,527,703 ±51,230 |
| 2 to 4 units | 7.2% ±0.4% , number 206,957 ±10,210 | 7.5% ±0.1% , number 11,109,005 ±75,790 |
| 5 to 19 units | 7.2% ±0.3% , number 205,780 ±9,746 | 8.7% ±0.1% , number 12,829,882 ±97,590 |
| 20 or more units | 6.0% ±0.3% , number 172,288 ±9,373 | 11.1% ±0.1% , number 16,381,450 ±92,310 |
| Mobile homes and other | 4.9% ±0.2% , number 140,323 ±6,969 | 5.4% ±<0.1% , number 8,045,083 ±53,680 |
Embed
When homes were built
Source: ACS 2025 1-year, table A10055.
Show data
| Missouri | United States | |
|---|---|---|
| 2010 or later | 13.2% ±0.4% , number 342,534 ±11,140 | 15.1% ±0.1% , number 20,257,912 ±101,300 |
| 2000 to 2009 | 13.0% ±0.4% , number 339,816 ±10,020 | 13.8% ±0.1% , number 18,535,840 ±92,260 |
| 1980 to 1999 | 24.1% ±0.5% , number 627,741 ±14,150 | 24.1% ±0.1% , number 32,332,570 ±118,900 |
| 1960 to 1979 | 24.4% ±0.5% , number 636,221 ±14,170 | 22.9% ±0.1% , number 30,726,302 ±110,000 |
| Before 1960 | 25.3% ±0.6% , number 658,307 ±15,210 | 24.0% ±0.1% , number 32,210,798 ±121,500 |
Embed
All the numbers
| Indicator | Missouri | US | Rank among states* | Table |
|---|---|---|---|---|
| Housing units | 2,876,147 | – | – | A10001 |
| Households | 2,604,619 ±11,990 | – | – | A10008 |
| People per household | 2.34 ±0.01 | 2.49 ±0.01 | 38th | A10003 |
| Households that rent | 30.9% ±0.5% , number 805,660 ±14,590 | 34.7% ±0.1% , number 46,551,688 ±193,200 | 31st | A10060 |
| Vacant homes | 9.4% ±0.4% , number 271,528 ±12,080 | 9.6% ±0.1% , number 14,165,545 ±137,100 | 21st | A10047, A10060 |
| Median gross rent | $1,142 ±$15 | $1,557 ±$4 | 41st | A18009 |
| Median home value | $271,400 ±$2,495 | $371,100 ±$646 | 40th | A10036 |
| Renters paying 30% or more of income | 41.9% ±1.4% , number 337,710 ±12,890 | 48.3% ±0.2% , number 22,486,693 ±122,100 | 38th | A18002 |
| Owners paying 30% or more of income | 19.4% ±0.6% , number 349,115 ±11,030 | 24.2% ±0.1% , number 21,201,943 ±93,050 | 42nd | A10040 |
| Homes built before 1960 | 25.3% ±0.6% , number 658,307 ±15,210 | 24.0% ±0.1% , number 32,210,798 ±121,500 | 22nd | A10055 |
*1 is the highest. Population is ranked among all states, and the rest among those of 1,000 people or more, whose figures can be ranked. Ranks use 5-year estimates, the only ones covering every state, so they can differ slightly from the figures here.
Getting around
A driving state with short commutes
75.3% of workers drive alone and 11.5% work from home. 32.0% of those who travel to work spend 30 minutes or more getting there, and 7.1% of households have no vehicle.
How people get to work
Source: ACS 2025 1-year, table A09005.
Show data
| Missouri | United States | |
|---|---|---|
| Drive alone | 75.3% ±0.6% , number 2,287,211 ±21,550 | 69.8% ±0.1% , number 115,297,377 ±192,900 |
| Carpool | 8.8% ±0.4% , number 268,748 ±11,530 | 8.9% ±0.1% , number 14,712,170 ±97,240 |
| Public transit | 1.1% ±0.2% , number 34,287 ±4,771 | 4.3% ±<0.1% , number 7,100,386 ±63,330 |
| Walk | 2.0% ±0.2% , number 61,890 ±5,335 | 2.4% ±<0.1% , number 4,016,469 ±41,070 |
| Work from home | 11.5% ±0.3% , number 348,794 ±10,590 | 12.9% ±0.1% , number 21,288,393 ±105,700 |
| Other | 1.2% ±0.1% , number 37,065 ±4,313 | 1.7% ±<0.1% , number 2,799,658 ±41,510 |
Embed
Time spent getting to work
Source: ACS 2025 1-year, table B09001.
Show data
| Missouri | United States | |
|---|---|---|
| Under 10 minutes | 14.8% ±0.4% , number 397,941 ±10,360 | 12.0% ±0.1% , number 17,199,225 ±93,440 |
| 10 to 19 minutes | 29.8% ±0.7% , number 802,026 ±19,530 | 27.8% ±0.1% , number 40,059,540 ±137,700 |
| 20 to 29 minutes | 23.4% ±0.5% , number 629,696 ±15,590 | 21.0% ±0.1% , number 30,221,743 ±111,100 |
| 30 to 39 minutes | 16.1% ±0.4% , number 433,453 ±12,560 | 17.1% ±0.1% , number 24,659,138 ±103,800 |
| 40 to 59 minutes | 10.0% ±0.4% , number 269,489 ±10,620 | 12.6% ±0.1% , number 18,104,709 ±97,070 |
| 60 minutes or more | 5.8% ±0.3% , number 156,596 ±7,501 | 9.5% ±0.1% , number 13,681,705 ±84,440 |
Embed
Vehicles per household
Source: ACS 2025 1-year, table A10030.
Show data
| Missouri | United States | |
|---|---|---|
| None | 7.1% ±0.3% , number 184,276 ±9,041 | 8.8% ±0.1% , number 11,781,997 ±77,240 |
| One | 32.6% ±0.6% , number 847,890 ±15,670 | 33.1% ±0.1% , number 44,424,682 ±160,700 |
| Two | 36.6% ±0.6% , number 952,637 ±16,270 | 36.0% ±0.1% , number 48,200,889 ±176,800 |
| Three or more | 23.8% ±0.5% , number 619,816 ±14,200 | 22.1% ±0.1% , number 29,655,854 ±113,300 |
Embed
All the numbers
| Indicator | Missouri | US | Rank among states* | Table |
|---|---|---|---|---|
| Drive to work alone | 75.3% ±0.6% , number 2,287,211 ±21,550 | 69.8% ±0.1% , number 115,297,377 ±192,900 | 17th | A09005 |
| Take public transit | 1.1% ±0.2% , number 34,287 ±4,771 | 4.3% ±<0.1% , number 7,100,386 ±63,330 | 29th | A09005 |
| Work from home | 11.5% ±0.3% , number 348,794 ±10,590 | 12.9% ±0.1% , number 21,288,393 ±105,700 | 28th | A09005 |
| Commute 30 minutes or more | 32.0% ±0.6% , number 859,538 ±18,080 | 39.2% ±0.1% , number 56,445,552 ±165,300 | 33rd | B09001 |
| Households with no vehicle | 7.1% ±0.3% , number 184,276 ±9,058 | 8.8% ±<0.1% , number 11,781,997 ±64,240 | 23rd | A10030 |
*1 is the highest. Population is ranked among all states, and the rest among those of 1,000 people or more, whose figures can be ranked. Ranks use 5-year estimates, the only ones covering every state, so they can differ slightly from the figures here.
Places
The largest cities in Missouri
Population, from the latest estimates available. Figures cover the whole of each place.
Largest cities
- Kansas City: 521,203
- St. Louis: 278,144
- Springfield: 169,859
- Columbia: 130,855
- Independence: 121,675
- Lee's Summit: 108,288
- O'Fallon: 96,086
- St. Charles: 72,573
Every county and place in Missouri
Find any county, city, town, metro area, ZIP code, school district or district in Missouri.
Counties and equivalents
Each of the 115 counties and equivalents with its population, from ACS 2020–2024 5-year estimates.
- Adair County25,301
- Andrew County18,065
- Atchison County5,187
- Audrain County24,548
- Barry County35,033
- Barton County11,690
- Bates County16,186
- Benton County20,151
- Bollinger County10,559
- Boone County188,043
- Buchanan County83,568
- Butler County42,020
- Caldwell County8,927
- Callaway County44,741
- Camden County43,667
- Cape Girardeau County82,735
- Carroll County8,411
- Carter County5,297
- Cass County110,773
- Cedar County14,615
- Chariton County7,390
- Christian County92,915
- Clark County6,675
- Clay County258,122
- Clinton County21,414
- Cole County77,032
- Cooper County16,824
- Crawford County22,797
- Dade County7,641
- Dallas County17,551
- Daviess County8,477
- DeKalb County10,876
- Dent County14,539
- Douglas County11,965
- Dunklin County27,493
- Franklin County105,950
- Gasconade County14,746
- Gentry County6,245
- Greene County303,375
- Grundy County9,787
- Harrison County8,190
- Henry County22,328
- Hickory County8,585
- Holt County4,240
- Howard County10,147
- Howell County40,383
- Iron County9,446
- Jackson County719,976
- Jasper County124,357
- Jefferson County229,458
- Johnson County54,732
- Knox County3,756
- Laclede County36,390
- Lafayette County33,115
- Lawrence County38,593
- Lewis County9,924
- Lincoln County63,057
- Linn County11,852
- Livingston County14,364
- Macon County15,163
- Madison County12,729
- Maries County8,450
- Marion County28,457
- McDonald County23,701
- Mercer County3,482
- Miller County25,269
- Mississippi County11,902
- Moniteau County15,262
- Monroe County8,734
- Montgomery County11,426
- Morgan County21,717
- New Madrid County15,731
- Newton County60,118
- Nodaway County20,774
- Oregon County8,673
- Osage County13,402
- Ozark County8,873
- Pemiscot County14,958
- Perry County18,976
- Pettis County43,397
- Phelps County45,194
- Pike County17,711
- Platte County110,371
- Polk County32,444
- Pulaski County53,894
- Putnam County4,642
- Ralls County10,428
- Randolph County24,365
- Ray County23,145
- Reynolds County6,010
- Ripley County10,708
- Saline County23,231
- Schuyler County4,038
- Scotland County4,686
- Scott County37,933
- Shannon County7,177
- Shelby County5,986
- St. Charles County414,535
- St. Clair County9,587
- St. Francois County66,999
- St. Louis city288,512
- St. Louis County995,569
- Ste. Genevieve County18,571
- Stoddard County28,470
- Stone County32,048
- Sullivan County5,857
- Taney County56,529
- Texas County25,161
- Vernon County19,687
- Warren County37,177
- Washington County23,470
- Wayne County10,862
- Webster County40,500
- Worth County1,934
- Wright County18,965
Cities, towns and other places
Each of the 1,062 with its population, from ACS 2020–2024 5-year estimates. Census-designated places are communities without a local government of their own, drawn by the Census Bureau so they can be counted.
- Adrian1,857
- Advance1,450
- Affton19,052
- Agency871
- Airport Drive941
- Alba624
- Albany1,909
- Aldrich65
- Alexandria103
- Allendale46
- Allenville127
- Alma450
- Altamont147
- Altenburg426
- Alton744
- Amazonia286
- Amity72
- Amoret120
- Amsterdam128
- Anderson2,685
- Annada74
- Annapolis427
- Anniston241
- Appleton City1,221
- Arbela22
- Arbyrd432
- Arcadia586
- Archie1,322
- Arcola34
- Argyle117
- Arkoe76
- Armstrong416
- Arnold20,956
- Arrow Point81
- Arrow Rock65
- Asbury459
- Ash Grove1,333
- Ashland4,914
- Ashley34
- Atlanta499
- Augusta285
- Aullville109
- Aurora7,397
- Aurora Springs230
- Auxvasse1,452
- Ava3,045
- Avalon47
- Avilla70
- Avondale308
- Bagnell44
- Bakersfield188
- Baldwin Park52
- Ballwin31,279
- Baring40
- Barnard186
- Barnett129
- Barnhart5,785
- Bates City162
- Battlefield6,165
- Bel-Nor1,556
- Bel-Ridge2,432
- Bell City496
- Bella Villa691
- Belle1,246
- Bellefontaine Neighbors10,498
- Bellerive Acres288
- Bellflower238
- Belton25,008
- Bennett Springs135
- Bent Tree Harbor391
- Benton826
- Benton City88
- Berger169
- Berkeley8,123
- Bernie1,725
- Bertrand732
- Bethany3,080
- Bethel126
- Beverly Hills488
- Bevier657
- Biehle9
- Big Lake82
- Big Spring140
- Billings844
- Birch Tree402
- Birmingham189
- Bismarck1,508
- Black Jack6,589
- Blackburn240
- Blackwater207
- Blairstown65
- Blanchard51
- Bland476
- Blodgett196
- Bloomfield2,069
- Bloomsdale841
- Blue Eye446
- Blue Springs59,965
- Blue Summit1,156
- Blythedale341
- Bogard169
- Bolckow197
- Bolivar11,170
- Bonne Terre6,683
- Boonville7,689
- Bosworth202
- Bourbon1,636
- Bowling Green4,170
- Bragg City54
- Brandsville139
- Branson12,817
- Branson West536
- Brashear182
- Braymer795
- Breckenridge485
- Breckenridge Hills4,402
- Brentwood8,144
- Brewer413
- Briarwood Estates307
- Bridgeton11,369
- Brimson81
- Bronaugh163
- Brookfield4,144
- Brooklyn Heights106
- Broseley65
- Browning224
- Brownington58
- Brumley72
- Brunswick859
- Bucklin418
- Buckner2,914
- Buffalo3,417
- Bull Creek421
- Bunceton256
- Bunker336
- Burfordville147
- Burgess24
- Burlington Junction397
- Butler4,668
- Butterfield370
- Byrnes Mill3,189
- Cabool2,348
- Cainsville212
- Cairo245
- Caledonia209
- Calhoun374
- California4,509
- Callao263
- Calverton Park1,546
- Camden135
- Camden Point401
- Camdenton4,023
- Cameron8,519
- Campbell1,766
- Canalou177
- Canton2,752
- Cape Girardeau40,344
- Cardwell816
- Carl Junction8,339
- Carrollton3,145
- Carterville2,074
- Carthage15,574
- Caruthersville5,326
- Carytown365
- Cassville3,202
- Castle Point2,340
- Catron59
- Cave1
- Cedar Hill1,261
- Cedar Hill Lakes284
- Center537
- Centertown297
- Centerview248
- Centerville244
- Centralia4,690
- Chaffee3,026
- Chain of Rocks255
- Chain-O-Lakes119
- Chamois375
- Champ6
- Charlack1,596
- Charleston4,482
- Cherokee Pass121
- Chesterfield49,574
- Chilhowee232
- Chillicothe8,923
- Chula159
- Clarence862
- Clark200
- Clarksburg304
- Clarksdale399
- Clarkson Valley2,584
- Clarksville402
- Clarkton958
- Claycomo1,820
- Clayton17,380
- Clearmont183
- Cleveland968
- Clever3,030
- Cliff Village17
- Clifton Hill76
- Climax Springs7
- Clinton9,065
- Clyde39
- Cobalt364
- Coffey78
- Cole Camp1,436
- Collins76
- Columbia128,548
- Commerce64
- Conception202
- Conception Junction217
- Concord18,368
- Concordia2,332
- Coney Island81
- Connelsville70
- Conway732
- Cool Valley1,411
- Cooter285
- Corder442
- Cosby130
- Cottleville5,937
- Country Club2,935
- Country Club Hills854
- Country Life Acres73
- Cowgill176
- Craig113
- Crane1,760
- Creighton302
- Crestwood12,295
- Creve Coeur18,643
- Crocker1,024
- Cross Timbers379
- Crystal City4,718
- Crystal Lake Park553
- Crystal Lakes436
- Cuba3,189
- Curryville199
- Dadeville234
- Dalton17
- Dardenne Prairie13,503
- Darlington31
- Dawn111
- De Kalb518
- De Soto6,470
- De Witt55
- Dearborn557
- Deepwater320
- Deerfield43
- Deering74
- Defiance63
- Dellwood4,847
- Delta532
- Dennis Acres36
- Denton25
- Denver20
- Des Arc181
- Des Peres9,170
- Desloge4,863
- Dexter7,891
- Diamond914
- Diehlstadt113
- Diggins269
- Dixon1,334
- Doe Run775
- Doniphan2,345
- Doolittle561
- Dover136
- Downing277
- Drexel924
- Dudley99
- Duenweg1,918
- Duquesne2,257
- Dutchtown187
- Eagle Rock21
- Eagleville352
- East Lynne155
- East Prairie2,902
- Easton336
- Edgar Springs224
- Edgerton518
- Edina1,250
- Edinburg63
- Edmundson975
- El Dorado Springs3,586
- Eldon4,556
- Ellington1,057
- Ellisville10,002
- Ellsinore678
- Elmer24
- Elmira17
- Elmo217
- Elsberry1,870
- Emerald Beach274
- Eminence388
- Emma270
- Eolia449
- Essex413
- Ethel65
- Eugene158
- Eureka13,081
- Evergreen88
- Everton223
- Ewing542
- Excello58
- Excelsior Estates239
- Excelsior Springs10,484
- Exeter819
- Fair Grove1,717
- Fair Play595
- Fairdealing415
- Fairfax702
- Fairview371
- Farber272
- Farley309
- Farmington18,282
- Faucett114
- Fayette2,801
- Fenton4,088
- Ferguson18,213
- Ferrelview752
- Festus13,201
- Fidelity353
- Fillmore299
- Fisk502
- Fleming68
- Flemington73
- Flint Hill583
- Flordell Hills1,195
- Florissant51,773
- Foley140
- Fordland594
- Forest City193
- Foristell1,096
- Forsyth2,766
- Fort Leonard Wood15,432
- Fortescue8
- Fortuna256
- Foster65
- Fountain N' Lakes162
- Frankclay91
- Frankford502
- Franklin66
- Fredericktown4,507
- Freeburg401
- Freeman690
- Freistatt249
- Fremont107
- Fremont Hills1,574
- Frisbee95
- Frohna303
- Frontenac3,701
- Fulton12,617
- Gainesville1,010
- Galena550
- Gallatin1,740
- Galt203
- Garden City1,742
- Gasconade306
- Gentry58
- Gerald1,368
- Gerster7
- Gibbs62
- Gideon662
- Gilliam324
- Gilman City382
- Ginger Blue117
- Gladstone27,207
- Glasgow1,118
- Glasgow Village5,504
- Glen Allen50
- Glen Echo Park101
- Glenaire587
- Glendale6,114
- Glenwood205
- Golden233
- Golden City708
- Goodman1,092
- Goose Creek Lake481
- Gordonville473
- Gower1,799
- Graham129
- Grain Valley16,271
- Granby2,745
- Grand Falls Plaza168
- Grand Pass48
- Grandin352
- Grandview26,527
- Granger39
- Grant City959
- Grantwood Village1,058
- Gravois Mills116
- Gray Summit2,991
- Grayhawk538
- Grayridge96
- Grayson28
- Green Castle332
- Green City658
- Green Park2,690
- Green Ridge496
- Greendale794
- Greenfield1,229
- Greentop331
- Greenville418
- Greenwood6,013
- Grovespring25
- Guilford77
- Gunn City65
- Hale525
- Halfway137
- Hallsville1,927
- Halltown40
- Hamilton1,755
- Hanley Hills2,178
- Hannibal16,771
- Hardin681
- Harris38
- Harrisburg312
- Harrisonville9,970
- Hartsburg109
- Hartville610
- Harwood6
- Hawk Point736
- Hayti2,090
- Hayti Heights540
- Hayward83
- Haywood City180
- Hazelwood25,114
- Henrietta390
- Herculaneum5,071
- Hermann2,290
- Hermitage734
- Higbee507
- Higginsville4,781
- High Hill238
- High Ridge3,714
- Highlandville950
- Hillsboro3,500
- Hillsdale873
- Hoberg34
- Holcomb666
- Holden1,989
- Holland141
- Holliday144
- Hollister4,643
- Hollywood2
- Holt440
- Holts Summit4,609
- Homestead146
- Homestown64
- Hopkins388
- Horine781
- Hornersville531
- Houston2,226
- Houston Lake271
- Houstonia273
- Howardville179
- Hughesville95
- Humansville1,058
- Hume209
- Humphreys137
- Hunnewell130
- Hunter50
- Huntleigh366
- Huntsdale11
- Huntsville1,672
- Hurdland173
- Hurley98
- Iantha124
- Iatan38
- Iberia661
- Imperial5,488
- Independence121,740
- Indian Lake1,135
- Indian Point387
- Innsbrook843
- Ionia74
- Irena19
- Iron Mountain Lake781
- Irondale622
- Ironton1,692
- Irwin43
- Jackson15,659
- Jacksonville112
- Jameson115
- Jamesport709
- Jamestown280
- Jane292
- Jasper808
- Jefferson City42,488
- Jennings12,918
- Jerico Springs279
- Jonesburg806
- Joplin52,593
- Josephville664
- Junction City372
- Kahoka2,072
- Kansas City510,612
- Kearney10,885
- Kelso603
- Kennett10,196
- Keytesville435
- Kidder501
- Kimberling City2,476
- Kimmswick112
- King City830
- Kingdom City114
- Kingston271
- Kingsville360
- Kinloch322
- Kirbyville101
- Kirksville17,563
- Kirkwood29,363
- Kissee Mills1,081
- Knob Lick41
- Knob Noster2,838
- Knox City103
- Koshkonong198
- La Belle775
- La Due31
- La Grange1,033
- La Monte1,126
- La Plata1,351
- La Russell95
- La Tour132
- LaBarque Creek1,457
- Laclede301
- Laddonia533
- Ladue8,940
- Lake Annette99
- Lake Arrowhead93
- Lake Lafayette237
- Lake Lotawana2,442
- Lake Ozark2,335
- Lake St. Clair872
- Lake St. Louis18,066
- Lake Tapawingo706
- Lake Tekakwitha202
- Lake Timberline810
- Lake Viking311
- Lake Waukomis1,170
- Lake Winnebago1,773
- Lakeshire1,396
- Lamar4,284
- Lamar Heights111
- Lanagan483
- Lancaster742
- Laredo109
- Latham75
- Lathrop2,560
- Laurie965
- Lawson2,905
- Leadington901
- Leadwood1,354
- Leasburg279
- Leawood512
- Lebanon15,270
- Lee's Summit103,656
- Leeton660
- Leisure Lake175
- Lemay16,228
- Leonard35
- Leslie91
- Levasy104
- Lewis and Clark Village101
- Lewistown343
- Lexington4,606
- Liberal747
- Liberty30,689
- Licking2,858
- Lilbourn905
- Lincoln1,787
- Linn1,197
- Linn Creek188
- Linneus167
- Lithium30
- Livonia12
- Loch Lloyd950
- Lock Springs49
- Lockwood821
- Lohman243
- Loma Linda1,239
- Lone Jack1,412
- Longtown99
- Louisburg141
- Louisiana3,228
- Lowry City618
- Lucerne35
- Ludlow153
- Lupus40
- Luray181
- Macks Creek290
- Macon5,466
- Madison446
- Maitland385
- Malden3,805
- Malta Bend211
- Manchester18,160
- Mansfield1,524
- Maplewood8,156
- Marble Hill1,758
- Marceline2,292
- Marionville2,785
- Marlborough2,157
- Marquand187
- Marshall13,739
- Marshfield7,696
- Marston400
- Marthasville2,328
- Martinsburg522
- Maryland Heights27,880
- Maryville10,428
- Matthews561
- Maysville947
- Mayview301
- McBaine4
- McCord Bend138
- McFall111
- McKittrick93
- Meadville480
- Medill104
- Mehlville29,805
- Memphis1,782
- Mendon194
- Mercer325
- Merriam Woods2,047
- Merwin33
- Meta115
- Metz7
- Mexico11,477
- Miami71
- Middle Grove40
- Middletown248
- Milan1,859
- Milford54
- Mill Spring145
- Millard106
- Miller769
- Millersville280
- Milo47
- Mindenmines312
- Mine La Motte370
- Miner950
- Mineral Point324
- Miramiguoa Park155
- Missouri City215
- Moberly13,526
- Mokane257
- Moline Acres2,843
- Monett9,873
- Monroe City3,028
- Montgomery City2,801
- Monticello233
- Montier60
- Montreal114
- Montrose425
- Mooresville93
- Morehouse715
- Morley540
- Morrison44
- Morrisville595
- Mosby52
- Moscow Mills3,823
- Mound City1,066
- Moundville98
- Mount Leonard52
- Mount Moriah121
- Mount Vernon4,563
- Mountain Grove4,491
- Mountain View2,658
- Murphy8,285
- Napoleon201
- Naylor388
- Neck City193
- Neelyville358
- Nelson124
- Neosho13,224
- Nevada7,925
- New Bloomfield876
- New Cambria137
- New Florence667
- New Franklin1,170
- New Hamburg247
- New Hampton213
- New Haven3,302
- New London1,130
- New Madrid2,662
- New Market52
- New Melle452
- Newark75
- Newburg331
- Newtonia244
- Newtown109
- Niangua537
- Nixa24,836
- Noel1,913
- Norborne676
- Normandy4,239
- North Kansas City4,983
- North Lilbourn95
- Northmoor371
- Northwoods3,623
- Norwood681
- Norwood Court797
- Novelty63
- Novinger423
- O'Fallon93,801
- Oak Grove8,538
- Oak Grove Village347
- Oak Ridge298
- Oakland1,562
- Oaks156
- Oakview377
- Oakville35,333
- Oakwood142
- Oakwood Park204
- Odessa5,620
- Old Appleton109
- Old Jamestown20,651
- Old Monroe236
- Olean168
- Olivette8,645
- Olympian Village694
- Oran1,033
- Oregon882
- Oronogo2,804
- Orrick727
- Osage Beach4,905
- Osborn424
- Osceola1,042
- Osgood9
- Otterville489
- Overland15,695
- Owensville2,806
- Oxly33
- Ozark22,417
- Ozora299
- Pacific7,475
- Pagedale2,531
- Palmyra3,623
- Paradise72
- Paris1,587
- Park Hills8,678
- Parkdale204
- Parkville8,366
- Parkway624
- Parma596
- Parnell189
- Pasadena Hills1,190
- Pasadena Park710
- Pascola87
- Passaic93
- Pattonsburg225
- Paynesville64
- Peaceful Village117
- Peculiar5,958
- Pendleton23
- Penermon102
- Perkins106
- Perry640
- Perryville8,536
- Pevely6,055
- Philadelphia219
- Phillipsburg164
- Pickering162
- Piedmont2,911
- Pierce City1,477
- Pierpont64
- Pilot Grove744
- Pilot Knob653
- Pine Lawn2,716
- Pineville736
- Plato183
- Platte City4,824
- Platte Woods532
- Plattsburg2,253
- Pleasant Hill8,847
- Pleasant Hope716
- Pleasant Valley2,736
- Pocahontas55
- Pollock7
- Polo480
- Pomona178
- Pontiac88
- Poplar Bluff16,254
- Portage Des Sioux340
- Portageville2,825
- Potosi2,544
- Powersville62
- Prairie Hill120
- Prairie Home251
- Prathersville100
- Preston331
- Princeton1,352
- Purcell324
- Purdin69
- Purdy1,121
- Puxico846
- Queen City650
- Quitman27
- Qulin570
- Raintree Plantation2,047
- Randolph31
- Ravanna68
- Ravenwood563
- Raymondville563
- Raymore24,526
- Raytown29,445
- Rayville84
- Rea39
- Redings Mill107
- Reeds208
- Reeds Spring1,112
- Renick119
- Rensselaer243
- Republic19,829
- Revere47
- Rhineland165
- Rich Hill1,453
- Richards49
- Richland2,136
- Richmond5,959
- Richmond Heights9,153
- Ridgely84
- Ridgeway478
- Risco288
- Ritchey62
- River Bend4
- Riverside4,276
- Riverview2,731
- Riverview Estates105
- Rives64
- Rocheport231
- Rock Hill4,693
- Rock Port1,221
- Rockaway Beach760
- Rockville153
- Rocky Comfort253
- Rogersville4,908
- Rolla20,287
- Roscoe101
- Rosebud442
- Rosendale130
- Rothville56
- Rush Hill71
- Rushville260
- Russellville833
- Rutledge112
- Saddlebrooke337
- Saginaw332
- Salem4,677
- Salisbury1,540
- Sappington7,367
- Sarcoxie1,574
- Savannah5,053
- Saverton60
- Schell City224
- Scotsdale216
- Scott City4,371
- Sedalia22,003
- Sedgewickville201
- Seligman941
- Senath1,662
- Seneca1,906
- Seymour2,179
- Shakertowne569
- Shawneetown122
- Shelbina1,653
- Shelbyville621
- Sheldon443
- Shell Knob1,486
- Sheridan181
- Shoal Creek Drive485
- Shoal Creek Estates218
- Shrewsbury6,316
- Sibley369
- Sikeston16,320
- Silex355
- Skidmore189
- Slater2,066
- Smithton535
- Smithville10,705
- South Fork67
- South Gifford15
- South Gorin64
- South Greenfield138
- South Lineville16
- Southwest City992
- Spanish Lake17,873
- Sparta2,331
- Spickard253
- Spokane319
- Springfield169,954
- St. Ann12,811
- St. Catharine10
- St. Charles71,508
- St. Clair4,789
- St. Clement31
- St. Cloud24
- St. Elizabeth587
- St. Francisville142
- St. George1,458
- St. James3,916
- St. John6,527
- St. Joseph71,236
- St. Louis288,512
- St. Martins1,228
- St. Mary285
- St. Paul3,456
- St. Peters59,092
- St. Robert5,356
- St. Thomas228
- Stanberry1,235
- Stanton175
- Stark City133
- Ste. Genevieve5,010
- Steele1,493
- Steelville1,665
- Stella275
- Stewartsville844
- Stockton1,950
- Stotts City178
- Stoutland243
- Stoutsville20
- Stover977
- Strafford2,672
- Strasburg135
- Sturgeon1,035
- Sugar Creek3,249
- Sullivan6,310
- Summer Set1,236
- Summersville409
- Sumner68
- Sundown178
- Sunrise Beach413
- Sunset Hills9,112
- Sweet Springs1,268
- Sycamore Hills672
- Syracuse177
- Tallapoosa43
- Taneyville206
- Taos1,242
- Tarkio1,471
- Tarrants18
- Tarsney Lakes214
- Tebbetts386
- Terre du Lac2,516
- Thayer2,333
- Theodosia178
- Thomasville8
- Three Creeks3
- Tightwad53
- Tina177
- Tindall74
- Tipton2,667
- Town and Country11,607
- Tracy309
- Trenton5,536
- Trimble561
- Triplett38
- Troy13,947
- Truesdale990
- Truxton28
- Turney108
- Tuscumbia142
- Twin Oaks734
- Umber View Heights49
- Union12,781
- Union Star559
- Unionville1,824
- Unity Village121
- University City34,685
- Uplands Park322
- Urbana441
- Urich469
- Utica211
- Valley Park6,795
- Van Buren1,161
- Vandalia3,140
- Vandiver127
- Vanduser198
- Velda City1,158
- Velda Village Hills858
- Verona477
- Versailles2,610
- Vibbard244
- Viburnum803
- Vienna661
- Villa Ridge2,835
- Village of Four Seasons2,252
- Vinita Park2,042
- Vista46
- Waco154
- Walker359
- Walnut Grove528
- Wardell445
- Wardsville1,579
- Warrensburg19,582
- Warrenton9,066
- Warsaw1,980
- Warson Woods2,393
- Washburn498
- Washington15,130
- Wasola34
- Watson51
- Waverly901
- Wayland439
- Waynesville5,442
- Weatherby75
- Weatherby Lake2,401
- Weaubleau521
- Webb City13,221
- Webster Groves23,712
- Weingarten114
- Weldon Spring5,310
- Weldon Spring Heights121
- Wellington432
- Wellston1,628
- Wellsville1,165
- Wentworth115
- Wentzville47,061
- West Alton467
- West Line59
- West Plains12,441
- West Sullivan220
- Westboro106
- Weston1,922
- Westphalia415
- Westwood338
- Wheatland247
- Wheaton427
- Wheeling157
- White Branch177
- White Oak119
- Whiteman AFB3,517
- Whiteside108
- Whitewater64
- Whiting179
- Wilbur Park491
- Wildwood35,133
- Willard6,488
- Williamstown23
- Williamsville284
- Willow Springs2,279
- Wilson City79
- Winchester1,939
- Windsor3,094
- Windsor Place405
- Winfield1,745
- Winigan18
- Winona854
- Winston192
- Wood Heights784
- Woodson Terrace3,908
- Wooldridge20
- Worth34
- Wortham141
- Worthington24
- Wright City5,240
- Wyaconda195
- Wyatt243
- Zalma50
Metro and micro areas
Each of the 26 that reach into Missouri, with its whole population, from ACS 2020–2024 5-year estimates. Metro and micro areas are counties tied together by commuting, drawn by the Office of Management and Budget.
- Branson, MO Micro Area56,529
- Cape Girardeau, MO-IL Metro Area98,169
- Columbia, MO Metro Area215,014
- Farmington, MO Micro Area66,999
- Fort Leonard Wood, MO Micro Area53,894
- Hannibal, MO Micro Area38,885
- Jefferson City, MO Metro Area150,437
- Joplin, MO-KS Metro Area203,626
- Kansas City, MO-KS Metro Area2.22M
- Kennett, MO Micro Area27,493
- Kirksville, MO Micro Area29,339
- Lebanon, MO Micro Area36,390
- Marshall, MO Micro Area23,231
- Maryville, MO Micro Area20,774
- Mexico, MO Micro Area24,548
- Moberly, MO Micro Area24,365
- Poplar Bluff, MO Micro Area42,020
- Quincy, IL-MO Micro Area74,678
- Rolla, MO Micro Area45,194
- Sedalia, MO Micro Area43,397
- Sikeston, MO Micro Area49,835
- Springfield, MO Metro Area486,785
- St. Joseph, MO-KS Metro Area120,012
- St. Louis, MO-IL Metro Area2.81M
- Warrensburg, MO Micro Area54,732
- West Plains, MO Micro Area40,383
ZIP codes
Each of the 1,021 with people in it, by the town it's centered in, from ACS 2020–2024 5-year estimates. These are the Census Bureau's ZIP Code Tabulation Areas, which follow the Postal Service's ZIP codes as closely as census blocks allow.
- 63005Wildwood19,779
- 63010Arnold34,478
- 63011Ballwin35,920
- 63012Barnhart10,314
- 63013Leslie1,136
- 63014Berger426
- 63015Lake Tekakwitha1,939
- 63016Cedar Hill6,459
- 63017Chesterfield43,243
- 63019Crystal City4,489
- 63020Summer Set20,166
- 63021Ballwin55,666
- 63023Cedar Hill Lakes5,002
- 63025Eureka19,508
- 63026Fenton45,354
- 63028Olympian Village28,457
- 63030Briarwood Estates557
- 63031Florissant50,196
- 63033Black Jack43,056
- 63034Old Jamestown18,908
- 63036Goose Creek Lake1,001
- 63037Gerald2,970
- 63038Wildwood7,107
- 63039Gray Summit986
- 63040Wildwood8,526
- 63041Cedar Hill Lakes309
- 63042Hazelwood17,813
- 63043Maryland Heights21,924
- 63044Bridgeton10,324
- 63048Herculaneum4,228
- 63049Parkdale16,592
- 63050Raintree Plantation18,744
- 63051Scotsdale13,436
- 63052Imperial28,712
- 63053Kimmswick56
- 63055Gray Summit1,693
- 63056Leslie1,896
- 63060Parkway2,192
- 63061216
- 63068New Haven6,202
- 63069Pacific15,697
- 63070Pevely8,428
- 630711,113
- 63072Lake Tekakwitha3,469
- 63073Defiance803
- 63074St. Ann15,793
- 63077Lake St. Clair11,391
- 63079Stanton60
- 63080Miramiguoa Park13,124
- 63084Union20,708
- 63087Lake Timberline1,066
- 63088Valley Park8,226
- 63089Villa Ridge5,662
- 63090Washington23,258
- 63091Rosebud1,449
- 63101St. Louis3,130
- 63102St. Louis2,882
- 63103St. Louis8,778
- 63104St. Louis19,007
- 63105Clayton18,875
- 63106St. Louis6,751
- 63107St. Louis8,909
- 63108St. Louis21,336
- 63109St. Louis25,236
- 63110St. Louis17,645
- 63111St. Louis18,851
- 63112St. Louis17,985
- 63113St. Louis10,221
- 63114Overland33,969
- 63115St. Louis14,488
- 63116St. Louis42,170
- 63117Richmond Heights9,261
- 63118St. Louis25,913
- 63119Webster Groves34,181
- 63120St. Louis6,790
- 63121Normandy25,008
- 63122Kirkwood41,634
- 63123Affton49,077
- 63124Ladue10,839
- 63125Lemay33,294
- 63126Crestwood15,452
- 63127Sunset Hills5,268
- 63128Concord30,540
- 63129Oakville51,553
- 63130University City28,910
- 63131Des Peres17,935
- 63132Olivette14,283
- 63133Pagedale6,569
- 63134Berkeley13,059
- 63135Ferguson18,381
- 63136Moline Acres40,929
- 63137Riverview19,684
- 63138Spanish Lake18,233
- 63139St. Louis21,631
- 63140Kinloch316
- 63141Creve Coeur20,932
- 63143Maplewood8,975
- 63144Brentwood9,505
- 63146Maryland Heights30,678
- 63147St. Louis8,173
- 63301St. Charles52,667
- 63303St. Charles46,089
- 63304Weldon Spring Heights43,195
- 63330Annada108
- 63332Augusta1,651
- 63333Bellflower688
- 63334St. Clement7,564
- 63336Clarksville1,079
- 63339Curryville996
- 63341Defiance3,515
- 63343Elsberry4,381
- 63344Eolia1,501
- 63345Farber291
- 63347Foley3,140
- 63348Foristell10,394
- 63349Hawk Point2,149
- 63350High Hill769
- 63351Jonesburg1,389
- 63352Laddonia1,018
- 63353Louisiana4,790
- 63357Marthasville6,536
- 63359Middletown1,667
- 63361Montgomery City4,460
- 63362Moscow Mills9,930
- 63363New Florence949
- 63365New Melle51
- 63366St. Paul54,769
- 63367Lake St. Louis29,725
- 63368O'Fallon46,966
- 63369Old Monroe2,822
- 63373Portage Des Sioux690
- 63376St. Peters74,962
- 63377Silex3,501
- 63379Troy27,731
- 63380Truesdale990
- 63381Truxton618
- 63382Vandalia4,033
- 63383Pendleton16,927
- 63384Wellsville2,049
- 63385Wentzville51,330
- 63386West Alton482
- 63387Whiteside108
- 63388685
- 63389Winfield7,616
- 63390Wright City10,970
- 63401Hannibal21,489
- 63430Wayland457
- 63431Clarence547
- 63432Granger363
- 63434Bethel731
- 63435Canton4,318
- 63436Center1,199
- 63437Clarence1,560
- 63438Ewing232
- 63439Philadelphia183
- 63440Ewing1,136
- 63441Frankford1,144
- 63443Hunnewell393
- 63445Kahoka3,831
- 63446Knox City493
- 63447La Belle1,060
- 63448La Grange1,760
- 63450Shelbina145
- 63451Leonard177
- 63452Lewistown1,026
- 63453Luray388
- 63454Ewing1,104
- 63456Monroe City4,749
- 63457Monticello389
- 63458Newark185
- 63459New London4,423
- 63460Novelty151
- 63461Palmyra5,446
- 63462Perry1,335
- 63463Philadelphia711
- 63465Revere633
- 63467Saverton19
- 63468Shelbina2,314
- 63469Shelbyville911
- 63471La Grange770
- 63472Wayland439
- 63473Williamstown375
- 63474Wyaconda444
- 63501Kirksville21,218
- 63530Atlanta1,361
- 63531Baring393
- 63532Bevier1,215
- 63533Brashear1,141
- 63534Callao652
- 63535Livonia14
- 63536Downing837
- 63537Edina2,194
- 63538Elmer105
- 63539Ethel259
- 63540Gibbs418
- 63541Glenwood383
- 63543South Gorin315
- 63544Green Castle1,159
- 63545Green City968
- 63546Greentop1,340
- 63547Hurdland377
- 63548Lancaster1,154
- 63549La Plata2,344
- 63551Livonia251
- 63552Macon7,554
- 63555Memphis3,258
- 63556Milan3,196
- 63557Winigan272
- 63558New Cambria602
- 63559Novinger1,258
- 63560Pollock61
- 63561Queen City1,043
- 63563Rutledge501
- 63565Unionville3,965
- 63566Winigan72
- 63567Worthington70
- 63601Park Hills16,389
- 63620Annapolis1,036
- 63621Arcadia1,632
- 63622Caledonia764
- 63623895
- 63624Bismarck3,447
- 63625Centerville382
- 63626Summer Set588
- 63627Bloomsdale2,787
- 63628Bonne Terre16,416
- 63629Bunker947
- 63630Mineral Point4,006
- 63631Caledonia544
- 63633Centerville775
- 63636Des Arc446
- 63637Doe Run759
- 63638Ellington2,489
- 63640Farmington29,263
- 63645Fredericktown11,554
- 63648Irondale1,858
- 63650Ironton3,600
- 63653Leadwood1,186
- 63654Centerville752
- 63655Marquand1,639
- 63656Pilot Knob576
- 63660Mineral Point2,784
- 63662Sedgewickville536
- 63663Pilot Knob649
- 63664Potosi9,693
- 63665Ellington313
- 63670Weingarten12,293
- 63673St. Mary2,340
- 63674Summer Set48
- 63675Annapolis24
- 63701Cape Girardeau39,345
- 63703Cape Girardeau8,201
- 63730Advance3,397
- 63732Altenburg863
- 63735Bell City697
- 63736Benton3,755
- 63739Burfordville508
- 63740Chaffee5,165
- 63742Commerce64
- 63743Sedgewickville64
- 63744Delta198
- 63745Dutchtown136
- 63746Longtown11
- 63747Biehle972
- 63748Frohna1,174
- 63750Zalma318
- 63751Glen Allen946
- 63755Jackson27,629
- 63758Kelso435
- 63760Marble Hill604
- 63763Zalma98
- 63764Marble Hill4,760
- 63766Millersville1,715
- 63767Morley526
- 63769Oak Ridge1,358
- 63770Old Appleton203
- 63771Oran2,365
- 63774Perkins106
- 63775Perryville16,325
- 63780Commerce6,243
- 63781Sedgewickville1,398
- 63782Zalma172
- 63783Old Appleton60
- 63784Vanduser253
- 63785Whitewater1,282
- 63787Zalma551
- 63801Sikeston22,027
- 63820Anniston249
- 63821Arbyrd616
- 63822Bernie2,724
- 63823Bertrand1,434
- 63824Blodgett185
- 63825Bloomfield4,224
- 63826Deering164
- 63827Bragg City431
- 63828Canalou177
- 63829Cardwell1,070
- 63830Caruthersville6,118
- 63833Catron137
- 63834Wilson City5,169
- 63837Clarkton1,381
- 63839Cooter290
- 63840Deering74
- 63841Dexter13,191
- 63845East Prairie5,261
- 63846Grayridge1,239
- 63847Holcomb91
- 63848Gideon887
- 63849Rives176
- 63850Grayridge8
- 63851Hayti3,684
- 63852Frisbee1,172
- 63853Holland141
- 63855Rives854
- 63857Kennett11,930
- 63860North Lilbourn172
- 63862Catron1,237
- 63863Malden5,321
- 63866Marston409
- 63867Matthews764
- 63868Morehouse653
- 63869New Madrid3,218
- 63870Parma1,066
- 63873Portageville4,015
- 63874Risco288
- 63876Senath2,071
- 63877Steele2,816
- 63878Tallapoosa92
- 63879Wardell694
- 63880White Oak97
- 63882Wilson City322
- 63901Poplar Bluff35,324
- 63932Broseley848
- 63933Campbell3,049
- 63934Greenville31
- 63935Doniphan7,931
- 63936Dudley494
- 63937Ellsinore2,643
- 63939Fairdealing963
- 63940Fisk1,326
- 63941Fremont221
- 63942490
- 63943Grandin823
- 63944Greenville1,332
- 63945Fairdealing928
- 63951200
- 63952Mill Spring284
- 63953Naylor787
- 63954Neelyville954
- 63955Oxly64
- 63956Greenville770
- 63957Piedmont5,144
- 63960Puxico3,204
- 63961Qulin1,600
- 63964Greenville733
- 63965Van Buren2,607
- 63966Puxico2,110
- 63967Williamsville1,313
- 64001Alma842
- 64011Bates City3,876
- 64012Belton29,304
- 64014Blue Springs28,788
- 64015Blue Springs32,245
- 64016Buckner4,603
- 64017Camden335
- 64018Camden Point981
- 64019Centerview2,385
- 64020Concordia2,953
- 64021Corder573
- 64022Dover140
- 64024Excelsior Springs15,574
- 64028Farley309
- 64029Grain Valley21,961
- 64030Grandview26,422
- 64034Greenwood8,998
- 64035Hardin1,189
- 64036Henrietta610
- 64037Higginsville6,460
- 64040Holden6,379
- 64048Holt4,387
- 64050Independence21,079
- 64052Independence22,138
- 64053Independence6,775
- 64054Sugar Creek3,547
- 64055Independence35,960
- 64056Independence17,395
- 64057Independence14,328
- 64058River Bend6,660
- 64060Kearney16,488
- 64061Kingsville3,161
- 64062Lawson6,968
- 64063Lee's Summit21,863
- 64064Lee's Summit20,050
- 64065Unity Village94
- 64066Levasy98
- 64067Lexington5,978
- 64068Liberty37,758
- 64070Lone Jack3,479
- 64071Mayview728
- 64072Missouri City205
- 64074Napoleon524
- 64075Oak Grove12,121
- 64076Odessa9,623
- 64077Orrick1,665
- 64078Peculiar9,853
- 64079Platte City15,160
- 64080Baldwin Park14,007
- 64081Lee's Summit25,305
- 64082Lee's Summit20,068
- 64083Raymore26,201
- 64084Rayville1,380
- 64085Richmond7,855
- 64086Lake Lotawana23,599
- 64088Sibley1,456
- 64089Smithville14,380
- 64090Strasburg130
- 64093Warrensburg28,199
- 64096Waverly1,166
- 64097Wellington1,014
- 64098Weston3,311
- 64101Kansas City203
- 64102Kansas City56
- 64105Kansas City6,312
- 64106Kansas City11,343
- 64108Kansas City10,495
- 64109Kansas City10,043
- 64110Kansas City16,878
- 64111Kansas City16,887
- 64112Kansas City8,260
- 64113Kansas City12,386
- 64114Kansas City24,229
- 64116North Kansas City18,046
- 64117Kansas City14,919
- 64118Gladstone41,984
- 64119Kansas City33,199
- 64120Kansas City552
- 64123Kansas City11,833
- 64124Kansas City10,925
- 64125Kansas City2,472
- 64126Kansas City6,898
- 64127Kansas City17,668
- 64128Kansas City11,912
- 64129Kansas City9,267
- 64130Kansas City19,644
- 64131Kansas City21,942
- 64132Kansas City12,084
- 64133Raytown36,249
- 64134Kansas City22,964
- 64136Kansas City1,602
- 64137Kansas City9,422
- 64138Raytown23,805
- 64139Kansas City2,796
- 64145Kansas City4,965
- 64146Kansas City1,278
- 64147Kansas City441
- 64149Kansas City418
- 64150Riverside4,463
- 64151Kansas City28,526
- 64152Parkville31,545
- 64153Kansas City6,653
- 64154Kansas City13,851
- 64155Kansas City28,824
- 64156Kansas City7,946
- 64157Kansas City23,030
- 64158Kansas City7,317
- 64161Kansas City292
- 64163Kansas City1,181
- 64164Kansas City208
- 64165Kansas City212
- 64166Smithville270
- 64167Liberty243
- 64401Agency1,757
- 64402Albany2,379
- 64420Allendale31
- 64421Amazonia817
- 64422Amity350
- 64423Barnard777
- 64424Bethany3,929
- 64426Blythedale530
- 64427Bolckow582
- 64428Burlington Junction609
- 64429Cameron11,449
- 64430Clarksdale823
- 64431Clearmont441
- 64432Clyde119
- 64433Conception202
- 64434Conception Junction494
- 64436Cosby873
- 64437Craig561
- 64438Darlington77
- 64439Dearborn1,537
- 64440De Kalb900
- 64441Denver110
- 64442Eagleville951
- 64443Easton1,249
- 64444Edgerton1,043
- 64445Elmo301
- 64446Fairfax1,066
- 64448Faucett912
- 64449Fillmore491
- 64451Forest City333
- 64453Gentry140
- 64454Gower2,941
- 64455Graham292
- 64456Grant City1,367
- 64457Guilford308
- 64458Allendale159
- 64459Union Star507
- 64461Hopkins768
- 64463King City1,349
- 64465Lathrop3,947
- 64466Maitland565
- 64467Denver145
- 64468Maryville14,280
- 64469Maysville2,225
- 64470Mound City1,483
- 64471New Hampton309
- 64473Oregon1,285
- 64474Osborn831
- 64475Parnell403
- 64476Pickering223
- 64477Plattsburg3,489
- 64479Ravenwood1,091
- 64480Rea329
- 64481Ridgeway1,154
- 64482Rock Port1,980
- 64483Rosendale591
- 64484Rushville940
- 64485Savannah7,998
- 64486Sheridan270
- 64487Skidmore572
- 64489Stanberry2,204
- 64490Stewartsville1,939
- 64491Tarkio1,638
- 64492Trimble1,713
- 64493Turney333
- 64494Union Star1,163
- 64496Watson224
- 64497Weatherby488
- 64498Westboro221
- 64499Worth137
- 64501St. Joseph10,689
- 64503St. Joseph11,954
- 64504St. Joseph10,068
- 64505Country Club14,107
- 64506St. Joseph21,461
- 64507St. Joseph13,991
- 64601Chillicothe12,189
- 64620Altamont626
- 64622Bogard718
- 64623Bosworth464
- 64624Braymer1,489
- 64625Breckenridge738
- 64628Brookfield5,661
- 64630Browning495
- 64631Bucklin836
- 64632Cainsville371
- 64633Carrollton4,346
- 64635Chula508
- 64636Coffey217
- 64637Cowgill492
- 64638Dawn470
- 64639De Witt113
- 64640Gallatin3,125
- 64641Galt625
- 64642Gilman City804
- 64643Hale1,088
- 64644Hamilton2,923
- 64645Harris195
- 64646Humphreys471
- 64647Jameson423
- 64648Jamesport2,396
- 64649Kidder814
- 64650Kingston665
- 64651Laclede461
- 64652Laredo346
- 64653Linneus431
- 64654Lock Springs49
- 64655Lucerne93
- 64656Ludlow237
- 64657McFall266
- 64658Marceline3,147
- 64659Meadville793
- 64660Mendon444
- 64661Mercer757
- 64664Utica244
- 64667Newtown255
- 64668Norborne1,278
- 64670Pattonsburg1,007
- 64671Polo1,986
- 64672Powersville185
- 64673Princeton2,497
- 64674Purdin409
- 64676Rothville132
- 64679Spickard921
- 64681Sumner170
- 64682Tina411
- 64683Trenton7,631
- 64686Utica211
- 64688Wheeling705
- 64689Winston422
- 64701Harrisonville14,731
- 64720Adrian4,494
- 64722Amoret325
- 64723Amsterdam452
- 64724Appleton City1,999
- 64725Archie2,130
- 64726Blairstown278
- 64728Bronaugh445
- 64730Butler6,432
- 64733Chilhowee1,112
- 64734West Line2,318
- 64735Clinton14,013
- 64738Collins1,368
- 64739Creighton1,065
- 64740Brownington1,469
- 64741Deerfield308
- 64742Drexel2,185
- 64743East Lynne162
- 64744El Dorado Springs8,242
- 64745Foster51
- 64746Freeman1,502
- 64747Garden City4,201
- 64748Golden City1,105
- 64750Harwood439
- 64752Hume545
- 64755Jasper2,332
- 64756Jerico Springs681
- 64759Lamar8,310
- 64761Leeton1,598
- 64762Liberal1,379
- 64763Lowry City1,676
- 64765Metz7
- 64767Milo418
- 64769Mindenmines459
- 64770Montrose1,151
- 64771Moundville490
- 64772Nevada12,824
- 64776Osceola3,374
- 64778Richards422
- 64779Rich Hill2,688
- 64780Rockville364
- 64781Roscoe80
- 64783Schell City607
- 64784Sheldon1,359
- 64788Urich1,435
- 64790Walker1,114
- 64801Joplin36,287
- 64804Redings Mill37,016
- 64830Alba624
- 64831Anderson6,206
- 64832Asbury1,286
- 64833Avilla70
- 64834Carl Junction10,586
- 64835Carterville2,074
- 64836Carthage26,562
- 64840Diamond3,325
- 64841Duenweg1,381
- 64842Fairview775
- 64843Goodman3,180
- 64844Granby4,796
- 64847Ginger Blue390
- 64848La Russell609
- 64849Neck City187
- 64850Neosho25,126
- 64854Noel4,910
- 64855Asbury3,039
- 64856Jane4,092
- 64857Purcell396
- 64858Seneca586
- 64859Avilla1,212
- 64861Rocky Comfort1,324
- 64862Sarcoxie3,173
- 64863Southwest City1,586
- 64865Seneca5,692
- 64866Newtonia1,113
- 64867Stella1,082
- 64868137
- 64870Oronogo16,186
- 64873Wentworth1,329
- 64874Wheaton509
- 65001Argyle159
- 65010Ashland7,205
- 65011Barnett2,365
- 65013Belle3,137
- 65014Bland2,245
- 65016Tebbetts1,240
- 65017Brumley1,183
- 65018California7,748
- 65020Camdenton14,748
- 65023Centertown1,566
- 65024Chamois1,218
- 65025Clarksburg773
- 65026Aurora Springs11,606
- 65032Eugene1,491
- 65034Fortuna514
- 65035Freeburg1,681
- 65037Laurie5,244
- 65039Hartsburg3,076
- 65040St. Thomas1,468
- 65041Gasconade5,626
- 65043Holts Summit10,120
- 65046Jamestown1,127
- 65047Osage Beach1,445
- 65048Westphalia194
- 65049Village of Four Seasons7,123
- 65050Latham823
- 65051Linn4,487
- 65052Linn Creek3,790
- 65053Lohman1,813
- 65054Westphalia893
- 65058Meta1,274
- 65059Mokane1,085
- 65061Morrison681
- 6506220
- 65063New Bloomfield3,372
- 65064Olean727
- 65065Osage Beach7,197
- 65066Owensville6,140
- 65067Chamois299
- 65068Prairie Home893
- 65069Rhineland511
- 65072Village of Four Seasons1,932
- 65074Russellville2,936
- 65075St. Elizabeth1,154
- 65076St. Thomas515
- 65077Chamois437
- 65078Stover3,584
- 65079Sunrise Beach4,385
- 65080Tebbetts1,475
- 65081Tipton4,417
- 65082Tuscumbia1,165
- 65083Brumley278
- 65084Versailles7,473
- 65085Westphalia1,193
- 65101Taos28,793
- 65109Jefferson City41,145
- 65201Pierpont50,011
- 65202Columbia47,327
- 65203McBaine61,539
- 65215Columbia225
- 65216Columbia202
- 65230Armstrong591
- 65231Auxvasse3,132
- 65232Benton City256
- 65233Windsor Place10,640
- 65236Brunswick1,199
- 65237Bunceton763
- 65239Cairo1,743
- 65240Centralia8,830
- 65243Clark2,950
- 65244Clifton Hill311
- 65246Dalton54
- 65247Excello777
- 65248Fayette4,480
- 65250Franklin293
- 65251Fulton22,579
- 65254Glasgow1,869
- 65255Hallsville5,216
- 65256Harrisburg2,011
- 65257Higbee1,484
- 65258Holliday452
- 65259Huntsville2,990
- 65260Jacksonville384
- 65261Keytesville1,316
- 65262Kingdom City729
- 65263Madison1,705
- 65264Martinsburg919
- 65265Mexico15,153
- 65270Moberly16,612
- 65274New Franklin1,969
- 65275Paris2,657
- 65276Pilot Grove1,777
- 65278Renick35
- 65279Rocheport1,940
- 65280Rush Hill121
- 65281Salisbury3,030
- 65282168
- 65283Stoutsville546
- 65284Sturgeon2,316
- 65285Centralia523
- 65286Triplett99
- 65287Wooldridge290
- 65301Sedalia35,091
- 65305Whiteman AFB3,445
- 65320Arrow Rock65
- 65321Blackburn405
- 65322Blackwater706
- 65323Calhoun943
- 65324Climax Springs1,055
- 65325Cole Camp3,071
- 65326Climax Springs1,901
- 65327Emma284
- 65329Syracuse529
- 65330Gilliam575
- 65332Green Ridge1,949
- 65333Houstonia658
- 65334Hughesville1,094
- 65335Ionia175
- 65336Knob Noster6,519
- 65337La Monte1,952
- 65338Lincoln3,129
- 65339Malta Bend592
- 65340Marshall16,026
- 65344Miami173
- 65345Cole Camp376
- 65347Nelson846
- 65348Otterville1,419
- 65349Slater2,480
- 65350Smithton1,455
- 65351Sweet Springs2,122
- 65354Syracuse701
- 65355White Branch11,436
- 65360Windsor4,586
- 65401Rolla32,714
- 65436Edgar Springs21
- 65438Birch Tree2,363
- 65439Viburnum55
- 65440Viburnum206
- 65441St. Cloud5,028
- 65443Vienna107
- 65444Houston824
- 65446401
- 65449161
- 65452Crocker2,519
- 65453Indian Lake8,175
- 65456Viburnum637
- 65457St. Robert177
- 65459Dixon8,562
- 65461Fort Leonard Wood97
- 65462Edgar Springs1,264
- 65463Bennett Springs1,158
- 65464285
- 65466Eminence1,464
- 65468Raymondville78
- 65470842
- 65473Fort Leonard Wood15,438
- 65479295
- 65483Houston4,487
- 6548442
- 65486Iberia2,956
- 6550187
- 65529Newburg187
- 65534Fort Leonard Wood502
- 65535Leasburg1,395
- 65536Lebanon29,915
- 65541Edgar Springs150
- 65542Licking7,060
- 65543Plato657
- 65548Mountain View6,388
- 65550Newburg3,181
- 65552Plato2,378
- 65555Raymondville1,384
- 65556Richland4,823
- 65557Plato314
- 65559St. James9,303
- 65560Salem13,822
- 65564Houston42
- 65565Steelville4,845
- 65566Viburnum858
- 65567Stoutland1,458
- 65570Plato715
- 65571Summersville1,762
- 65580686
- 65582Vienna1,732
- 65583Waynesville14,711
- 65584St. Robert10,553
- 65586Steelville137
- 65588Winona2,235
- 65589Raymondville110
- 65590Buffalo1,872
- 65591Montreal1,837
- 65601Aldrich572
- 65603Arcola158
- 65604Ash Grove3,873
- 65605Aurora11,514
- 65606Alton2,381
- 65608Ava8,545
- 65609Bakersfield733
- 65610Billings5,561
- 65611Blue Eye1,963
- 65612Halltown2,057
- 65613Bolivar17,666
- 65614Taneyville567
- 65616Bull Creek28,460
- 65617Pleasant Hope1,716
- 65618110
- 65619Battlefield9,453
- 65620Sparta265
- 65622Buffalo8,695
- 65623Butterfield28
- 65624McCord Bend1,847
- 65625Cassville7,473
- 65626Bakersfield1,405
- 65627Kissee Mills729
- 65629Sparta563
- 65630Saddlebrooke640
- 65631Clever6,174
- 65632Conway3,067
- 65633Crane3,952
- 65634Cross Timbers606
- 65635Dadeville754
- 656371,190
- 65638626
- 65640Fair Play1,530
- 65641Eagle Rock606
- 656442,059
- 65646Everton1,961
- 65647Exeter3,077
- 65648Fair Grove5,861
- 65649Fair Play1,932
- 65650Flemington1,454
- 65652Fordland4,649
- 65653Saddlebrooke5,905
- 65654Freistatt245
- 65655Gainesville2,435
- 65656Galena5,031
- 65657Taneyville361
- 65658Arrow Point1,262
- 65660290
- 65661Greenfield2,434
- 65662Grovespring1,137
- 65663Halfway2,700
- 65664Halltown40
- 65667Hartville3,250
- 65668Hermitage1,846
- 65669Highlandville2,764
- 65672Hollister8,432
- 65674Humansville2,896
- 65675Hurley38
- 65676Sundown461
- 65679Kirbyville2,942
- 65680Kissee Mills1,097
- 65681Coney Island1,709
- 65682Lockwood1,885
- 65685Louisburg794
- 65686Kimberling City4,256
- 65688Brandsville42
- 65689Cabool4,482
- 65690130
- 65692Koshkonong1,068
- 65702Norwood343
- 65704Mansfield5,394
- 65705Billings4,949
- 65706Marshfield17,133
- 65707Miller2,181
- 65708Monett12,869
- 65710Morrisville1,589
- 65711Mountain Grove8,106
- 65712Mount Vernon9,015
- 65713Niangua2,022
- 65714Nixa37,013
- 65715Wasola21
- 65717Norwood2,523
- 65720Sparta400
- 65721Ozark33,452
- 65722Phillipsburg1,391
- 65723Pierce City3,123
- 65724Hermitage1,563
- 65725Pleasant Hope2,501
- 65726Hollister1,093
- 65727Louisburg101
- 65729Pontiac126
- 65730Jane19
- 65731Kirbyville130
- 65732Preston1,342
- 65733801
- 65734Purdy4,112
- 65735Gerster212
- 65737Branson West8,745
- 65738Republic21,283
- 65739Blue Eye865
- 65740Merriam Woods3,508
- 65742Rogersville14,185
- 65744Kissee Mills182
- 65745Seligman3,417
- 65746Seymour9,336
- 65747Shell Knob4,016
- 65752South Greenfield335
- 65753Sparta5,590
- 65754Spokane631
- 65755Wasola636
- 65756Stotts City823
- 65757Strafford8,584
- 65759Taneyville856
- 65760Gainesville538
- 65761Theodosia1,324
- 65762Theodosia445
- 65764Bennett Springs1,449
- 65766Bakersfield77
- 65767Urbana1,983
- 65768166
- 65769Verona2,409
- 65770Walnut Grove2,599
- 65771Saddlebrooke1,394
- 65772Washburn2,063
- 65773Wasola267
- 65774Weaubleau855
- 65775West Plains25,773
- 65777South Fork154
- 65778430
- 65779Wheatland1,053
- 65781Willard9,692
- 65783Bennett Springs127
- 6578421
- 65785Stockton6,002
- 65786Macks Creek2,174
- 65787Macks Creek1,305
- 65788341
- 65789Pomona1,555
- 65790865
- 65791Thayer4,425
- 65793Willow Springs6,004
- 65802Springfield46,739
- 65803Springfield42,882
- 65804Springfield40,935
- 65806Springfield13,692
- 65807Springfield56,659
- 65809Springfield11,384
- 65810Battlefield22,137
- 65897Springfield2,613
Towns and townships
Each of the 299 with people in it, from ACS 2020–2024 5-year estimates: the county subdivisions that are governments of their own. A city, borough or village that is one too is listed with the places above.
- Adams township (DeKalb County)451
- Adams township (Harrison County)143
- Atchison township578
- Athens township2,232
- Bacon township633
- Badger township339
- Baker township263
- Barton City township118
- Bear Creek township119
- Bee Branch township296
- Benton township (Daviess County)489
- Benton township (Linn County)440
- Bethany township3,312
- Bethlehem township1,144
- Big Creek township190
- Blue Mound township (Livingston County)573
- Blue Mound township (Vernon County)301
- Bogard township622
- Bogle township163
- Boone township927
- Bowling Green township54
- Breckenridge township644
- Brookfield township4,706
- Brunswick township1,187
- Bucklin township618
- Buffalo township1,154
- Burdine township3,199
- Butler township74
- Camden township1,861
- Carroll township945
- Carrollton township3,818
- Cass township668
- Castor township4,679
- Cedar township424
- Center township (Dade County)1,927
- Center township (Vernon County)9,372
- Central township340
- Chariton township188
- Charlotte township187
- Chillicothe township9,142
- City township4,284
- Clark township520
- Clay township (Dunklin County)1,101
- Clay township (Harrison County)24
- Clay township (Linn County)321
- Clear Creek township575
- Clinton township (Henry County)8,881
- Clinton township (Texas County)1,133
- Coal township275
- Cockrell township242
- Colfax township (Daviess County)438
- Colfax township (DeKalb County)735
- Colfax township (Harrison County)801
- Combs township123
- Cooper township1,765
- Cotton Hill township4,830
- Cream Ridge township482
- Cunningham township197
- Current township196
- Cypress township90
- Dallas township (DeKalb County)91
- Dallas township (Harrison County)382
- Date township310
- Davis township (Caldwell County)1,124
- Davis township (Henry County)248
- De Witt township139
- Deepwater township (Bates County)219
- Deepwater township (Henry County)712
- Deer Creek township (Bates County)2,481
- Deer Creek township (Henry County)300
- Deerfield township654
- Dover township317
- Doylesport township294
- Drywood township1,152
- Duck Creek township2,813
- East Boone township505
- Egypt township844
- Elk township209
- Elkhart township354
- Elm township247
- Enterprise township63
- Ernest township203
- Eugene township97
- Fairfield township119
- Fairview township (Caldwell County)141
- Fairview township (Henry County)573
- Fairview township (Livingston County)367
- Fields Creek township1,796
- Fox Creek township59
- Franklin township505
- Freeborn township1,447
- Golden City township949
- Gomer township265
- Grand River township (Bates County)514
- Grand River township (Daviess County)266
- Grand River township (DeKalb County)4,230
- Grand River township (Livingston County)145
- Grant township (Caldwell County)1,478
- Grant township (Dade County)82
- Grant township (DeKalb County)302
- Grant township (Harrison County)505
- Grant township (Nodaway County)574
- Grant township (Putnam County)228
- Grantsville township255
- Green township (Livingston County)254
- Green township (Nodaway County)226
- Hamilton township (Caldwell County)2,107
- Hamilton township (Harrison County)186
- Harrison township (Daviess County)79
- Harrison township (Grundy County)139
- Harrison township (Mercer County)127
- Harrison township (Vernon County)202
- Henry township176
- Hill township328
- Holcomb township1,213
- Homer township302
- Honey Creek township166
- Hopkins township535
- Howard township (Bates County)355
- Howard township (Gentry County)60
- Hudson township234
- Huggins township53
- Hughes township301
- Hurricane township845
- Independence township (Dunklin County)11,960
- Independence township (Nodaway County)262
- Jackson township (Daviess County)589
- Jackson township (Gentry County)1,165
- Jackson township (Grundy County)140
- Jackson township (Linn County)274
- Jackson township (Livingston County)556
- Jackson township (Nodaway County)1,103
- Jackson township (Putnam County)102
- Jackson township (Texas County)1,777
- Jamesport township1,491
- Jefferson township (Daviess County)401
- Jefferson township (Grundy County)537
- Jefferson township (Harrison County)92
- Jefferson township (Linn County)695
- Jefferson township (Nodaway County)742
- Keytesville township1,100
- Kidder township1,053
- Kingston township751
- Lake township194
- Lamar township1,524
- Leesville township951
- Leroy township296
- Leslie township231
- Liberty township (Daviess County)986
- Liberty township (Grundy County)461
- Liberty township (Putnam County)55
- Liberty township (Stoddard County)14,846
- Lincoln township (Caldwell County)388
- Lincoln township (Daviess County)135
- Lincoln township (Grundy County)496
- Lincoln township (Harrison County)46
- Lincoln township (Nodaway County)337
- Lincoln township (Putnam County)325
- Lindley township89
- Lockwood township1,242
- Locust Creek township415
- Lone Oak township90
- Lynch township1,266
- Madison township (Grundy County)398
- Madison township (Harrison County)327
- Madison township (Mercer County)231
- Marceline township2,599
- Marion township (Dade County)120
- Marion township (Daviess County)157
- Marion township (Grundy County)329
- Marion township (Harrison County)530
- Marion township (Mercer County)781
- Medicine township (Livingston County)114
- Medicine township (Mercer County)102
- Medicine township (Putnam County)61
- Mendon township303
- Metz township174
- Milford township116
- Miller township388
- Mingo township162
- Mirabile township265
- Monroe township (Daviess County)300
- Monroe township (Livingston County)262
- Monroe township (Nodaway County)362
- Montevallo township686
- Mooresville township201
- Morgan township1,550
- Morris township647
- Moss Creek township36
- Mound township926
- Moundville township628
- Mount Pleasant township5,012
- Musselfork township261
- Myers township75
- Nashville township302
- New Home township151
- New Lisbon township1,012
- New York township197
- Newport township486
- Nodaway township634
- North Morgan township227
- North Salem township73
- North township189
- Northfork township235
- Osage township (Bates County)2,047
- Osage township (Henry County)692
- Osage township (Vernon County)248
- Ozark township (Barton County)896
- Ozark township (Texas County)251
- Parson Creek township723
- Pierce township335
- Pike township3,605
- Pilgrim township249
- Piney township4,871
- Pleasant Gap township214
- Polk township (Dade County)764
- Polk township (DeKalb County)909
- Polk township (Nodaway County)13,968
- Prairie township (Bates County)60
- Prairie township (Carroll County)211
- Ravanna township152
- Rich Hill township1,401
- Richland township (Barton County)307
- Richland township (Putnam County)143
- Richland township (Stoddard County)1,306
- Richland township (Vernon County)124
- Ridge township281
- Rock Prairie township805
- Rockford township (Caldwell County)514
- Rockford township (Carroll County)123
- Rockville township173
- Roubidoux township2,292
- Sac township469
- Salem township (Daviess County)382
- Salem township (Dunklin County)2,439
- Salisbury township2,475
- Salt Creek township103
- Sampsel township404
- Sargent township406
- Shawnee township (Bates County)273
- Shawnee township (Henry County)431
- Sheridan township494
- Sherman township (DeKalb County)444
- Sherman township (Harrison County)85
- Sherman township (Putnam County)363
- Sherrill township5,408
- Smith township150
- Somerset township82
- South Morgan township475
- South township98
- South West township763
- Springfield township285
- Spruce township372
- Stokes Mound township315
- Sugar Creek township535
- Sugartree township19
- Summit township190
- Taylor township117
- Tebo township781
- Trail Creek township174
- Trenton township5,988
- Triplett township137
- Trotter township122
- Union township (Barton County)780
- Union township (Daviess County)1,988
- Union township (Dunklin County)3,349
- Union township (Harrison County)446
- Union township (Nodaway County)292
- Union township (Putnam County)2,571
- Upton township530
- Van Horn township404
- Virgil township631
- Wakenda township207
- Walker township (Henry County)262
- Walker township (Vernon County)765
- Walnut township294
- Washington township (Carroll County)149
- Washington township (Dade County)217
- Washington township (Daviess County)282
- Washington township (DeKalb County)1,853
- Washington township (Grundy County)317
- Washington township (Harrison County)77
- Washington township (Mercer County)368
- Washington township (Nodaway County)357
- Washington township (Vernon County)2,241
- Wayland township120
- West Boone township736
- West Point township335
- Wheeling township463
- White Cloud township503
- White Oak township (Harrison County)302
- White Oak township (Henry County)788
- Wilson township (Gentry County)419
- Wilson township (Grundy County)285
- Wilson township (Putnam County)393
- Windsor township3,387
- Yellow Creek township (Chariton County)207
- Yellow Creek township (Linn County)407
- York township154
School districts
Each of the 516 with people in it, from ACS 2020–2024 5-year estimates. Elementary districts teach the lower grades and secondary districts the upper ones, under them; the rest are unified, teaching every grade.
- Adair County R-I School District1,944
- Adair County R-II School District1,689
- Adrian R-III School District4,335
- Advance R-IV School District3,026
- Affton 101 School District25,816
- Albany R-III School District2,632
- Altenburg 48 School Districtelementary1,247
- Alton R-IV School District3,179
- Appleton City R-II School District2,151
- Arcadia Valley R-II School District5,287
- Archie R-V School District3,515
- Ash Grove R-IV School District5,607
- Atlanta C-3 Schools1,394
- Aurora R-VIII School District10,685
- Ava R-I School District8,209
- Avenue City R-IX School Districtelementary1,593
- Avilla R-XIII School Districtelementary1,183
- Bakersfield R-IV School District1,820
- Ballard R-II School District766
- Bayless School District12,728
- Bell City R-II School District1,318
- Belleview R-III School Districtelementary1,695
- Belton 124 School District28,001
- Bernie R-XIII School District2,775
- Bevier C-4 School District1,321
- Billings R-IV School District2,905
- Bismarck R-V School District3,083
- Blackwater R-II School Districtelementary845
- Blair Oaks R-II School District6,869
- Bloomfield R-XIV School District4,031
- Blue Eye R-V School District4,828
- Blue Springs R-IV School District84,918
- Bolivar R-I School District16,658
- Boncl R-X School Districtelementary583
- Boonville R-I School District10,553
- Bosworth R-V School District538
- Bowling Green R-I School District10,511
- Bradleyville R-I School District951
- Branson R-IV School District31,360
- Braymer C-4 School District1,678
- Breckenridge R-I School District729
- Brentwood School District8,820
- Bronaugh R-VII School District1,138
- Brookfield R-III School District6,045
- Brunswick R-II School District1,319
- Buchanan County R-IV School District2,106
- Bucklin R-II School District975
- Bunker R-III School District1,033
- Butler R-V School District5,797
- Cabool R-IV School District4,789
- Cainsville R-I School District354
- Calhoun R-VIII School District1,037
- Callao C-8 School Districtelementary648
- Camdenton R-III School District31,838
- Cameron R-I School District11,357
- Campbell R-II School District2,845
- Canton R-V School District4,197
- Cape Girardeau 63 School District40,453
- Carl Junction R-I School District16,972
- Carrollton R-VII School District4,856
- Carthage R-IX School District25,141
- Caruthersville 18 School District5,108
- Cassville R-IV School District9,836
- Center 58 School District26,201
- Centerville R-I School Districtelementary828
- Central R-III School District12,218
- Centralia R-VI School District8,375
- Chadwick R-I School District1,447
- Chaffee R-II School District3,811
- Charleston R-I School District6,475
- Chilhowee R-IV School District1,143
- Chillicothe R-II School District12,450
- Clark County R-I School District6,608
- Clarksburg C-2 School Districtelementary718
- Clarkton C-4 School District1,616
- Clayton School District19,163
- Clearwater R-I School District5,963
- Clever R-V School District7,493
- Climax Springs R-IV School District2,060
- Clinton County R-III School District6,028
- Clinton School District12,098
- Cole Camp R-I School District4,699
- Cole County R-I School District4,032
- Cole County R-V School District4,923
- Columbia 93 School District157,730
- Community R-VI School District2,043
- Concordia R-II School District3,599
- Cooper County R-IV School District747
- Cooter R-IV School District786
- Couch R-I School District920
- Cowgill R-VI School Districtelementary356
- Craig R-III School District532
- Crane R-III School District3,419
- Crawford County R-2 School District8,655
- Crawford County R-I School District5,852
- Crocker R-II School District2,574
- Crystal City 47 School District4,266
- Dadeville R-II School District1,073
- Dallas County R-I School District13,773
- Davis R-XII School Districtelementary621
- De Soto 73 School District16,117
- Delta C-7 School District1,117
- Delta R-V School District2,098
- Dent-Phelps R-III School Districtelementary3,314
- Dexter R-XI School District13,125
- Diamond R-IV School District6,395
- Dixon R-I School District6,456
- Doniphan R-I School District8,069
- Dora R-III School District2,070
- Drexel R-IV School District1,849
- Dunklin R-V School District11,657
- East Buchanan County C-1 School District4,560
- East Carter County R-II School District3,371
- East Lynne 40 School Districtelementary1,236
- East Newton County R-VI School District8,107
- East Prairie R-II School District5,427
- El Dorado Springs R-II School District8,795
- Eldon R-I School District12,735
- Elsberry R-II School District4,962
- Eminence R-I School District1,880
- Everton R-III School District1,183
- Excelsior Springs 40 School District16,756
- Exeter R-VI School District2,412
- Fair Grove R-X School District5,958
- Fair Play R-II School District3,200
- Fairfax R-III School District1,085
- Fairview R-XI School Districtelementary4,660
- Farmington R-VII School District30,318
- Fayette R-III School District4,897
- Ferguson-Florissant R-II School District64,285
- Festus R-VI School District19,625
- Fordland R-III School District4,511
- Forsyth R-III School District8,802
- Fort Osage R-I School District25,060
- Fort Zumwalt R-II School District116,620
- Fox C-6 School District71,162
- Francis Howell R-III School District120,664
- Franklin County R-II School Districtelementary1,416
- Fredericktown R-I School District11,483
- Fulton 58 School District18,998
- Gainesville R-V School District2,873
- Galena R-II School District3,845
- Gallatin R-V School District3,414
- Gasconade C-4 School Districtelementary1,170
- Gasconade County R-I School District7,141
- Gasconade County R-II School District11,018
- Gideon 37 School District1,003
- Gilliam C-4 School Districtelementary516
- Gilman City R-IV School District781
- Glasgow School District2,052
- Glenwood R-VIII School Districtelementary2,424
- Golden City R-III School District1,443
- Grain Valley R-V School District22,394
- Grandview C-4 School District32,910
- Grandview R-II School District4,671
- Green City R-I School District1,663
- Green Forest R-II School Districtelementary1,365
- Green Ridge R-VIII School District2,433
- Greenfield R-IV School District2,815
- Greenville R-II School District4,041
- Grundy County R-V School District1,241
- Hale R-I School District939
- Halfway R-III School District2,439
- Hallsville R-IV School District7,840
- Hamilton R-II School District3,644
- Hancock Place School District8,533
- Hannibal 60 School District22,218
- Hardeman R-X School Districtelementary574
- Hardin-Central C-2 School District1,441
- Harrisburg R-VIII School District3,693
- Harrisonville R-IX School District14,079
- Hartville R-II School District4,563
- Hayti R-II School District3,219
- Hazelwood School District120,450
- Henry County R-I School District4,563
- Hermitage R-IV School District3,333
- Hickman Mills C-1 School District46,812
- Hickory County R-I School District4,802
- Higbee R-VIII School District1,468
- High Point R-III School Districtelementary686
- Hillsboro R-III School District23,513
- Holcomb R-III School District2,397
- Holden R-III School District8,775
- Holliday C-2 School Districtelementary503
- Hollister R-V School District10,350
- Houston R-I School District5,426
- Howell Valley R-I School Districtelementary2,521
- Hudson R-IX School Districtelementary419
- Humansville R-IV School District3,123
- Hume R-VIII School District648
- Hurley R-I School District1,660
- Iberia R-V School District3,127
- Independence 30 School District98,857
- Iron County C-4 School District2,276
- Jackson R-II School District35,023
- Jamestown C-1 School District1,275
- Jasper County R-V School District2,792
- Jefferson C-123 School District864
- Jefferson City Public Schools73,144
- Jefferson County R-VII School Districtelementary6,793
- Jennings School District15,484
- Johnson County R-VII School District3,295
- Joplin School District61,584
- Junction Hill C-12 School Districtelementary2,093
- Kansas City 33 School District204,259
- Kearney R-I School District20,827
- Kelso C-7 School Districtelementary2,389
- Kennett 39 School District9,766
- Keytesville R-III School District1,387
- King City R-I School District1,705
- Kingston 42 School Districtelementary402
- Kingston K-14 School District3,680
- Kingsville R-I School District2,231
- Kirbyville R-VI School Districtelementary2,736
- Kirksville R-III School District21,531
- Kirkwood R-VII School District43,373
- Knob Noster R-VIII School District9,798
- Knox County R-I School District3,756
- La Monte R-IV School District1,892
- La Plata R-II School District2,347
- Laclede County C-5 School Districtelementary3,846
- Laclede County R-I School District3,502
- Ladue School District27,794
- Lafayette County C-1 School District6,756
- Lakeland R-III School District2,922
- Lamar R-I School District7,082
- Laquey R-V School District2,674
- Laredo R-VII School Districtelementary395
- Lathrop R-II School District4,605
- Lawson R-XIV School District6,507
- Lebanon R-III School District25,873
- Lee's Summit R-VII School District105,977
- Leesville R-IX School Districtelementary951
- Leeton R-X School District2,064
- Leopold R-III School District761
- Lesterville R-IV School District1,248
- Lewis County C-1 School District6,092
- Lexington R-V School District6,140
- Liberal R-II School District2,953
- Liberty 53 School District64,011
- Licking R-VIII School District6,824
- Lincoln R-II School District4,892
- Lindbergh School District50,233
- Linn County R-I School District1,175
- Livingston County R-III School Districtelementary546
- Lockwood R-I School District2,225
- Logan-Rogersville R-VIII School District15,136
- Lone Jack C-6 School District3,727
- Lonedell R-XIV School Districtelementary3,165
- Louisiana R-II School District4,417
- Lutie R-VI School District1,683
- Macks Creek R-V School District2,246
- Macon County R-I School District8,751
- Macon County R-IV School District710
- Madison C-3 School District1,264
- Malden R-I School District5,362
- Malta Bend R-V School District588
- Manes R-V School Districtelementary479
- Mansfield R-IV School District5,434
- Maplewood-Richmond Heights School District14,412
- Marceline R-V School District3,435
- Maries County R-I School District4,008
- Maries County R-II School District5,170
- Marion C. Early R-V School District4,035
- Marion County R-II School District1,592
- Marionville R-IX School District4,830
- Mark Twain R-VIII School Districtelementary991
- Marquand-Zion R-VI School District1,317
- Marshall School District15,583
- Marshfield R-I School District19,123
- Maryville R-II Schools14,076
- Maysville R-I School District3,663
- McDonald County R-I School District19,872
- Meadow Heights R-II School District3,251
- Meadville R-IV School District1,344
- Mehlville R-IX School District94,976
- Meramec Valley R-III School District23,491
- Mexico 59 School District15,125
- Miami R-I School District963
- Miami R-I School Districtelementary338
- Mid-Buchanan County R-V School District4,319
- Middle Grove C-1 School Districtelementary578
- Midway R-I School District3,604
- Milan C-2 School District3,223
- Miller County R-III School District1,462
- Miller R-II School District3,571
- Mirabile C-1 School Districtelementary452
- Missouri City 56 School Districtelementary410
- Moberly School District15,489
- Monett R-I School District12,386
- Moniteau County R-I School District7,265
- Moniteau County R-V School Districtelementary1,533
- Monroe City R-I School District6,075
- Montgomery County R-II School District7,842
- Montrose R-XIV School District868
- Morgan County R-I School District5,185
- Morgan County R-II School District11,212
- Mound City R-II School District1,586
- Mount Vernon R-V School District10,369
- Mountain Grove R-III School District7,975
- Mountain View-Birch Tree R-III School District7,458
- Naylor R-II School District1,243
- Neelyville R-IV School District2,774
- Nell Holcomb R-IV School Districtelementary2,370
- Neosho R-V School District25,910
- Nevada R-V School District13,527
- New Bloomfield R-III School District4,400
- New Franklin R-I School District2,677
- New Haven School District3,692
- New Madrid County R-I School District7,444
- New York R-IV School Districtelementary210
- Newburg R-II School District3,140
- Newtown-Harris R-III School District394
- Niangua R-V School District2,316
- Nixa School District35,348
- Nodaway-Holt R-VII School District1,379
- Norborne R-VIII School District1,101
- Normandy Schools Collaborative33,245
- North Andrew County R-VI School District1,810
- North Callaway County R-I School District6,529
- North Daviess R-III School District761
- North Harrison R-III School District1,721
- North Kansas City 74 School District144,320
- North Mercer County R-III School District939
- North Nodaway County R-VI School District1,020
- North Pemiscot County R-I School District1,355
- North Platte County R-I School District4,179
- North Shelby School District1,888
- North St. Francis County R-I School District20,539
- North Wood R-IV School Districtelementary1,836
- Northeast Nodaway County R-V School District1,461
- Northeast Randolph County R-IV School District2,238
- Northeast Vernon County R-I School District2,211
- Northwest R-I School District44,026
- Northwestern R-I School District780
- Norwood R-I School District2,047
- Oak Grove R-VI School District11,803
- Oak Hill R-I School Districtelementary1,321
- Oak Ridge R-VI School District2,759
- Odessa R-VII School District12,334
- Oran R-III School District1,861
- Orchard Farm R-V School District15,287
- Orearville R-IV School Districtelementary360
- Oregon-Howell R-III School District1,288
- Orrick R-XI School District1,696
- Osage County R-I School District996
- Osage County R-II School District5,165
- Osage County R-III School District6,254
- Osborn R-O School District807
- Osceola School District2,998
- Otterville R-VI School District1,816
- Ozark R-VI School District34,980
- Palmyra R-I School District6,641
- Paris R-II School District3,072
- Park Hill School District77,197
- Parkway C-2 School District142,507
- Pattonsburg R-II School District989
- Pattonville R-III School District40,702
- Pemiscot County R-III School Districtelementary999
- Perry County 32 School District17,616
- Pettis County R-V School District2,313
- Pettis County R-XII School Districtelementary1,583
- Phelps County R-III School Districtelementary1,690
- Pierce City R-VI School District4,447
- Pike County R-III School District2,727
- Pilot Grove C-4 School District1,838
- Plainview R-VIII School Districtelementary1,005
- Plato R-V School District3,450
- Platte County R-III School District27,544
- Pleasant Hill R-III School District11,568
- Pleasant Hope R-VI School District5,337
- Pleasant View R-VI School Districtelementary565
- Polo R-VII School District2,014
- Poplar Bluff R-I School District32,846
- Portageville School District3,579
- Potosi R-III School District13,224
- Prairie Home R-V School District1,499
- Princeton R-V School District2,495
- Purdy R-II School District3,735
- Putnam County R-I School District4,615
- Puxico R-VIII School District4,279
- Ralls County R-II School District5,269
- Raymondville R-VII School Districtelementary1,550
- Raymore-Peculiar R-II School District40,478
- Raytown C-2 School District61,026
- Reeds Spring R-IV School District16,328
- Renick R-V School Districtelementary1,329
- Republic R-III School District30,748
- Rich Hill R-IV School District2,636
- Richards R-V School Districtelementary3,743
- Richland R-I School District1,476
- Richland R-IV School District3,216
- Richmond R-XVI School District9,049
- Richwoods R-VII School Districtelementary1,607
- Ridgeway R-V School District708
- Ripley County R-III School Districtelementary836
- Ripley County R-IV School Districtelementary635
- Risco R-II School District775
- Ritenour School District42,730
- Riverview Gardens School District34,032
- Rock Port R-II School District2,219
- Rockwood R-VI School District122,218
- Rolla 31 School District31,736
- Roscoe C-1 School Districtelementary591
- Salem R-80 School District6,391
- Salisbury R-IV School District3,248
- Santa Fe R-X School District2,672
- Sarcoxie R-II School District3,882
- Savannah R-III School District13,943
- School of The Osage School District13,690
- Schuyler County R-I School District4,062
- Scotland County R-I School District4,686
- Scott City R-I School District5,406
- Scott County Central Schools1,620
- Scott County R-IV School District5,349
- Sedalia 200 School District30,379
- Senath-Hornersville C-8 School District3,831
- Seneca R-VII School District9,989
- Seymour R-II School District7,471
- Shawnee R-III School Districtelementary622
- Shelby County R-IV School District3,991
- Sheldon R-VIII School District971
- Shell Knob 78 School Districtelementary2,884
- Sherwood Cass R-VIII School District4,720
- Sikeston R-VI School District20,474
- Silex R-I School District3,303
- Skyline R-II School Districtelementary1,182
- Slater School District2,149
- Smithton R-VI School District3,194
- Smithville R-II School District14,791
- South Callaway County R-II School District4,089
- South Harrison County R-II School District4,776
- South Holt County R-I School District1,620
- South Iron County R-I School District1,599
- South Nodaway County R-IV School District941
- South Pemiscot County R-V School District2,382
- Southern Boone County R-I School District10,388
- Southern Reynolds County R-II School District2,928
- Southland C-9 School District1,668
- Southwest Livingston County R-I School District1,008
- Southwest R-V School District4,861
- Sparta R-III School District5,190
- Spickard R-II School Districtelementary627
- Spokane R-VII School District4,900
- Spring Bluff R-XV School Districtelementary2,070
- Springfield R-XII School District220,023
- St. Charles R-VI School District53,814
- St. Clair R-XIII School District11,990
- St. Elizabeth R-IV School District1,674
- St. James R-I School District9,434
- St. Joseph School District74,701
- St. Louis City School District288,512
- Stanberry R-II School District2,231
- Ste. Genevieve County R-II School District15,440
- Steelville R-III School District5,179
- Stewartsville C-2 School District1,441
- Stockton R-I School District7,353
- Stoutland R-II School District2,933
- Strafford R-VI School District7,563
- Strain-Japan R-XVI School Districtelementary797
- Strasburg C-3 School Districtelementary1,526
- Sturgeon R-V School District3,540
- Success R-VI School Districtelementary1,232
- Sullivan C-2 School District10,712
- Summersville R-II School District2,370
- Sunrise R-IX School Districtelementary3,871
- Swedeborg R-III School Districtelementary494
- Sweet Springs R-VII School District2,486
- Taneyville R-II School Districtelementary1,336
- Tarkio R-I School District1,883
- Thayer R-II School District3,766
- Thornfield R-I School Districtelementary699
- Tina-Avalon R-II School District1,007
- Tipton R-VI School District5,364
- Trenton R-IX School District7,192
- Tri-County R-VII School District2,302
- Troy R-III School District42,437
- Twin Rivers R-X School District5,696
- Union R-XI School District22,088
- Union Star R-II School District1,154
- University City School District35,253
- Valley Park School District8,674
- Valley R-VI School District2,492
- Van Buren R-I School District2,514
- Van-Far R-I School District4,377
- Verona R-VII School District1,804
- Walnut Grove R-V School District1,932
- Warren County R-III School District20,556
- Warrensburg R-VI School District25,919
- Warsaw R-IX School District11,401
- Washington School District34,631
- Waynesville R-VI Schools40,140
- Weaubleau R-III School District2,788
- Webb City R-VII School District24,196
- Webster Groves School District33,219
- Wellington-Napoleon R-IX School District1,888
- Wellsville-Middletown R-I School District2,755
- Wentzville R-IV School District106,353
- West Nodaway County R-I School District1,523
- West Plains R-VII School District12,499
- West Platte County R-II School District4,208
- West St. Francois County R-IV School District5,302
- Westran R-I School District3,590
- Westview C-6 School Districtelementary1,453
- Wheatland R-II School District1,784
- Wheaton R-III School District2,279
- Willard R-II School District25,873
- Willow Springs R-IV School District7,581
- Windsor C-1 School District18,917
- Winfield R-IV School District10,623
- Winona R-III School District2,172
- Winston R-VI School District1,063
- Woodland R-IV School District4,819
- Worth County R-III School District1,927
- Wright City R-II of Warren County12,801
- Zalma R-V School District1,408
Congressional districts
As drawn for the 119th Congress (2025–2027).
- Congressional District 1752,720
- Congressional District 2771,008
- Congressional District 3780,389
- Congressional District 4782,304
- Congressional District 5772,256
- Congressional District 6775,000
- Congressional District 7785,302
- Congressional District 8772,835
State senate districts
The upper chamber’s districts, as drawn in 2024.
- State Senate District 1181,511
- State Senate District 2181,966
- State Senate District 3178,726
- State Senate District 4178,567
- State Senate District 5172,690
- State Senate District 6182,947
- State Senate District 7174,245
- State Senate District 8182,128
- State Senate District 9180,771
- State Senate District 10188,126
- State Senate District 11182,832
- State Senate District 12181,219
- State Senate District 13183,768
- State Senate District 14187,495
- State Senate District 15183,426
- State Senate District 16177,432
- State Senate District 17178,982
- State Senate District 18176,703
- State Senate District 19188,043
- State Senate District 20181,924
- State Senate District 21185,602
- State Senate District 22182,569
- State Senate District 23181,378
- State Senate District 24182,698
- State Senate District 25176,114
- State Senate District 26185,201
- State Senate District 27178,388
- State Senate District 28188,345
- State Senate District 29190,242
- State Senate District 30181,282
- State Senate District 31181,691
- State Senate District 32184,475
- State Senate District 33182,136
- State Senate District 34188,192
State house districts
The lower chamber’s districts, as drawn in 2024.
- State House District 136,446
- State House District 237,315
- State House District 337,438
- State House District 437,169
- State House District 538,885
- State House District 637,284
- State House District 737,877
- State House District 839,148
- State House District 937,263
- State House District 1037,661
- State House District 1137,080
- State House District 1240,591
- State House District 1340,092
- State House District 1438,515
- State House District 1538,468
- State House District 1638,858
- State House District 1738,914
- State House District 1837,727
- State House District 1937,856
- State House District 2038,833
- State House District 2139,328
- State House District 2235,823
- State House District 2336,877
- State House District 2436,969
- State House District 2536,271
- State House District 2636,658
- State House District 2739,093
- State House District 2837,343
- State House District 2938,179
- State House District 3037,413
- State House District 3138,451
- State House District 3239,166
- State House District 3339,874
- State House District 3439,108
- State House District 3538,715
- State House District 3636,597
- State House District 3737,422
- State House District 3838,447
- State House District 3939,652
- State House District 4040,032
- State House District 4140,736
- State House District 4240,528
- State House District 4338,531
- State House District 4437,425
- State House District 4537,841
- State House District 4636,310
- State House District 4736,531
- State House District 4836,395
- State House District 4939,232
- State House District 5039,936
- State House District 5138,745
- State House District 5237,022
- State House District 5337,496
- State House District 5437,600
- State House District 5539,284
- State House District 5639,633
- State House District 5740,647
- State House District 5837,189
- State House District 5938,967
- State House District 6038,065
- State House District 6138,311
- State House District 6238,171
- State House District 6337,340
- State House District 6440,779
- State House District 6537,033
- State House District 6636,220
- State House District 6739,131
- State House District 6839,150
- State House District 6937,466
- State House District 7036,878
- State House District 7136,599
- State House District 7236,476
- State House District 7336,746
- State House District 7439,248
- State House District 7534,799
- State House District 7633,687
- State House District 7734,507
- State House District 7835,770
- State House District 7934,601
- State House District 8037,564
- State House District 8138,075
- State House District 8237,821
- State House District 8335,890
- State House District 8436,487
- State House District 8534,995
- State House District 8636,513
- State House District 8736,165
- State House District 8838,935
- State House District 8935,614
- State House District 9036,338
- State House District 9136,102
- State House District 9236,538
- State House District 9336,354
- State House District 9437,014
- State House District 9535,742
- State House District 9636,325
- State House District 9738,005
- State House District 9837,750
- State House District 9936,709
- State House District 10037,434
- State House District 10138,187
- State House District 10237,165
- State House District 10335,382
- State House District 10437,507
- State House District 10535,465
- State House District 10638,853
- State House District 10737,465
- State House District 10840,080
- State House District 10939,729
- State House District 11037,717
- State House District 11136,408
- State House District 11236,711
- State House District 11339,026
- State House District 11440,510
- State House District 11538,798
- State House District 11638,690
- State House District 11738,806
- State House District 11838,427
- State House District 11939,412
- State House District 12037,336
- State House District 12139,317
- State House District 12238,756
- State House District 12339,673
- State House District 12437,758
- State House District 12538,887
- State House District 12637,814
- State House District 12736,805
- State House District 12838,141
- State House District 12940,352
- State House District 13039,837
- State House District 13137,780
- State House District 13236,389
- State House District 13338,519
- State House District 13437,201
- State House District 13536,831
- State House District 13638,415
- State House District 13738,403
- State House District 13840,267
- State House District 13940,560
- State House District 14040,603
- State House District 14139,598
- State House District 14239,906
- State House District 14340,049
- State House District 14437,927
- State House District 14537,547
- State House District 14638,806
- State House District 14739,290
- State House District 14837,933
- State House District 14936,840
- State House District 15036,847
- State House District 15139,587
- State House District 15238,417
- State House District 15339,490
- State House District 15439,304
- State House District 15539,080
- State House District 15639,364
- State House District 15738,593
- State House District 15839,133
- State House District 15939,778
- State House District 16039,941
- State House District 16137,145
- State House District 16236,186
- State House District 16338,838
PUMAs
Public Use Microdata Areas: areas of 100,000 people or more that the state draws from census tracts, for the Census Bureau’s microdata.
- Boone (Outside Columbia City), Cole, Callaway & Moniteau PUMA167,678
- Boone County–Columbia City PUMA142,138
- Buchanan, Andrew & DeKalb Counties PUMA112,509
- Butler, Ripley, Wayne, Madison, Iron, Reynolds, Dent, Shannon & Carter Counties PUMA118,788
- Camden, Miller, Morgan & Moniteau Counties PUMA105,915
- Cape Girardeau & Scott Counties PUMA120,668
- Cass & Bates Counties PUMA126,959
- Christian, Greene (Outside Springfield City) & Webster Counties PUMA175,920
- Clay County (Northeast) PUMA118,881
- Dunklin, Stoddard, New Madrid, Pemiscot, Mississippi & Bollinger Counties PUMA109,113
- Franklin & Carter Counties PUMA128,747
- Greene County–Springfield City (North) PUMA126,409
- Greene County–Springfield City (South) PUMA134,461
- Howell, Texas, Wright, Douglas, Oregon & Ozark Counties PUMA114,020
- Jackson County (East) PUMA143,149
- Jackson County (North Central) PUMA133,437
- Jackson County (South Central) PUMA115,293
- Jackson County–Kansas City (Central) PUMA182,719
- Jackson County–Kansas City (South) PUMA145,378
- Jasper & Newton Counties PUMA184,475
- Jefferson County (North) PUMA113,733
- Jefferson County (South) PUMA116,134
- Johnson, Lafayette, Ray, Clinton & Caldwell Counties PUMA141,333
- Kansas City (North Central), Gladstone City & North Kansas City PUMA139,241
- Laclede, Polk, Benton, Dallas & Hickory Counties PUMA115,121
- Lawrence, Henry, Vernon, Cedar, Barton, St. Clair & Dade Counties PUMA124,141
- Lincoln, Warren, Audrain, Pike & Montgomery Counties PUMA153,919
- Northeast Missouri PUMA119,110
- Northwest Missouri PUMA109,069
- Pettis, Randolph, Saline, Cooper, Howard, Carroll & Chariton Counties PUMA133,765
- Phelps, Gasconade, Osage, Maries & Pulaski Counties PUMA135,686
- Platte County PUMA110,371
- St. Charles County (Northeast) PUMA137,524
- St. Charles County (Northwest) PUMA159,191
- St. Charles County (South) PUMA117,820
- St. Francois, Washington, Perry & Ste. Genevieve Counties PUMA128,016
- St. Louis City (North) PUMA116,192
- St. Louis City (South) PUMA172,320
- St. Louis County (Inner Ring Central) PUMA101,708
- St. Louis County (Inner Ring North) PUMA162,625
- St. Louis County (Inner Ring South) PUMA158,314
- St. Louis County (Northeast) PUMA124,167
- St. Louis County (Northwest) PUMA116,839
- St. Louis County (Southeast) PUMA104,876
- St. Louis County (Southwest) PUMA118,590
- St. Louis County (West) PUMA108,041
- Taney, Barry, Stone & McDonald Counties PUMA147,311
Urban areas
Each that reaches into Missouri, with its whole population. Urban areas are the densely settled land the Census Bureau draws after each census, whatever the city lines.
- Aurora, MO7,948
- Bolivar, MO10,863
- Bonne Terre, MO6,333
- Boonville, MO7,725
- Branson, MO28,721
- Brookfield, MO3,909
- Camdenton, MO5,611
- Cameron, MO8,488
- Cape Girardeau, MO–IL56,234
- Carthage, MO16,186
- Caruthersville, MO5,061
- Chillicothe, MO8,923
- Clinton, MO8,456
- Columbia, MO143,459
- De Soto, MO7,810
- Dexter, MO9,573
- Eldon, MO4,529
- Eureka, MO16,223
- Excelsior Springs, MO9,926
- Farmington, MO32,800
- Fayetteville–Springdale–Rogers, AR–MO391,814
- Forsyth, MO7,324
- Fort Leonard Wood–St. Robert–Waynesville, MO30,359
- Fredericktown, MO5,229
- Fulton, MO12,071
- Hannibal, MO17,284
- Harrisonville, MO9,402
- Higginsville, MO4,641
- Holts Summit, MO5,155
- Jefferson City, MO50,161
- Joplin, MO88,662
- Kansas City, MO–KS1.69M
- Kearney, MO10,865
- Kennett, MO10,336
- Kimberling City, MO4,185
- Kirksville, MO16,854
- Lebanon, MO14,829
- Lee's Summit, MO94,057
- Macon, MO5,410
- Marshall, MO13,407
- Marshfield, MO7,708
- Maryville, MO11,025
- Mexico, MO11,748
- Moberly, MO12,204
- Monett, MO9,757
- Mountain Grove, MO4,174
- Neosho, MO12,999
- Nevada, MO8,020
- Odessa, MO5,520
- Osage Beach, MO7,107
- Pacific, MO8,316
- Peculiar, MO5,925
- Perryville, MO8,035
- Platte City, MO10,855
- Pleasant Hill, MO8,795
- Poplar Bluff, MO20,952
- Republic, MO19,486
- Richmond, MO5,907
- Rolla, MO21,058
- Salem, MO4,726
- Savannah, MO5,253
- Scott City, MO4,994
- Sedalia, MO25,890
- Sikeston, MO18,131
- Smithville, MO9,906
- Springfield, MO288,345
- St. Clair, MO6,149
- St. Joseph, MO–KS75,724
- St. Louis, MO–IL2.14M
- Ste. Genevieve, MO5,010
- Sullivan, MO6,606
- Trenton, MO5,226
- Troy, MO18,316
- Union, MO12,867
- Village of Four Seasons, MO7,262
- Warrensburg, MO20,104
- Warrenton, MO10,224
- Washington, MO14,981
- West Plains, MO11,862
- Whiteman AFB–Knob Noster, MO6,370
- Willard, MO6,076
Turn Missouri into your planning report.
Social Explorer Studio builds an editable profile of any place, with tables and charts beside the county and state, and exports to Word, PDF and Excel.
Questions about Missouri
What is the population of Missouri?
6,270,541 people, according to the ACS 2025 1-year estimates, which the Census Bureau adjusts to match its own population estimate. That’s the 19th largest of the 50 states and DC.
What is the FIPS code for Missouri?
29. Every county’s and place’s FIPS code in Missouri starts with it. The Census Bureau’s full geographic identifier (GEOID) is 0400000US29.
What is the largest city in Missouri?
Kansas City, with 521,203 people. Other large cities here include St. Louis, Springfield and Columbia.
What is the median household income in Missouri?
$75,485 (±$937), according to the ACS 2025 1-year estimates, lower than the US ($84,780).
What is the median age in Missouri?
39.8 years (±0.2), according to the ACS 2025 1-year estimates, higher than the US (39.5).
How much does housing cost in Missouri?
Missouri’s median home value is $271,400 (±$2,495) and its median gross rent is $1,142 (±$15) a month, according to the ACS 2025 1-year estimates. 41.9% (±1.4%) of its renters pay 30% or more of their income on rent.
Is Missouri growing?
Missouri’s population grew 3.1%, from 6,083,672 in 2015 to 6,270,541 in 2025, according to the ACS 1-year estimates.
Where do people who work in Missouri live?
2,619,322 of its 2,863,992 jobs are held by people who live here. Of those who commute in, the most come from Kansas, Illinois, Arkansas.
Where does this census data come from?
The U.S. Census Bureau’s American Community Survey, through Social Explorer’s tables: the latest 1-year estimates where they exist, for the most recent numbers, and 5-year estimates otherwise. Each table lists its code, so you can find it again.
Is this data free to use?
Yes. You can read it, cite it, download the CSV and embed the charts, with no account. To map other variables, compare your own areas or build a report, see Social Explorer’s plans in a live demo.
Sources and how to cite
American Community Survey 2025 1-year estimates, or 2020–2024 5-year estimates where noted, U.S. Census Bureau, from Social Explorer’s tables A00001, A00002, A01004, A04001, A06001, A08001, A09005, A10001, A10003, A10008, A10030, A10036, A10040, A10047, A10055, A10060, A12001, A13004, A14006, A14024, A14028, A16002, A17005, A18002, A18009, A20001, B02002, B09001, B13002, B18101, C16001. Maps by census tract use 2020–2024 5-year estimates, since the 1-year survey doesn’t cover tracts. Commuting: LEHD LODES 2023. These are estimates from a sample, each with its margin of error. Data retrieved November 14, 2026. How these profiles are made.
U.S. Census Bureau, American Community Survey 2025 1-year estimates, or 2020–2024 5-year estimates where noted, via Social Explorer. “Missouri.” https://www.socialexplorer.com/places/missouri. Accessed November 14, 2026.