

Colorado: Population, demographics and census data
Home to 6,012,561 people, the 21st largest of the 50 states and DC, anchored by Denver and Colorado Springs. It grew 10.2% between 2015 and 2025.
- Population
- 6.01M. Census Bureau estimate · Rank 21 of the 50 states and DC
- Median household income
- $99,729 ±$1,273. US $84,780
- Median age
- 38.1 ±0.2. US 39.5
ACS 2025 1-year estimates, U.S. Census Bureau
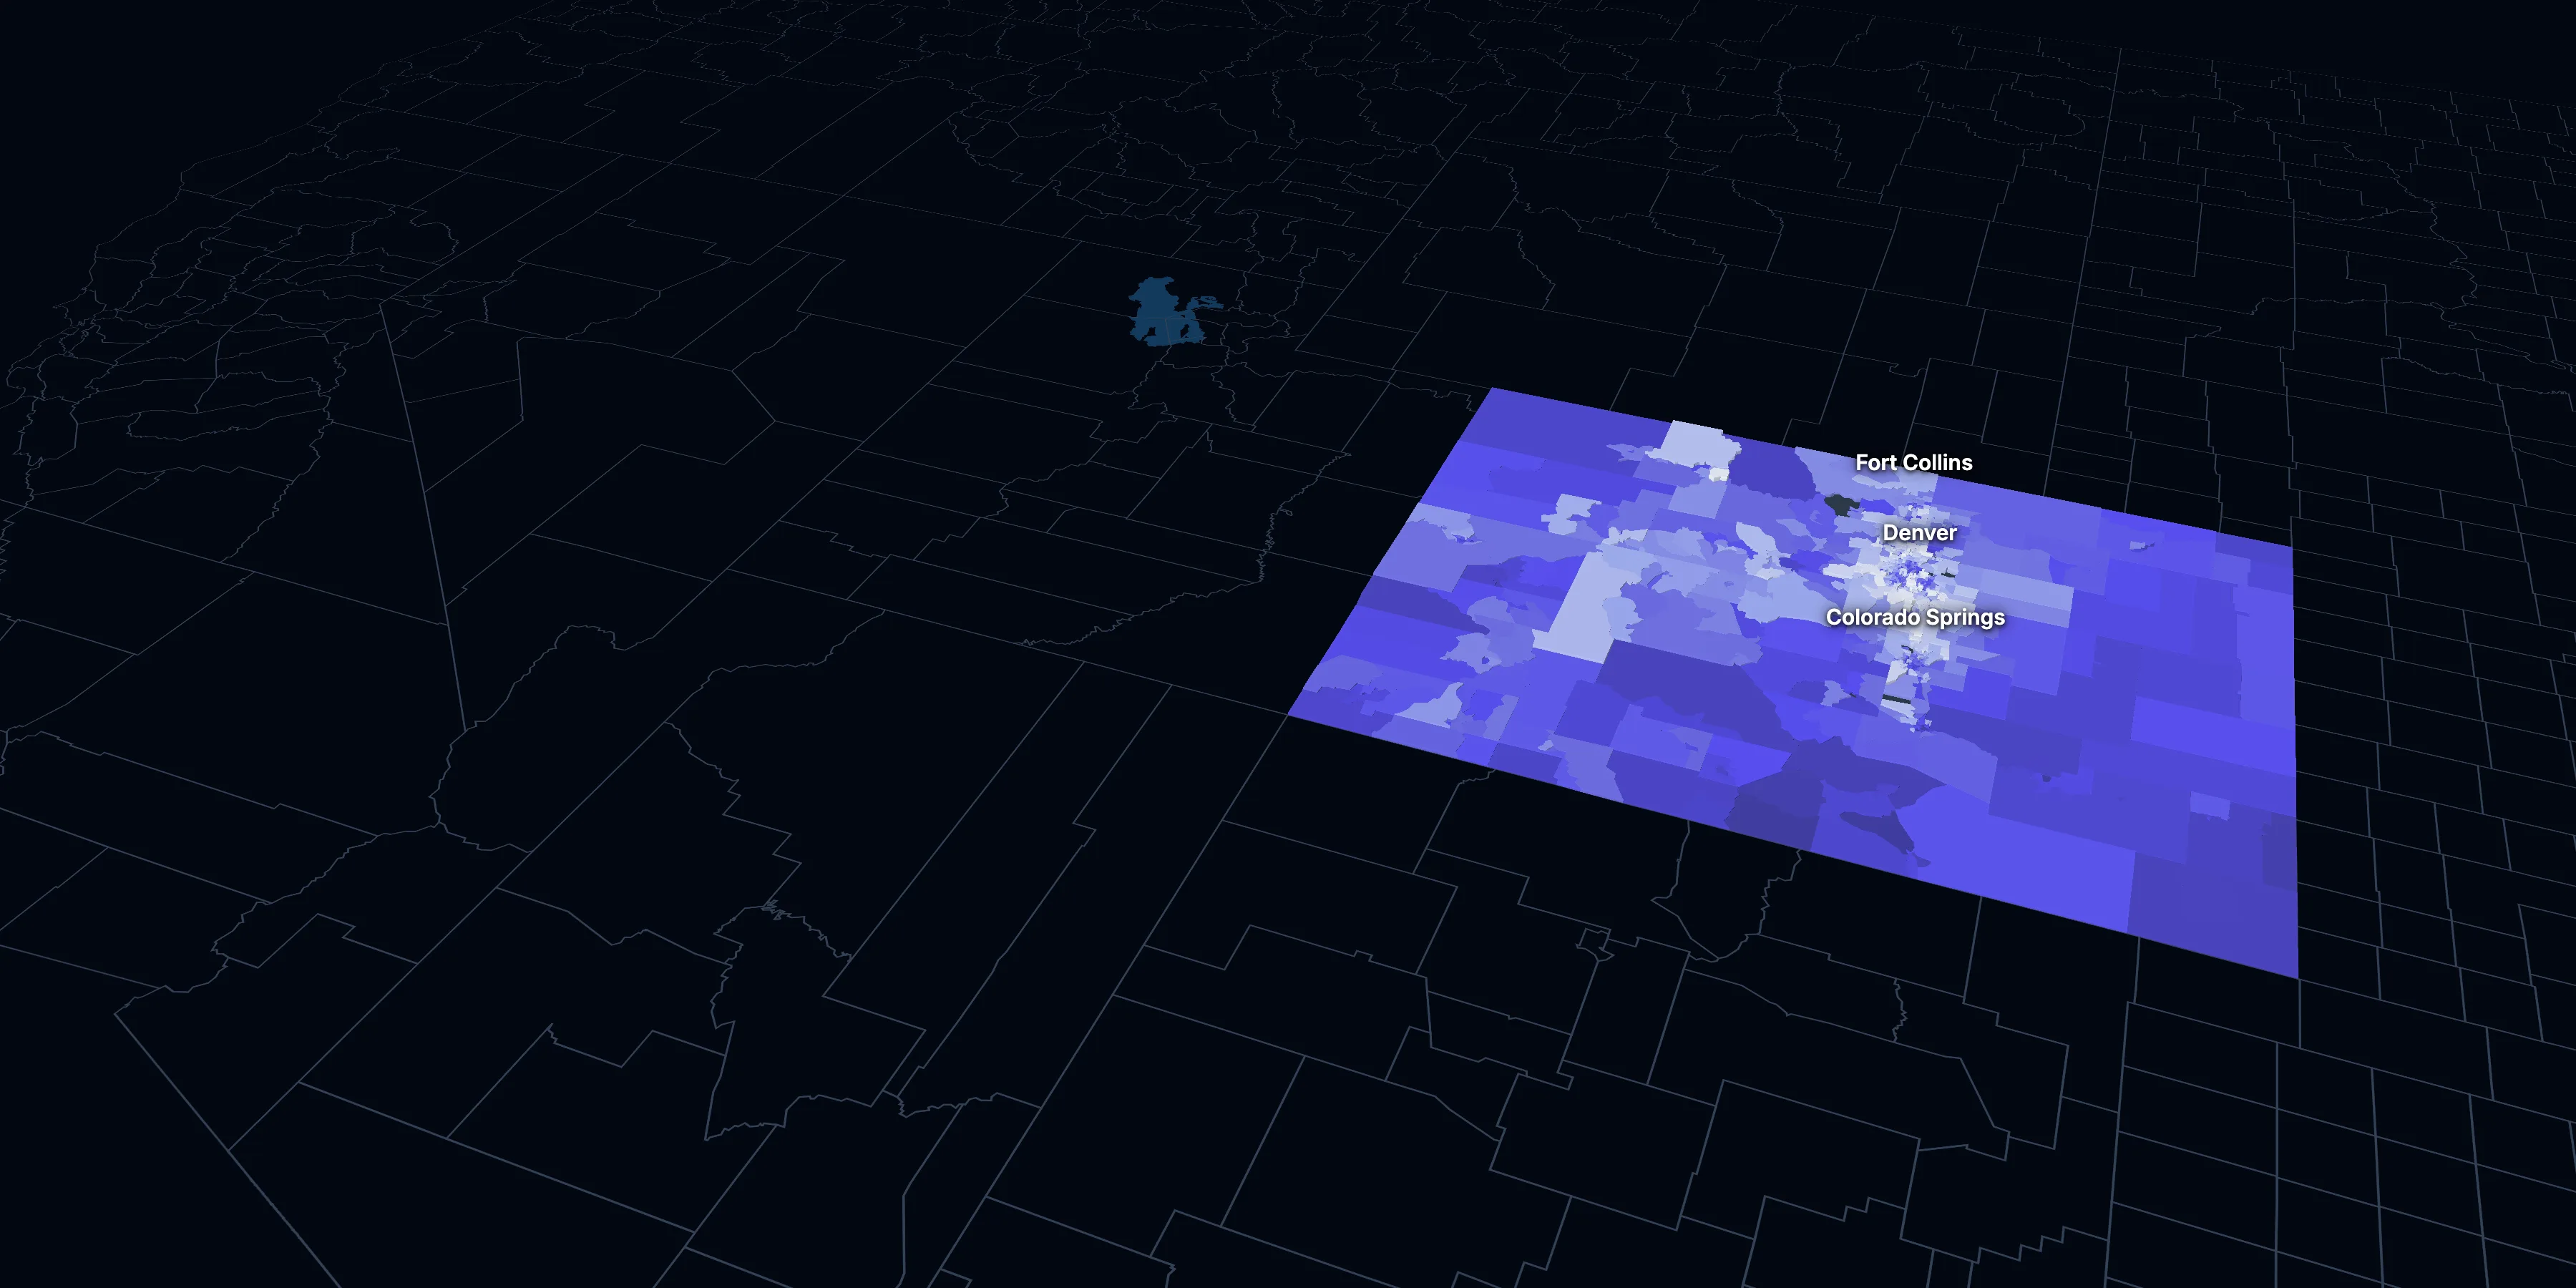
Taller, lighter tracts have higher household incomes
About Colorado
Colorado’s median household income is $99,729 (±$1,273), higher than the US ($84,780), and its median age is 38.1 (±0.2), according to the ACS 2025 1-year estimates. Its largest city is Denver.
± is each figure’s margin of error, at 90% confidence, and † marks one too uncertain to lean on. Under each percentage in the tables is the number it counts. How the margins are worked out.
FIPS code 08
Highlights
What stands out in Colorado
The numbers where Colorado sits furthest from the nation, or past a recognized policy benchmark.
Past a policy benchmark
28.0%
Very highOwners paying 30% or more of income
That’s higher than the US (24.2%). HUD’s 30% standard, applied to homeowners.
+7 points
ElevatedRent growth ahead of income
After inflation, rent grew 21% from 2015 to 2025, and household income 14%. The dots show rent growth.
Furthest from the national picture
47.1%
3rd among statesBachelor’s degree or more
That’s higher than the US (37.4%). It’s the 3rd highest of the 50 states and DC.
$567,600
1.5× the USMedian home value
That’s higher than the US ($371,100). It’s the 6th highest of the 50 states and DC.
18.8%
2nd among statesWork from home
That’s higher than the US (12.9%). It’s the 2nd highest of the 50 states and DC.
$99,729
Higher than the USMedian household income
That’s higher than the US ($84,780).
2015 to 2025
How Colorado changed in ten years
The state added 555,987 people. It got older, more foreign-born and better educated, and poverty fell 2.3 points.
Population, change since 2015
+10.2% in the state and +6.3% in the US.
Source: ACS 1-year, 2015 to 2025, table A00001.
Show data
| Colorado | United States | |
|---|---|---|
| 2015 | 0.0% | 0.0% |
| 2016 | +1.5% | +0.5% |
| 2017 | +2.8% | +1.3% |
| 2018 | +4.4% | +1.8% |
| 2019 | +5.5% | +2.1% |
| 2021 | +6.5% | +3.3% |
| 2022 | +7.0% | +3.7% |
| 2023 | +7.7% | +4.2% |
| 2024 | +9.2% | +5.8% |
| 2025 | +10.2% | +6.3% |
Embed
Median household income, in 2025 dollars
+13.9% in the state and +10.9% in the US.
Source: ACS 1-year, 2015 to 2025, table A14006.
Show data
| Colorado | United States | |
|---|---|---|
| 2015 | $87,557 | $76,413 |
| 2016 | $88,844 | $77,931 |
| 2017 | $91,518 | $79,891 |
| 2018 | $93,006 | $80,059 |
| 2019 | $97,920 | $83,427 |
| 2021 | $98,540 | $83,521 |
| 2022 | $98,926 | $82,811 |
| 2023 | $98,846 | $82,683 |
| 2024 | $100,368 | $84,339 |
| 2025 | $99,729 | $84,780 |
Embed
Living in poverty
−2.3 points in the state and −3.0 points in the US.
Source: ACS 1-year, 2015 to 2025, table A13004.
Show data
| Colorado | United States | |
|---|---|---|
| 2015 | 11.5% | 14.7% |
| 2016 | 11.0% | 14.0% |
| 2017 | 10.3% | 13.4% |
| 2018 | 9.6% | 13.1% |
| 2019 | 9.3% | 12.3% |
| 2021 | 9.7% | 12.8% |
| 2022 | 9.4% | 12.6% |
| 2023 | 9.3% | 12.5% |
| 2024 | 9.6% | 12.1% |
| 2025 | 9.2% | 11.8% |
Embed
Bachelor’s degree or more
+7.9 points in the state and +6.7 points in the US.
Source: ACS 1-year, 2015 to 2025, table A12001.
Show data
| Colorado | United States | |
|---|---|---|
| 2015 | 39.2% | 30.6% |
| 2016 | 39.9% | 31.3% |
| 2017 | 41.2% | 32.0% |
| 2018 | 41.7% | 32.6% |
| 2019 | 42.7% | 33.1% |
| 2021 | 44.4% | 35.0% |
| 2022 | 45.9% | 35.7% |
| 2023 | 46.4% | 36.2% |
| 2024 | 47.8% | 36.8% |
| 2025 | 47.1% | 37.4% |
Embed
Median gross rent, in 2025 dollars
+20.8% in the state and +18.5% in the US.
Source: ACS 1-year, 2015 to 2025, table A18009.
Show data
| Colorado | United States | |
|---|---|---|
| 2015 | $1,522 | $1,314 |
| 2016 | $1,584 | $1,327 |
| 2017 | $1,642 | $1,340 |
| 2018 | $1,666 | $1,368 |
| 2019 | $1,738 | $1,393 |
| 2021 | $1,786 | $1,427 |
| 2022 | $1,823 | $1,440 |
| 2023 | $1,884 | $1,496 |
| 2024 | $1,883 | $1,537 |
| 2025 | $1,839 | $1,557 |
Embed
Median home value, in 2025 dollars
+46.0% in the state and +39.3% in the US.
Source: ACS 1-year, 2015 to 2025, table A10036.
Show data
| Colorado | United States | |
|---|---|---|
| 2015 | $388,812 | $266,469 |
| 2016 | $424,979 | $277,278 |
| 2017 | $461,978 | $288,124 |
| 2018 | $482,524 | $296,908 |
| 2019 | $500,980 | $305,336 |
| 2021 | $558,505 | $337,116 |
| 2022 | $588,333 | $355,481 |
| 2023 | $585,452 | $361,931 |
| 2024 | $593,857 | $372,685 |
| 2025 | $567,600 | $371,100 |
Embed
ACS 1-year estimates. The dotted stretch of each line spans 2020, when the Census Bureau released no standard 1-year estimates. Dollar values are in 2025 dollars.
| Indicator | 2015 | 2025 | Change |
|---|---|---|---|
| Population | 5,456,574 | 6,012,561 | +10.2% |
| Median age | 36.4 | 38.1 | +1.7 years |
| 65 and over | 13.0% | 17.1% | +4.1 points |
| Born outside the US | 9.8% | 10.4% | +0.5 points |
| Hispanic or Latino | 21.3% | 24.1% | +2.8 points |
| Median household income | $87,557 | $99,729 | +13.9% |
| Living in poverty | 11.5% | 9.2% | −2.3 points |
| Bachelor’s degree or more | 39.2% | 47.1% | +7.9 points |
| Households that rent | 36.3% | 34.7% | −1.6 points |
| Median gross rent | $1,522 | $1,839 | +20.8% |
| Median home value | $388,812 | $567,600 | +46.0% |
1447 census tracts
Colorado, tract by tract
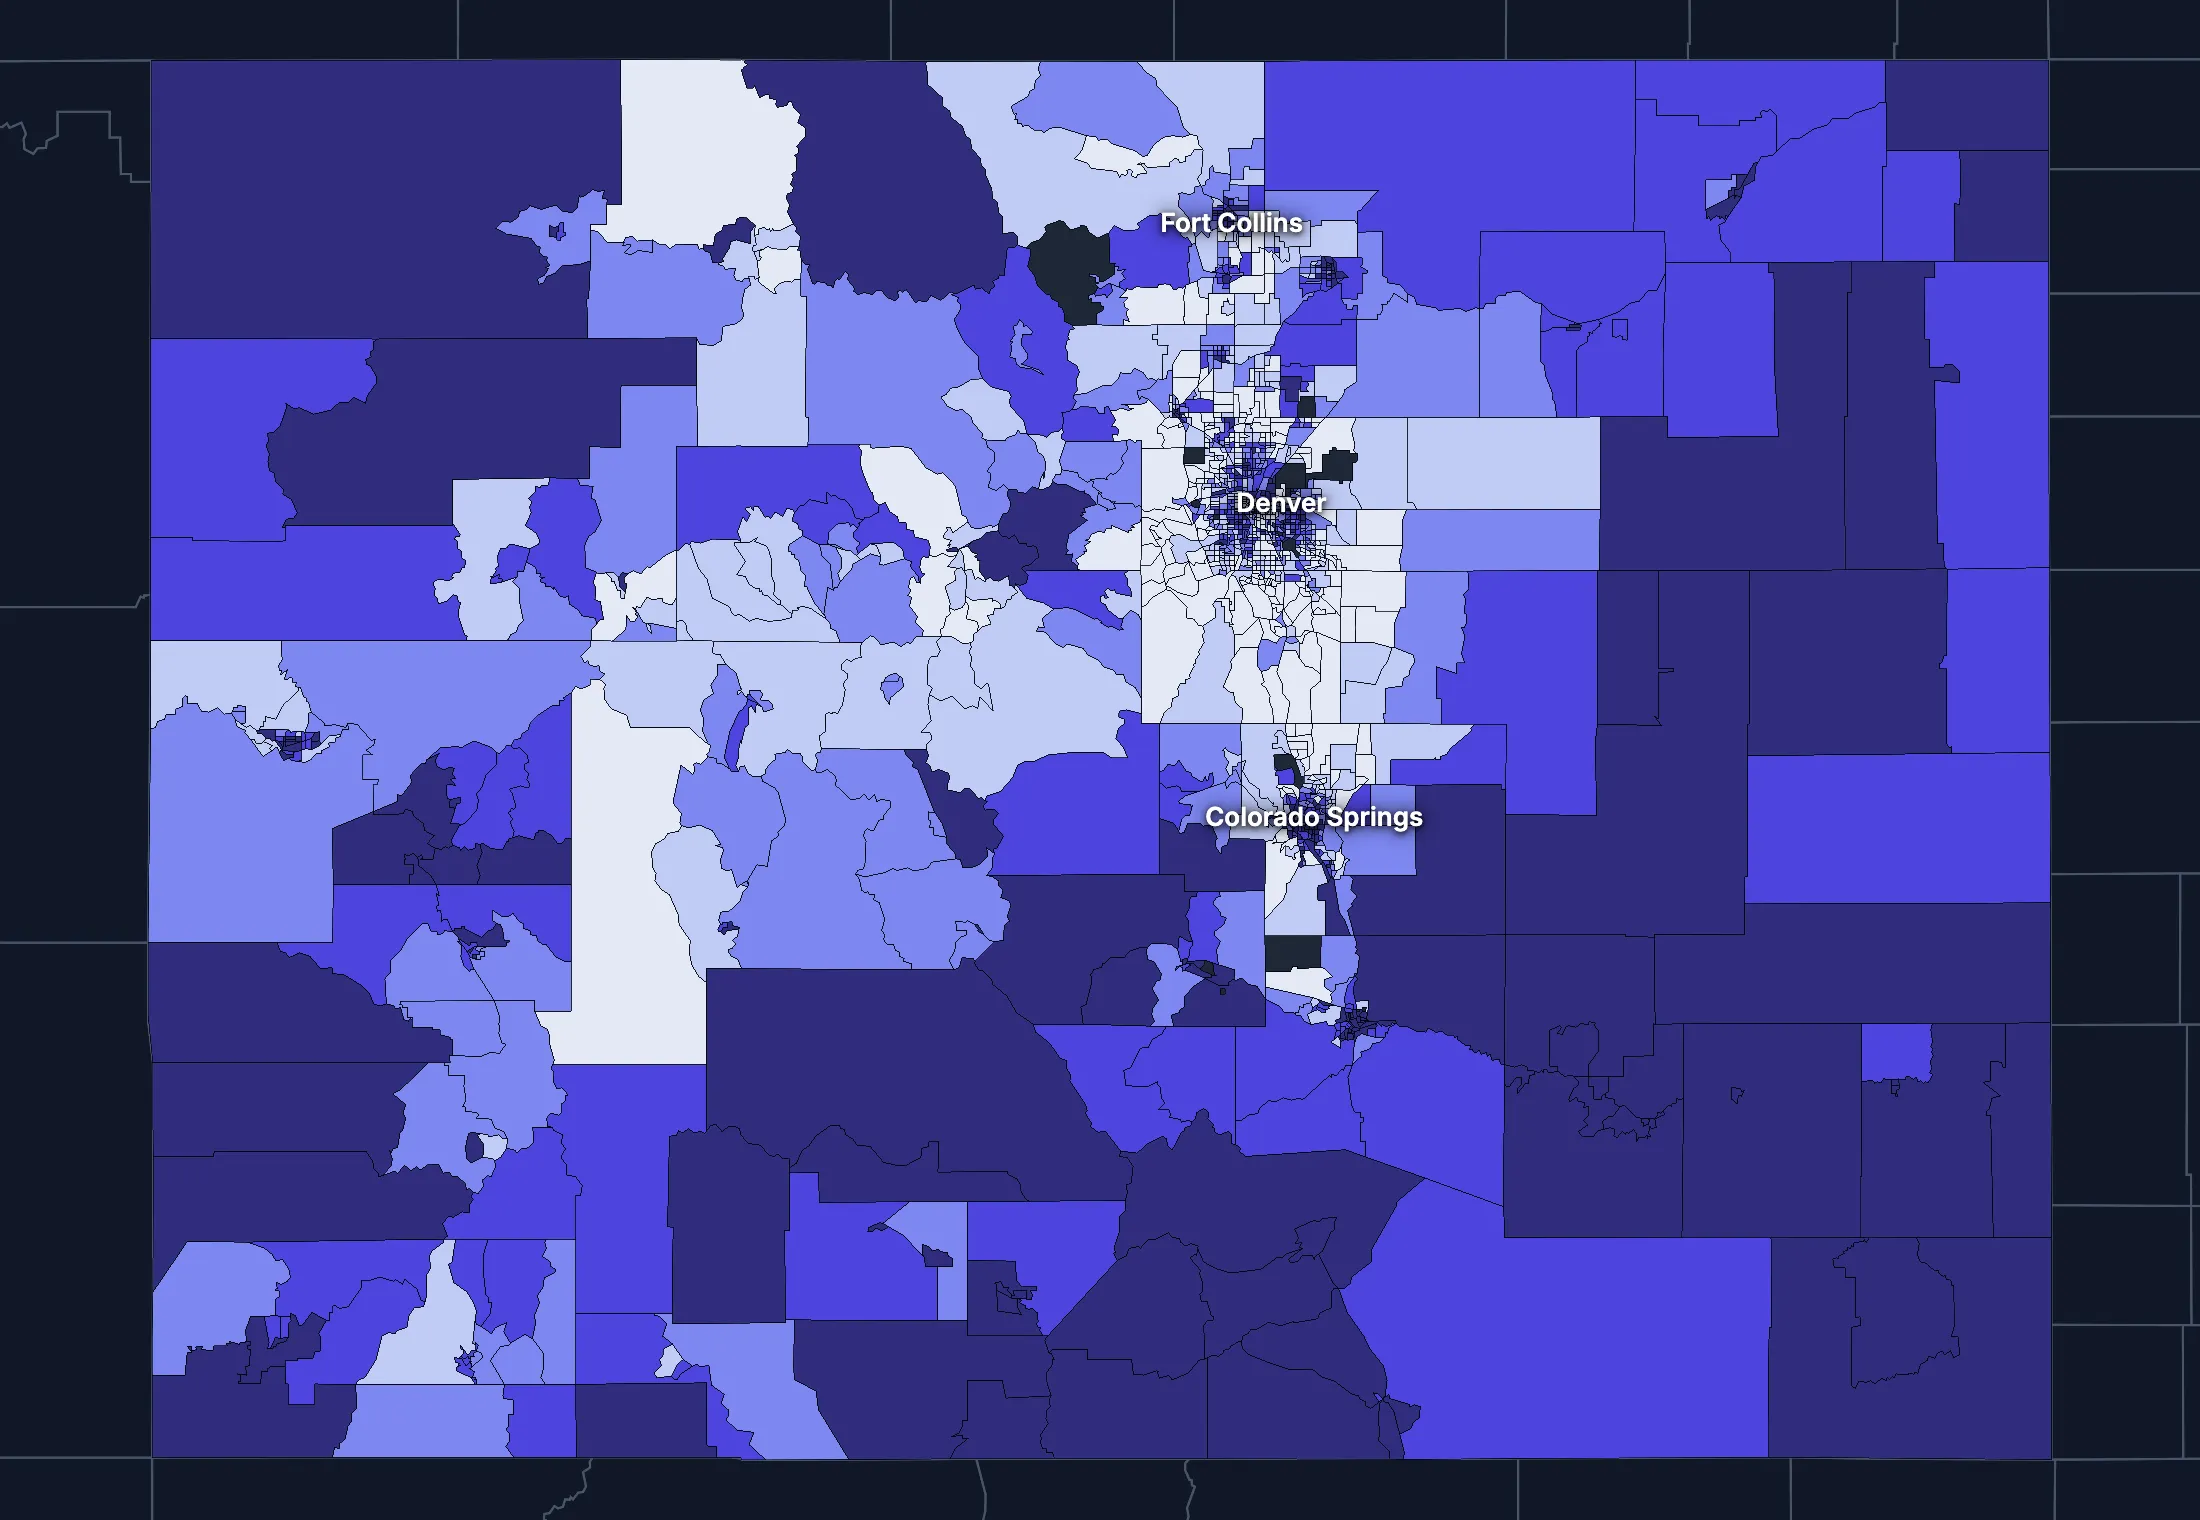
State averages hide a lot. These census tracts are the closest the census comes to neighborhoods.
Where the state’s average misleads
Each tick is one census tract, and the dark line marks the state. Hover over a tick or tap it to see the tract.
Poverty
312 of 1430 tracts are at least 1.5 times the state’s overall 9.4%, and 363 are at two-thirds of it or less.
Highest: Tract 3, 100.0%. Lowest: Tract 85.58, 0.0%.
Renters paying 30% or more of income
53 of 1354 tracts are at least 1.5 times the state’s overall 50.4%, and 268 are at two-thirds of it or less.
Highest: Tract 51.23, 100.0%. Lowest: Tract 56.31, 0.0%.
Adults with a bachelor’s degree
196 of 1435 tracts are at least 1.5 times the state’s overall 45.7%, and 401 are at two-thirds of it or less.
Highest: Tract 9800, 94.2%. Lowest: Tract 38.02, 0.0%.
Median household income
241 of 1425 tracts are at least 1.5 times the typical tract’s $93,482, and 225 are at two-thirds of it or less.
Highest: Tract 56.36, $250,000 or more. Lowest: Tract 126.10, $23,590.
American Community Survey 2020–2024 5-year estimates, by census tract. Income is capped at $250,000+ by the Census Bureau.
People
Who lives in Colorado
Its median age of 38.1 is lower than the US (39.5). 10.4% of residents were born outside the US, and 16.9% speak a language other than English at home.
Age
Source: ACS 2025 1-year, table A01001.
Show data
| Colorado | United States | |
|---|---|---|
| Under 18 | 20.2% ±0.3% , number 1,211,873 ±15,190 | 21.0% ±<0.1% , number 71,689,151 ±111,800 |
| 18 to 24 | 9.2% ±0.2% , number 552,278 ±13,180 | 9.3% ±<0.1% , number 31,716,680 ±98,660 |
| 25 to 34 | 15.8% ±0.1% , number 950,355 ±6,837 | 13.6% ±<0.1% , number 46,357,354 ±55,690 |
| 35 to 44 | 15.0% ±0.3% , number 900,967 ±15,860 | 13.4% ±<0.1% , number 45,746,189 ±105,700 |
| 45 to 54 | 11.8% ±0.1% , number 707,794 ±6,659 | 11.8% ±<0.1% , number 40,257,563 ±53,540 |
| 55 to 64 | 11.0% ±0.2% , number 661,414 ±13,720 | 12.1% ±<0.1% , number 41,242,904 ±104,700 |
| 65 to 74 | 10.0% ±0.2% , number 600,422 ±11,450 | 10.8% ±<0.1% , number 36,895,650 ±91,520 |
| 75 and over | 7.1% ±0.1% , number 427,458 ±8,768 | 8.2% ±<0.1% , number 27,879,368 ±78,140 |
Embed
Race and ethnicity
Source: ACS 2025 1-year, table A04001.
Show data
| Colorado | United States | |
|---|---|---|
| White, not Hispanic | 61.6% ±0.2% , number 3,701,542 ±10,100 | 55.0% ±<0.1% , number 187,959,031 ±58,340 |
| Hispanic or Latino | 24.1% , number 1,448,880 | 20.5% ±<0.1% , number 69,975,516 ±13,270 |
| Black, not Hispanic | 3.9% ±0.1% , number 233,263 ±8,056 | 11.7% ±<0.1% , number 40,096,453 ±106,200 |
| Asian, not Hispanic | 3.7% ±0.1% , number 223,301 ±6,868 | 6.5% ±<0.1% , number 22,096,709 ±58,340 |
| Other or multiracial | 6.7% ±0.3% , number 405,575 ±15,670 | 6.3% ±<0.1% , number 21,657,150 ±150,100 |
Embed
Language spoken at home
Source: ACS 2025 1-year, table C16001.
Show data
| Colorado | United States | |
|---|---|---|
| English only | 83.1% ±0.4% , number 4,740,802 ±22,900 | 77.1% ±0.1% , number 249,390,588 ±275,300 |
| Spanish | 11.4% ±0.4% , number 648,779 ±20,450 | 13.9% ±0.1% , number 44,921,985 ±177,800 |
| Other Indo-European | 2.2% ±0.2% , number 125,233 ±10,840 | 4.0% ±<0.1% , number 12,862,980 ±113,500 |
| Asian and Pacific Island | 2.2% ±0.2% , number 126,557 ±11,000 | 3.8% ±<0.1% , number 12,288,841 ±99,740 |
| Arabic and other | 1.1% ±0.1% , number 60,697 ±8,307 | 1.3% ±<0.1% , number 4,116,949 ±71,480 |
Embed
Marital status
Source: ACS 2025 1-year, table A11001.
Show data
| Colorado | United States | |
|---|---|---|
| Now married | 50.4% ±0.5% , number 2,528,527 ±23,070 | 47.9% ±0.1% , number 135,567,564 ±223,300 |
| Never married | 34.1% ±0.4% , number 1,710,944 ±18,280 | 34.8% ±0.1% , number 98,647,238 ±152,600 |
| Divorced | 10.1% ±0.3% , number 509,014 ±14,020 | 10.2% ±<0.1% , number 28,879,967 ±112,900 |
| Widowed | 4.2% ±0.1% , number 211,390 ±7,183 | 5.5% ±<0.1% , number 15,599,094 ±69,430 |
| Separated | 1.2% ±0.1% , number 61,279 ±5,500 | 1.6% ±<0.1% , number 4,441,399 ±49,160 |
Embed
Where people lived a year ago
Source: ACS 2025 1-year, table A08001.
Show data
| Colorado | United States | |
|---|---|---|
| Same home | 84.9% ±0.5% , number 5,053,885 ±27,620 | 88.4% ±0.1% , number 298,889,697 ±214,800 |
| Same county | 6.9% ±0.4% , number 409,845 ±21,640 | 6.0% ±<0.1% , number 20,202,671 ±166,300 |
| Another county in the state | 4.4% ±0.3% , number 259,792 ±16,220 | 3.0% ±<0.1% , number 10,168,097 ±89,190 |
| Another state | 3.3% ±0.2% , number 194,547 ±11,760 | 2.1% ±<0.1% , number 7,025,589 ±81,660 |
| Another country | 0.6% ±0.1% , number 36,686 ±6,888 | 0.6% ±<0.1% , number 1,984,943 ±47,210 |
Embed
Top countries of birth, among those born abroad
Source: ACS 2025 1-year, table A07001.
Show data
| Colorado | |
|---|---|
| Mexico | 31.8% , number 198,493 |
| India | 4.8% , number 30,062 |
| Colombia | 3.9% , number 24,160 |
| Venezuela | 3.5% , number 21,897 |
| Vietnam | 3.3% , number 20,891 |
| China, Excluding Hong Kong and Taiwan | 3.1% , number 19,654 |
Embed
All the numbers
| Indicator | Colorado | US | Rank among states* | Table |
|---|---|---|---|---|
| Population | 6,012,561 | 341,784,859 | 21st | A00001 |
| People per square mile | 58 | 97 | 38th | A00002 |
| Land area (square miles) | 103,637 | – | – | A00002 |
| Median age | 38.1 ±0.2 | 39.5 ±0.1 | 41st | A01004 |
| Under 18 | 20.2% ±0.3% , number 1,211,873 ±15,190 | 21.0% ±<0.1% , number 71,689,151 ±111,800 | 37th | B02002 |
| 65 and over | 17.1% ±0.2% , number 1,027,880 ±14,420 | 19.0% ±<0.1% , number 64,775,018 ±120,300 | 46th | B02002 |
| Born outside the US | 10.4% ±0.4% , number 624,448 ±24,480 | 14.7% ±0.1% , number 50,409,320 ±204,800 | 19th | A06001 |
| Speak a language other than English at home | 16.9% ±0.4% , number 961,266 ±26,940 | 22.9% ±0.1% , number 74,190,755 ±244,000 | 18th | C16001 |
| Veterans (adults) | 7.0% ±0.2% , number 331,110 ±9,726 | 5.9% ±<0.1% , number 15,746,228 ±85,320 | 17th | A16002 |
| Living with a disability | 11.9% ±0.3% , number 703,455 ±16,060 | 13.7% ±<0.1% , number 46,271,455 ±126,000 | 49th | B18101 |
| Women 15–50 who had a baby in the past year | 4.6% ±0.3% , number 68,168 ±5,004 | 5.0% ±0.1% , number 4,016,759 ±44,040 | 41st | B13002 |
| Lived in the same home a year ago | 84.9% ±0.5% , number 5,053,885 ±27,620 | 88.4% ±0.1% , number 298,889,697 ±214,800 | 50th | A08001 |
| White, not Hispanic | 61.6% ±0.2% , number 3,701,542 ±10,100 | 55.0% ±<0.1% , number 187,959,031 ±58,340 | 27th | A04001 |
| Hispanic or Latino | 24.1% , number 1,448,880 | 20.5% ±<0.1% , number 69,975,516 ±13,270 | 7th | A04001 |
| Black, not Hispanic | 3.9% ±0.1% , number 233,263 ±8,056 | 11.7% ±<0.1% , number 40,096,453 ±106,200 | 36th | A04001 |
| Asian, not Hispanic | 3.7% ±0.1% , number 223,301 ±6,868 | 6.5% ±<0.1% , number 22,096,709 ±58,340 | 24th | A04001 |
*1 is the highest. Population is ranked among all states, and the rest among those of 1,000 people or more, whose figures can be ranked. Ranks use 5-year estimates, the only ones covering every state, so they can differ slightly from the figures here.
Income and work
Higher incomes than the US
The median household income is $99,729, higher than the US ($84,780). 9.2% of people live in poverty, and 8.8% have no health insurance, higher than the US (8.4%).
Household income
Source: ACS 2025 1-year, table A14001.
Show data
| Colorado | United States | |
|---|---|---|
| Under $25,000 | 11.0% ±0.5% , number 274,323 ±11,520 | 14.0% ±0.1% , number 18,727,548 ±88,990 |
| $25,000 to $49,999 | 12.5% ±0.5% , number 310,146 ±12,250 | 15.4% ±0.1% , number 20,665,585 ±101,400 |
| $50,000 to $74,999 | 13.9% ±0.5% , number 345,460 ±12,410 | 15.3% ±0.1% , number 20,513,565 ±88,500 |
| $75,000 to $99,999 | 12.7% ±0.4% , number 314,258 ±10,920 | 12.5% ±0.1% , number 16,814,245 ±87,520 |
| $100,000 to $149,999 | 18.9% ±0.6% , number 469,961 ±13,980 | 17.9% ±0.1% , number 24,018,984 ±99,670 |
| $150,000 to $199,999 | 12.2% ±0.5% , number 301,736 ±11,330 | 10.1% ±0.1% , number 13,521,827 ±70,660 |
| $200,000 or more | 18.8% ±0.5% , number 467,258 ±11,600 | 14.8% ±0.1% , number 19,801,668 ±84,120 |
Embed
What residents do for work
Source: ACS 2025 1-year, table A17004.
Show data
| Colorado | United States | |
|---|---|---|
| Education and health care | 22.5% ±0.4% , number 715,410 ±14,720 | 24.4% ±0.1% , number 40,862,193 ±140,800 |
| Professional and business services | 15.4% ±0.4% , number 490,001 ±11,570 | 12.8% ±0.1% , number 21,375,231 ±87,110 |
| Retail trade | 10.1% ±0.4% , number 322,093 ±12,710 | 10.6% ±0.1% , number 17,781,181 ±96,660 |
| Arts, food and lodging | 9.2% ±0.3% , number 293,478 ±10,600 | 8.9% ±0.1% , number 14,811,502 ±87,840 |
| Finance, insurance and real estate | 7.5% ±0.3% , number 237,667 ±9,804 | 6.6% ±<0.1% , number 11,025,569 ±68,570 |
| Construction | 7.4% ±0.4% , number 235,353 ±11,310 | 6.7% ±<0.1% , number 11,254,981 ±79,620 |
| Manufacturing | 7.0% ±0.3% , number 222,149 ±10,770 | 9.6% ±0.1% , number 16,064,394 ±91,270 |
| Transportation and warehousing | 5.4% ±0.3% , number 172,158 ±10,530 | 5.9% ±<0.1% , number 9,832,211 ±73,020 |
Embed
Where workers come from and go
Colorado has 2,806,464 jobs and 2,806,382 employed residents. 52,349 people commute in to work and 52,267 commute out, while 2,754,115 both live and work here. The most commuters come from New Mexico.
Most commuters come from
- New Mexico: 6,545
- Wyoming: 5,472
- Texas: 4,691
Most residents commute to
- Wyoming: 6,967
- California: 6,263
- Texas: 5,837
Show data
| Colorado | |
|---|---|
| Live and work here | 2,754,115 |
| Work here, live elsewhere | 52,349 |
| Live here, work elsewhere | 52,267 |
Embed
All the numbers
| Indicator | Colorado | US | Rank among states* | Table |
|---|---|---|---|---|
| Median household income | $99,729 ±$1,273 | $84,780 ±$215 | 10th | A14006 |
| Income per person | $55,438 ±$634 | $47,171 ±$115 | 8th | A14024 |
| Income inequality (Gini index) | 0.460 ±0.005 | 0.482 ±0.001 | 33rd | A14028 |
| Living in poverty | 9.2% ±0.4% , number 540,905 ±22,890 | 11.8% ±0.1% , number 39,264,183 ±277,400 | 48th | A13004 |
| Unemployment rate | 4.5% ±0.2% , number 150,347 ±7,600 | 4.9% ±<0.1% , number 8,574,594 ±64,350 | 34th | A17005 |
| No health insurance | 8.8% ±0.3% , number 518,173 ±19,890 | 8.4% ±<0.1% , number 28,323,306 ±152,000 | 23rd | A20001 |
*1 is the highest. Population is ranked among all states, and the rest among those of 1,000 people or more, whose figures can be ranked. Ranks use 5-year estimates, the only ones covering every state, so they can differ slightly from the figures here.
Education
More college degrees than the US
47.1% of adults 25 and over have a bachelor’s degree or more, higher than the US (37.4%).
Highest level of education
Source: ACS 2025 1-year, table A12001.
Show data
| Colorado | United States | |
|---|---|---|
| Less than high school | 6.4% ±0.3% , number 270,433 ±12,230 | 9.4% ±0.1% , number 22,321,002 ±120,500 |
| High school only | 19.6% ±0.4% , number 833,910 ±18,810 | 25.6% ±0.1% , number 61,096,726 ±203,400 |
| Some college | 26.9% ±0.5% , number 1,141,495 ±21,730 | 27.7% ±0.1% , number 65,920,977 ±173,500 |
| Bachelor’s degree | 28.7% ±0.4% , number 1,219,961 ±17,480 | 22.3% ±0.1% , number 53,224,312 ±196,700 |
| Graduate degree | 18.4% ±0.4% , number 782,611 ±17,740 | 15.0% ±0.1% , number 35,816,011 ±159,400 |
Embed
All the numbers
| Indicator | Colorado | US | Rank among states* | Table |
|---|---|---|---|---|
| Bachelor’s degree or more | 47.1% ±0.6% , number 2,002,572 ±24,910 | 37.4% ±0.1% , number 89,040,323 ±253,200 | 3rd | A12001 |
| High school graduate or more | 93.6% ±0.9% , number 3,977,977 ±38,030 | 90.6% ±0.2% , number 216,058,026 ±368,200 | 14th | A12001 |
*1 is the highest. Population is ranked among all states, and the rest among those of 1,000 people or more, whose figures can be ranked. Ranks use 5-year estimates, the only ones covering every state, so they can differ slightly from the figures here.
Housing
Home values outran incomes
34.7% of households rent, about the same as the US (34.7%). The median home is worth $567,600 and the median rent is $1,839. After inflation, home values rose 46% from 2015 to 2025, while household income rose 14%.
Housing costs and income, 2015 to 2025, after inflation
Source: ACS 1-year, table A10036, A18009, A14006.
Show data
| Colorado | United States | |
|---|---|---|
| Median home value | +46.0% | +39.3% |
| Median rent | +20.8% | +18.5% |
| Median household income | +13.9% | +10.9% |
Embed
Types of homes
Source: ACS 2025 1-year, table A10032.
Show data
| Colorado | United States | |
|---|---|---|
| Single-family, detached | 59.4% ±0.6% , number 1,599,933 ±15,110 | 60.9% ±0.1% , number 90,335,844 ±173,300 |
| Single-family, attached | 8.0% ±0.3% , number 215,178 ±9,180 | 6.4% ±<0.1% , number 9,527,703 ±51,230 |
| 2 to 4 units | 4.8% ±0.4% , number 129,826 ±9,639 | 7.5% ±0.1% , number 11,109,005 ±75,790 |
| 5 to 19 units | 10.7% ±0.5% , number 287,334 ±12,450 | 8.7% ±0.1% , number 12,829,882 ±97,590 |
| 20 or more units | 13.8% ±0.5% , number 372,691 ±13,170 | 11.1% ±0.1% , number 16,381,450 ±92,310 |
| Mobile homes and other | 3.3% ±0.2% , number 87,508 ±5,873 | 5.4% ±<0.1% , number 8,045,083 ±53,680 |
Embed
When homes were built
Source: ACS 2025 1-year, table A10055.
Show data
| Colorado | United States | |
|---|---|---|
| 2010 or later | 20.6% ±0.6% , number 511,908 ±14,540 | 15.1% ±0.1% , number 20,257,912 ±101,300 |
| 2000 to 2009 | 16.2% ±0.5% , number 401,329 ±11,920 | 13.8% ±0.1% , number 18,535,840 ±92,260 |
| 1980 to 1999 | 26.1% ±0.6% , number 648,983 ±15,260 | 24.1% ±0.1% , number 32,332,570 ±118,900 |
| 1960 to 1979 | 22.2% ±0.6% , number 552,303 ±14,210 | 22.9% ±0.1% , number 30,726,302 ±110,000 |
| Before 1960 | 14.8% ±0.4% , number 368,619 ±10,860 | 24.0% ±0.1% , number 32,210,798 ±121,500 |
Embed
All the numbers
| Indicator | Colorado | US | Rank among states* | Table |
|---|---|---|---|---|
| Housing units | 2,692,470 ±3,547 | – | – | A10001 |
| Households | 2,483,142 ±10,140 | – | – | A10008 |
| People per household | 2.37 ±0.01 | 2.49 ±0.01 | 34th | A10003 |
| Households that rent | 34.7% ±0.6% , number 861,251 ±15,840 | 34.7% ±0.1% , number 46,551,688 ±193,200 | 15th | A10060 |
| Vacant homes | 7.8% ±0.4% , number 209,328 ±10,290 | 9.6% ±0.1% , number 14,165,545 ±137,100 | 40th | A10047, A10060 |
| Median gross rent | $1,839 ±$16 | $1,557 ±$4 | 5th | A18009 |
| Median home value | $567,600 ±$5,009 | $371,100 ±$646 | 6th | A10036 |
| Renters paying 30% or more of income | 49.2% ±1.7% , number 423,929 ±16,620 | 48.3% ±0.2% , number 22,486,693 ±122,100 | 5th | A18002 |
| Owners paying 30% or more of income | 28.0% ±0.8% , number 454,720 ±13,880 | 24.2% ±0.1% , number 21,201,943 ±93,050 | 13th | A10040 |
| Homes built before 1960 | 14.8% ±0.4% , number 368,619 ±10,860 | 24.0% ±0.1% , number 32,210,798 ±121,500 | 38th | A10055 |
*1 is the highest. Population is ranked among all states, and the rest among those of 1,000 people or more, whose figures can be ranked. Ranks use 5-year estimates, the only ones covering every state, so they can differ slightly from the figures here.
Getting around
How people get around
67.0% of workers drive alone and 18.8% work from home. 37.1% of those who travel to work spend 30 minutes or more getting there, and 5.6% of households have no vehicle.
How people get to work
Source: ACS 2025 1-year, table A09005.
Show data
| Colorado | United States | |
|---|---|---|
| Drive alone | 67.0% ±0.6% , number 2,122,605 ±23,300 | 69.8% ±0.1% , number 115,297,377 ±192,900 |
| Carpool | 8.2% ±0.4% , number 258,399 ±12,600 | 8.9% ±0.1% , number 14,712,170 ±97,240 |
| Public transit | 1.7% ±0.2% , number 55,403 ±5,055 | 4.3% ±<0.1% , number 7,100,386 ±63,330 |
| Walk | 2.3% ±0.2% , number 72,770 ±5,590 | 2.4% ±<0.1% , number 4,016,469 ±41,070 |
| Work from home | 18.8% ±0.4% , number 596,371 ±14,200 | 12.9% ±0.1% , number 21,288,393 ±105,700 |
| Other | 1.9% ±0.2% , number 60,479 ±5,037 | 1.7% ±<0.1% , number 2,799,658 ±41,510 |
Embed
Time spent getting to work
Source: ACS 2025 1-year, table B09001.
Show data
| Colorado | United States | |
|---|---|---|
| Under 10 minutes | 12.7% ±0.5% , number 325,094 ±12,930 | 12.0% ±0.1% , number 17,199,225 ±93,440 |
| 10 to 19 minutes | 28.7% ±0.6% , number 736,894 ±17,570 | 27.8% ±0.1% , number 40,059,540 ±137,700 |
| 20 to 29 minutes | 21.6% ±0.6% , number 554,617 ±15,940 | 21.0% ±0.1% , number 30,221,743 ±111,100 |
| 30 to 39 minutes | 18.1% ±0.5% , number 463,974 ±14,480 | 17.1% ±0.1% , number 24,659,138 ±103,800 |
| 40 to 59 minutes | 12.0% ±0.4% , number 309,386 ±11,300 | 12.6% ±0.1% , number 18,104,709 ±97,070 |
| 60 minutes or more | 7.0% ±0.3% , number 179,691 ±8,780 | 9.5% ±0.1% , number 13,681,705 ±84,440 |
Embed
Vehicles per household
Source: ACS 2025 1-year, table A10030.
Show data
| Colorado | United States | |
|---|---|---|
| None | 5.6% ±0.3% , number 139,097 ±7,861 | 8.8% ±0.1% , number 11,781,997 ±77,240 |
| One | 31.4% ±0.6% , number 778,602 ±15,660 | 33.1% ±0.1% , number 44,424,682 ±160,700 |
| Two | 38.2% ±0.6% , number 948,388 ±16,300 | 36.0% ±0.1% , number 48,200,889 ±176,800 |
| Three or more | 24.8% ±0.6% , number 617,055 ±15,700 | 22.1% ±0.1% , number 29,655,854 ±113,300 |
Embed
All the numbers
| Indicator | Colorado | US | Rank among states* | Table |
|---|---|---|---|---|
| Drive to work alone | 67.0% ±0.6% , number 2,122,605 ±23,300 | 69.8% ±0.1% , number 115,297,377 ±192,900 | 43rd | A09005 |
| Take public transit | 1.7% ±0.2% , number 55,403 ±5,055 | 4.3% ±<0.1% , number 7,100,386 ±63,330 | 18th | A09005 |
| Work from home | 18.8% ±0.4% , number 596,371 ±14,200 | 12.9% ±0.1% , number 21,288,393 ±105,700 | 2nd | A09005 |
| Commute 30 minutes or more | 37.1% ±0.7% , number 953,051 ±20,360 | 39.2% ±0.1% , number 56,445,552 ±165,300 | 20th | B09001 |
| Households with no vehicle | 5.6% ±0.3% , number 139,097 ±7,804 | 8.8% ±<0.1% , number 11,781,997 ±64,240 | 45th | A10030 |
*1 is the highest. Population is ranked among all states, and the rest among those of 1,000 people or more, whose figures can be ranked. Ranks use 5-year estimates, the only ones covering every state, so they can differ slightly from the figures here.
Places
The largest cities in Colorado
Population, from the latest estimates available. Figures cover the whole of each place.
Largest cities
- Denver: 740,613
- Colorado Springs: 494,744
- Aurora: 409,516
- Fort Collins: 171,503
- Lakewood: 156,920
- Thornton: 147,753
- Arvada: 122,212
- Westminster: 116,187
States like this one
- Illinois: 12,694,798
- Virginia: 8,705,170
- Washington: 7,816,116
- Maryland: 6,206,011
States at least a third this size, with the closest income, education, age, housing and origins.
Every county and place in Colorado
Find any county, city, town, metro area, ZIP code, school district or district in Colorado.
Counties
Each of the 64 counties with its population, from ACS 2020–2024 5-year estimates.
- Adams County530,225
- Alamosa County16,581
- Arapahoe County659,844
- Archuleta County13,900
- Baca County3,428
- Bent County5,549
- Boulder County328,961
- Broomfield County76,304
- Chaffee County20,178
- Cheyenne County1,741
- Clear Creek County9,262
- Conejos County7,530
- Costilla County3,607
- Crowley County5,647
- Custer County5,247
- Delta County31,598
- Denver County718,877
- Dolores County2,432
- Douglas County377,150
- Eagle County55,135
- El Paso County742,999
- Elbert County27,874
- Fremont County49,634
- Garfield County62,479
- Gilpin County5,901
- Grand County15,895
- Gunnison County17,241
- Hinsdale County1,005
- Huerfano County6,972
- Jackson County1,372
- Jefferson County579,377
- Kiowa County1,376
- Kit Carson County7,023
- La Plata County56,331
- Lake County7,380
- Larimer County367,368
- Las Animas County14,413
- Lincoln County5,550
- Logan County20,892
- Mesa County158,601
- Mineral County729
- Moffat County13,207
- Montezuma County26,412
- Montrose County43,807
- Morgan County29,520
- Otero County18,321
- Ouray County5,087
- Park County17,907
- Phillips County4,496
- Pitkin County16,985
- Prowers County11,910
- Pueblo County169,356
- Rio Blanco County6,544
- Rio Grande County11,321
- Routt County25,084
- Saguache County6,580
- San Juan County724
- San Miguel County7,968
- Sedgwick County2,304
- Summit County31,017
- Teller County24,825
- Washington County4,831
- Weld County350,396
- Yuma County9,979
Cities, towns and other places
Each of the 472 with its population, from ACS 2020–2024 5-year estimates. Census-designated places are communities without a local government of their own, drawn by the Census Bureau so they can be counted.
- Acres Green2,639
- Aetna Estates1,010
- Aguilar401
- Air Force Academy6,727
- Akron1,722
- Alamosa9,879
- Alamosa East1,298
- Allenspark825
- Alma385
- Alpine75
- Altona587
- Amherst82
- Antonito579
- Applewood8,350
- Arapahoe53
- Arboles389
- Aristocrat Ranchettes1,747
- Arriba307
- Arvada122,634
- Aspen6,756
- Aspen Park742
- Atwood62
- Ault2,425
- Aurora394,432
- Avon5,972
- Avondale338
- Bar-K Ranch199
- Basalt4,335
- Battlement Mesa5,755
- Bayfield2,901
- Bennett3,663
- Berkley10,789
- Berthoud12,411
- Bethune218
- Beulah Valley751
- Black Forest15,738
- Black Hawk106
- Blanca230
- Blende623
- Blue River1,410
- Blue Sky19
- Blue Valley120
- Bonanza20
- Bonanza Mountain Estates56
- Boone262
- Boulder106,433
- Bow Mar1,047
- Brandon8
- Branson62
- Breckenridge4,959
- Brick Center105
- Briggsdale88
- Brighton42,059
- Brook Forest355
- Brookside276
- Broomfield76,304
- Brush5,306
- Buena Vista3,010
- Burlington3,152
- Byers1,726
- Calhan620
- Campo58
- Cañon City17,122
- Capulin185
- Carbondale6,637
- Cascade-Chipita Park1,412
- Castle Pines13,388
- Castle Pines Village4,436
- Castle Rock79,123
- Cathedral13
- Catherine255
- Cattle Creek396
- Cedaredge2,398
- Centennial108,201
- Center2,120
- Central525
- Chacra457
- Cheraw188
- Cherry Creek10,721
- Cherry Hills Village6,354
- Cheyenne Wells979
- Cimarron Hills19,817
- City of Creede285
- Clifton19,518
- Coal Creek CDP2,346
- Coal Creek town324
- Coaldale538
- Cokedale161
- Collbran356
- Colona108
- Colorado City1,615
- Colorado Springs487,887
- Columbine25,478
- Columbine Valley2,047
- Comanche Creek283
- Commerce City66,445
- Cope58
- Copper Mountain353
- Cortez8,976
- Cotopaxi41
- Craig8,991
- Crawford448
- Crested Butte1,229
- Crestone123
- Cripple Creek955
- Crisman268
- Crook157
- Crowley219
- Dacono6,530
- Dakota Ridge33,753
- De Beque458
- Deer Trail1,275
- Del Norte1,653
- Delta9,421
- Denver718,877
- Derby8,453
- Dillon832
- Dinosaur507
- Divide87
- Dolores918
- Dotsero1,306
- Dove Creek651
- Dove Valley4,806
- Downieville-Lawson-Dumont345
- Durango19,411
- Eads677
- Eagle7,442
- East Pleasant View832
- Eaton5,867
- Echo Hills180
- Eckley332
- Edgewater4,932
- Edwards10,785
- El Jebel2,941
- El Moro151
- Elbert164
- Eldora465
- Eldorado Springs320
- Elizabeth2,244
- Ellicott1,404
- Empire672
- Englewood34,129
- Erie33,808
- Estes Park5,844
- Evans22,396
- Evergreen8,602
- Fairmount9,902
- Fairplay1,067
- Federal Heights14,125
- Firestone18,049
- Flagler635
- Fleming614
- Florence3,885
- Florissant192
- Floyd Hill841
- Fort Carson18,019
- Fort Collins170,229
- Fort Garland446
- Fort Lupton8,897
- Fort Morgan11,605
- Fountain29,300
- Four Square Mile23,024
- Fowler936
- Foxfield659
- Franktown472
- Fraser1,405
- Frederick16,651
- Frisco2,825
- Fruita13,691
- Fruitvale8,019
- Garden City401
- Gardner162
- Garfield93
- Genesee3,778
- Genoa190
- Georgetown1,053
- Gerrard332
- Gilcrest1,026
- Glendale CDP69
- Glendale city4,531
- Gleneagle6,440
- Glenwood Springs10,241
- Gold Hill178
- Golden20,417
- Goldfield160
- Granada447
- Granby2,270
- Grand Junction68,142
- Grand Lake333
- Grand View Estates567
- Greeley110,806
- Green Mountain Falls459
- Greenwood Village15,420
- Grover164
- Guffey29
- Gunbarrel10,051
- Gunnison6,766
- Gypsum8,941
- Hartman30
- Hasty125
- Haswell52
- Haxtun978
- Hayden2,057
- Heeney63
- Hidden Lake29
- Highlands Ranch102,257
- Hillrose285
- Hoehne40
- Holly665
- Holly Hills2,572
- Holyoke2,382
- Hooper152
- Hot Sulphur Springs1,108
- Hotchkiss1,224
- Howard966
- Hudson2,006
- Hugo970
- Idaho Springs1,986
- Idalia90
- Idledale297
- Ignacio1,250
- Iliff268
- Indian Hills986
- Inverness2,934
- Jackson Lake238
- Jamestown324
- Jansen81
- Joes105
- Johnson Village129
- Johnstown18,883
- Julesburg1,181
- Keenesburg2,347
- Ken Caryl33,233
- Kersey1,064
- Keystone1,216
- Kim78
- Kiowa673
- Kirk26
- Kit Carson273
- Kittredge812
- Kremmling1,807
- La Jara522
- La Junta7,140
- La Junta Gardens112
- La Salle3,061
- La Veta804
- Lafayette30,602
- Laird4
- Lake City561
- Lakeside4
- Lakewood156,583
- Lamar7,611
- Laporte1,771
- Larkspur131
- Las Animas2,540
- Lazear196
- Lazy Acres778
- Leadville2,620
- Leadville North1,417
- Lewis277
- Limon1,678
- Lincoln Park3,986
- Littleton44,710
- Lochbuie8,609
- Log Lane Village964
- Loghill Village618
- Loma1,350
- Lone Tree14,147
- Longmont99,406
- Louisville20,786
- Louviers294
- Loveland78,410
- Lyons1,838
- Manassa932
- Mancos1,174
- Manitou Springs4,735
- Manzanola361
- Marble309
- Marvel100
- Matheson34
- Maybell35
- Maysville235
- McClave128
- Mead5,919
- Meeker2,580
- Meridian5,634
- Meridian Village2,699
- Merino286
- Midland182
- Milliken8,871
- Minturn993
- Moffat54
- Monte Vista4,141
- Montezuma120
- Montrose21,044
- Monument11,735
- Morgan Heights281
- Morrison412
- Mount Crested Butte823
- Mountain Meadows180
- Mountain View609
- Mountain Village2,185
- Mulford413
- Nathrop187
- Naturita589
- Nederland1,655
- New Castle4,880
- Niwot3,447
- No Name269
- North La Junta535
- North Washington294
- Northglenn38,014
- Norwood381
- Nucla598
- Nunn358
- Oak Creek700
- Olathe1,793
- Olney Springs557
- Ophir120
- Orchard88
- Orchard City3,221
- Orchard Mesa6,945
- Ordway1,528
- Otis521
- Ouray985
- Ovid468
- Padroni7
- Pagosa Springs2,090
- Palisade2,584
- Palmer Lake2,623
- Paoli43
- Paonia1,661
- Parachute1,422
- Paragon Estates667
- Park Center2,588
- Parker61,783
- Parshall25
- Peetz265
- Penrose4,087
- Peoria75
- Perry Park1,570
- Peyton139
- Phippsburg390
- Piedra57
- Pierce1,201
- Pine Brook Hill543
- Pine Valley392
- Pitkin131
- Placerville333
- Platteville2,928
- Poncha Springs959
- Ponderosa Park3,453
- Portland125
- Pritchett142
- Pueblo111,561
- Pueblo West35,681
- Ramah127
- Rangely2,466
- Raymer (New Raymer)78
- Red Cliff308
- Red Feather Lakes365
- Redlands8,868
- Redstone144
- Redvale389
- Rico414
- Ridgway1,237
- Rifle10,570
- Rock Creek Park97
- Rockvale695
- Rocky Ford3,815
- Rollinsville264
- Romeo387
- Roxborough Park9,085
- Rye121
- Saddle Ridge27
- Saguache579
- Salida5,861
- Salt Creek832
- San Acacio61
- San Luis560
- Sanford1,142
- Sawpit6
- Security-Widefield37,345
- Sedalia37
- Sedgwick198
- Segundo143
- Seibert138
- Seven Hills183
- Severance10,130
- Shaw Heights5,565
- Sheridan6,005
- Sheridan Lake61
- Sherrelwood18,692
- Sierra Ridge3,663
- Silt3,642
- Silver Cliff863
- Silver Plume127
- Silverthorne4,815
- Silverton637
- Simla423
- Smeltertown188
- Snowmass Village2,972
- Snyder51
- Somerset79
- South Fork724
- Southern Ute67
- Springfield1,384
- St. Ann Highlands453
- St. Mary's68
- Starkville102
- Steamboat Springs13,433
- Stepping Stone3,137
- Sterling13,172
- Sterling Ranch4,213
- Stonegate8,906
- Stonewall Gap45
- Strasburg3,455
- Stratmoor5,412
- Stratton716
- Sugar City464
- Sugarloaf474
- Sunshine330
- Superior13,305
- Swink422
- Tabernash466
- Tall Timber382
- Telluride2,160
- The Pinery11,871
- Thornton144,187
- Timnath8,941
- Todd Creek5,379
- Towaoc1,078
- Towner36
- Trail Side27
- Trinidad8,286
- Twin Lakes (Adams County)8,030
- Twin Lakes (Lake County)615
- Two Buttes15
- Upper Bear Creek954
- Upper Witter Gulch731
- Vail4,613
- Valdez26
- Valmont27
- Victor388
- Vilas184
- Vineland410
- Vona189
- Walden573
- Walsenburg3,072
- Walsh492
- Ward103
- Watkins847
- Welby16,197
- Weldona106
- Wellington11,798
- West Pleasant View5,051
- Westcliffe419
- Westcreek237
- Westminster115,484
- Weston24
- Wheat Ridge32,070
- Wiggins1,564
- Wiley422
- Williamsburg770
- Windsor37,914
- Winter Park844
- Woodland Park7,949
- Woodmoor8,934
- Woody Creek109
- Wray2,114
- Yampa296
- Yuma3,459
Metro and micro areas
Each of the 17 that reach into Colorado, with its whole population, from ACS 2020–2024 5-year estimates. Metro and micro areas are counties tied together by commuting, drawn by the Office of Management and Budget.
- Alamosa, CO Micro Area27,718
- Boulder, CO Metro Area328,961
- Breckenridge, CO Micro Area38,397
- Cañon City, CO Micro Area49,634
- Colorado Springs, CO Metro Area767,824
- Denver-Aurora-Centennial, CO Metro Area3.00M
- Durango, CO Micro Area56,331
- Edwards, CO Micro Area55,135
- Fort Collins-Loveland, CO Metro Area367,368
- Fort Morgan, CO Micro Area29,520
- Grand Junction, CO Metro Area158,601
- Greeley, CO Metro Area350,396
- Montrose, CO Micro Area43,807
- Pueblo, CO Metro Area169,356
- Rifle, CO Micro Area79,464
- Steamboat Springs, CO Micro Area38,291
- Sterling, CO Micro Area20,892
ZIP codes
Each of the 512 with people in it, by the town it's centered in, from ACS 2020–2024 5-year estimates. These are the Census Bureau's ZIP Code Tabulation Areas, which follow the Postal Service's ZIP codes as closely as census blocks allow.
- 80002Arvada21,270
- 80003Arvada35,976
- 80004Arvada33,700
- 80005Arvada28,459
- 80007Arvada19,078
- 80010Aurora42,439
- 80011Aurora53,695
- 80012Aurora51,052
- 80013Aurora73,248
- 80014Aurora39,496
- 80015Aurora72,316
- 80016Aurora68,268
- 80017Aurora40,584
- 80018Aurora19,072
- 80019Aurora7,900
- 80020Broomfield54,201
- 80021Westminster36,555
- 80022Commerce City61,452
- 80023Broomfield27,143
- 80024Derby33
- 80025Eldorado Springs138
- 80026Erie32,701
- 80027Superior34,127
- 80030Westminster15,427
- 80031Westminster35,584
- 80033Wheat Ridge26,485
- 80045Aurora1,676
- 80101423
- 80102Bennett6,690
- 80103Byers3,215
- 80104Castle Rock38,479
- 80105Deer Trail2,182
- 80106Elbert4,455
- 80107Ponderosa Park15,102
- 80108Castle Pines36,730
- 80109Castle Rock28,400
- 80110Sheridan23,825
- 80111Greenwood Village31,561
- 80112Inverness36,816
- 80113Cherry Hills Village22,976
- 80116Franktown5,132
- 80117Kiowa2,756
- 80118Larkspur5,632
- 80120Littleton29,725
- 80121Greenwood Village18,029
- 80122Centennial32,195
- 80123Denver44,549
- 80124Lone Tree22,555
- 80125Sterling Ranch15,630
- 80126Highlands Ranch44,882
- 80127Ken Caryl43,494
- 80128Columbine36,712
- 80129Highlands Ranch30,223
- 80130Highlands Ranch24,719
- 80131Louviers276
- 80132Monument30,073
- 80133Palmer Lake2,425
- 80134Parker80,302
- 80135Westcreek4,141
- 80136Strasburg6,144
- 80137Watkins1,689
- 80138Parker36,895
- 80202Denver18,589
- 80203Denver22,441
- 80204Denver35,318
- 80205Denver34,571
- 80206Denver24,383
- 80207Denver21,542
- 80209Denver27,564
- 80210Denver39,113
- 80211Denver38,177
- 80212Denver20,746
- 80214Lakewood27,022
- 80215Lakewood19,839
- 80216Denver17,330
- 80218Denver19,149
- 80219Denver59,523
- 80220Denver37,203
- 80221Twin Lakes39,718
- 80222Denver23,838
- 80223Denver19,246
- 80224Denver19,352
- 80226Lakewood31,573
- 80227Lakewood34,907
- 80228Lakewood34,942
- 80229Welby55,092
- 80230Denver10,449
- 80231Four Square Mile35,883
- 80232Lakewood23,050
- 80233Thornton48,441
- 80234Westminster29,356
- 80235Bow Mar8,373
- 80236Denver16,863
- 80237Denver23,384
- 80238Denver30,575
- 80239Denver44,956
- 80241Thornton34,082
- 80246Glendale city13,097
- 80247Denver29,760
- 80249Denver41,590
- 80260Thornton34,677
- 80290Denver474
- 80301Valmont25,007
- 80302Tall Timber29,569
- 80303Paragon Estates24,996
- 80304Boulder25,383
- 80305Boulder16,291
- 80310Boulder7,692
- 80401Golden43,811
- 80403Coal Creek CDP20,732
- 80420Alma1,246
- 804218,536
- 80422Rollinsville4,363
- 8042383
- 80424Blue River9,764
- 80425243
- 80426102
- 80427Central567
- 80428720
- 80430148
- 80432Fairplay293
- 80433Aspen Park8,292
- 8043432
- 80435Keystone8,715
- 80436Downieville-Lawson-Dumont348
- 80438Silver Plume970
- 80439Upper Bear Creek24,610
- 80440Fairplay3,502
- 80442Fraser2,614
- 80443Copper Mountain3,992
- 80444Silver Plume1,053
- 80446Granby4,017
- 80447Grand Lake1,857
- 80449916
- 80451Hot Sulphur Springs1,265
- 80452Downieville-Lawson-Dumont3,135
- 80453Idledale297
- 80454Indian Hills986
- 80455Glendale CDP501
- 80456507
- 80457Kittredge283
- 80459Kremmling2,569
- 80461Leadville6,957
- 80463100
- 80465Morrison16,582
- 80466Nederland3,599
- 80467Yampa2,260
- 80468382
- 80469Phippsburg402
- 804703,608
- 8047362
- 80474Eldora264
- 8047539
- 80476Silver Plume159
- 80478Tabernash1,396
- 8047932
- 80480Walden1,130
- 80481Ward484
- 80482Winter Park1,447
- 80483Yampa455
- 80487Steamboat Springs18,525
- 80498Vail8,881
- 80501Longmont44,147
- 80503Lyons35,846
- 80504Longmont63,451
- 80510Allenspark663
- 805121,903
- 80513Berthoud18,271
- 80514Dacono6,721
- 80515934
- 80516Erie39,048
- 80517Estes Park9,657
- 80520Firestone1,140
- 80521Laporte38,776
- 80524Wellington40,030
- 80525Fort Collins54,211
- 80526Fort Collins44,326
- 80528Timnath24,960
- 80530Frederick6,242
- 80532Estes Park185
- 80534Johnstown20,502
- 80535Laporte1,896
- 805362,383
- 80537Loveland44,425
- 80538Laporte50,110
- 80540Allenspark4,642
- 80542Mead5,155
- 80543Milliken9,774
- 80545Red Feather Lakes937
- 80546Severance271
- 80547Timnath8,821
- 8054914,325
- 80550Windsor46,456
- 80601Brighton42,127
- 80602Thornton44,783
- 80603Lochbuie16,811
- 806104,132
- 80611Briggsdale557
- 80612494
- 80615Eaton9,060
- 80620Evans20,798
- 80621Fort Lupton15,060
- 80622Briggsdale282
- 80623Gilcrest1,026
- 80624Kersey685
- 80631Garden City53,722
- 80634Greeley65,622
- 80640Commerce City13,818
- 80642Hudson4,466
- 80643Keenesburg5,119
- 80644Kersey2,124
- 80645La Salle4,917
- 80648Nunn902
- 80649Orchard263
- 80650Pierce2,192
- 80651Platteville4,837
- 80652299
- 80653Weldona939
- 80654Wiggins3,657
- 80701Trail Side16,226
- 80705Log Lane Village1,102
- 80720Akron2,247
- 80721Amherst257
- 80722Atwood374
- 80723Brush6,892
- 80726Crook453
- 80727Eckley369
- 80728Fleming1,029
- 80729Grover350
- 80731Haxtun1,486
- 80732Grover42
- 80733Hillrose625
- 80734Holyoke2,999
- 80735Idalia324
- 80736Iliff625
- 80737Julesburg1,420
- 8074094
- 80741Merino936
- 80742204
- 80743Otis1,333
- 80744Ovid615
- 8074532
- 80746Paoli37
- 80747Peetz499
- 80749Sedgwick264
- 80750Snyder217
- 80751Sterling16,936
- 80754141
- 80755323
- 80757216
- 80758Wray3,394
- 80759Yuma4,931
- 80801100
- 80802Arapahoe146
- 80804Arriba432
- 80805Bethune369
- 80807Burlington4,211
- 80808Calhan6,521
- 80809Manitou Springs1,138
- 80810Cheyenne Wells1,145
- 80812Cope298
- 80813Goldfield1,817
- 80814Divide4,599
- 80815Flagler923
- 80816Florissant6,251
- 80817Fountain31,241
- 80818337
- 80819Cascade-Chipita Park650
- 80820Guffey427
- 808211,336
- 80822Joes224
- 80823197
- 80824Kirk293
- 80825Kit Carson401
- 80826Limon945
- 80827808
- 80828Limon2,427
- 80829Manitou Springs5,312
- 80830Matheson176
- 80831Peyton33,912
- 808321,019
- 808331,240
- 80834Seibert287
- 80835Matheson643
- 80836Stratton1,085
- 80840Air Force Academy6,727
- 80860Goldfield654
- 80861Vona283
- 8086247
- 80863Woodland Park12,329
- 808641,505
- 80902Rock Creek Park11,951
- 80903Colorado Springs16,491
- 80904Colorado Springs21,158
- 80905Colorado Springs16,672
- 80906Rock Creek Park37,502
- 80907Colorado Springs27,815
- 80908Black Forest25,486
- 80909Colorado Springs35,486
- 80910Colorado Springs31,368
- 80911Security-Widefield33,027
- 80913Fort Carson6,586
- 80914Colorado Springs504
- 80915Cimarron Hills23,884
- 80916Colorado Springs41,104
- 80917Colorado Springs30,398
- 80918Colorado Springs50,005
- 80919Colorado Springs27,787
- 80920Colorado Springs36,923
- 80921Gleneagle26,551
- 80922Colorado Springs30,453
- 80923Colorado Springs31,772
- 80924Colorado Springs19,619
- 80925Colorado Springs17,273
- 80926Rock Creek Park1,561
- 80927Colorado Springs8,036
- 80928798
- 80929Cimarron Hills155
- 80930Ellicott1,882
- 80938Colorado Springs1,664
- 80939Colorado Springs62
- 80951Colorado Springs5,219
- 81001Pueblo31,197
- 81003Pueblo15,194
- 8100425,757
- 81005Pueblo West32,441
- 81006Vineland11,029
- 81007Pueblo West35,690
- 81008Pueblo11,608
- 81019Colorado City1,280
- 81020Aguilar763
- 8102112
- 810221,143
- 81023Beulah Valley1,417
- 81024Valdez149
- 81025814
- 81027158
- 81029Campo212
- 81030Cheraw148
- 81033Crowley219
- 81036Eads1,017
- 810391,597
- 81040Gardner360
- 81041679
- 81043Hartman30
- 81044160
- 81045Haswell59
- 81046Hoehne3
- 81047Holly1,586
- 81049Kim194
- 810509,894
- 81052Lamar9,045
- 810544,729
- 810551,559
- 81057McClave450
- 81058Manzanola871
- 8105961
- 81062Olney Springs2,000
- 810632,783
- 81064298
- 81067Rocky Ford5,523
- 81069Rye1,678
- 81071Sheridan Lake298
- 81073Springfield1,865
- 81076Sugar City602
- 81077Swink568
- 8108189
- 81082Trinidad11,842
- 81084Two Buttes39
- 81087Vilas197
- 81089Walsenburg4,890
- 81090Walsh829
- 81091Stonewall Gap1,120
- 81092McClave761
- 81101Alamosa East15,550
- 811201,832
- 81121Arboles376
- 81122Bayfield8,838
- 81123Blanca606
- 81124Capulin259
- 81125Center3,362
- 81126San Luis506
- 8112834
- 81129Antonito118
- 81130727
- 81131Crestone1,051
- 81132Del Norte3,252
- 81133Fort Garland1,085
- 81136Hooper305
- 81137Southern Ute5,571
- 8113817
- 81140Capulin1,893
- 81141Manassa1,406
- 81143796
- 81144Monte Vista6,543
- 81146637
- 81147Pagosa Springs13,091
- 81148Romeo387
- 811491,183
- 81151San Acacio1,716
- 81152San Luis1,244
- 81154South Fork1,363
- 81155Bonanza228
- 81201Poncha Springs9,294
- 81210664
- 812118,302
- 8121232,292
- 81220251
- 81221Coal Creek town324
- 81222Coaldale538
- 81223Cotopaxi2,457
- 81224Mount Crested Butte3,101
- 81225Mount Crested Butte823
- 81226Florence7,459
- 81227Garfield93
- 8123010,971
- 81233Howard966
- 81235Lake City912
- 81236Garfield1,748
- 81237Pitkin169
- 81239Pitkin9
- 81240Penrose4,800
- 81241Pitkin238
- 81242Poncha Springs807
- 81243174
- 81244Rockvale660
- 81248264
- 81251Twin Lakes423
- 81252Silver Cliff4,763
- 81253Beulah Valley524
- 8130129,774
- 8130310,236
- 81320242
- 81321Towaoc14,236
- 81323Rico5,191
- 813241,815
- 8132595
- 81326Marvel2,621
- 81327Lewis486
- 81328Mancos4,487
- 81330138
- 81331432
- 81332Rico414
- 81334Towaoc1,389
- 81335Lewis76
- 81401Montrose24,228
- 81403Colona12,138
- 81410Orchard City1,372
- 8141124
- 81413Cedaredge5,149
- 81415Crawford1,955
- 8141614,256
- 81418Cedaredge1,945
- 81419Hotchkiss3,646
- 81422589
- 814231,176
- 81424Nucla1,079
- 814255,005
- 81426Ophir120
- 81427Ouray1,218
- 81428Paonia3,788
- 81429129
- 81430Placerville708
- 81431Naturita745
- 81432Ridgway3,219
- 81433Silverton651
- 81434Somerset127
- 81435Ophir5,876
- 81501Grand Junction24,011
- 81503Orchard Mesa16,558
- 81504Fruitvale32,376
- 81505Fruita13,279
- 81506Grand Junction11,412
- 81507Redlands15,947
- 81520Fruitvale12,892
- 81521Loma16,613
- 81523983
- 81524Loma2,760
- 815251,127
- 81526Palisade5,559
- 815271,462
- 81601Glenwood Springs16,844
- 81610Dinosaur635
- 81611Aspen9,068
- 81615Snowmass Village2,972
- 81620Avon10,870
- 81621Woody Creek6,550
- 81623Redstone15,067
- 816241,492
- 8162512,307
- 816301,058
- 81631Eagle8,958
- 81632Edwards10,965
- 81635Parachute7,486
- 8163710,744
- 8163869
- 81639Hayden2,618
- 81640209
- 81641Meeker3,621
- 8164215
- 816431,133
- 81645Red Cliff1,028
- 81646115
- 81647New Castle6,882
- 816482,796
- 81649Copper Mountain345
- 8165014,083
- 81652Silt6,271
- 81654Snowmass Village1,431
- 81655227
- 81656Woody Creek459
- 81657Vail4,835
School districts
Each of the 178 with people in it, from ACS 2020–2024 5-year estimates.
- Academy School District 20127,389
- Adams 12 Five Star Schools241,074
- Adams County School District 1439,398
- Adams-Arapahoe School District 28J243,618
- Agate School District 300993
- Aguilar Reorganized School District 6932
- Akron School District R-12,287
- Alamosa School District RE-11J15,067
- Archuleta County School District 50-JT13,240
- Arickaree School District R-2528
- Arriba-Flagler School District C-201,289
- Aspen School District 112,634
- Ault-Highland School District RE-98,027
- Bayfield School District 10 JT-R8,568
- Bennett School District 29-J7,610
- Bethune School District R-5511
- Big Sandy School District 100J1,831
- Boulder Valley School District RE-2238,927
- Branson Reorganized School District 82185
- Briggsdale School District RE-10572
- Brush School District RE-2J7,758
- Buena Vista School District R-3110,061
- Buffalo School District RE-41,083
- Burlington School District RE-6J4,004
- Byers School District 32J3,144
- Calhan School District RJ-12,399
- Campo School District RE-6164
- Centennial School District R-11,916
- Center School District 26-JT2,957
- Cheraw School District 31741
- Cherry Creek School District 5324,012
- Cheyenne County School District RE-51,291
- Cheyenne Mountain School District 1223,484
- Clear Creek School District RE-19,262
- Colorado Springs School District 11240,191
- Creede School District729
- Cripple Creek-Victor School District RE-14,786
- Crowley County School District RE-1-J5,499
- Custer County School District C-14,763
- De Beque School District 49-JT951
- Deer Trail School District 26J1,712
- Delta County School District 50J31,879
- Denver County School District 1718,877
- Dolores County School District RE-22,527
- Dolores School District RE-4A4,671
- Douglas County School District RE-1380,487
- Durango School District 9-R42,394
- Eagle County School District RE 5048,244
- East Grand School District 212,596
- East Otero School District R-18,538
- Edison School District 54-JT323
- Elbert School District 2001,493
- Elizabeth School District17,589
- Ellicott School District 225,570
- Englewood School District 128,098
- Estes Park School District R-311,940
- Fort Morgan School District RE-317,354
- Fountain School District 838,133
- Fowler School District R-4J1,755
- Fremont RE-130,742
- Fremont RE-215,488
- Fremont RE-33,932
- Frenchman School District RE-31,121
- Garfield County School District 167,444
- Garfield School District RE-227,143
- Genoa-Hugo School District C-1131,581
- Gilpin County School District RE-12,540
- Granada School District RE-1839
- Greeley School District 6130,881
- Gunnison Watershed School District RE-1J17,397
- Hanover School District 282,053
- Harrison School District 276,395
- Haxtun School District RE-2J1,473
- Hayden School District RE-13,107
- Hi-Plains School District R-23601
- Hinsdale County School District RE-1948
- Hoehne Reorganized School District 32,072
- Holly School District RE-31,251
- Holyoke School District RE-1J3,198
- Huerfano School District RE-15,408
- Idalia School District RJ-3471
- Ignacio School District 11-JT6,086
- Jefferson County School District R-1586,957
- Johnstown-Milliken School District RE-5J25,735
- Julesburg School District RE-11,428
- Karval School District RE-23304
- Kim Reorganized School District 88221
- Kiowa County School District No. RE-11,108
- Kiowa School District C-22,722
- Kit Carson School District R-1450
- La Veta School District RE-21,564
- Lake County School District R-17,380
- Lamar School District RE-29,110
- Las Animas School District RE-14,746
- Lewis-Palmer School District 3839,443
- Liberty School District J-4519
- Limon School District RE-4J3,307
- Littleton School District 696,878
- Lone Star School District 101318
- Mancos School District RE-63,670
- Manitou Springs School District 147,641
- Manzanola School District 3J805
- Mapleton School District 134,045
- McClave School District RE-2707
- Meeker School District RE13,744
- Mesa County Valley School District 51154,979
- Miami-Yoder School District 60-JT2,919
- Moffat County School District RE-113,207
- Moffat School District 21,496
- Monte Vista School District C-85,809
- Montezuma-Cortez School District RE-118,071
- Montrose County School District RE-1J41,532
- Mountain Valley School District RE-11,811
- North Conejos School District RE-1J4,519
- North Park School District R-11,372
- Norwood School District R-2J1,921
- Otis School District R-3973
- Ouray School District R-11,857
- Park County School District RE-28,374
- Pawnee School District RE-12399
- Peyton School District 23-JT4,144
- Plainview School District RE-2268
- Plateau School District RE-5539
- Plateau Valley School District 502,855
- Platte Canyon School District 19,533
- Platte Valley School District RE-73,905
- Poudre School District R-1224,368
- Prairie School District RE-11351
- Primero Reorganized School District 21,480
- Pritchett School District RE-3288
- Pueblo City School District 60113,471
- Pueblo County School District 7055,671
- Rangely School District RE-42,800
- Revere School District886
- Ridgway School District R-22,808
- Roaring Fork School District RE-139,009
- Rocky Ford School District R-25,445
- Salida School District R-3210,212
- Sanford School District 6J1,588
- Sangre de Cristo School District RE-22J1,399
- Sargent School District RE-33J1,111
- School District 27J122,065
- School District 49111,921
- Sheridan School District 28,257
- Sierra Grande School District R-301,691
- Silverton School District 1724
- South Conejos School District RE-101,590
- South Routt School District RE-33,203
- Springfield School District RE-41,881
- St. Vrain Valley School District RE 1J200,423
- Steamboat Springs School District RE-218,715
- Strasburg School District 31J6,175
- Stratton School District R-41,025
- Summit School District RE-130,885
- Swink School District 331,410
- Telluride School District R-16,704
- Thompson School District R-2J132,014
- Trinidad School District 19,523
- Upper Rio Grande School District C-74,352
- Valley School District RE-118,211
- Vilas School District RE-5272
- Walsh School District RE-1823
- Weld County School District No. RE-210,474
- Weld County School District RE-110,522
- Weld County School District RE-3J17,971
- Weld County School District RE-816,071
- Weldon Valley School District RE-20J883
- West End School District RE-21,821
- West Grand School District 1-JT3,431
- Westminster Public School District71,668
- Widefield School District 360,676
- Wiggins School District RE-50J3,917
- Wiley School District RE-13-JT806
- Windsor School District RE-448,383
- Woodland Park School District RE-220,039
- Woodlin School District R-104363
- Wray School District RD-23,707
- Yuma School District 15,195
Congressional districts
As drawn for the 119th Congress (2025–2027).
- Congressional District 1724,976
- Congressional District 2725,063
- Congressional District 3728,794
- Congressional District 4756,186
- Congressional District 5734,906
- Congressional District 6728,750
- Congressional District 7723,678
- Congressional District 8739,836
State senate districts
The upper chamber’s districts, as drawn in 2024.
- State Senate District 1166,427
- State Senate District 2178,799
- State Senate District 3169,356
- State Senate District 4176,293
- State Senate District 5164,346
- State Senate District 6163,414
- State Senate District 7163,659
- State Senate District 8162,916
- State Senate District 9171,762
- State Senate District 10173,632
- State Senate District 11167,224
- State Senate District 12166,125
- State Senate District 13165,779
- State Senate District 14159,557
- State Senate District 15162,618
- State Senate District 16164,271
- State Senate District 17168,832
- State Senate District 18160,886
- State Senate District 19160,438
- State Senate District 20166,424
- State Senate District 21171,126
- State Senate District 22164,539
- State Senate District 23181,109
- State Senate District 24168,933
- State Senate District 25170,969
- State Senate District 26163,692
- State Senate District 27168,803
- State Senate District 28171,813
- State Senate District 29160,674
- State Senate District 30174,242
- State Senate District 31162,808
- State Senate District 32160,795
- State Senate District 33168,982
- State Senate District 34166,840
- State Senate District 35174,106
State house districts
The lower chamber’s districts, as drawn in 2024.
- State House District 185,987
- State House District 286,515
- State House District 387,214
- State House District 487,427
- State House District 585,697
- State House District 687,293
- State House District 796,263
- State House District 889,420
- State House District 992,992
- State House District 1087,951
- State House District 1187,799
- State House District 1285,779
- State House District 1392,565
- State House District 1495,273
- State House District 1597,084
- State House District 1688,853
- State House District 1785,960
- State House District 1886,755
- State House District 1998,539
- State House District 2094,005
- State House District 2187,003
- State House District 2289,026
- State House District 2386,901
- State House District 2488,036
- State House District 2587,271
- State House District 2691,502
- State House District 2790,176
- State House District 2884,564
- State House District 2987,800
- State House District 3086,829
- State House District 3185,934
- State House District 3292,974
- State House District 3390,335
- State House District 3489,498
- State House District 3586,642
- State House District 3696,540
- State House District 3787,638
- State House District 3888,611
- State House District 3993,359
- State House District 4088,145
- State House District 4188,015
- State House District 4291,220
- State House District 4387,875
- State House District 4495,016
- State House District 4596,648
- State House District 4688,384
- State House District 4793,708
- State House District 4894,392
- State House District 4985,158
- State House District 5086,974
- State House District 5190,200
- State House District 5289,198
- State House District 5391,370
- State House District 5491,562
- State House District 5589,402
- State House District 5691,014
- State House District 5787,932
- State House District 5892,095
- State House District 5992,047
- State House District 6091,629
- State House District 6193,482
- State House District 6290,443
- State House District 6388,288
- State House District 6497,201
- State House District 65100,781
PUMAs
Public Use Microdata Areas: areas of 100,000 people or more that the state draws from census tracts, for the Census Bureau’s microdata.
- Adams Arapahoe PUMA118,922
- Boulder PUMA124,337
- Brighton PUMA124,012
- Broomfield PUMA168,514
- Castle Rock PUMA136,062
- Central Colorado Springs PUMA109,366
- Central Mountain PUMA118,228
- Commerce City PUMA183,341
- Downtown Denver PUMA150,966
- East Boulder PUMA126,154
- El Paso Teller PUMA113,843
- Englewood PUMA111,891
- Foothills PUMA106,979
- Fort Collins PUMA148,000
- Glendale PUMA179,425
- Greeley PUMA124,967
- Highlands Ranch PUMA134,073
- Lakewood PUMA125,397
- Larimer PUMA105,285
- Loveland PUMA114,083
- Mesa PUMA141,870
- Mid Mountain PUMA120,404
- North Aurora PUMA136,905
- North El Paso PUMA159,424
- Northeast Colorado PUMA121,233
- Northeast Colorado Springs PUMA136,307
- Northeast Denver PUMA182,072
- Northwest Colorado PUMA107,314
- Parker PUMA137,145
- Pueblo PUMA158,446
- South Aurora PUMA111,127
- South Colorado Springs PUMA139,630
- South Denver PUMA118,604
- South Jefferson PUMA146,970
- South Metro PUMA120,912
- South Weld PUMA115,451
- Southeast Aurora PUMA121,188
- Southeast Colorado PUMA99,969
- Southwest Colorado PUMA118,045
- Southwest Denver PUMA117,937
- Thornton PUMA178,065
- Weld Rural PUMA109,978
- West Central Colorado PUMA105,191
- West Colorado Springs PUMA109,254
- Wheat Ridge PUMA124,903
Urban areas
Each that reaches into Colorado, with its whole population. Urban areas are the densely settled land the Census Bureau draws after each census, whatever the city lines.
- Alamosa, CO10,408
- Aspen, CO7,530
- Basalt, CO7,487
- Battlement Mesa, CO6,760
- Boulder, CO119,411
- Breckenridge, CO8,781
- Brush, CO5,349
- Buena Vista, CO4,691
- Cañon City, CO24,505
- Carbondale, CO8,240
- Castle Rock, CO91,684
- Colorado Springs, CO637,710
- Cortez, CO8,465
- Craig, CO9,710
- Delta, CO8,413
- Denver–Aurora, CO2.69M
- Durango, CO18,867
- Eagle, CO6,673
- Eaton, CO5,885
- Edwards–Avon, CO18,413
- Estes Park, CO7,974
- Evergreen, CO8,958
- Falcon, CO23,007
- Firestone–Frederick, CO36,545
- Fort Collins, CO335,641
- Fort Lupton, CO8,741
- Fort Morgan, CO13,498
- Fraser, CO2,927
- Frisco, CO3,601
- Glenwood Springs, CO11,253
- Grand Junction, CO138,635
- Grand Lake, CO1,601
- Greeley, CO138,217
- Gunnison, CO7,564
- Gypsum, CO10,014
- Johnstown, CO21,681
- La Junta, CO7,489
- Lafayette–Erie–Louisville, CO98,997
- Lamar, CO7,399
- Leadville, CO3,920
- Longmont, CO100,965
- Montrose, CO25,425
- New Castle, CO5,709
- Pagosa Springs, CO6,121
- Pueblo West, CO26,449
- Pueblo, CO120,817
- Rifle, CO11,978
- Roxborough Park, CO8,900
- Salida, CO6,078
- Severance, CO7,411
- Silverthorne–Keystone, CO14,686
- Snowmass Village, CO2,647
- Steamboat Springs, CO14,246
- Sterling, CO12,639
- Telluride–Mountain Village, CO5,150
- The Pinery, CO14,881
- Trinidad, CO8,177
- Vail, CO5,852
- Wellington, CO11,798
- Woodland Park, CO11,365
Tribal areas
Each that reaches into Colorado, with its whole population.
Turn Colorado into your planning report.
Social Explorer Studio builds an editable profile of any place, with tables and charts beside the county and state, and exports to Word, PDF and Excel.
Questions about Colorado
What is the population of Colorado?
6,012,561 people, according to the ACS 2025 1-year estimates, which the Census Bureau adjusts to match its own population estimate. That’s the 21st largest of the 50 states and DC.
What is the FIPS code for Colorado?
08. Every county’s and place’s FIPS code in Colorado starts with it. The Census Bureau’s full geographic identifier (GEOID) is 0400000US08.
What is the largest city in Colorado?
Denver, with 740,613 people. Other large cities here include Colorado Springs, Aurora and Fort Collins.
What is the median household income in Colorado?
$99,729 (±$1,273), according to the ACS 2025 1-year estimates, higher than the US ($84,780).
What is the median age in Colorado?
38.1 years (±0.2), according to the ACS 2025 1-year estimates, lower than the US (39.5).
How much does housing cost in Colorado?
Colorado’s median home value is $567,600 (±$5,009) and its median gross rent is $1,839 (±$16) a month, according to the ACS 2025 1-year estimates. 49.2% (±1.7%) of its renters pay 30% or more of their income on rent.
Is Colorado growing?
Colorado’s population grew 10.2%, from 5,456,574 in 2015 to 6,012,561 in 2025, according to the ACS 1-year estimates.
Where do people who work in Colorado live?
2,754,115 of its 2,806,464 jobs are held by people who live here. Of those who commute in, the most come from New Mexico, Wyoming, Texas.
Where does this census data come from?
The U.S. Census Bureau’s American Community Survey, through Social Explorer’s tables: the latest 1-year estimates where they exist, for the most recent numbers, and 5-year estimates otherwise. Each table lists its code, so you can find it again.
Is this data free to use?
Yes. You can read it, cite it, download the CSV and embed the charts, with no account. To map other variables, compare your own areas or build a report, see Social Explorer’s plans in a live demo.
Sources and how to cite
American Community Survey 2025 1-year estimates, or 2020–2024 5-year estimates where noted, U.S. Census Bureau, from Social Explorer’s tables A00001, A00002, A01004, A04001, A06001, A08001, A09005, A10001, A10003, A10008, A10030, A10036, A10040, A10047, A10055, A10060, A12001, A13004, A14006, A14024, A14028, A16002, A17005, A18002, A18009, A20001, B02002, B09001, B13002, B18101, C16001. Maps by census tract use 2020–2024 5-year estimates, since the 1-year survey doesn’t cover tracts. Commuting: LEHD LODES 2023. These are estimates from a sample, each with its margin of error. Data retrieved November 14, 2026. How these profiles are made.
U.S. Census Bureau, American Community Survey 2025 1-year estimates, or 2020–2024 5-year estimates where noted, via Social Explorer. “Colorado.” https://www.socialexplorer.com/places/colorado. Accessed November 14, 2026.