

Florida: Population, demographics and census data
Home to 23,462,518 people, the 3rd largest of the 50 states and DC. It grew 15.7% between 2015 and 2025.
- Population
- 23.46M. Census Bureau estimate · Rank 3 of the 50 states and DC
- Median household income
- $80,846 ±$521. US $84,780
- Median age
- 43.1 ±0.1. US 39.5
ACS 2025 1-year estimates, U.S. Census Bureau
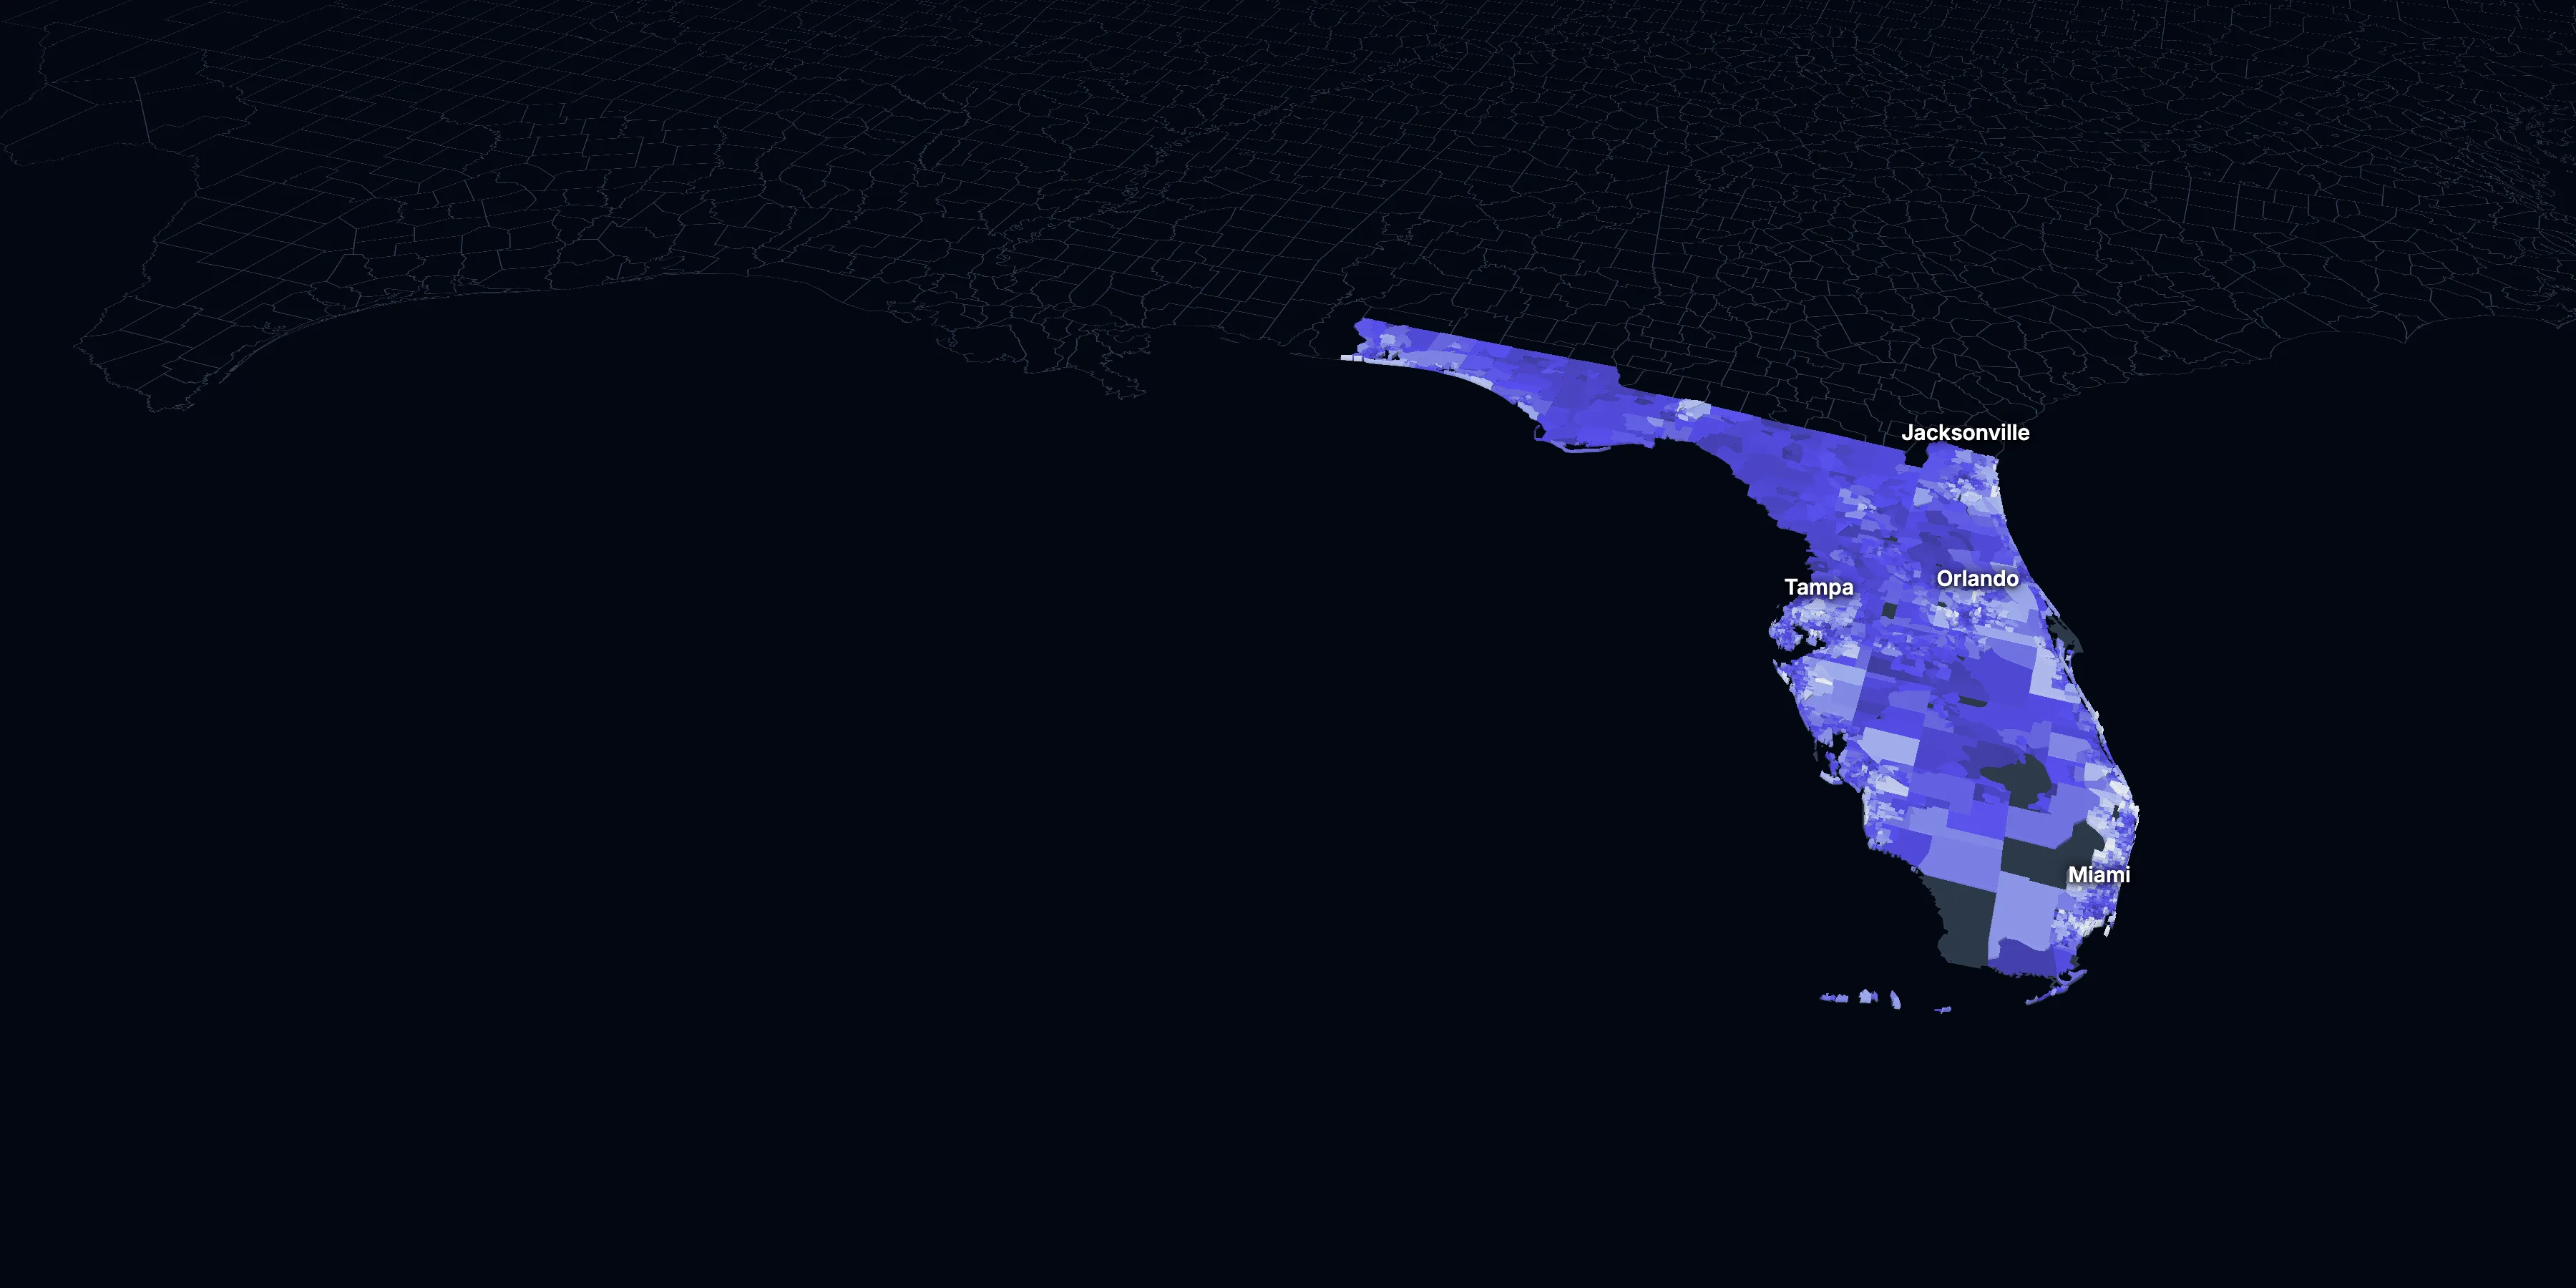
Taller, lighter tracts have higher household incomes
About Florida
Florida’s median household income is $80,846 (±$521), lower than the US ($84,780), and its median age is 43.1 (±0.1), according to the ACS 2025 1-year estimates. Its largest city is Jacksonville.
± is each figure’s margin of error, at 90% confidence, and † marks one too uncertain to lean on. Under each percentage in the tables is the number it counts. How the margins are worked out.
FIPS code 12
Highlights
What stands out in Florida
The numbers where Florida sits furthest from the nation, or past a recognized policy benchmark.
Past a policy benchmark
57.5%
Very highRenters paying 30% or more of income
That’s higher than the US (48.3%). HUD counts households paying 30% or more of income on housing as cost-burdened. It’s the highest of the 50 states and DC.
30.0%
Very highOwners paying 30% or more of income
That’s higher than the US (24.2%). HUD’s 30% standard, applied to homeowners. It’s the 5th highest of the 50 states and DC.
+11 points
HighRent growth ahead of income
After inflation, rent grew 30% from 2015 to 2025, and household income 19%. The dots show rent growth.
Furthest from the national picture
22.8%
3rd among states65 and over
That’s higher than the US (19.0%). It’s the 3rd highest of the 50 states and DC.
43.1
Higher than the USMedian age
That’s higher than the US (39.5). It’s the 5th highest of the 50 states and DC.
22.7%
1.5× the USBorn outside the US
That’s higher than the US (14.7%). It’s the 4th highest of the 50 states and DC.
2015 to 2025
How Florida changed in ten years
The state added 3,191,246 people. It got older, more foreign-born and better educated, and poverty fell 4.6 points.
Population, change since 2015
+15.7% in the state and +6.3% in the US.
Source: ACS 1-year, 2015 to 2025, table A00001.
Show data
| Florida | United States | |
|---|---|---|
| 2015 | 0.0% | 0.0% |
| 2016 | +1.7% | +0.5% |
| 2017 | +3.5% | +1.3% |
| 2018 | +5.1% | +1.8% |
| 2019 | +6.0% | +2.1% |
| 2021 | +7.4% | +3.3% |
| 2022 | +9.7% | +3.7% |
| 2023 | +11.5% | +4.2% |
| 2024 | +15.3% | +5.8% |
| 2025 | +15.7% | +6.3% |
Embed
Median household income, in 2025 dollars
+19.4% in the state and +10.9% in the US.
Source: ACS 1-year, 2015 to 2025, table A14006.
Show data
| Florida | United States | |
|---|---|---|
| 2015 | $67,715 | $76,413 |
| 2016 | $68,792 | $77,931 |
| 2017 | $69,640 | $79,891 |
| 2018 | $71,690 | $80,059 |
| 2019 | $75,194 | $83,427 |
| 2021 | $75,548 | $83,521 |
| 2022 | $76,771 | $82,811 |
| 2023 | $77,994 | $82,683 |
| 2024 | $80,340 | $84,339 |
| 2025 | $80,846 | $84,780 |
Embed
Living in poverty
−4.6 points in the state and −3.0 points in the US.
Source: ACS 1-year, 2015 to 2025, table A13004.
Show data
| Florida | United States | |
|---|---|---|
| 2015 | 15.7% | 14.7% |
| 2016 | 14.7% | 14.0% |
| 2017 | 14.0% | 13.4% |
| 2018 | 13.6% | 13.1% |
| 2019 | 12.7% | 12.3% |
| 2021 | 13.1% | 12.8% |
| 2022 | 12.7% | 12.6% |
| 2023 | 12.3% | 12.5% |
| 2024 | 12.0% | 12.1% |
| 2025 | 11.2% | 11.8% |
Embed
Bachelor’s degree or more
+8.2 points in the state and +6.7 points in the US.
Source: ACS 1-year, 2015 to 2025, table A12001.
Show data
| Florida | United States | |
|---|---|---|
| 2015 | 28.4% | 30.6% |
| 2016 | 28.6% | 31.3% |
| 2017 | 29.7% | 32.0% |
| 2018 | 30.4% | 32.6% |
| 2019 | 30.7% | 33.1% |
| 2021 | 33.2% | 35.0% |
| 2022 | 34.3% | 35.7% |
| 2023 | 34.9% | 36.2% |
| 2024 | 35.8% | 36.8% |
| 2025 | 36.7% | 37.4% |
Embed
Median gross rent, in 2025 dollars
+30.2% in the state and +18.5% in the US.
Source: ACS 1-year, 2015 to 2025, table A18009.
Show data
| Florida | United States | |
|---|---|---|
| 2015 | $1,433 | $1,314 |
| 2016 | $1,469 | $1,327 |
| 2017 | $1,494 | $1,340 |
| 2018 | $1,528 | $1,368 |
| 2019 | $1,572 | $1,393 |
| 2021 | $1,615 | $1,427 |
| 2022 | $1,689 | $1,440 |
| 2023 | $1,829 | $1,496 |
| 2024 | $1,873 | $1,537 |
| 2025 | $1,866 | $1,557 |
Embed
Median home value, in 2025 dollars
+61.0% in the state and +39.3% in the US.
Source: ACS 1-year, 2015 to 2025, table A10036.
Show data
| Florida | United States | |
|---|---|---|
| 2015 | $246,330 | $266,469 |
| 2016 | $267,404 | $277,278 |
| 2017 | $283,357 | $288,124 |
| 2018 | $298,071 | $296,908 |
| 2019 | $311,176 | $305,336 |
| 2021 | $348,257 | $337,116 |
| 2022 | $392,259 | $355,481 |
| 2023 | $405,337 | $361,931 |
| 2024 | $410,202 | $372,685 |
| 2025 | $396,700 | $371,100 |
Embed
ACS 1-year estimates. The dotted stretch of each line spans 2020, when the Census Bureau released no standard 1-year estimates. Dollar values are in 2025 dollars.
| Indicator | 2015 | 2025 | Change |
|---|---|---|---|
| Population | 20,271,272 | 23,462,518 | +15.7% |
| Median age | 41.8 | 43.1 | +1.3 years |
| 65 and over | 19.5% | 22.8% | +3.3 points |
| Born outside the US | 20.2% | 22.7% | +2.6 points |
| Hispanic or Latino | 24.5% | 29.2% | +4.7 points |
| Median household income | $67,715 | $80,846 | +19.4% |
| Living in poverty | 15.7% | 11.2% | −4.6 points |
| Bachelor’s degree or more | 28.4% | 36.7% | +8.2 points |
| Households that rent | 36.2% | 32.0% | −4.3 points |
| Median gross rent | $1,433 | $1,866 | +30.2% |
| Median home value | $246,330 | $396,700 | +61.0% |
5160 census tracts
Florida, tract by tract
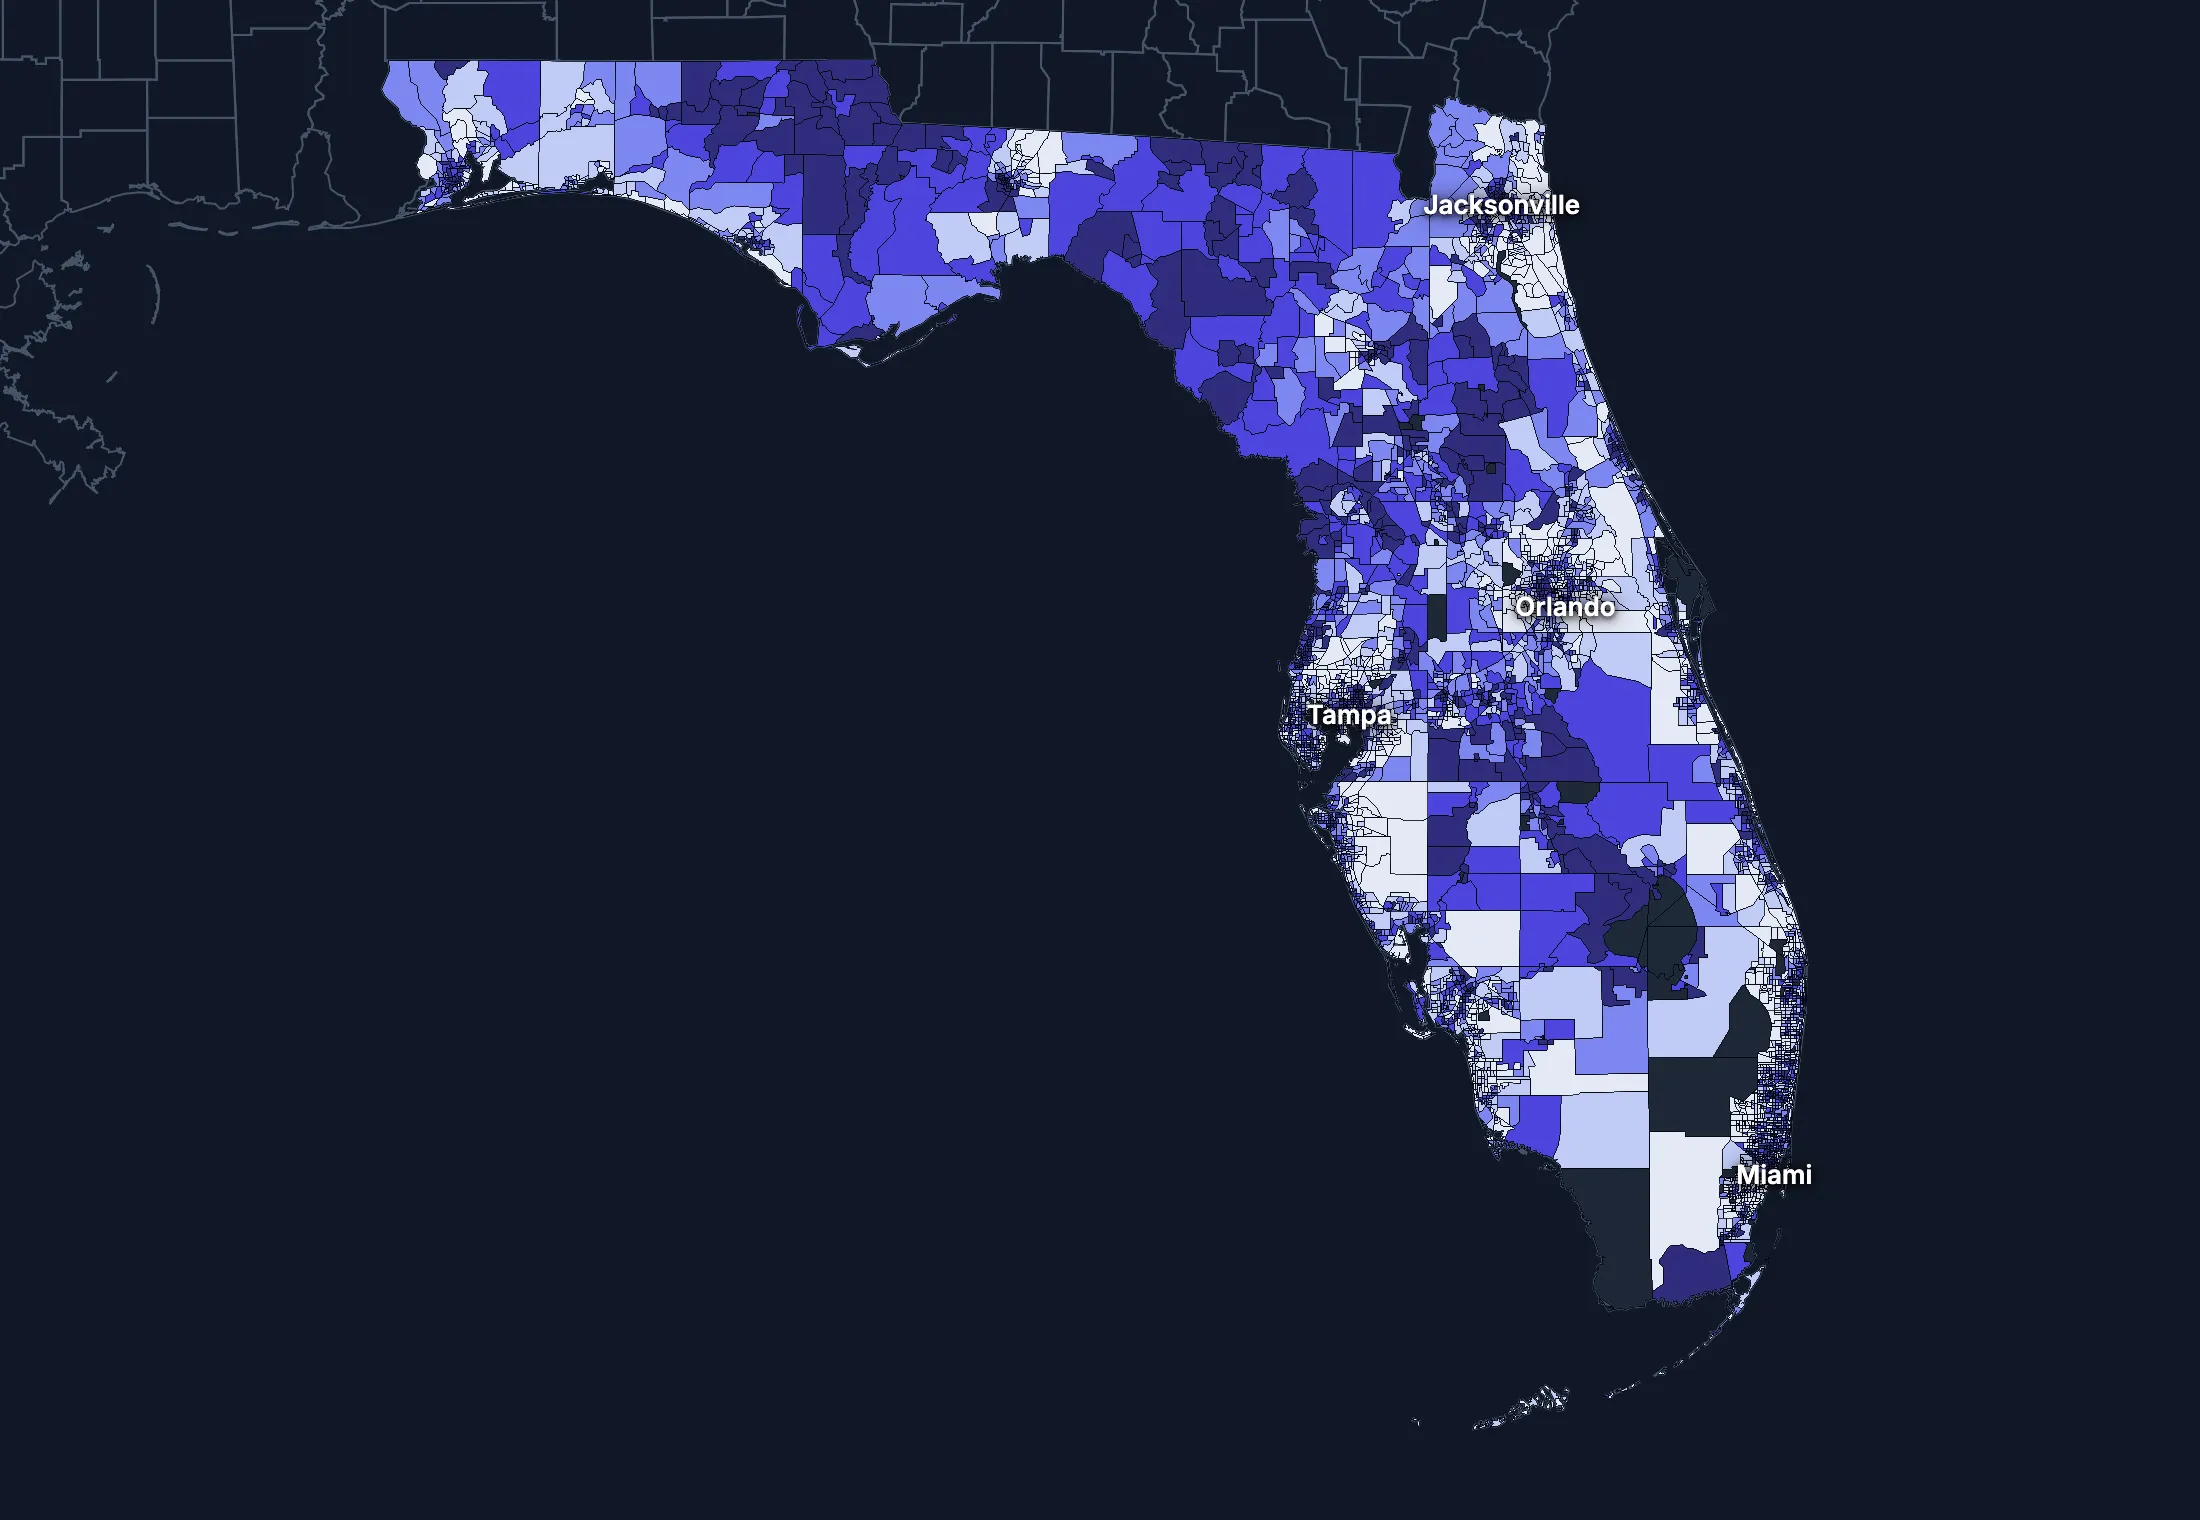
State averages hide a lot. These census tracts are the closest the census comes to neighborhoods.
Where the state’s average misleads
Each tick is one census tract, and the dark line marks the state. Hover over a tick or tap it to see the tract.
Poverty
1086 of 5065 tracts are at least 1.5 times the state’s overall 12.6%, and 1598 are at two-thirds of it or less.
Highest: Tract 122.11, 92.9%. Lowest: Tract 203.22, 0.0%.
Renters paying 30% or more of income
135 of 4878 tracts are at least 1.5 times the state’s overall 56.3%, and 957 are at two-thirds of it or less.
Highest: Tract 712.04, 100.0%. Lowest: Tract 18.02, 0.0%.
Adults with a bachelor’s degree
902 of 5072 tracts are at least 1.5 times the state’s overall 34.1%, and 1560 are at two-thirds of it or less.
Highest: Tract 67.13, 92.0%. Lowest: Tract 160.02, 0.4%.
Median household income
783 of 5050 tracts are at least 1.5 times the typical tract’s $73,055, and 722 are at two-thirds of it or less.
Highest: Tract 16.02, $250,000 or more. Lowest: Tract 9807, $7,969.
American Community Survey 2020–2024 5-year estimates, by census tract. Income is capped at $250,000+ by the Census Bureau.
People
Who lives in Florida
Its median age of 43.1 is higher than the US (39.5). 22.7% of residents were born outside the US, and 31.4% speak a language other than English at home.
Age
Source: ACS 2025 1-year, table A01001.
Show data
| Florida | United States | |
|---|---|---|
| Under 18 | 18.9% ±0.1% , number 4,434,132 ±33,250 | 21.0% ±<0.1% , number 71,689,151 ±111,800 |
| 18 to 24 | 8.2% ±0.1% , number 1,928,422 ±24,750 | 9.3% ±<0.1% , number 31,716,680 ±98,660 |
| 25 to 34 | 12.4% ±0.1% , number 2,898,054 ±11,950 | 13.6% ±<0.1% , number 46,357,354 ±55,690 |
| 35 to 44 | 12.8% ±0.1% , number 3,010,202 ±28,750 | 13.4% ±<0.1% , number 45,746,189 ±105,700 |
| 45 to 54 | 11.8% ±0.1% , number 2,778,060 ±12,160 | 11.8% ±<0.1% , number 40,257,563 ±53,540 |
| 55 to 64 | 13.1% ±0.1% , number 3,062,516 ±30,940 | 12.1% ±<0.1% , number 41,242,904 ±104,700 |
| 65 to 74 | 12.2% ±0.1% , number 2,872,927 ±27,950 | 10.8% ±<0.1% , number 36,895,650 ±91,520 |
| 75 and over | 10.6% ±0.1% , number 2,478,205 ±26,600 | 8.2% ±<0.1% , number 27,879,368 ±78,140 |
Embed
Race and ethnicity
Source: ACS 2025 1-year, table A04001.
Show data
| Florida | United States | |
|---|---|---|
| White, not Hispanic | 48.3% ±0.1% , number 11,322,230 ±20,230 | 55.0% ±<0.1% , number 187,959,031 ±58,340 |
| Hispanic or Latino | 29.2% , number 6,849,242 | 20.5% ±<0.1% , number 69,975,516 ±13,270 |
| Black, not Hispanic | 13.9% ±0.1% , number 3,260,445 ±24,850 | 11.7% ±<0.1% , number 40,096,453 ±106,200 |
| Asian, not Hispanic | 3.1% ±<0.1% , number 738,258 ±11,690 | 6.5% ±<0.1% , number 22,096,709 ±58,340 |
| Other or multiracial | 5.5% ±0.2% , number 1,292,343 ±38,140 | 6.3% ±<0.1% , number 21,657,150 ±150,100 |
Embed
Language spoken at home
Source: ACS 2025 1-year, table C16001.
Show data
| Florida | United States | |
|---|---|---|
| English only | 68.6% ±0.3% , number 15,318,924 ±65,060 | 77.1% ±0.1% , number 249,390,588 ±275,300 |
| Spanish | 23.4% ±0.2% , number 5,227,275 ±41,340 | 13.9% ±0.1% , number 44,921,985 ±177,800 |
| Other Indo-European | 5.4% ±0.2% , number 1,215,292 ±35,800 | 4.0% ±<0.1% , number 12,862,980 ±113,500 |
| Asian and Pacific Island | 1.8% ±0.1% , number 401,654 ±19,650 | 3.8% ±<0.1% , number 12,288,841 ±99,740 |
| Arabic and other | 0.7% ±0.1% , number 156,039 ±14,120 | 1.3% ±<0.1% , number 4,116,949 ±71,480 |
Embed
Marital status
Source: ACS 2025 1-year, table A11001.
Show data
| Florida | United States | |
|---|---|---|
| Now married | 48.3% ±0.3% , number 9,579,614 ±51,450 | 47.9% ±0.1% , number 135,567,564 ±223,300 |
| Never married | 32.1% ±0.2% , number 6,367,194 ±40,300 | 34.8% ±0.1% , number 98,647,238 ±152,600 |
| Divorced | 11.7% ±0.2% , number 2,328,284 ±32,690 | 10.2% ±<0.1% , number 28,879,967 ±112,900 |
| Widowed | 6.1% ±0.1% , number 1,212,218 ±21,250 | 5.5% ±<0.1% , number 15,599,094 ±69,430 |
| Separated | 1.7% ±0.1% , number 341,586 ±16,170 | 1.6% ±<0.1% , number 4,441,399 ±49,160 |
Embed
Where people lived a year ago
Source: ACS 2025 1-year, table A08001.
Show data
| Florida | United States | |
|---|---|---|
| Same home | 87.4% ±0.3% , number 20,312,838 ±61,430 | 88.4% ±0.1% , number 298,889,697 ±214,800 |
| Same county | 6.4% ±0.2% , number 1,490,947 ±48,750 | 6.0% ±<0.1% , number 20,202,671 ±166,300 |
| Another county in the state | 3.1% ±0.1% , number 717,750 ±30,490 | 3.0% ±<0.1% , number 10,168,097 ±89,190 |
| Another state | 2.3% ±0.1% , number 524,160 ±23,680 | 2.1% ±<0.1% , number 7,025,589 ±81,660 |
| Another country | 0.9% ±0.1% , number 204,360 ±16,400 | 0.6% ±<0.1% , number 1,984,943 ±47,210 |
Embed
Top countries of birth, among those born abroad
Source: ACS 2025 1-year, table A07001.
Show data
| Florida | |
|---|---|
| Cuba | 23.0% , number 1,228,196 |
| Colombia | 7.3% , number 391,119 |
| Venezuela | 7.0% , number 375,212 |
| Haiti | 6.2% , number 329,815 |
| Mexico | 4.7% , number 250,315 |
| Jamaica | 4.5% , number 240,802 |
Embed
All the numbers
| Indicator | Florida | US | Rank among states* | Table |
|---|---|---|---|---|
| Population | 23,462,518 | 341,784,859 | 3rd | A00001 |
| People per square mile | 437 | 97 | 9th | A00002 |
| Land area (square miles) | 53,658 | – | – | A00002 |
| Median age | 43.1 ±0.1 | 39.5 ±0.1 | 5th | A01004 |
| Under 18 | 18.9% ±0.1% , number 4,434,132 ±33,250 | 21.0% ±<0.1% , number 71,689,151 ±111,800 | 45th | B02002 |
| 65 and over | 22.8% ±0.2% , number 5,351,132 ±38,590 | 19.0% ±<0.1% , number 64,775,018 ±120,300 | 3rd | B02002 |
| Born outside the US | 22.7% ±0.2% , number 5,336,897 ±57,090 | 14.7% ±0.1% , number 50,409,320 ±204,800 | 4th | A06001 |
| Speak a language other than English at home | 31.4% ±0.3% , number 7,000,260 ±59,800 | 22.9% ±0.1% , number 74,190,755 ±244,000 | 6th | C16001 |
| Veterans (adults) | 7.0% ±0.1% , number 1,318,557 ±26,120 | 5.9% ±<0.1% , number 15,746,228 ±85,320 | 22nd | A16002 |
| Living with a disability | 13.8% ±0.2% , number 3,185,211 ±36,560 | 13.7% ±<0.1% , number 46,271,455 ±126,000 | 26th | B18101 |
| Women 15–50 who had a baby in the past year | 4.4% ±0.2% , number 225,887 ±11,640 | 5.0% ±0.1% , number 4,016,759 ±44,040 | 42nd | B13002 |
| Lived in the same home a year ago | 87.4% ±0.3% , number 20,312,838 ±61,430 | 88.4% ±0.1% , number 298,889,697 ±214,800 | 37th | A08001 |
| White, not Hispanic | 48.3% ±0.1% , number 11,322,230 ±20,230 | 55.0% ±<0.1% , number 187,959,031 ±58,340 | 43rd | A04001 |
| Hispanic or Latino | 29.2% , number 6,849,242 | 20.5% ±<0.1% , number 69,975,516 ±13,270 | 6th | A04001 |
| Black, not Hispanic | 13.9% ±0.1% , number 3,260,445 ±24,850 | 11.7% ±<0.1% , number 40,096,453 ±106,200 | 13th | A04001 |
| Asian, not Hispanic | 3.1% ±<0.1% , number 738,258 ±11,690 | 6.5% ±<0.1% , number 22,096,709 ±58,340 | 27th | A04001 |
*1 is the highest. Population is ranked among all states, and the rest among those of 1,000 people or more, whose figures can be ranked. Ranks use 5-year estimates, the only ones covering every state, so they can differ slightly from the figures here.
Income and work
Lower incomes than the US
The median household income is $80,846, lower than the US ($84,780). 11.2% of people live in poverty, and 10.5% have no health insurance, higher than the US (8.4%).
Household income
Source: ACS 2025 1-year, table A14001.
Show data
| Florida | United States | |
|---|---|---|
| Under $25,000 | 13.8% ±0.3% , number 1,289,017 ±25,920 | 14.0% ±0.1% , number 18,727,548 ±88,990 |
| $25,000 to $49,999 | 16.4% ±0.3% , number 1,527,057 ±27,040 | 15.4% ±0.1% , number 20,665,585 ±101,400 |
| $50,000 to $74,999 | 16.5% ±0.3% , number 1,534,897 ±28,140 | 15.3% ±0.1% , number 20,513,565 ±88,500 |
| $75,000 to $99,999 | 13.2% ±0.2% , number 1,227,860 ±21,740 | 12.5% ±0.1% , number 16,814,245 ±87,520 |
| $100,000 to $149,999 | 18.1% ±0.3% , number 1,683,614 ±32,920 | 17.9% ±0.1% , number 24,018,984 ±99,670 |
| $150,000 to $199,999 | 9.3% ±0.2% , number 863,162 ±20,270 | 10.1% ±0.1% , number 13,521,827 ±70,660 |
| $200,000 or more | 12.9% ±0.3% , number 1,201,189 ±26,500 | 14.8% ±0.1% , number 19,801,668 ±84,120 |
Embed
What residents do for work
Source: ACS 2025 1-year, table A17004.
Show data
| Florida | United States | |
|---|---|---|
| Education and health care | 21.7% ±0.3% , number 2,441,648 ±32,880 | 24.4% ±0.1% , number 40,862,193 ±140,800 |
| Professional and business services | 14.5% ±0.3% , number 1,632,612 ±29,530 | 12.8% ±0.1% , number 21,375,231 ±87,110 |
| Retail trade | 11.6% ±0.2% , number 1,301,054 ±27,820 | 10.6% ±0.1% , number 17,781,181 ±96,660 |
| Arts, food and lodging | 10.9% ±0.3% , number 1,230,124 ±31,700 | 8.9% ±0.1% , number 14,811,502 ±87,840 |
| Finance, insurance and real estate | 8.1% ±0.2% , number 906,837 ±25,510 | 6.6% ±<0.1% , number 11,025,569 ±68,570 |
| Construction | 7.9% ±0.2% , number 885,598 ±24,740 | 6.7% ±<0.1% , number 11,254,981 ±79,620 |
| Transportation and warehousing | 6.5% ±0.2% , number 733,523 ±19,710 | 5.9% ±<0.1% , number 9,832,211 ±73,020 |
| Manufacturing | 5.2% ±0.2% , number 585,260 ±17,180 | 9.6% ±0.1% , number 16,064,394 ±91,270 |
Embed
Where workers come from and go
Florida has 9,619,338 jobs and 9,620,397 employed residents. 127,630 people commute in to work and 128,689 commute out, while 9,491,708 both live and work here. The most commuters come from Georgia.
Most commuters come from
- Georgia: 37,174
- Alabama: 21,382
- North Carolina: 6,754
Most residents commute to
- Georgia: 28,642
- Alabama: 16,473
- New York: 9,676
Show data
| Florida | |
|---|---|
| Live and work here | 9,491,708 |
| Work here, live elsewhere | 127,630 |
| Live here, work elsewhere | 128,689 |
Embed
All the numbers
| Indicator | Florida | US | Rank among states* | Table |
|---|---|---|---|---|
| Median household income | $80,846 ±$521 | $84,780 ±$215 | 34th | A14006 |
| Income per person | $46,222 ±$386 | $47,171 ±$115 | 25th | A14024 |
| Income inequality (Gini index) | 0.484 ±0.003 | 0.482 ±0.001 | 7th | A14028 |
| Living in poverty | 11.2% ±0.3% , number 2,563,194 ±66,140 | 11.8% ±0.1% , number 39,264,183 ±277,400 | 19th | A13004 |
| Unemployment rate | 4.4% ±0.1% , number 520,528 ±17,380 | 4.9% ±<0.1% , number 8,574,594 ±64,350 | 29th | A17005 |
| No health insurance | 10.5% ±0.2% , number 2,424,166 ±42,270 | 8.4% ±<0.1% , number 28,323,306 ±152,000 | 4th | A20001 |
*1 is the highest. Population is ranked among all states, and the rest among those of 1,000 people or more, whose figures can be ranked. Ranks use 5-year estimates, the only ones covering every state, so they can differ slightly from the figures here.
Education
College degrees close to the US
36.7% of adults 25 and over have a bachelor’s degree or more, lower than the US (37.4%).
Highest level of education
Source: ACS 2025 1-year, table A12001.
Show data
| Florida | United States | |
|---|---|---|
| Less than high school | 8.7% ±0.2% , number 1,492,559 ±30,440 | 9.4% ±0.1% , number 22,321,002 ±120,500 |
| High school only | 26.0% ±0.3% , number 4,446,879 ±47,100 | 25.6% ±0.1% , number 61,096,726 ±203,400 |
| Some college | 28.6% ±0.3% , number 4,888,312 ±51,830 | 27.7% ±0.1% , number 65,920,977 ±173,500 |
| Bachelor’s degree | 22.4% ±0.2% , number 3,834,049 ±41,270 | 22.3% ±0.1% , number 53,224,312 ±196,700 |
| Graduate degree | 14.3% ±0.2% , number 2,438,165 ±34,790 | 15.0% ±0.1% , number 35,816,011 ±159,400 |
Embed
All the numbers
| Indicator | Florida | US | Rank among states* | Table |
|---|---|---|---|---|
| Bachelor’s degree or more | 36.7% ±0.3% , number 6,272,214 ±53,970 | 37.4% ±0.1% , number 89,040,323 ±253,200 | 27th | A12001 |
| High school graduate or more | 91.3% ±0.5% , number 15,607,405 ±88,420 | 90.6% ±0.2% , number 216,058,026 ±368,200 | 36th | A12001 |
*1 is the highest. Population is ranked among all states, and the rest among those of 1,000 people or more, whose figures can be ranked. Ranks use 5-year estimates, the only ones covering every state, so they can differ slightly from the figures here.
Housing
Home values outran incomes
32.0% of households rent, lower than the US (34.7%). The median home is worth $396,700 and the median rent is $1,866. After inflation, home values rose 61% from 2015 to 2025, while household income rose 19%.
Housing costs and income, 2015 to 2025, after inflation
Source: ACS 1-year, table A10036, A18009, A14006.
Show data
| Florida | United States | |
|---|---|---|
| Median home value | +61.0% | +39.3% |
| Median rent | +30.2% | +18.5% |
| Median household income | +19.4% | +10.9% |
Embed
Types of homes
Source: ACS 2025 1-year, table A10032.
Show data
| Florida | United States | |
|---|---|---|
| Single-family, detached | 54.8% ±0.3% , number 5,915,140 ±35,490 | 60.9% ±0.1% , number 90,335,844 ±173,300 |
| Single-family, attached | 7.2% ±0.2% , number 774,945 ±18,100 | 6.4% ±<0.1% , number 9,527,703 ±51,230 |
| 2 to 4 units | 5.5% ±0.2% , number 594,038 ±19,040 | 7.5% ±0.1% , number 11,109,005 ±75,790 |
| 5 to 19 units | 9.5% ±0.2% , number 1,027,196 ±25,690 | 8.7% ±0.1% , number 12,829,882 ±97,590 |
| 20 or more units | 15.3% ±0.3% , number 1,652,350 ±27,480 | 11.1% ±0.1% , number 16,381,450 ±92,310 |
| Mobile homes and other | 7.6% ±0.2% , number 825,040 ±16,220 | 5.4% ±<0.1% , number 8,045,083 ±53,680 |
Embed
When homes were built
Source: ACS 2025 1-year, table A10055.
Show data
| Florida | United States | |
|---|---|---|
| 2010 or later | 20.0% ±0.3% , number 1,861,576 ±32,010 | 15.1% ±0.1% , number 20,257,912 ±101,300 |
| 2000 to 2009 | 18.2% ±0.3% , number 1,694,668 ±29,280 | 13.8% ±0.1% , number 18,535,840 ±92,260 |
| 1980 to 1999 | 31.2% ±0.4% , number 2,906,458 ±37,140 | 24.1% ±0.1% , number 32,332,570 ±118,900 |
| 1960 to 1979 | 21.5% ±0.3% , number 2,007,903 ±29,520 | 22.9% ±0.1% , number 30,726,302 ±110,000 |
| Before 1960 | 9.2% ±0.2% , number 856,191 ±18,210 | 24.0% ±0.1% , number 32,210,798 ±121,500 |
Embed
All the numbers
| Indicator | Florida | US | Rank among states* | Table |
|---|---|---|---|---|
| Housing units | 10,788,709 | – | – | A10001 |
| Households | 9,326,796 ±31,150 | – | – | A10008 |
| People per household | 2.46 ±0.01 | 2.49 ±0.01 | 13th | A10003 |
| Households that rent | 32.0% ±0.3% , number 2,981,485 ±30,580 | 34.7% ±0.1% , number 46,551,688 ±193,200 | 29th | A10060 |
| Vacant homes | 13.6% ±0.3% , number 1,461,913 ±31,260 | 9.6% ±0.1% , number 14,165,545 ±137,100 | 5th | A10047, A10060 |
| Median gross rent | $1,866 ±$11 | $1,557 ±$4 | 9th | A18009 |
| Median home value | $396,700 ±$2,125 | $371,100 ±$646 | 20th | A10036 |
| Renters paying 30% or more of income | 57.5% ±0.9% , number 1,713,801 ±32,390 | 48.3% ±0.2% , number 22,486,693 ±122,100 | 1st | A18002 |
| Owners paying 30% or more of income | 30.0% ±0.4% , number 1,900,635 ±30,270 | 24.2% ±0.1% , number 21,201,943 ±93,050 | 5th | A10040 |
| Homes built before 1960 | 9.2% ±0.2% , number 856,191 ±18,210 | 24.0% ±0.1% , number 32,210,798 ±121,500 | 48th | A10055 |
*1 is the highest. Population is ranked among all states, and the rest among those of 1,000 people or more, whose figures can be ranked. Ranks use 5-year estimates, the only ones covering every state, so they can differ slightly from the figures here.
Getting around
How people get around
69.9% of workers drive alone and 15.5% work from home. 45.1% of those who travel to work spend 30 minutes or more getting there, and 6.3% of households have no vehicle.
How people get to work
Source: ACS 2025 1-year, table A09005.
Show data
| Florida | United States | |
|---|---|---|
| Drive alone | 69.9% ±0.4% , number 7,775,736 ±53,420 | 69.8% ±0.1% , number 115,297,377 ±192,900 |
| Carpool | 9.2% ±0.2% , number 1,022,569 ±27,660 | 8.9% ±0.1% , number 14,712,170 ±97,240 |
| Public transit | 1.8% ±0.1% , number 202,667 ±12,390 | 4.3% ±<0.1% , number 7,100,386 ±63,330 |
| Walk | 1.6% ±0.1% , number 174,203 ±12,140 | 2.4% ±<0.1% , number 4,016,469 ±41,070 |
| Work from home | 15.5% ±0.2% , number 1,722,338 ±28,440 | 12.9% ±0.1% , number 21,288,393 ±105,700 |
| Other | 2.1% ±0.1% , number 230,606 ±15,020 | 1.7% ±<0.1% , number 2,799,658 ±41,510 |
Embed
Time spent getting to work
Source: ACS 2025 1-year, table B09001.
Show data
| Florida | United States | |
|---|---|---|
| Under 10 minutes | 8.6% ±0.2% , number 806,033 ±23,070 | 12.0% ±0.1% , number 17,199,225 ±93,440 |
| 10 to 19 minutes | 24.9% ±0.4% , number 2,337,539 ±39,000 | 27.8% ±0.1% , number 40,059,540 ±137,700 |
| 20 to 29 minutes | 21.5% ±0.3% , number 2,024,736 ±32,930 | 21.0% ±0.1% , number 30,221,743 ±111,100 |
| 30 to 39 minutes | 19.8% ±0.3% , number 1,864,169 ±33,810 | 17.1% ±0.1% , number 24,659,138 ±103,800 |
| 40 to 59 minutes | 15.1% ±0.3% , number 1,420,367 ±30,840 | 12.6% ±0.1% , number 18,104,709 ±97,070 |
| 60 minutes or more | 10.1% ±0.3% , number 952,937 ±25,930 | 9.5% ±0.1% , number 13,681,705 ±84,440 |
Embed
Vehicles per household
Source: ACS 2025 1-year, table A10030.
Show data
| Florida | United States | |
|---|---|---|
| None | 6.3% ±0.2% , number 590,071 ±17,530 | 8.8% ±0.1% , number 11,781,997 ±77,240 |
| One | 39.0% ±0.4% , number 3,639,343 ±39,480 | 33.1% ±0.1% , number 44,424,682 ±160,700 |
| Two | 37.5% ±0.3% , number 3,500,785 ±34,010 | 36.0% ±0.1% , number 48,200,889 ±176,800 |
| Three or more | 17.1% ±0.3% , number 1,596,597 ±26,530 | 22.1% ±0.1% , number 29,655,854 ±113,300 |
Embed
All the numbers
| Indicator | Florida | US | Rank among states* | Table |
|---|---|---|---|---|
| Drive to work alone | 69.9% ±0.4% , number 7,775,736 ±53,420 | 69.8% ±0.1% , number 115,297,377 ±192,900 | 32nd | A09005 |
| Take public transit | 1.8% ±0.1% , number 202,667 ±12,390 | 4.3% ±<0.1% , number 7,100,386 ±63,330 | 20th | A09005 |
| Work from home | 15.5% ±0.2% , number 1,722,338 ±28,440 | 12.9% ±0.1% , number 21,288,393 ±105,700 | 20th | A09005 |
| Commute 30 minutes or more | 45.1% ±0.5% , number 4,237,473 ±52,600 | 39.2% ±0.1% , number 56,445,552 ±165,300 | 6th | B09001 |
| Households with no vehicle | 6.3% ±0.2% , number 590,071 ±14,720 | 8.8% ±<0.1% , number 11,781,997 ±64,240 | 30th | A10030 |
*1 is the highest. Population is ranked among all states, and the rest among those of 1,000 people or more, whose figures can be ranked. Ranks use 5-year estimates, the only ones covering every state, so they can differ slightly from the figures here.
Places
The largest cities in Florida
Population, from the latest estimates available. Figures cover the whole of each place.
Largest cities
- Jacksonville: 1,017,687
- Miami: 489,809
- Tampa: 413,563
- Orlando: 333,881
- Port St. Lucie: 268,051
- St. Petersburg: 264,028
- Cape Coral: 236,259
- Hialeah: 230,974
States like this one
- Pennsylvania: 13,018,639
- Illinois: 12,694,798
- North Carolina: 10,730,404
- New Jersey: 9,343,809
States at least a third this size, with the closest income, education, age, housing and origins.
Every county and place in Florida
Find any county, city, town, metro area, ZIP code, school district or district in Florida.
Counties
Each of the 67 counties with its population, from ACS 2020–2024 5-year estimates.
- Alachua County285,492
- Baker County28,430
- Bay County186,393
- Bradford County27,885
- Brevard County632,780
- Broward County1.98M
- Calhoun County13,492
- Charlotte County201,064
- Citrus County162,472
- Clay County227,584
- Collier County398,291
- Columbia County71,789
- DeSoto County35,386
- Dixie County17,058
- Duval County1.02M
- Escambia County325,923
- Flagler County126,528
- Franklin County12,553
- Gadsden County43,710
- Gilchrist County19,040
- Glades County12,563
- Gulf County15,131
- Hamilton County13,616
- Hardee County25,675
- Hendry County42,382
- Hernando County207,018
- Highlands County105,702
- Hillsborough County1.52M
- Holmes County19,513
- Indian River County166,936
- Jackson County48,250
- Jefferson County15,091
- Lafayette County8,161
- Lake County412,924
- Lee County817,666
- Leon County297,542
- Levy County45,391
- Liberty County7,687
- Madison County18,089
- Manatee County429,792
- Marion County400,078
- Martin County162,176
- Miami-Dade County2.74M
- Monroe County81,860
- Nassau County97,859
- Okaloosa County216,599
- Okeechobee County40,816
- Orange County1.47M
- Osceola County427,415
- Palm Beach County1.53M
- Pasco County611,444
- Pinellas County963,481
- Polk County790,694
- Putnam County75,164
- Santa Rosa County198,472
- Sarasota County459,547
- Seminole County481,470
- St. Johns County306,934
- St. Lucie County360,500
- Sumter County143,408
- Suwannee County45,342
- Taylor County21,503
- Union County15,701
- Volusia County579,622
- Wakulla County35,387
- Walton County82,948
- Washington County25,529
Cities, towns and other places
Each of the 955 with its population, from ACS 2020–2024 5-year estimates. Census-designated places are communities without a local government of their own, drawn by the Census Bureau so they can be counted.
- Acacia Villas131
- Alachua10,743
- Alafaya92,449
- Alford354
- Allentown955
- Altamonte Springs46,116
- Altha457
- Altoona37
- Alturas4,581
- Alva3,389
- Andrews1,275
- Anna Maria765
- Apalachicola2,431
- Apollo Beach33,355
- Apopka58,232
- Arcadia7,707
- Archer958
- Aripeka258
- Asbury Lake14,458
- Astatula2,559
- Astor1,391
- Atlantic Beach13,363
- Atlantis2,038
- Auburndale18,530
- Aucilla203
- Avalon886
- Ave Maria8,258
- Aventura39,885
- Avon Park10,057
- Azalea Park16,180
- Babson Park1,093
- Bagdad4,466
- Bal Harbour3,055
- Baldwin1,298
- Balm7,181
- Bardmoor10,292
- Bartow20,438
- Bascom137
- Bay Harbor Islands5,847
- Bay Hill4,512
- Bay Lake21
- Bay Pines2,519
- Bayonet Point23,822
- Bayport189
- Bayshore Gardens18,131
- Beacon Square7,895
- Bear Creek2,179
- Bee Ridge10,334
- Bell563
- Bellair-Meadowbrook Terrace14,755
- Belle Glade16,972
- Belle Isle7,444
- Belleair4,428
- Belleair Beach1,526
- Belleair Bluffs2,070
- Belleair Shore56
- Belleview5,805
- Bellview26,488
- Berkshire Lakes2,064
- Berrydale185
- Beverly Beach607
- Beverly Hills9,650
- Big Coppitt Key3,109
- Big Pine Key4,258
- Biscayne Gardens35,472
- Biscayne Park3,085
- Bithlo10,486
- Black Diamond1,298
- Black Hammock1,290
- Bloomingdale23,827
- Blountstown3,136
- Boca Raton100,234
- Bokeelia1,930
- Bonifay2,797
- Bonita Springs55,904
- Boulevard Gardens1,499
- Bowling Green2,226
- Boynton Beach81,435
- Bradenton57,014
- Bradenton Beach733
- Bradfordville18,953
- Bradley Junction631
- Brandon119,767
- Branford950
- Brent23,813
- Briny Breezes394
- Bristol1,020
- Broadview Park7,119
- Bronson1,600
- Brooker223
- Brookridge4,923
- Brooksville9,457
- Brownsdale378
- Brownsville16,936
- Buckhead Ridge986
- Buckingham4,311
- Buenaventura Lakes32,682
- Bunnell3,682
- Burnt Store Marina2,157
- Bushnell3,187
- Butler Beach4,610
- Cabana Colony2,045
- Callahan1,514
- Callaway13,496
- Campbell2,123
- Campbellton217
- Canal Point207
- Cape Canaveral10,006
- Cape Coral215,536
- Capitola375
- Captiva99
- Carrabelle2,438
- Carrollwood36,725
- Caryville309
- Casselberry30,135
- Cedar Grove3,802
- Cedar Key875
- Celebration13,667
- Center Hill1,304
- Century1,826
- Chaires588
- Charleston Park44
- Charlotte Harbor4,239
- Charlotte Park1,966
- Chattahoochee2,979
- Cheval13,969
- Chiefland1,909
- Chipley3,683
- Chokoloskee808
- Christmas1,696
- Chuluota2,187
- Chumuckla681
- Cinco Bayou609
- Citrus Hills9,304
- Citrus Park28,804
- Citrus Springs12,215
- Clarcona3,850
- Clearwater117,247
- Clermont46,853
- Cleveland2,683
- Clewiston7,348
- Cloud Lake212
- Cobbtown26
- Cocoa19,554
- Cocoa Beach11,377
- Cocoa West5,923
- Coconut Creek58,330
- Coleman705
- Combee Settlement5,242
- Connerton7,650
- Conway12,928
- Cooper City34,660
- Coral Gables49,802
- Coral Springs136,103
- Coral Terrace24,895
- Cortez5,205
- Cottondale822
- Country Club51,296
- Country Walk19,291
- Crawfordville5,732
- Crescent Beach809
- Crescent City1,944
- Crestview28,773
- Crooked Lake Park2,641
- Cross City1,955
- Crystal Lake5,451
- Crystal River3,638
- Crystal Springs1,298
- Cudjoe Key2,492
- Cutler Bay45,070
- Cypress Gardens10,077
- Cypress Lake13,032
- Cypress Quarters1,697
- Dade City8,152
- Dade City North2,803
- Dania Beach32,180
- Davenport13,238
- Davie108,346
- Day347
- Daytona Beach78,992
- Daytona Beach Shores5,188
- De Leon Springs2,687
- DeBary22,869
- Deerfield Beach88,093
- DeFuniak Springs6,532
- DeLand41,611
- DeLand Southwest1,024
- Delray Beach67,979
- Deltona97,334
- Desoto Acres641
- Desoto Lakes1,735
- Destin14,077
- Dickerson City76
- Dixonville57
- Doctor Phillips12,984
- Doral79,216
- Dover3,009
- Duck Key647
- Dundee5,863
- Dunedin36,062
- Dunnellon2,216
- Eagle Lake3,893
- East Bronson2,649
- East Lake33,283
- East Lake-Orient Park29,213
- East Milton14,783
- East Palatka1,494
- East Williston520
- Eastpoint3,163
- Eatonville2,290
- Ebro229
- Edgewater23,627
- Edgewood2,758
- Eglin AFB2,778
- Egypt Lake-Leto35,873
- El Portal1,809
- Elfers15,006
- Ellenton5,133
- Englewood20,091
- Ensley23,760
- Estero37,858
- Esto375
- Eustis24,119
- Everglades200
- Fairview Shores11,844
- Fanning Springs942
- Feather Sound3,476
- Fellsmere4,953
- Fern Park7,981
- Fernandina Beach13,420
- Ferndale359
- Ferry Pass30,053
- Fidelis91
- Fish Hawk26,186
- Fisher Island1,026
- Five Points1,097
- Flagler Beach5,373
- Flagler Estates4,321
- Fleming Island29,766
- Floral City5,437
- Florida City12,943
- Florida Gulf Coast University4,836
- Florida Ridge20,889
- Floridatown293
- Forest City15,312
- Fort Braden917
- Fort Denaud1,639
- Fort Green39
- Fort Green Springs762
- Fort Lauderdale185,604
- Fort Meade5,225
- Fort Myers95,051
- Fort Myers Beach5,513
- Fort Myers Shores5,946
- Fort Pierce49,082
- Fort Pierce North7,224
- Fort Pierce South5,028
- Fort Walton Beach21,025
- Fort White531
- Fountainebleau55,665
- Four Corners65,048
- Franklin Park1,688
- Freeport6,689
- Frostproof3,346
- Fruit Cove35,877
- Fruitland Park8,740
- Fruitville15,172
- Fuller Heights10,083
- Fussels Corner5,682
- Gainesville145,702
- Garcon Point563
- Garden Grove637
- Gardner381
- Gateway11,176
- Geneva3,441
- Gibsonton18,754
- Gifford4,668
- Gladeview16,655
- Glen Ridge289
- Glen St. Mary612
- Glencoe1,445
- Glenvar Heights19,395
- Golden Beach691
- Golden Gate29,234
- Goldenrod12,878
- Golf265
- Gonzalez14,458
- Goodland104
- Gotha1,124
- Goulding3,734
- Goulds14,425
- Graceville2,483
- Grand Ridge997
- Grant-Valkaria4,921
- Green Cove Springs10,044
- Greenacres44,373
- Greenbriar2,283
- Greensboro949
- Greenville1,650
- Greenwood803
- Grenelefe2,797
- Gretna1,342
- Grove City2,106
- Groveland22,012
- Gulf Breeze6,660
- Gulf Gate7,998
- Gulf Stream785
- Gulfport11,734
- Gun Club Estates1,050
- Haines City34,234
- Hallandale Beach41,854
- Hampton499
- Harbor Bluffs3,076
- Harbour Heights4,289
- Harlem2,420
- Harlem Heights1,122
- Harold368
- Hastings432
- Havana2,031
- Haverhill2,823
- Hawthorne1,625
- Heathrow6,769
- Heritage Bay802
- Heritage Pines1,477
- Hernando9,299
- Hernando Beach2,675
- Hialeah226,165
- Hialeah Gardens22,915
- High Point3,548
- High Springs6,544
- Highland Beach4,311
- Highland City13,276
- Highland Park282
- Hill 'n Dale3,083
- Hillcrest Heights377
- Hilliard3,034
- Hillsboro Beach2,271
- Hillsboro Pines457
- Hobe Sound13,817
- Holden Heights3,286
- Holden Lakes3,522
- Holiday22,785
- Holley2,487
- Holly Hill13,084
- Hollywood155,082
- Holmes Beach3,047
- Homeland363
- Homestead82,807
- Homestead Base1,125
- Homosassa1,942
- Homosassa Springs15,701
- Horizon West67,416
- Horseshoe Beach78
- Hosford982
- Howey-in-the-Hills2,153
- Hudson11,254
- Hunters Creek22,819
- Hurlburt Field2,951
- Hutchinson Island South4,175
- Hypoluxo2,798
- Immokalee26,361
- Indialantic3,065
- Indian Creek39
- Indian Harbour Beach9,025
- Indian Lake Estates984
- Indian River Estates7,685
- Indian River Shores4,386
- Indian Rocks Beach3,664
- Indian Shores1,243
- Indiantown6,695
- Inglis1,742
- Interlachen1,923
- Inverness7,770
- Inverness Highlands North2,830
- Inverness Highlands South7,449
- Inwood7,556
- Iona13,631
- Islamorada, Village of Islands7,068
- Island Walk2,722
- Istachatta115
- Ives Estates28,506
- Jacksonville977,670
- Jacksonville Beach23,654
- Jacob City230
- Jan Phyl Village5,708
- Jasmine Estates23,571
- Jasper3,072
- Jay796
- Jennings1,164
- Jensen Beach12,531
- June Park4,255
- Juno Beach3,890
- Juno Ridge1,072
- Jupiter61,883
- Jupiter Farms12,945
- Jupiter Inlet Colony511
- Jupiter Island845
- Kathleen7,201
- Kendale Lakes52,622
- Kendall79,562
- Kendall West35,912
- Kenneth City5,012
- Kensington Park3,916
- Kenwood Estates1,263
- Key Biscayne14,791
- Key Colony Beach511
- Key Largo13,026
- Key Vista1,418
- Key West25,720
- Keystone25,858
- Keystone Heights1,576
- Kissimmee81,479
- La Crosse124
- LaBelle5,184
- Lacoochee1,289
- Lady Lake16,675
- Laguna Beach3,830
- Lake Alfred7,277
- Lake Belvedere Estates2,672
- Lake Buena Vista15
- Lake Butler CDP17,125
- Lake Butler city1,601
- Lake City12,515
- Lake Clarke Shores3,587
- Lake Hamilton1,777
- Lake Hart426
- Lake Helen2,918
- Lake Kathryn1,024
- Lake Kerr1,697
- Lake Lindsey202
- Lake Lorraine6,903
- Lake Mack-Forest Hills2,200
- Lake Magdalene32,083
- Lake Mary16,860
- Lake Mary Jane1,792
- Lake Mystic601
- Lake Panasoffkee4,768
- Lake Park9,081
- Lake Placid2,477
- Lake Sarasota3,595
- Lake Wales16,785
- Lake Worth Beach43,365
- Lakeland119,961
- Lakeland Highlands12,102
- Lakeside32,105
- Lakewood Park13,866
- Lakewood Ranch43,945
- Lamont78
- Land O' Lakes38,910
- Lantana12,256
- Largo82,617
- Lauderdale Lakes36,404
- Lauderdale-by-the-Sea6,232
- Lauderhill74,896
- Laurel11,741
- Laurel Hill355
- Lawtey897
- Layton118
- Lazy Lake22
- Lealman20,567
- Lecanto7,398
- Lee835
- Leesburg30,807
- Lehigh Acres132,353
- Leisure City27,808
- Lely3,804
- Lely Resort8,582
- Lemon Grove547
- Liberty Triangle24,888
- Lighthouse Point10,600
- Limestone25
- Limestone Creek1,466
- Lisbon100
- Live Oak6,985
- Lloyd187
- Lochmoor Waterway Estates6,511
- Lockhart15,371
- Longboat Key7,539
- Longwood16,337
- Loughman7,591
- Lower Grand Lagoon4,287
- Loxahatchee Groves3,462
- Lutz27,106
- Lynn Haven20,081
- Macclenny7,748
- Madeira Beach3,953
- Madison2,967
- Maitland19,469
- Malabar3,066
- Malone1,998
- Manalapan353
- Manasota Key1,711
- Manatee Road2,426
- Mango13,242
- Mangonia Park2,384
- Marathon9,914
- Marco Island16,205
- Marco Shores-Hammock Bay794
- Margate59,198
- Marianna7,150
- Marineland13
- Marion Oaks23,972
- Mary Esther4,061
- Masaryktown1,262
- Mascotte7,949
- Matlacha770
- Matlacha Isles-Matlacha Shores127
- Mayo1,147
- McGregor8,490
- McIntosh333
- Meadow Oaks3,705
- Meadow Woods42,852
- Medley988
- Medulla10,985
- Melbourne86,576
- Melbourne Beach3,250
- Melbourne Village778
- Memphis9,185
- Merritt Island34,992
- Mexico Beach1,099
- Miami459,745
- Miami Beach82,031
- Miami Gardens113,177
- Miami Lakes31,553
- Miami Shores11,752
- Miami Springs13,726
- Micanopy747
- Micco8,896
- Miccosukee478
- Middleburg11,644
- Midway CDP (Santa Rosa County)21,317
- Midway CDP (Seminole County)1,407
- Midway city3,511
- Milton10,733
- Mims7,610
- Minneola16,598
- Miramar138,600
- Miramar Beach8,902
- Molino1,447
- Monticello2,659
- Montura4,121
- Montverde2,249
- Moon Lake4,638
- Moore Haven2,131
- Morriston50
- Mount Carmel280
- Mount Dora17,278
- Mount Plymouth4,604
- Mulat307
- Mulberry4,188
- Munson292
- Myrtle Grove15,595
- Naples19,704
- Naples Manor5,501
- Naples Park5,122
- Naranja15,796
- Nassau Village-Ratliff4,737
- Navarre39,838
- Navarre Beach1,558
- Neptune Beach7,168
- New Port Richey17,425
- New Port Richey East11,939
- New Smyrna Beach31,974
- Newberry7,865
- Niceville16,544
- Nobleton386
- Nocatee27,442
- Nokomis3,452
- Noma237
- North Bay Village8,118
- North Brooksville4,227
- North DeLand1,102
- North Fort Myers44,993
- North Key Largo1,808
- North Lauderdale45,234
- North Merritt Island9,025
- North Miami60,344
- North Miami Beach43,898
- North Palm Beach13,238
- North Port84,605
- North Redington Beach1,404
- North River Shores3,633
- North Sarasota2,824
- North Weeki Wachee8,979
- Northdale25,710
- Oak Hill1,694
- Oak Ridge23,364
- Oakland3,646
- Oakland Park44,682
- Oakleaf Plantation32,070
- Ocala66,584
- Ocala Estates1,705
- Ocean Breeze777
- Ocean City5,941
- Ocean Ridge1,537
- Ocklawaha1,586
- Ocoee49,033
- Odessa8,381
- Ojus19,198
- Okahumpka449
- Okeechobee5,479
- Old Miakka1,818
- Oldsmar14,904
- Olga3,282
- Olympia Heights12,399
- On Top of the World16,007
- Ona44
- Opa-locka16,282
- Orange City14,372
- Orange Park9,055
- Orangetree6,084
- Orchid441
- Oriole Beach2,005
- Orlando319,758
- Orlovista6,890
- Ormond Beach43,976
- Ormond-by-the-Sea7,146
- Osprey5,943
- Otter Creek142
- Oviedo40,599
- Pace26,282
- Page Park917
- Pahokee5,609
- Paisley757
- Palatka10,650
- Palm Bay130,132
- Palm Beach9,348
- Palm Beach Gardens60,959
- Palm Beach Shores1,248
- Palm City26,371
- Palm Coast98,258
- Palm Harbor61,512
- Palm River-Clair Mel27,844
- Palm Shores1,458
- Palm Springs27,356
- Palm Springs North5,410
- Palm Valley19,796
- Palmer Ranch16,867
- Palmetto13,588
- Palmetto Bay24,639
- Palmetto Estates16,129
- Palmona Park1,115
- Panacea894
- Panama City34,979
- Panama City Beach18,971
- Paradise Heights877
- Parker4,509
- Parkland37,178
- Pasadena Hills13,505
- Patrick AFB1,644
- Paxton686
- Pea Ridge3,560
- Pebble Creek10,447
- Pelican Bay6,159
- Pelican Marsh2,617
- Pembroke Park6,360
- Pembroke Pines173,194
- Penney Farms642
- Pensacola54,036
- Pensacola Station5,281
- Perry7,068
- Pierson1,327
- Pine Air2,258
- Pine Castle10,371
- Pine Hills80,105
- Pine Island123
- Pine Island Center1,834
- Pine Lakes1,437
- Pine Level248
- Pine Manor3,660
- Pine Ridge (Citrus County)10,762
- Pine Ridge (Collier County)1,910
- Pinecraft305
- Pinecrest18,462
- Pineland455
- Pinellas Park53,560
- Pinewood18,114
- Pioneer868
- Pittman89
- Plant City40,887
- Plantation CDP4,531
- Plantation city96,293
- Plantation Island43
- Plantation Mobile Home Park1,032
- Poinciana75,068
- Point Baker3,976
- Polk City2,974
- Pomona Park755
- Pompano Beach114,147
- Ponce de Leon780
- Ponce Inlet3,435
- Port Charlotte66,133
- Port LaBelle7,923
- Port Orange64,767
- Port Richey3,364
- Port Salerno11,184
- Port St. Joe3,616
- Port St. John25,120
- Port St. Lucie232,491
- Pretty Bayou2,906
- Princeton42,625
- Progress Village10,450
- Punta Gorda20,278
- Punta Rassa1,335
- Quail Ridge2,916
- Quincy7,942
- Raiford382
- Rainbow Lakes Estates3,762
- Rainbow Park2,056
- Rainbow Springs6,082
- Raleigh499
- Reddick573
- Redington Beach1,271
- Redington Shores2,009
- Richmond Heights9,992
- Richmond West35,593
- Ridge Manor3,935
- Ridge Wood Heights5,366
- Ridgecrest3,571
- Rio1,232
- Rio Pinar4,985
- River Park5,714
- River Ridge5,149
- Riverview113,697
- Riviera Beach38,657
- Rockledge29,133
- Roeville629
- Roosevelt Gardens3,031
- Roseland2,142
- Rotonda10,352
- Royal Palm Beach40,344
- Royal Palm Estates1,369
- Ruskin29,834
- Safety Harbor17,033
- Samoset5,284
- Samsula-Spruce Creek4,852
- San Antonio1,446
- San Carlos Park19,159
- San Castle3,052
- Sanford63,730
- Sanibel6,418
- Sarasota56,970
- Sarasota Springs12,611
- Satellite Beach11,313
- Sawgrass4,929
- Schall Circle467
- Scottsmoor830
- Sea Ranch Lakes466
- Sebastian26,262
- Sebring11,382
- Seffner8,885
- Seminole19,396
- Seminole Manor2,678
- Seville1,014
- Sewall's Point1,938
- Shady Hills11,983
- Shalimar885
- Sharpes2,840
- Siesta Key5,525
- Silver Lake2,350
- Silver Springs2,712
- Silver Springs Shores28,537
- Silver Springs Shores East1,777
- Sky Lake8,116
- Sneads1,771
- Solana948
- Sopchoppy496
- Sorrento270
- South Apopka7,300
- South Bay5,102
- South Beach3,063
- South Bradenton25,990
- South Brooksville5,099
- South Daytona13,543
- South Gate Ridge5,310
- South Highpoint4,174
- South Miami12,277
- South Miami Heights38,766
- South Palm Beach1,576
- South Pasadena5,320
- South Patrick Shores7,030
- South Sarasota4,837
- South Venice17,484
- Southchase13,981
- Southeast Arcadia7,555
- Southgate5,772
- Southport873
- Southwest Ranches7,656
- Spring Hill119,983
- Spring Lake563
- Spring Ridge555
- Springfield8,230
- Springhill353
- St. Augustine15,351
- St. Augustine Beach6,860
- St. Augustine Shores9,462
- St. Augustine South4,714
- St. Cloud65,130
- St. George Island1,133
- St. James City3,412
- St. Leo1,985
- St. Lucie Village714
- St. Marks243
- St. Pete Beach8,805
- St. Petersburg262,732
- Stacey Street582
- Starke5,877
- Steinhatchee756
- Stock Island4,162
- Stuart18,520
- Sugarmill Woods10,782
- Sumatra46
- Sun City Center33,548
- Suncoast Estates4,369
- Sunny Isles Beach22,437
- Sunrise97,918
- Sunset13,535
- Surfside5,631
- Sweetwater20,085
- Taft2,730
- Tallahassee201,875
- Tamarac73,019
- Tamiami49,752
- Tampa401,618
- Tangelo Park2,404
- Tangerine4,326
- Tarpon Springs25,791
- Tavares20,463
- Tavernier2,413
- Taylor Creek4,457
- Temple Terrace27,275
- Tequesta6,193
- The Acreage40,843
- The Crossings22,963
- The Hammocks58,838
- The Meadows5,492
- The Villages83,498
- Thonotosassa15,764
- Three Lakes16,888
- Three Oaks6,144
- Tice4,758
- Tierra Verde4,108
- Tiger Point3,628
- Tildenville183
- Timber Pines5,007
- Titusville49,385
- Town 'n' Country85,928
- Treasure Island6,553
- Trenton2,320
- Trilby197
- Trinity18,907
- Tropical Park2,355
- Tyndall AFB447
- Umatilla3,854
- Union Park10,615
- University (Hillsborough County)48,127
- University (Orange County)41,902
- Upper Grand Lagoon17,232
- Valparaiso4,885
- Valrico40,239
- Vamo2,936
- Venice27,479
- Venice Gardens3,280
- Verandah1,900
- Vernon815
- Vero Beach17,042
- Vero Beach South30,344
- Vero Lake Estates6,559
- Verona Walk2,695
- Viera East12,570
- Viera West17,984
- Vilano Beach2,188
- Villas13,644
- Vineyards3,849
- Virginia Gardens2,423
- Wabasso1,467
- Wabasso Beach2,262
- Wacissa355
- Wahneta3,876
- Waldo1,303
- Wallace4,202
- Warm Mineral Springs4,470
- Warrington15,918
- Washington Park2,402
- Watergate3,782
- Watertown3,068
- Wauchula4,927
- Waukeenah115
- Wausau320
- Waverly187
- Webster1,574
- Wedgefield8,851
- Weeki Wachee Gardens1,068
- Wekiwa Springs23,915
- Welaka1,082
- Wellington62,146
- Wesley Chapel76,011
- West Bradenton3,991
- West Canaveral Groves224
- West DeLand3,632
- West Lealman14,944
- West Little River33,890
- West Melbourne28,795
- West Miami7,162
- West Palm Beach122,290
- West Park15,249
- West Pensacola20,665
- West Perrine11,162
- West Samoset7,429
- West Vero Corridor10,461
- Westchase24,885
- Westchester52,032
- Westgate8,151
- Westlake4,237
- Weston68,837
- Westview12,107
- Westville253
- Westwood Lakes10,553
- Wewahitchka1,884
- Whiskey Creek5,371
- White City5,744
- White Springs919
- Whitfield (Manatee County)4,261
- Whitfield (Santa Rosa County)599
- Wildwood17,608
- Williamsburg9,063
- Williston3,154
- Williston Highlands3,666
- Willow Oak7,454
- Wilton Manors11,511
- Wimauma15,266
- Windermere3,086
- Winding Cypress1,160
- Windsor338
- Winter Beach4,985
- Winter Garden47,872
- Winter Haven55,200
- Winter Park30,274
- Winter Springs38,951
- Wiscon499
- Woodlawn Beach3,414
- Woodville3,722
- World Golf Village26,077
- Worthington Springs279
- Wright27,927
- Yalaha1,404
- Yankeetown675
- Yeehaw Junction440
- Yulee16,648
- Zellwood3,228
- Zephyrhills19,668
- Zephyrhills North2,831
- Zephyrhills South5,008
- Zephyrhills West5,980
- Zolfo Springs2,158
Metro and micro areas
Each of the 28 that reach into Florida, with its whole population, from ACS 2020–2024 5-year estimates. Metro and micro areas are counties tied together by commuting, drawn by the Office of Management and Budget.
- Arcadia, FL Micro Area35,386
- Cape Coral-Fort Myers, FL Metro Area817,666
- Clewiston, FL Micro Area54,945
- Crestview-Fort Walton Beach-Destin, FL Metro Area299,547
- Deltona-Daytona Beach-Ormond Beach, FL Metro Area706,150
- Gainesville, FL Metro Area349,923
- Homosassa Springs, FL Metro Area162,472
- Jacksonville, FL Metro Area1.68M
- Key West-Key Largo, FL Micro Area81,860
- Lake City, FL Micro Area71,789
- Lakeland-Winter Haven, FL Metro Area790,694
- Miami-Fort Lauderdale-West Palm Beach, FL Metro Area6.25M
- Naples-Marco Island, FL Metro Area398,291
- North Port-Bradenton-Sarasota, FL Metro Area889,339
- Ocala, FL Metro Area400,078
- Okeechobee, FL Micro Area40,816
- Orlando-Kissimmee-Sanford, FL Metro Area2.79M
- Palatka, FL Micro Area75,164
- Palm Bay-Melbourne-Titusville, FL Metro Area632,780
- Panama City-Panama City Beach, FL Metro Area211,922
- Pensacola-Ferry Pass-Brent, FL Metro Area524,395
- Port St. Lucie, FL Metro Area522,676
- Punta Gorda, FL Metro Area201,064
- Sebastian-Vero Beach-West Vero Corridor, FL Metro Area166,936
- Sebring, FL Metro Area105,702
- Tallahassee, FL Metro Area391,730
- Tampa-St. Petersburg-Clearwater, FL Metro Area3.30M
- Wildwood-The Villages, FL Metro Area143,408
ZIP codes
Each of the 995 with people in it, by the town it's centered in, from ACS 2020–2024 5-year estimates. These are the Census Bureau's ZIP Code Tabulation Areas, which follow the Postal Service's ZIP codes as closely as census blocks allow.
- 32003Fleming Island29,766
- 32008Branford5,840
- 32009Baldwin4,045
- 32011Callahan15,421
- 32013Day216
- 32024Lake City20,670
- 32025Watertown22,948
- 32026Raiford3,311
- 32033Hastings4,556
- 32034Fernandina Beach41,029
- 32038Fort White10,007
- 32040Glen St. Mary8,978
- 32043Green Cove Springs34,562
- 32044Hampton2,594
- 32046Hilliard10,593
- 32052Jasper7,441
- 32053Jennings4,000
- 32054Lake Butler city12,581
- 32055Five Points17,559
- 32058Lawtey4,655
- 32059Lee3,052
- 32060Live Oak22,467
- 32061Watertown101
- 320622,942
- 32063Macclenny14,611
- 32064Live Oak7,758
- 32065Oakleaf Plantation41,578
- 32066Mayo6,892
- 32068Middleburg58,983
- 32071Branford4,186
- 3207243
- 32073Bellair-Meadowbrook Terrace43,561
- 32079Penney Farms419
- 32080Butler Beach20,894
- 32081Nocatee29,784
- 32082Nocatee29,289
- 32083Raiford2,561
- 32084St. Augustine37,291
- 32086Crescent Beach34,855
- 320874,608
- 32091Starke14,719
- 32092World Golf Village53,071
- 320943,464
- 32095Nocatee21,399
- 320963,663
- 32097Yulee26,700
- 32102Astor2,371
- 32110Bunnell10,018
- 32112Crescent City8,214
- 32113Reddick5,954
- 32114Daytona Beach37,747
- 32117Holly Hill30,955
- 32118Daytona Beach18,383
- 32119South Daytona22,348
- 32124Daytona Beach11,409
- 32127Port Orange29,612
- 32128Samsula-Spruce Creek22,244
- 32129Port Orange23,195
- 32130De Leon Springs5,620
- 32131East Palatka5,078
- 32132Edgewater7,868
- 32133Ocklawaha483
- 32134Lake Kerr7,442
- 32136Flagler Beach8,363
- 32137Palm Coast48,391
- 32139Seville981
- 321401,479
- 32141Edgewater18,726
- 32145Flagler Estates5,759
- 32147Interlachen1,353
- 32148Interlachen12,063
- 32157Pomona Park639
- 32159Lady Lake32,107
- 32162The Villages55,424
- 32163The Villages28,549
- 32164Palm Coast56,658
- 32168New Smyrna Beach31,847
- 32169Edgewater10,192
- 32174Ormond Beach54,783
- 32176Ormond-by-the-Sea14,841
- 32177Palatka25,645
- 32179Silver Springs Shores East9,318
- 32180Pierson4,444
- 32181Pomona Park2,377
- 32182Interlachen30
- 32187Pomona Park1,191
- 32189Welaka5,593
- 32190Seville1,488
- 32192Reddick35
- 32193Welaka1,236
- 32195Silver Springs Shores East3,091
- 32202Jacksonville6,023
- 32204Jacksonville9,151
- 32205Jacksonville29,148
- 32206Jacksonville17,105
- 32207Jacksonville36,998
- 32208Jacksonville32,699
- 32209Jacksonville34,657
- 32210Jacksonville65,729
- 32211Jacksonville36,762
- 32212Jacksonville1,939
- 32216Jacksonville42,298
- 32217Jacksonville20,221
- 32218Jacksonville72,905
- 32219Jacksonville14,302
- 32220Jacksonville12,298
- 32221Jacksonville32,833
- 32222Jacksonville18,258
- 32223Jacksonville26,160
- 32224Jacksonville42,092
- 32225Jacksonville55,905
- 32226Jacksonville21,256
- 32227Jacksonville3,207
- 32228Jacksonville222
- 32233Jacksonville24,633
- 32234Jacksonville9,678
- 32244Jacksonville63,592
- 32246Jacksonville62,562
- 32250Jacksonville Beach29,072
- 32254Jacksonville13,927
- 32256Jacksonville58,192
- 32257Jacksonville42,904
- 32258Jacksonville40,408
- 32259Fruit Cove75,016
- 32266Neptune Beach7,168
- 32277Jacksonville36,338
- 32301Tallahassee32,017
- 32303Tallahassee49,785
- 32304Tallahassee51,673
- 32305Woodville19,384
- 32306Tallahassee1,770
- 32307Tallahassee1,300
- 32308Tallahassee24,406
- 32309Miccosukee33,544
- 32310Midway city14,888
- 32311Chaires21,905
- 32312Bradfordville32,216
- 32317Chaires14,654
- 32320Apalachicola3,792
- 32321Lake Mystic5,531
- 32322Carrabelle3,678
- 32323Carrabelle90
- 32324Chattahoochee4,783
- 32327Crawfordville31,445
- 32328Eastpoint4,409
- 32330Greensboro1,045
- 32331Greenville4,585
- 32332Gretna1,293
- 32333Havana11,449
- 323342,012
- 32336Lamont1,414
- 32337Lloyd81
- 32340Madison10,302
- 32343Midway city3,640
- 32344Waukeenah13,113
- 32346Panacea2,356
- 32347Perry7,530
- 3234812,201
- 32350Madison1,295
- 32351Greensboro16,398
- 32352Quincy5,102
- 32355St. Marks243
- 32356113
- 32358Sopchoppy1,927
- 32359Steinhatchee1,408
- 32360Hosford144
- 32361Wacissa241
- 32401Panama City18,947
- 32403Tyndall AFB447
- 32404Callaway42,514
- 32405Panama City29,984
- 32407Upper Grand Lagoon16,404
- 32408Upper Grand Lagoon18,832
- 32409Southport11,113
- 32410Mexico Beach550
- 32413Panama City Beach15,453
- 32420Alford2,159
- 32421Altha4,035
- 32423Bascom901
- 32424Blountstown7,586
- 32425Bonifay13,942
- 32426Campbellton720
- 32427Caryville1,030
- 32428Wausau17,950
- 32430815
- 32431Cottondale4,683
- 32432Grand Ridge45
- 3243319,746
- 32435DeFuniak Springs6,664
- 32437Ebro424
- 324384,815
- 32439Freeport15,328
- 32440Graceville8,253
- 32442Grand Ridge3,417
- 32443Greenwood2,879
- 32444Lynn Haven21,459
- 32445Malone2,450
- 32446Marianna10,910
- 32448Marianna8,549
- 32449769
- 32455Ponce de Leon4,370
- 32456Port St. Joe7,510
- 3245923,522
- 32460Sneads5,472
- 32461Laguna Beach3,757
- 32462Vernon3,920
- 32463Wausau128
- 324643,282
- 32465Wewahitchka8,069
- 324665,916
- 32501Pensacola11,036
- 32502Pensacola4,231
- 32503Pensacola33,559
- 32504Pensacola22,153
- 32505Brent27,877
- 32506Pensacola Station34,549
- 32507Pensacola Station32,226
- 32508Pensacola Station5,281
- 32509Bellview336
- 32511Myrtle Grove1,272
- 32514Ferry Pass42,447
- 32526Bellview44,680
- 32530Bagdad275
- 325317,314
- 32533Gonzalez31,860
- 32534Ensley17,104
- 32535Century5,649
- 32536Crestview25,599
- 32539Crestview33,290
- 32541Destin18,855
- 32542Valparaiso3,578
- 32544Hurlburt Field2,256
- 32547Wright35,527
- 32548Fort Walton Beach23,774
- 32550Miramar Beach8,486
- 32561Oriole Beach9,321
- 32563Midway CDP30,364
- 32564Harold2,676
- 32565Pine Level5,664
- 32566Navarre43,883
- 32567Laurel Hill5,609
- 325683,324
- 32569Hurlburt Field12,063
- 32570Springhill37,197
- 32571Wallace42,171
- 32577Molino5,678
- 32578Niceville34,738
- 32579Lake Lorraine10,506
- 32580Valparaiso4,194
- 32583East Milton31,828
- 32601Gainesville23,180
- 32603Gainesville7,419
- 32605Gainesville24,689
- 32606Gainesville23,022
- 32607Gainesville35,720
- 32608Gainesville54,566
- 32609Waldo19,752
- 32610Gainesville12
- 32612Gainesville9,157
- 32615Alachua16,771
- 32616Alachua123
- 32617Silver Springs4,504
- 32618Archer7,057
- 32619Bell5,074
- 32621Bronson6,368
- 32622Brooker1,313
- 32625Cedar Key1,322
- 32626Chiefland8,709
- 32628Cross City5,090
- 32631Waldo343
- 32634Reddick18
- 32639Otter Creek63
- 32640Hawthorne10,623
- 32641Gainesville13,963
- 32643High Springs11,953
- 32648Horseshoe Beach510
- 32653Alachua15,150
- 32656Keystone Heights15,836
- 32658La Crosse347
- 32664McIntosh367
- 32666Keystone Heights6,662
- 32667Micanopy3,944
- 32668Morriston5,149
- 32669Newberry17,704
- 32680Cross City10,582
- 32681McIntosh286
- 32683Otter Creek184
- 32686Reddick4,882
- 3269264
- 32693Trenton12,806
- 32694Waldo2,286
- 32696Williston15,521
- 32697Worthington Springs189
- 32701Altamonte Springs24,592
- 32702Pittman2,636
- 32703Apopka59,269
- 32707Casselberry39,493
- 32708Winter Springs48,965
- 32709Christmas1,696
- 32712Apopka50,583
- 32713DeBary22,884
- 32714Altamonte Springs37,905
- 32720West DeLand36,259
- 32724North DeLand45,140
- 32725Deltona51,987
- 32726Eustis24,715
- 32730Fern Park6,091
- 32732Geneva5,275
- 32735Lisbon5,304
- 32736Pine Lakes12,688
- 32738Deltona49,368
- 32744Lake Helen3,634
- 32746Lake Mary46,684
- 32750Longwood26,164
- 32751Maitland22,103
- 32754Mims12,011
- 32757Tangerine34,121
- 32759Scottsmoor3,216
- 32763Orange City24,951
- 32764Geneva2,789
- 32765Oviedo64,477
- 32766Chuluota16,221
- 32767Paisley3,408
- 32771Sanford62,606
- 32773Sanford34,032
- 32776Mount Plymouth13,163
- 32778Tavares25,042
- 32779Wekiwa Springs28,924
- 32780Titusville40,064
- 32784Altoona10,019
- 32789Winter Park27,788
- 32792Goldenrod52,976
- 32796Titusville20,222
- 32798Zellwood2,782
- 32801Orlando17,046
- 32803Orlando22,152
- 32804Orlando21,720
- 32805Orlando19,294
- 32806Orlando26,096
- 32807Azalea Park34,456
- 32808Orlando60,203
- 32809Sky Lake29,237
- 32810Lockhart36,927
- 32811Orlando41,475
- 32812Conway34,686
- 32814Orlando9,286
- 32816University12,624
- 32817Union Park37,014
- 32818Pine Hills59,114
- 32819Doctor Phillips30,213
- 32820Bithlo10,897
- 32821Williamsburg26,161
- 32822Orlando67,081
- 32824Meadow Woods58,368
- 32825Alafaya63,698
- 32826University29,006
- 32827Orlando19,711
- 32828Alafaya69,202
- 32829Alafaya20,819
- 32830Bay Lake197
- 32831Orlando2,527
- 32832Lake Mary Jane40,196
- 32833Wedgefield11,389
- 32835Gotha49,205
- 32836Lake Buena Vista26,106
- 32837Southchase53,671
- 32839Oak Ridge53,242
- 32901Melbourne28,923
- 32903Indialantic13,836
- 32904June Park37,241
- 32905Palm Bay24,792
- 32907Palm Bay49,080
- 32908Palm Bay16,535
- 32909Palm Bay41,804
- 32920Cape Canaveral10,005
- 32922Cocoa14,700
- 32925Patrick AFB1,644
- 32926West Canaveral Groves23,505
- 32927Port St. John29,219
- 32931Cocoa Beach14,174
- 32934Melbourne18,564
- 32935Melbourne41,965
- 32937Satellite Beach27,836
- 32940Viera West51,727
- 32948Fellsmere7,112
- 32949Grant-Valkaria3,636
- 32950Malabar4,132
- 32951Grant-Valkaria11,299
- 32952Merritt Island21,613
- 32953North Merritt Island24,759
- 32955Rockledge41,008
- 32958Sebastian30,023
- 32959Sharpes13
- 32960Vero Beach25,259
- 32962Florida Ridge25,522
- 32963Indian River Shores15,008
- 32966Fellsmere20,686
- 32967Winter Beach27,240
- 32968West Vero Corridor15,912
- 32970Wabasso174
- 32976Micco9,156
- 33001Layton250
- 33004Dania Beach17,094
- 33009Hallandale Beach44,502
- 33010Hialeah41,701
- 33012Hialeah71,017
- 33013Hialeah30,695
- 33014Miami Lakes41,598
- 33015Country Club68,891
- 33016Hialeah45,551
- 33018Hialeah Gardens57,921
- 33019Hollywood14,293
- 33020Hollywood46,322
- 33021Hollywood48,464
- 33023Miramar72,344
- 33024Pembroke Pines76,585
- 33025Miramar76,967
- 33026Pembroke Pines31,172
- 33027Miramar65,116
- 33028Pembroke Pines28,397
- 33029Miramar44,070
- 33030Florida City37,678
- 33031Leisure City7,323
- 33032Princeton65,132
- 33033Homestead71,458
- 3303423,823
- 33035Homestead17,202
- 33036Layton3,777
- 33037North Key Largo14,770
- 33040Key West35,429
- 33042Cudjoe Key6,441
- 33043Big Pine Key4,298
- 33050Marathon10,561
- 33051Key Colony Beach511
- 33054Opa-locka31,055
- 33055Country Club37,659
- 33056Miami Gardens37,890
- 33060Pompano Beach37,233
- 33062Pompano Beach24,920
- 33063Margate55,466
- 33064Deerfield Beach64,563
- 33065Coral Springs58,916
- 33066Coconut Creek16,719
- 33067Parkland27,188
- 33068North Lauderdale54,439
- 33069Pompano Beach29,145
- 33070Tavernier5,768
- 33071Coral Springs42,255
- 33073Coconut Creek33,838
- 33076Parkland44,922
- 33109Miami Beach1,083
- 33122Virginia Gardens1,687
- 33125Miami56,897
- 33126West Miami47,307
- 33127Miami26,786
- 33128Miami9,475
- 33129Miami14,702
- 33130Miami34,964
- 33131Miami23,095
- 33132Miami20,253
- 33133Miami36,789
- 33134Coral Gables38,174
- 33135Miami36,143
- 33136Miami16,545
- 33137Miami29,414
- 33138Miami28,980
- 33139Miami Beach33,753
- 33140Miami Beach20,342
- 33141Miami Beach36,438
- 33142Brownsville58,908
- 33143South Miami33,711
- 33144Miami25,909
- 33145Miami29,761
- 33146Coral Gables19,052
- 33147West Little River50,419
- 33149Key Biscayne14,791
- 33150West Little River30,974
- 33154Bay Harbor Islands14,572
- 33155Coral Terrace43,983
- 33156Pinecrest33,628
- 33157Palmetto Bay70,596
- 33158Palmetto Bay5,960
- 33160North Miami Beach43,718
- 33161North Miami54,814
- 33162North Miami Beach46,606
- 33165Westchester48,817
- 33166Virginia Gardens28,265
- 33167Westview23,768
- 33168North Miami23,775
- 33169Miami Gardens43,702
- 33170Naranja16,652
- 33172Doral39,101
- 33173Sunset31,778
- 33174Fountainebleau35,177
- 33175Tamiami48,237
- 33176Kendall51,804
- 33177South Miami Heights59,056
- 33178Sweetwater67,789
- 33179Ives Estates51,591
- 33180Aventura34,147
- 33181North Miami20,848
- 33182Sweetwater12,512
- 33183Kendale Lakes33,527
- 33184Tamiami19,859
- 33185Kendall West28,555
- 33186Three Lakes69,757
- 3318718,174
- 33189Cutler Bay26,128
- 33190Cutler Bay18,287
- 33193Kendall West47,494
- 33194The Hammocks8,069
- 33196The Hammocks54,668
- 33301Fort Lauderdale19,503
- 33304Fort Lauderdale18,332
- 33305Fort Lauderdale13,243
- 33306Fort Lauderdale2,978
- 33308Fort Lauderdale27,935
- 33309Fort Lauderdale37,475
- 33311Fort Lauderdale74,898
- 33312Fort Lauderdale52,798
- 33313Lauderhill62,807
- 33314Davie31,067
- 33315Fort Lauderdale13,645
- 33316Fort Lauderdale12,437
- 33317Plantation city37,950
- 33319Tamarac54,450
- 33321Tamarac51,216
- 33322Plantation city41,128
- 33323Sunrise23,589
- 33324Plantation city50,151
- 33325Davie32,399
- 33326Weston33,880
- 33327Tamarac23,203
- 33328Davie28,851
- 33330Southwest Ranches13,699
- 33331Southwest Ranches24,897
- 33332Southwest Ranches10,920
- 33334Oakland Park30,935
- 33351Sunrise36,364
- 33401West Palm Beach33,698
- 33403Lake Park14,370
- 33404Riviera Beach30,912
- 33405West Palm Beach19,780
- 33406Pine Air26,945
- 33407West Palm Beach34,851
- 33408Juno Ridge18,817
- 33409West Palm Beach33,489
- 33410Palm Beach Gardens36,759
- 33411Royal Palm Beach76,863
- 33412Palm Beach Gardens15,859
- 33413Greenacres18,668
- 33414Wellington60,184
- 33415Pine Air54,581
- 33417Schall Circle38,079
- 33418Palm Beach Gardens43,676
- 33426Boynton Beach24,255
- 33428Watergate47,588
- 33430Belle Glade19,796
- 33431Boca Raton24,608
- 33432Boca Raton21,834
- 33433Hillsboro Pines47,005
- 33434Boca Raton21,686
- 33435Boynton Beach37,833
- 33436Golf48,743
- 33437Golf37,229
- 33438Indiantown257
- 33440Montura20,855
- 33441Deerfield Beach30,153
- 33442Deerfield Beach31,296
- 33444Delray Beach22,737
- 33445Delray Beach33,122
- 33446Golf28,431
- 33449Wellington8,766
- 33455Hobe Sound20,018
- 33458Jupiter55,512
- 33460Lake Worth Beach37,795
- 33461Palm Springs49,443
- 33462San Castle33,371
- 33463Atlantis65,478
- 33467Greenacres58,411
- 33469Tequesta14,686
- 33470Westlake35,610
- 33471Moore Haven7,086
- 33472Golf18,885
- 33473Golf11,825
- 33476Pahokee7,413
- 33477Jupiter12,908
- 33478Jupiter Farms14,731
- 33480Palm Beach10,924
- 33483Delray Beach12,669
- 33484Delray Beach26,208
- 33486Boca Raton23,232
- 33487Boca Raton20,717
- 334935,158
- 33496Boca Raton26,579
- 33498Watergate16,853
- 33503Balm891
- 33510Brandon30,578
- 33511Brandon62,138
- 33513Bushnell14,289
- 33514Center Hill2,366
- 33521Coleman634
- 33523Dade City North19,435
- 33525Dade City21,077
- 33527Dover17,364
- 33530Valrico20
- 33534Gibsonton17,740
- 33538Lake Panasoffkee6,132
- 33540Zephyrhills North11,390
- 33541Zephyrhills West24,654
- 33542Zephyrhills23,612
- 33543Wesley Chapel40,648
- 33544Wesley Chapel29,901
- 33545Wesley Chapel30,222
- 33547Fish Hawk31,431
- 33548Lutz8,967
- 33549Lutz18,178
- 33556Keystone35,755
- 33558Cheval33,165
- 33559Lutz18,831
- 33563Plant City25,896
- 33565Plant City18,108
- 33566Plant City24,521
- 33567Willow Oak12,562
- 33569Riverview27,867
- 33570Ruskin33,319
- 33572Apollo Beach26,495
- 33573Sun City Center35,362
- 33574St. Leo1,822
- 33576San Antonio6,273
- 33578Gibsonton60,651
- 33579Riverview49,470
- 33584Mango28,579
- 33585Coleman1,763
- 33592Thonotosassa12,333
- 33594Valrico37,361
- 33596Valrico27,757
- 33597Webster10,864
- 33598Wimauma32,820
- 33602Tampa21,452
- 33603Tampa19,869
- 33604Tampa40,055
- 33605Tampa16,030
- 33606Tampa24,570
- 33607Tampa25,291
- 33609Tampa18,535
- 33610East Lake-Orient Park46,587
- 33611Tampa36,810
- 33612Tampa49,005
- 33613University37,591
- 33614Egypt Lake-Leto47,298
- 33615Town 'n' Country47,245
- 33616Tampa15,830
- 33617Temple Terrace47,851
- 33618Lake Magdalene27,771
- 33619Palm River-Clair Mel41,396
- 33620Tampa7,298
- 33621Tampa2,393
- 33624Carrollwood41,346
- 33625Citrus Park29,967
- 33626Westchase30,575
- 33629Tampa27,710
- 33634Town 'n' Country21,862
- 33635Town 'n' Country19,134
- 33637Temple Terrace17,658
- 33647Pebble Creek74,844
- 33701St. Petersburg18,823
- 33702St. Petersburg31,294
- 33703St. Petersburg25,264
- 33704St. Petersburg16,232
- 33705St. Petersburg27,939
- 33706St. Pete Beach15,298
- 33707Gulfport24,324
- 33708Redington Beach15,060
- 33709West Lealman25,050
- 33710St. Petersburg33,796
- 33711St. Petersburg20,013
- 33712St. Petersburg27,142
- 33713St. Petersburg31,729
- 33714Lealman19,227
- 33715Tierra Verde8,032
- 33716St. Petersburg19,328
- 33744Bay Pines59
- 33755Clearwater27,476
- 33756Clearwater32,201
- 33759Safety Harbor17,557
- 33760Largo20,501
- 33761Clearwater18,290
- 33762Feather Sound5,063
- 33763Greenbriar21,146
- 33764Largo27,311
- 33765Clearwater13,808
- 33767Clearwater8,081
- 33770Largo25,368
- 33771Largo27,596
- 33772Seminole23,733
- 33773Bardmoor16,741
- 33774Largo19,799
- 33776Indian Shores12,556
- 33777Bardmoor18,582
- 33778Largo16,807
- 33781Pinellas Park28,072
- 33782Pinellas Park22,461
- 33785Indian Rocks Beach4,907
- 33786Belleair Beach1,582
- 33801Crystal Lake35,394
- 33803Lakeland29,321
- 33805Combee Settlement28,751
- 33809Kathleen30,797
- 33810Kathleen55,137
- 33811Lakeland29,472
- 33812Highland City16,169
- 33813Lakeland Highlands38,674
- 33815Lakeland13,975
- 33823Auburndale41,779
- 33825Avon Park25,501
- 33827Hillcrest Heights2,431
- 33830Bartow33,740
- 33834Fort Green6,188
- 33835Bradley Junction115
- 33837Davenport47,389
- 33838Dundee5,688
- 33839Eagle Lake4,561
- 33841Fort Meade8,005
- 33843Frostproof11,220
- 33844Haines City51,255
- 33847Homeland442
- 33848Celebration638
- 33849Crystal Springs851
- 33850Lake Alfred9,757
- 33851Lake Hamilton1,212
- 33852Lake Placid22,600
- 33853Lake Wales12,674
- 33854Indian Lake Estates781
- 33855Indian Lake Estates15
- 33856Indian Lake Estates394
- 33857756
- 33858Loughman653
- 33859Lake Wales11,824
- 33860Bradley Junction24,892
- 33865Ona488
- 3386743
- 33868Polk City13,827
- 33870Sebring25,195
- 33872Avon Park13,746
- 33873Wauchula13,935
- 33875Sebring11,856
- 33876Sebring6,816
- 33877Waverly159
- 33880Eagle Lake43,371
- 33881Winter Haven40,808
- 33884Winter Haven37,561
- 33890Zolfo Springs5,197
- 33896Loughman26,731
- 33897Four Corners30,159
- 33898Indian Lake Estates18,527
- 33901Fort Myers24,481
- 33903North Fort Myers23,655
- 33904Cape Coral33,599
- 33905Buckingham41,381
- 33907Villas25,033
- 33908Iona37,423
- 33909Palmona Park40,231
- 33912Villas19,533
- 33913Gateway31,538
- 33914Cape Coral45,540
- 33916Fort Myers27,943
- 33917North Fort Myers33,380
- 33919Cypress Lake30,412
- 33920Alva9,062
- 33921Rotonda391
- 33922Pineland4,226
- 33924Captiva109
- 33928Florida Gulf Coast University31,926
- 339301,540
- 33931Fort Myers Beach8,350
- 33935LaBelle23,186
- 33936Lehigh Acres27,967
- 33944208
- 33946Rotonda3,090
- 33947Rotonda10,447
- 33948Port Charlotte18,696
- 33950Charlotte Park24,955
- 33952Port Charlotte35,231
- 33953North Port8,318
- 33954Port Charlotte11,193
- 33955Burnt Store Marina12,399
- 33956St. James City3,405
- 33957Sanibel6,418
- 33960681
- 33965Florida Gulf Coast University4,836
- 33966Fort Myers12,513
- 33967San Carlos Park28,341
- 33971Lehigh Acres30,790
- 33972Lehigh Acres17,285
- 33973Lehigh Acres14,392
- 33974Lehigh Acres19,927
- 33976Lehigh Acres20,277
- 33980Charlotte Harbor13,120
- 33981Rotonda15,622
- 3398213,006
- 33983Harbour Heights18,471
- 33990Cape Coral34,713
- 33991Cape Coral27,725
- 33993Cape Coral35,580
- 34102Naples11,179
- 34103Naples11,299
- 34104Berkshire Lakes26,408
- 34105Pine Ridge15,441
- 34108Pelican Bay16,237
- 34109Pelican Marsh27,273
- 34110Naples Park25,630
- 34112Lely27,193
- 34113Naples Manor26,056
- 34114Goodland23,559
- 34116Golden Gate35,591
- 34117Verona Walk19,923
- 34119Island Walk36,807
- 34120Orangetree42,345
- 34134Bonita Springs16,475
- 34135Bonita Springs48,252
- 3413768
- 34138Chokoloskee808
- 34139Everglades243
- 34140Marco Island104
- 34141169
- 3414235,149
- 34145Marco Island16,205
- 34201Desoto Lakes3,733
- 34202Lakewood Ranch27,197
- 34203Samoset40,618
- 34205Bradenton31,946
- 34207Bayshore Gardens34,081
- 34208Bradenton44,004
- 34209West Bradenton33,224
- 34210Longboat Key17,682
- 34211Lakewood Ranch24,980
- 34212Lakewood Ranch25,536
- 34215Cortez707
- 34216Anna Maria874
- 34217Holmes Beach3,676
- 34219Wimauma33,296
- 34221Memphis56,208
- 34222Ellenton14,819
- 34223Englewood19,884
- 34224Grove City15,536
- 34228Longboat Key7,539
- 34229Osprey7,495
- 34231Gulf Gate32,404
- 34232Fruitville34,013
- 34233Bee Ridge19,123
- 34234Sarasota22,986
- 34235The Meadows15,146
- 34236Sarasota14,446
- 34237Sarasota17,367
- 34238Palmer Ranch23,821
- 34239Southgate14,635
- 34240Old Miakka18,774
- 34241Lake Sarasota16,408
- 34242Siesta Key7,529
- 34243Desoto Acres32,773
- 34250Memphis617
- 34251Old Miakka5,956
- 34266Southeast Arcadia29,863
- 34267Harbour Heights44
- 34268Southeast Arcadia466
- 34269Harbour Heights5,013
- 34275Nokomis22,436
- 34285Venice18,677
- 34286North Port22,534
- 34287North Port25,929
- 34288North Port18,231
- 34289North Port4,441
- 34291North Port8,630
- 34292Plantation CDP17,586
- 34293Plantation CDP50,278
- 34420Belleview19,465
- 34428Crystal River10,163
- 34429Crystal River8,727
- 34431Rainbow Lakes Estates9,785
- 34432Dunnellon13,587
- 34433Citrus Springs8,411
- 34434Citrus Springs11,074
- 34436Floral City8,205
- 34442Hernando17,281
- 34445Citrus Springs42
- 34446Sugarmill Woods19,102
- 34448Homosassa10,817
- 34449Inglis3,565
- 34450Inverness Highlands South11,532
- 34452Inverness Highlands South13,734
- 34453Inverness Highlands North10,621
- 34461Lecanto13,377
- 34465Pine Ridge18,879
- 34470Ocala22,443
- 34471Ocala28,342
- 34472Silver Springs Shores35,851
- 34473Marion Oaks26,813
- 34474Ocala20,258
- 34475Ocala14,301
- 34476Liberty Triangle28,997
- 34479Silver Springs13,264
- 34480Belleview23,517
- 34481On Top of the World26,782
- 34482Ocala Estates22,807
- 34484The Villages5,050
- 34488Silver Springs11,447
- 34491Belleview33,318
- 34498Yankeetown675
- 34601North Brooksville24,115
- 34602Spring Lake11,088
- 34604Garden Grove13,642
- 34606Timber Pines28,668
- 34607Pine Island9,496
- 34608Spring Hill36,658
- 34609Spring Hill47,257
- 34610Shady Hills16,995
- 34613North Weeki Wachee19,337
- 34614Sugarmill Woods10,935
- 34637Connerton13,049
- 34638Connerton37,644
- 34639Connerton30,831
- 34652New Port Richey27,444
- 34653New Port Richey East35,945
- 34654Moon Lake24,355
- 34655Trinity49,964
- 34661Nobleton386
- 34667Hudson30,689
- 34668Jasmine Estates49,442
- 34669Meadow Oaks14,618
- 34677Oldsmar22,762
- 34679Aripeka141
- 34681Palm Harbor1,284
- 34683Palm Harbor33,911
- 34684Palm Harbor27,029
- 34685East Lake18,132
- 34688East Lake8,522
- 34689Tarpon Springs27,324
- 34690Holiday12,498
- 34691Key Vista21,232
- 34695Safety Harbor18,098
- 34698Dunedin38,171
- 34705Astatula3,014
- 34711Clermont70,317
- 34714Clermont28,200
- 34715Minneola26,810
- 34731Fruitland Park12,196
- 34734Gotha3,940
- 34736Groveland28,001
- 34737Howey-in-the-Hills4,199
- 347391,176
- 34741Kissimmee58,716
- 34743Buenaventura Lakes40,030
- 34744Buenaventura Lakes66,582
- 34746Campbell60,595
- 34747Four Corners30,859
- 34748Okahumpka48,095
- 34753Mascotte7,985
- 34756Montverde4,876
- 34758Poinciana46,768
- 34759Poinciana44,568
- 34760Oakland740
- 34761Ocoee47,327
- 34762Leesburg1,226
- 34769St. Cloud30,204
- 34771Lake Mary Jane35,257
- 34772St. Cloud35,390
- 347735,816
- 34785Coleman21,568
- 34786Lake Butler CDP42,358
- 34787Horizon West101,441
- 34788Lisbon22,137
- 34797Yalaha1,163
- 349456,321
- 34946St. Lucie Village6,852
- 34947Fort Pierce North12,804
- 34949Fort Pierce7,470
- 34950Fort Pierce17,461
- 34951Lakewood Park17,148
- 34952Port St. Lucie42,655
- 34953Port St. Lucie86,875
- 34956Indiantown9,630
- 34957Jensen Beach23,462
- 3497220,066
- 34974Buckhead Ridge23,975
- 34981Fort Pierce South5,031
- 34982Indian River Estates31,143
- 34983Port St. Lucie49,001
- 34984Port St. Lucie20,151
- 34986Port St. Lucie30,715
- 34987Port St. Lucie21,727
- 34990Palm City30,592
- 34994Stuart18,737
- 34996Sewall's Point10,653
- 34997Hobe Sound47,075
School districts
Each of the 67 with people in it, from ACS 2020–2024 5-year estimates.
- Alachua County School District285,492
- Baker County School District28,430
- Bay County School District186,393
- Bradford County School District27,885
- Brevard County School District632,780
- Broward County School District1.98M
- Calhoun County School District13,492
- Charlotte County School District201,064
- Citrus County School District162,472
- Clay County School District227,584
- Collier County School District398,291
- Columbia County School District71,789
- Dade County School District2.74M
- DeSoto County School District35,386
- Dixie County School District17,058
- Duval County School District1.02M
- Escambia County School District325,923
- Flagler County School District126,528
- Franklin County School District12,553
- Gadsden County School District43,710
- Gilchrist County School District19,040
- Glades County School District12,563
- Gulf County School District15,131
- Hamilton County School District13,616
- Hardee County School District25,675
- Hendry County School District42,382
- Hernando County School District207,018
- Highlands County School District105,702
- Hillsborough County School District1.52M
- Holmes County School District19,513
- Indian River County School District166,936
- Jackson County School District48,250
- Jefferson County School District15,091
- Lafayette County School District8,161
- Lake County School District412,924
- Lee County School District817,666
- Leon County School District297,542
- Levy County School District45,391
- Liberty County School District7,687
- Madison County School District18,089
- Manatee County School District429,792
- Marion County School District400,078
- Martin County School District162,176
- Monroe County School District81,860
- Nassau County School District97,859
- Okaloosa County School District216,599
- Okeechobee County School District40,816
- Orange County School District1.47M
- Osceola County School District427,415
- Palm Beach County School District1.53M
- Pasco County School District611,444
- Pinellas County School District963,481
- Polk County School District790,694
- Putnam County School District75,164
- Santa Rosa County School District198,472
- Sarasota County School District459,547
- Seminole County School District481,470
- St. Johns County School District306,934
- St. Lucie County School District360,500
- Sumter County School District143,408
- Suwannee County School District45,342
- Taylor County School District21,503
- Union County School District15,701
- Volusia County School District579,622
- Wakulla County School District35,387
- Walton County School District82,948
- Washington County School District25,529
Congressional districts
As drawn for the 119th Congress (2025–2027).
- Congressional District 1793,302
- Congressional District 2792,630
- Congressional District 3798,141
- Congressional District 4797,286
- Congressional District 5818,508
- Congressional District 6816,594
- Congressional District 7789,605
- Congressional District 8801,628
- Congressional District 9821,565
- Congressional District 10788,933
- Congressional District 11826,010
- Congressional District 12820,692
- Congressional District 13769,211
- Congressional District 14786,912
- Congressional District 15813,472
- Congressional District 16830,753
- Congressional District 17828,650
- Congressional District 18825,024
- Congressional District 19808,421
- Congressional District 20792,510
- Congressional District 21812,005
- Congressional District 22786,471
- Congressional District 23778,879
- Congressional District 24793,181
- Congressional District 25780,689
- Congressional District 26804,169
- Congressional District 27764,988
- Congressional District 28775,848
State senate districts
The upper chamber’s districts, as drawn in 2024.
- State Senate District 1556,015
- State Senate District 2561,104
- State Senate District 3550,870
- State Senate District 4567,720
- State Senate District 5553,292
- State Senate District 6556,255
- State Senate District 7590,419
- State Senate District 8567,150
- State Senate District 9565,135
- State Senate District 10548,062
- State Senate District 11568,986
- State Senate District 12589,490
- State Senate District 13572,375
- State Senate District 14557,227
- State Senate District 15557,598
- State Senate District 16547,085
- State Senate District 17545,476
- State Senate District 18546,807
- State Senate District 19563,459
- State Senate District 20579,036
- State Senate District 21546,961
- State Senate District 22561,817
- State Senate District 23591,991
- State Senate District 24560,541
- State Senate District 25570,235
- State Senate District 26553,864
- State Senate District 27577,373
- State Senate District 28582,855
- State Senate District 29561,440
- State Senate District 30553,225
- State Senate District 31568,496
- State Senate District 32554,399
- State Senate District 33561,440
- State Senate District 34554,256
- State Senate District 35554,198
- State Senate District 36543,174
- State Senate District 37542,014
- State Senate District 38560,610
- State Senate District 39539,490
- State Senate District 40534,137
State house districts
The lower chamber’s districts, as drawn in 2024.
- State House District 1184,648
- State House District 2182,360
- State House District 3187,856
- State House District 4186,130
- State House District 5189,732
- State House District 6186,393
- State House District 7185,116
- State House District 8178,632
- State House District 9187,122
- State House District 10184,071
- State House District 11184,742
- State House District 12183,128
- State House District 13183,045
- State House District 14181,743
- State House District 15199,175
- State House District 16180,501
- State House District 17193,420
- State House District 18208,188
- State House District 19188,662
- State House District 20184,853
- State House District 21174,940
- State House District 22194,034
- State House District 23186,453
- State House District 24194,478
- State House District 25193,770
- State House District 26185,888
- State House District 27192,231
- State House District 28188,525
- State House District 29185,693
- State House District 30183,892
- State House District 31183,508
- State House District 32187,139
- State House District 33197,694
- State House District 34185,989
- State House District 35187,334
- State House District 36182,380
- State House District 37174,946
- State House District 38179,408
- State House District 39182,451
- State House District 40197,792
- State House District 41167,065
- State House District 42182,561
- State House District 43183,007
- State House District 44176,172
- State House District 45189,647
- State House District 46187,648
- State House District 47190,411
- State House District 48193,190
- State House District 49185,130
- State House District 50190,559
- State House District 51221,815
- State House District 52200,330
- State House District 53180,853
- State House District 54202,632
- State House District 55200,985
- State House District 56177,070
- State House District 57178,586
- State House District 58175,100
- State House District 59180,607
- State House District 60178,397
- State House District 61173,311
- State House District 62179,450
- State House District 63171,818
- State House District 64177,929
- State House District 65187,834
- State House District 66185,979
- State House District 67183,447
- State House District 68181,127
- State House District 69187,749
- State House District 70202,422
- State House District 71182,524
- State House District 72189,741
- State House District 73188,255
- State House District 74200,849
- State House District 75194,965
- State House District 76196,021
- State House District 77210,596
- State House District 78188,698
- State House District 79201,376
- State House District 80186,002
- State House District 81187,696
- State House District 82199,878
- State House District 83184,756
- State House District 84193,110
- State House District 85204,235
- State House District 86183,551
- State House District 87182,644
- State House District 88190,802
- State House District 89177,721
- State House District 90184,138
- State House District 91187,878
- State House District 92183,353
- State House District 93185,923
- State House District 94183,127
- State House District 95185,851
- State House District 96182,952
- State House District 97182,708
- State House District 98187,511
- State House District 99187,321
- State House District 100181,226
- State House District 101181,599
- State House District 102188,108
- State House District 103183,091
- State House District 104175,676
- State House District 105191,536
- State House District 106179,713
- State House District 107188,815
- State House District 108192,411
- State House District 109193,640
- State House District 110179,921
- State House District 111189,865
- State House District 112181,615
- State House District 113177,853
- State House District 114184,244
- State House District 115181,368
- State House District 116174,101
- State House District 117194,410
- State House District 118179,328
- State House District 119185,666
- State House District 120186,816
PUMAs
Public Use Microdata Areas: areas of 100,000 people or more that the state draws from census tracts, for the Census Bureau’s microdata.
- Alachua County (Central)–Gainesville City (Central) PUMA160,142
- Alachua County (Outer) PUMA125,350
- Baker & Nassau Counties PUMA126,289
- Bay County PUMA186,393
- Bradford, Columbia, Dixie, Gilchrist, Levy, & Union Counties PUMA196,864
- Brevard County (East)–Beaches & Merritt Island PUMA125,166
- Brevard County (Northwest)–Titusville PUMA103,987
- Brevard County (Southeast)–Palm Bay City, Grant-Valkaria & Malabar Towns PUMA158,189
- Brevard County (Southwest)–Melbourne & West Melbourne Cities PUMA136,000
- Brevard County (West)–Rockledge & Cocoa Cities PUMA109,438
- Broward County (Central)–Davie Town & Cooper City PUMA117,135
- Broward County (Central)–Lauderhill & Lauderdale Lakes Cities PUMA107,726
- Broward County (East Central)–Fort Lauderdale City (Central) PUMA135,871
- Broward County (East Central)–Wilton Manors, Fort Lauderdale (North), Oakland Park PUMA119,079
- Broward County (N Central)–Margate, Coconut Creek (South), & North Lauderdale Cities PUMA104,364
- Broward County (NE)–Deerfield Beach, Pompano Beach (North) & Lighthouse Point Cities PUMA103,819
- Broward County (NE)–Pompano Beach (South) City PUMA105,991
- Broward County (NNW)–Coral Springs (North), Parkland, & Coconut Creek (North) Cities PUMA106,651
- Broward County (Northwest) Coral Springs City PUMA105,033
- Broward County (Southeast)–Hollywood (North) & Dania Beach Cities PUMA116,638
- Broward County (Southeast)–Hollywood (South) & Pembroke Pines (East) Cities PUMA127,628
- Broward County (Southwest)–Pembroke Pines (West) City PUMA118,639
- Broward County (SSE)–Miramar (East), Hallandale Beach & West Park Cities PUMA106,141
- Broward County (SSW)–Miramar (West) & Pembroke Pines (Southwest) Cities PUMA101,934
- Broward County (West Central)–Plantation & Sunrise Cities PUMA189,241
- Broward County (West Central)–Tamarac, & North Lauderdale, & Sunrise (North) Cities PUMA105,360
- Broward County (West) Weston, Sunrise (S), Davie (W) Cities & Southwest Ranches Town PUMA105,879
- Calhoun, Franklin, Gadsden, Gulf, Jackson, Jefferson, Liberty, & Wakulla Counties PUMA191,301
- Charlotte County PUMA201,064
- Citrus County PUMA162,472
- Clay County (North, Central, & South) PUMA112,652
- Clay County (Northeast) PUMA114,932
- Collier County (East) PUMA152,257
- Collier County (Northwest) PUMA125,087
- Collier County (Southwest) PUMA120,947
- Duval County (East)–Jacksonville City (Beaches) PUMA147,473
- Duval County (North Central)–Jacksonville City (Arlington) PUMA123,073
- Duval County (Northwest Central)–Jacksonville City (Northwest) PUMA118,932
- Duval County (Outer)–Jacksonville City (North & West) PUMA162,062
- Duval County (South Central)–Jacksonville City (Southeast River) PUMA132,714
- Duval County (Southeast)–Jacksonville City (Southeast) PUMA166,851
- Duval County (Southwest Central)–Jacksonville City (Southwest) PUMA172,048
- Escambia County (North) PUMA106,366
- Escambia County (Southeast) PUMA116,969
- Escambia County (Southwest) PUMA102,588
- Flagler County PUMA126,528
- Hamilton, Lafayette, Madison, Suwannee, & Taylor Counties PUMA106,711
- Hernando County PUMA207,018
- Hillsborough County (Central) PUMA156,722
- Hillsborough County (Central)–Progress Village, Gibsonton, Riverview PUMA120,154
- Hillsborough County (Central)–Tampa City (Central) PUMA151,558
- Hillsborough County (North Central) PUMA137,942
- Hillsborough County (North Central)–Tampa City (North) PUMA182,461
- Hillsborough County (Northeast) PUMA139,288
- Hillsborough County (Northwest) PUMA166,529
- Hillsborough County (Southeast) PUMA109,872
- Hillsborough County (Southwest) PUMA126,995
- Hillsborough County (Southwest)–Tampa City (South Central) PUMA103,406
- Hillsborough County (Southwest)–Tampa City (South) PUMA127,821
- Holmes, Walton, & Washington Counties PUMA127,990
- Indian River County PUMA166,936
- Lake County (Northeast) PUMA111,191
- Lake County (Northwest) PUMA139,759
- Lake County (South) PUMA161,974
- Lee County (Central)–Greater Fort Myers City PUMA130,329
- Lee County (North)–Cape Coral City (North) PUMA119,930
- Lee County (North)–Cape Coral City (South) PUMA110,686
- Lee County (Northeast)–Lehigh Acres & North Fort Myers PUMA200,371
- Lee County (South & West)–Barrier Islands Region PUMA117,595
- Lee County (Southeast)–Bonita Springs City & Estero (East) PUMA138,755
- Leon County (Central)–Tallahassee City (Central) PUMA149,754
- Leon County (Outer) PUMA147,788
- Manatee County (North) PUMA158,409
- Manatee County (South) PUMA145,201
- Manatee County (West Central) PUMA126,182
- Marion County (Central)–Ocala City PUMA121,728
- Marion County (North) PUMA115,016
- Marion County (South Central) PUMA163,334
- Martin County PUMA162,176
- Miami-Dade (South/Outside Urban Development Boundary) & Monroe Counties PUMA117,690
- Miami-Dade County (Central)–Kendale Lakes (Southwest) & Kendall West (South) PUMA102,078
- Miami-Dade County (Central)–MIA, Miami Springs & Doral Cities PUMA103,323
- Miami-Dade County (Central)–The Hammocks (West), Richmond West (West) & Country Walk PUMA144,162
- Miami-Dade County (East Central)–Kendall (North), Sunset & Westwood Lakes PUMA99,007
- Miami-Dade County (East Central)–Miami City (West) PUMA106,906
- Miami-Dade County (East Central)–South Miami City, Westchester & Coral Terrace PUMA100,435
- Miami-Dade County (East)–Coral Gables City, Pinecrest Village & Kendall (South) PUMA105,820
- Miami-Dade County (East)–Miami City (South) & Key Biscayne Village PUMA116,442
- Miami-Dade County (NE)–Aventura, Sunny Isles Beach, North Miami Beach (East) Cities PUMA101,990
- Miami-Dade County (North Central)–Greater Miami Lakes Town PUMA118,073
- Miami-Dade County (North Central)–Miami Gardens City PUMA115,915
- Miami-Dade County (North Central)–Sweetwater City & Fontainebleau PUMA97,399
- Miami-Dade County (North Central)–Tamiami Trail Region (South), Tamiami PUMA102,196
- Miami-Dade County (Northeast Central)–Miami City (Downtown) PUMA125,328
- Miami-Dade County (Northeast Central)–Miami City (North) PUMA119,973
- Miami-Dade County (Northeast)–Greater Hialeah City (North) PUMA113,578
- Miami-Dade County (Northeast)–Greater North Miami Beach City (West) PUMA106,524
- Miami-Dade County (Northeast)–Hialeah City (South) PUMA119,659
- Miami-Dade County (Northeast)–Miami Beach City, Surfside & Bay Harbor Islands Towns PUMA104,526
- Miami-Dade County (Northeast)–Opa-Locka City, West Little River & Brownsville PUMA127,870
- Miami-Dade County (South)–Homestead City (North) & Florida City (North) PUMA105,741
- Miami-Dade County (Southeast)–Cutler Bay Town & Palmetto Bay Village PUMA117,016
- Miami-Dade County (Southwest)–South Miami Heights PUMA143,015
- Miami-Dade County–North Miami City & Miami Shores & Biscayne Park Villages PUMA105,550
- Okaloosa County (North) PUMA113,791
- Okaloosa County (South) PUMA102,808
- Orange County (Central)–Orlando City (East Downtown) & Azalea Park PUMA129,111
- Orange County (Central)–Orlando City (West Downtown) & Pine Hills (Southeast) PUMA122,077
- Orange County (North Central)–Orlando (North), Winter Park & Maitland Cities PUMA127,544
- Orange County (North Central)–Orlando City (Univ. of Central Florida) & Union Park PUMA129,405
- Orange County (Northeast) PUMA141,515
- Orange County (Northwest) PUMA164,009
- Orange County (South Central)–Orlando City (South Central), Conway & Pine Castle PUMA169,197
- Orange County (Southeast) PUMA157,062
- Orange County (Southwest)–Disney-International Drive Region PUMA182,486
- Orange County (West Central)–Winter Garden, Ocoee Cities & Oakland Town PUMA149,531
- Osceola County (East) PUMA116,561
- Osceola County (West) PUMA115,980
- Osceola County (West)–Kissimmee PUMA194,874
- Palm Beach County (Central)–Wellington Village & Agricultural Reserve PUMA128,308
- Palm Beach County (East Central)–Greater Boynton Beach City (North) PUMA171,226
- Palm Beach County (East Central)–Lake Worth City, Lantana Town & Atlantis City PUMA147,046
- Palm Beach County (East)–Greenacres City (North) & Palm Springs Village (North) PUMA140,931
- Palm Beach County (East)–West Palm Beach City (Southeast) & Palm Beach Town PUMA175,157
- Palm Beach County (Northeast) PUMA114,191
- Palm Beach County (Northeast)–Palm Beach Gardens & Riviera Beach Cities PUMA129,512
- Palm Beach County (Southeast)–Boca Raton City & Highland Beach Town PUMA125,244
- Palm Beach County (Southeast)–Greater Delray Beach City PUMA129,442
- Palm Beach County (West of Boca Raton City) PUMA121,758
- Palm Beach County (West)–Glades & Western Communities PUMA150,991
- Pasco County (East Central) PUMA165,005
- Pasco County (Gulf Coast) PUMA137,245
- Pasco County (South) PUMA177,253
- Pasco County (West Central) PUMA131,941
- Pinellas County (Central)–Clearwater City (South & Central) PUMA110,439
- Pinellas County (Central)–Greater Largo City PUMA110,636
- Pinellas County (Central)–Greater Pinellas Park City PUMA116,508
- Pinellas County (North Central) PUMA112,841
- Pinellas County (North) PUMA125,219
- Pinellas County (South Central)–St. Petersburg City (West) PUMA113,481
- Pinellas County (Southeast)–St. Petersburg City (East) PUMA163,727
- Pinellas County (West Central)–Greater Seminole City PUMA110,630
- Polk County (Central) PUMA163,751
- Polk County (North) PUMA137,186
- Polk County (Northeast) PUMA214,797
- Polk County (Northwest) PUMA107,704
- Polk County (South) PUMA167,256
- Putnam & St. Johns (South) Counties PUMA110,873
- Santa Rosa County PUMA198,472
- Sarasota County (Central & Gulf Coast) PUMA150,230
- Sarasota County (East) PUMA175,392
- Sarasota County (North) PUMA133,925
- Seminole County (East) PUMA125,258
- Seminole County (North Central) PUMA117,493
- Seminole County (South Central) PUMA116,455
- Seminole County (West) PUMA122,264
- Southeast Heartland–Hendry, Highlands (South & East), Glades, & Okeechobee Counties PUMA106,742
- Southwest Heartland–DeSoto, Hardee, & Highlands (Northwest) Counties PUMA155,782
- St. Johns County (Northeast) PUMA148,767
- St. Johns County (Northwest) PUMA122,458
- St. Lucie County (North) PUMA107,439
- St. Lucie County (Southeast) PUMA116,112
- St. Lucie County (Southwest) PUMA136,949
- Sumter County PUMA143,408
- Volusia County (Central & Northwest)–DeLand, DeBary Cities & Pierson Town PUMA136,672
- Volusia County (Northeast)–Daytona Beach, Ormond Beach & Holly Hill Cities PUMA159,597
- Volusia County (Southwest Central)–Deltona & Lake Helen Cities PUMA140,202
- Volusia County–Port Orange, Edgewater, New Smyrna Beach (East) & Oak Hill Cities PUMA143,151
Urban areas
Each that reaches into Florida, with its whole population. Urban areas are the densely settled land the Census Bureau draws after each census, whatever the city lines.
- Arcadia, FL17,242
- Asbury Lake–Middleburg, FL23,726
- Bartow, FL19,039
- Belle Glade, FL22,989
- Beverly Hills–Homosassa Springs–Pine Ridge, FL102,380
- Big Pine Key, FL8,681
- Bonita Springs–Estero, FL444,271
- Bradenton–Sarasota–Venice, FL818,453
- Brooksville, FL13,147
- Burnt Store Marina, FL4,369
- Bushnell, FL4,169
- Cape Coral, FL646,026
- Clewiston, FL12,557
- Crawfordville, FL10,640
- Crestview, FL47,510
- Crystal River, FL7,522
- Dade City, FL23,110
- Daytona Beach–Palm Coast–Port Orange, FL421,121
- DeFuniak Springs, FL8,360
- Deltona, FL219,816
- Fernandina Beach–Yulee, FL54,172
- Fort Meade, FL5,031
- Four Corners, FL108,148
- Frostproof, FL7,402
- Gainesville, FL218,912
- Immokalee, FL25,215
- Indiantown, FL5,744
- Jacksonville, FL1.29M
- Key Largo, FL22,059
- Key West, FL31,157
- Keystone Heights, FL9,176
- Kissimmee–St. Cloud, FL436,594
- LaBelle, FL13,521
- Lake Bryant, FL3,432
- Lake City, FL26,251
- Lake Placid, FL18,415
- Lakeland, FL285,580
- Leesburg–Eustis–Tavares, FL160,021
- Live Oak, FL7,023
- Macclenny, FL11,251
- Marathon, FL9,760
- Marianna, FL5,631
- Marion Oaks, FL24,405
- Miami–Fort Lauderdale, FL6.19M
- Mount Plymouth, FL5,441
- Navarre–Miramar Beach–Destin, FL231,834
- Ocala, FL196,681
- Okeechobee–Taylor Creek, FL26,387
- Orangetree, FL11,167
- Orlando, FL1.91M
- Pahokee, FL6,652
- Palatka, FL20,200
- Palm Bay–Melbourne, FL535,138
- Panama City–Panama City Beach, FL168,680
- Pensacola, FL–AL400,508
- Perry, FL6,109
- Poinciana Southwest, FL19,956
- Poinciana, FL56,748
- Port Charlotte–North Port, FL213,825
- Port St. Lucie, FL465,816
- Quincy, FL7,699
- Rainbow Springs, FL5,632
- Sebring–Avon Park, FL67,075
- Spring Hill, FL175,388
- St. Augustine, FL94,492
- St. James City, FL1,915
- Starke, FL6,931
- Sugarmill Woods, FL13,412
- Tallahassee, FL258,881
- Tampa–St. Petersburg, FL2.88M
- The Villages–Lady Lake, FL168,172
- Titusville, FL61,797
- Vero Beach–Sebastian, FL180,830
- Wauchula, FL9,840
- Wildwood, FL12,394
- Winter Haven, FL282,674
- World Golf Village, FL21,402
- Zephyrhills, FL59,105
Tribal areas
Each that reaches into Florida, with its whole population.
Turn Florida into your planning report.
Social Explorer Studio builds an editable profile of any place, with tables and charts beside the county and state, and exports to Word, PDF and Excel.
Questions about Florida
What is the population of Florida?
23,462,518 people, according to the ACS 2025 1-year estimates, which the Census Bureau adjusts to match its own population estimate. That’s the 3rd largest of the 50 states and DC.
What is the FIPS code for Florida?
12. Every county’s and place’s FIPS code in Florida starts with it. The Census Bureau’s full geographic identifier (GEOID) is 0400000US12.
What is the largest city in Florida?
Jacksonville, with 1,017,687 people. Other large cities here include Miami, Tampa and Orlando.
What is the median household income in Florida?
$80,846 (±$521), according to the ACS 2025 1-year estimates, lower than the US ($84,780).
What is the median age in Florida?
43.1 years (±0.1), according to the ACS 2025 1-year estimates, higher than the US (39.5).
How much does housing cost in Florida?
Florida’s median home value is $396,700 (±$2,125) and its median gross rent is $1,866 (±$11) a month, according to the ACS 2025 1-year estimates. 57.5% (±0.9%) of its renters pay 30% or more of their income on rent.
Is Florida growing?
Florida’s population grew 15.7%, from 20,271,272 in 2015 to 23,462,518 in 2025, according to the ACS 1-year estimates.
Where do people who work in Florida live?
9,491,708 of its 9,619,338 jobs are held by people who live here. Of those who commute in, the most come from Georgia, Alabama, North Carolina.
Where does this census data come from?
The U.S. Census Bureau’s American Community Survey, through Social Explorer’s tables: the latest 1-year estimates where they exist, for the most recent numbers, and 5-year estimates otherwise. Each table lists its code, so you can find it again.
Is this data free to use?
Yes. You can read it, cite it, download the CSV and embed the charts, with no account. To map other variables, compare your own areas or build a report, see Social Explorer’s plans in a live demo.
Sources and how to cite
American Community Survey 2025 1-year estimates, or 2020–2024 5-year estimates where noted, U.S. Census Bureau, from Social Explorer’s tables A00001, A00002, A01004, A04001, A06001, A08001, A09005, A10001, A10003, A10008, A10030, A10036, A10040, A10047, A10055, A10060, A12001, A13004, A14006, A14024, A14028, A16002, A17005, A18002, A18009, A20001, B02002, B09001, B13002, B18101, C16001. Maps by census tract use 2020–2024 5-year estimates, since the 1-year survey doesn’t cover tracts. Commuting: LEHD LODES 2023. These are estimates from a sample, each with its margin of error. Data retrieved November 14, 2026. How these profiles are made.
U.S. Census Bureau, American Community Survey 2025 1-year estimates, or 2020–2024 5-year estimates where noted, via Social Explorer. “Florida.” https://www.socialexplorer.com/places/florida. Accessed November 14, 2026.