

Park Forest, Illinois · population, demographics and census data
Home to 21,156 people, the 114th largest of Illinois’s 1,445 places. It fell 5.9% between 2010–2014 and 2020–2024.
- Population
- 21,156 ±577. Rank 114 of 1,445 in Illinois
- Median household income
- $61,072 ±$3,921. Illinois $83,390 · US $80,734
- Median age
- 36.9 ±3.1. Illinois 39.0 · US 38.9
ACS 2020–2024 5-year estimates, U.S. Census Bureau
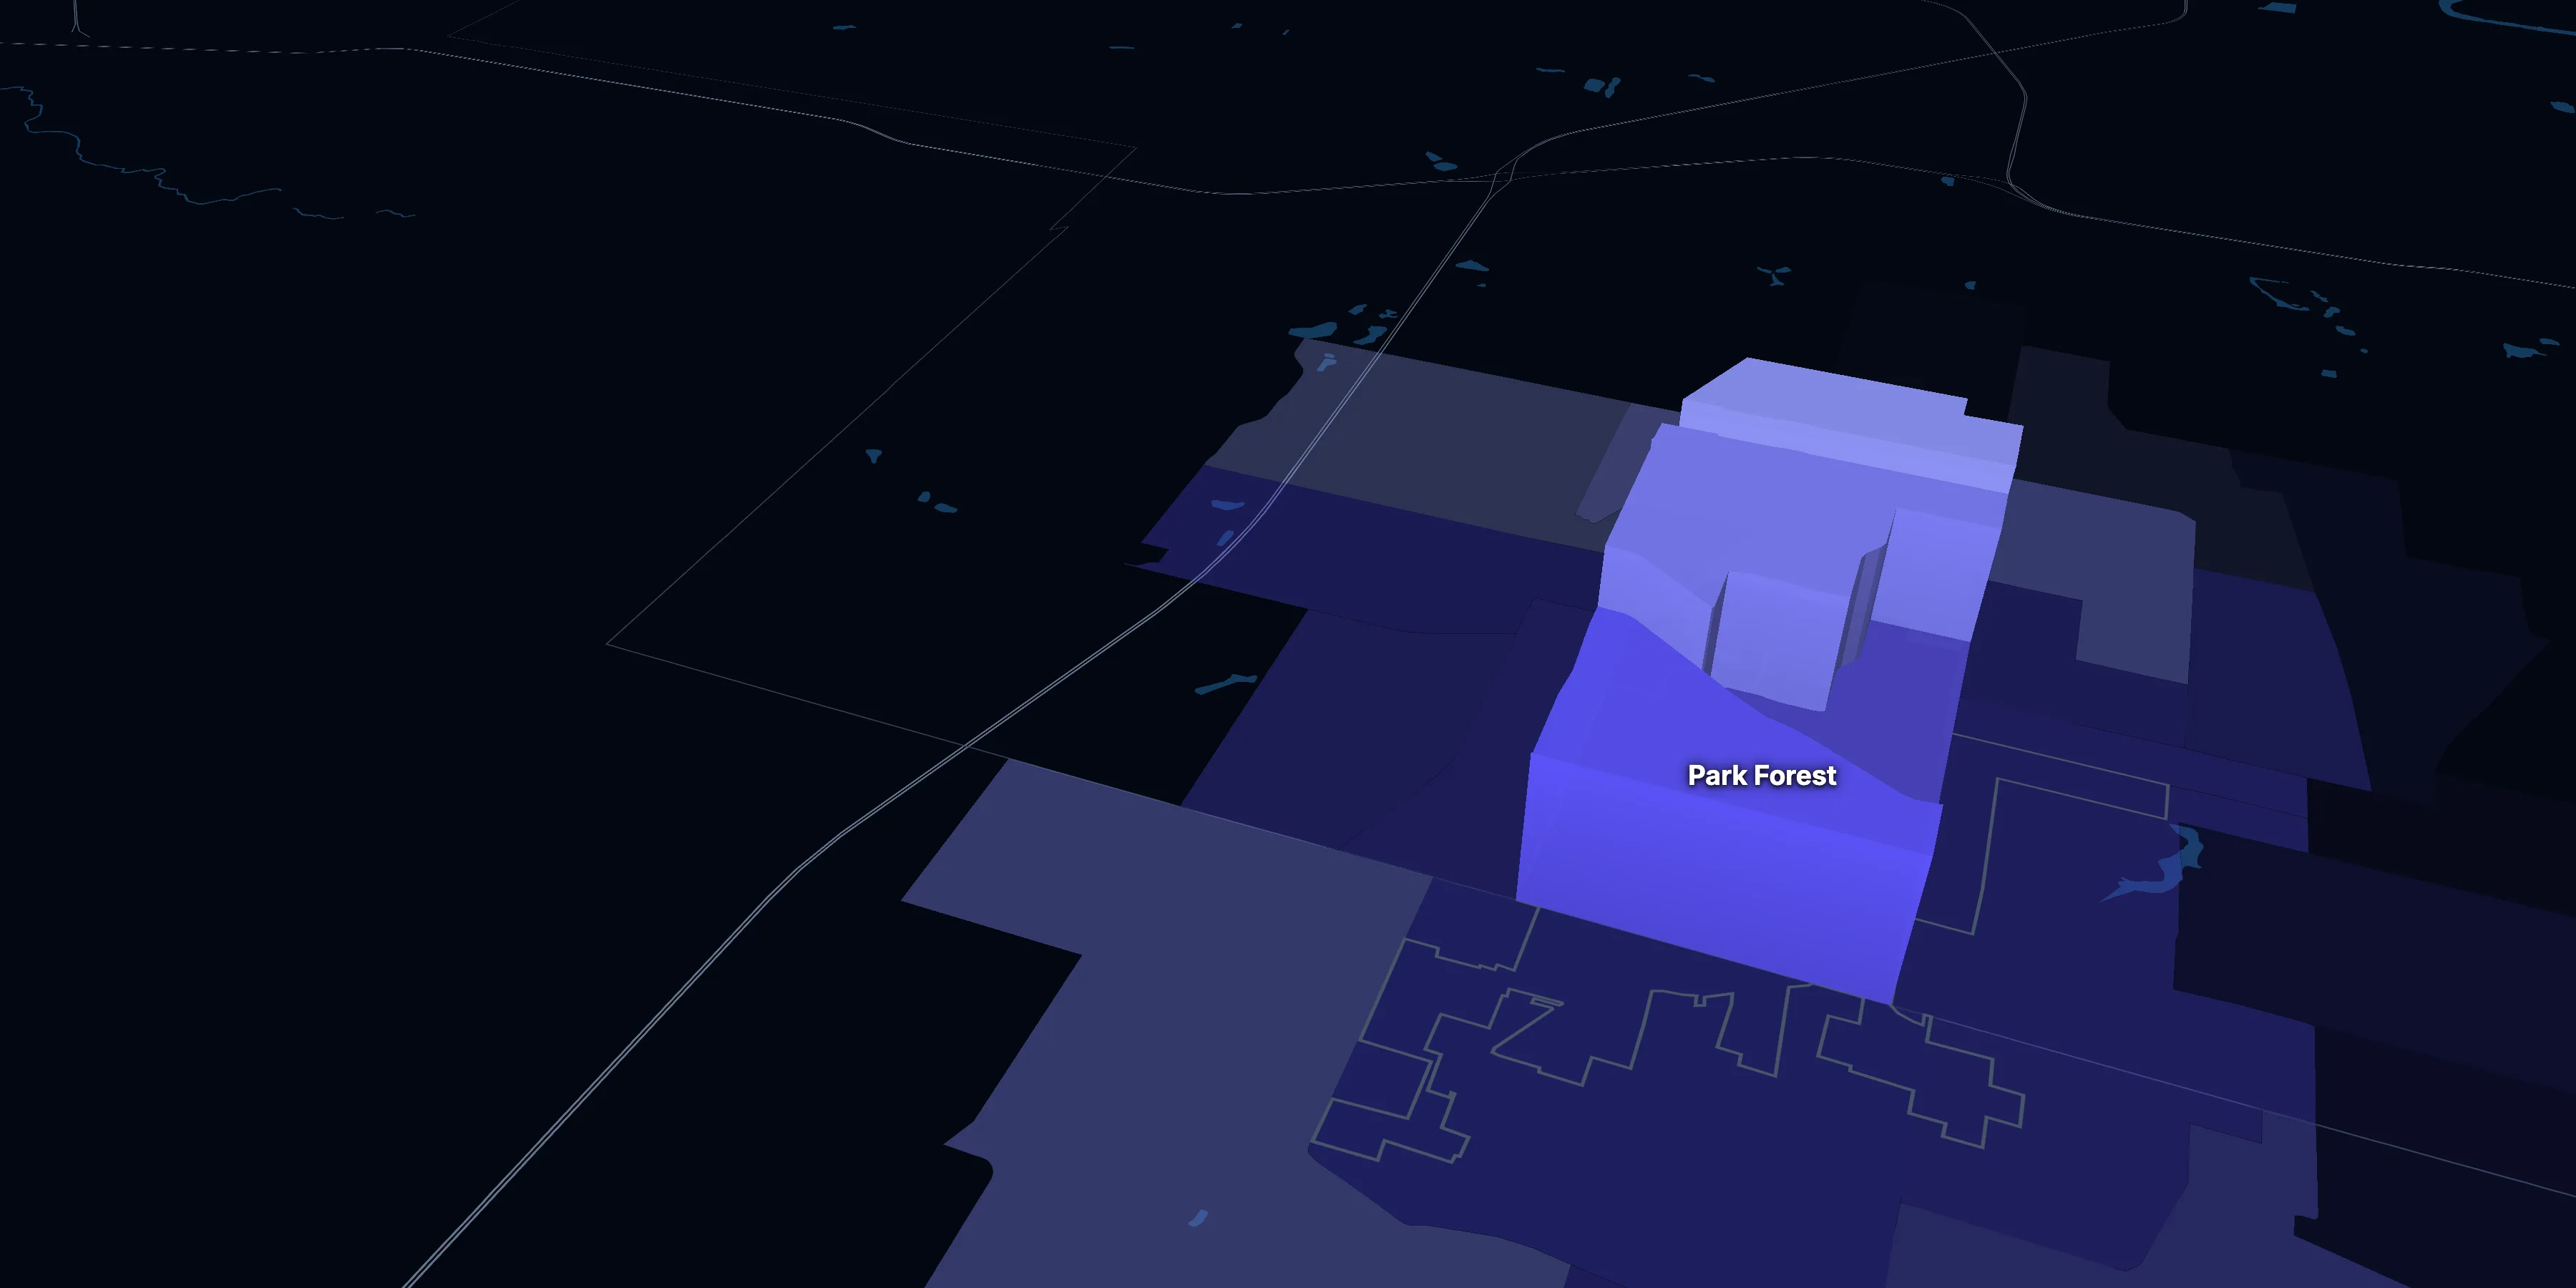
Taller, lighter tracts have higher household incomes
About Park Forest
Park Forest’s median household income is $61,072 (±$3,921), lower than both Illinois ($83,390) and the US ($80,734), and its median age is 36.9 (±3.1), according to the ACS 2020–2024 5-year estimates.
± is each figure’s margin of error, at 90% confidence, and † marks one too uncertain to lean on. Under each percentage in the tables is the number it counts. How the margins are worked out.
FIPS code 1757732
Highlights
What stands out in Park Forest
The numbers where Park Forest sits furthest from Illinois and the nation, or past a recognized policy benchmark.
Past a policy benchmark
57.9%
Very highHomes built before 1960
That’s higher than both Illinois (37.0%) and the US (25.3%). Older homes carry more lead-paint risk: the EPA found lead paint in 69% of homes built from 1940 to 1959. It’s the 97th highest of 697 Illinois places.
8.7%
HighUnemployment rate
That’s higher than both Illinois (5.8%) and the US (5.2%). The Department of Labor uses 6% as its floor for a labor surplus area. It’s the 86th highest of 697 Illinois places.
17.6%
ElevatedLiving in poverty
That’s higher than both Illinois (11.8%) and the US (12.5%). HUD and the New Markets Tax Credit use 20% poverty to mark low-income areas.
+5 points
ElevatedRent growth ahead of income
After inflation, rent grew 1% from 2010–2014 to 2020–2024, and household income -5%. The dots show rent growth.
Furthest from the national picture
67.4%
5.5× the USBlack, not Hispanic
That’s higher than both Illinois (13.3%) and the US (11.9%). It’s the 24th highest of 697 Illinois places.
4,264
45× the USPeople per square mile
That’s higher than both Illinois (229) and the US (95). It’s the 76th highest of 696 Illinois places.
2010–2014 to 2020–2024
How Park Forest changed in ten years
The village lost 1,334 people. It got older, more foreign-born and less educated, and poverty fell 2.4 points.
Population, change since 2010–14
−5.9% in the village, −1.4% in Illinois and +6.6% in the US.
Source: ACS 5-year, 2010–14 to 2020–24, table A00001.
Show data
| Park Forest | Illinois | United States | |
|---|---|---|---|
| 2010–14 | 0.0% | 0.0% | 0.0% |
| 2011–15 | −2.5% | +0.0% | +0.8% |
| 2012–16 | −2.9% | −0.1% | +1.4% |
| 2013–17 | −3.6% | −0.1% | +2.2% |
| 2014–18 | −3.5% | −0.4% | +2.8% |
| 2015–19 | −4.1% | −0.8% | +3.4% |
| 2016–20 | −7.9% | −1.2% | +4.0% |
| 2017–21 | −5.0% | −0.4% | +5.0% |
| 2018–22 | −6.4% | −0.9% | +5.4% |
| 2019–23 | −7.1% | −1.4% | +5.8% |
| 2020–24 | −5.9% | −1.4% | +6.6% |
Embed
Median household income, in 2024 dollars
−4.8% in the village, +9.9% in Illinois and +13.7% in the US.
Source: ACS 5-year, 2010–14 to 2020–24, table A14006.
Show data
| Park Forest | Illinois | United States | |
|---|---|---|---|
| 2010–14 | $64,162 | $75,909 | $71,018 |
| 2011–15 | $58,379 | $76,320 | $71,435 |
| 2012–16 | $58,517 | $77,471 | $72,401 |
| 2013–17 | $64,498 | $78,444 | $73,862 |
| 2014–18 | $64,118 | $79,512 | $75,407 |
| 2015–19 | $66,258 | $80,936 | $77,198 |
| 2016–20 | $68,420 | $83,022 | $78,856 |
| 2017–21 | $67,992 | $84,111 | $80,006 |
| 2018–22 | $63,139 | $84,068 | $80,548 |
| 2019–23 | $64,135 | $84,102 | $80,845 |
| 2020–24 | $61,072 | $83,390 | $80,734 |
Embed
Living in poverty
−2.4 points in the village, −2.6 points in Illinois and −3.1 points in the US.
Source: ACS 5-year, 2010–14 to 2020–24, table A13004.
Show data
| Park Forest | Illinois | United States | |
|---|---|---|---|
| 2010–14 | 20.1% | 14.4% | 15.6% |
| 2011–15 | 19.2% | 14.3% | 15.5% |
| 2012–16 | 18.6% | 14.0% | 15.1% |
| 2013–17 | 16.0% | 13.5% | 14.6% |
| 2014–18 | 15.7% | 13.1% | 14.1% |
| 2015–19 | 13.4% | 12.5% | 13.4% |
| 2016–20 | 12.6% | 12.0% | 12.8% |
| 2017–21 | 15.0% | 11.8% | 12.6% |
| 2018–22 | 17.3% | 11.8% | 12.5% |
| 2019–23 | 17.2% | 11.7% | 12.4% |
| 2020–24 | 17.6% | 11.8% | 12.5% |
Embed
Bachelor’s degree or more
−2.8 points in the village, +6.0 points in Illinois and +6.4 points in the US.
Source: ACS 5-year, 2010–14 to 2020–24, table A12001.
Show data
| Park Forest | Illinois | United States | |
|---|---|---|---|
| 2010–14 | 27.2% | 31.9% | 29.3% |
| 2011–15 | 26.7% | 32.3% | 29.8% |
| 2012–16 | 26.8% | 32.9% | 30.3% |
| 2013–17 | 26.7% | 33.4% | 30.9% |
| 2014–18 | 25.8% | 34.1% | 31.5% |
| 2015–19 | 26.4% | 34.7% | 32.1% |
| 2016–20 | 27.6% | 35.5% | 32.9% |
| 2017–21 | 27.4% | 36.2% | 33.7% |
| 2018–22 | 26.0% | 36.7% | 34.3% |
| 2019–23 | 25.8% | 37.2% | 35.0% |
| 2020–24 | 24.3% | 37.8% | 35.7% |
Embed
Median gross rent, in 2024 dollars
+0.5% in the village, +6.3% in Illinois and +15.6% in the US.
Source: ACS 5-year, 2010–14 to 2020–24, table A18009.
Show data
| Park Forest | Illinois | United States | |
|---|---|---|---|
| 2010–14 | $1,358 | $1,199 | $1,222 |
| 2011–15 | $1,351 | $1,202 | $1,230 |
| 2012–16 | $1,382 | $1,211 | $1,242 |
| 2013–17 | $1,398 | $1,220 | $1,258 |
| 2014–18 | $1,483 | $1,231 | $1,279 |
| 2015–19 | $1,488 | $1,241 | $1,305 |
| 2016–20 | $1,513 | $1,259 | $1,330 |
| 2017–21 | $1,518 | $1,272 | $1,348 |
| 2018–22 | $1,468 | $1,264 | $1,359 |
| 2019–23 | $1,380 | $1,263 | $1,388 |
| 2020–24 | $1,365 | $1,274 | $1,413 |
Embed
Median home value, in 2024 dollars
+5.6% in the village, +12.9% in Illinois and +42.6% in the US.
Source: ACS 5-year, 2010–14 to 2020–24, table A10036.
Show data
| Park Forest | Illinois | United States | |
|---|---|---|---|
| 2010–14 | $109,152 | $233,308 | $233,308 |
| 2011–15 | $106,180 | $230,388 | $236,751 |
| 2012–16 | $98,546 | $228,763 | $241,720 |
| 2013–17 | $88,913 | $230,225 | $247,905 |
| 2014–18 | $86,922 | $234,127 | $256,264 |
| 2015–19 | $90,412 | $238,928 | $267,181 |
| 2016–20 | $88,933 | $245,203 | $278,810 |
| 2017–21 | $89,950 | $246,435 | $283,875 |
| 2018–22 | $101,503 | $256,278 | $302,152 |
| 2019–23 | $109,320 | $257,859 | $312,314 |
| 2020–24 | $115,300 | $263,300 | $332,700 |
Embed
ACS 5-year estimates. Each point is the five years ending then, and neighboring points share years. Dollar values are in 2024 dollars. Cities and towns annex land, so part of a change can be a new boundary rather than new people.
| Indicator | 2010–2014 | 2020–2024 | Change | Illinois’s change |
|---|---|---|---|---|
| Population | 22,490 | 21,156 | −5.9% | −1.4% |
| Median age | 35.7 | 36.9 | +1.2 years | +2.0 years |
| 65 and over | 12.8% | 15.8% | +3.0 points | +3.8 points |
| Born outside the US | 3.1% | 7.3% | +4.2 points | +0.9 points |
| Hispanic or Latino | 6.4% | 9.7% | +3.2 points | +2.5 points |
| Median household income | $64,162 | $61,072 | −4.8% | +9.9% |
| Living in poverty | 20.1% | 17.6% | −2.4 points | −2.6 points |
| Bachelor’s degree or more | 27.2% | 24.3% | −2.8 points | +6.0 points |
| Households that rent | 36.8% | 34.2% | −2.6 points | −0.2 points |
| Median gross rent | $1,358 | $1,365 | +0.5% | +6.3% |
| Median home value | $109,152 | $115,300 | +5.6% | +12.9% |
4 census tracts
Park Forest, tract by tract
Village averages hide a lot. These census tracts are the closest the census comes to neighborhoods.
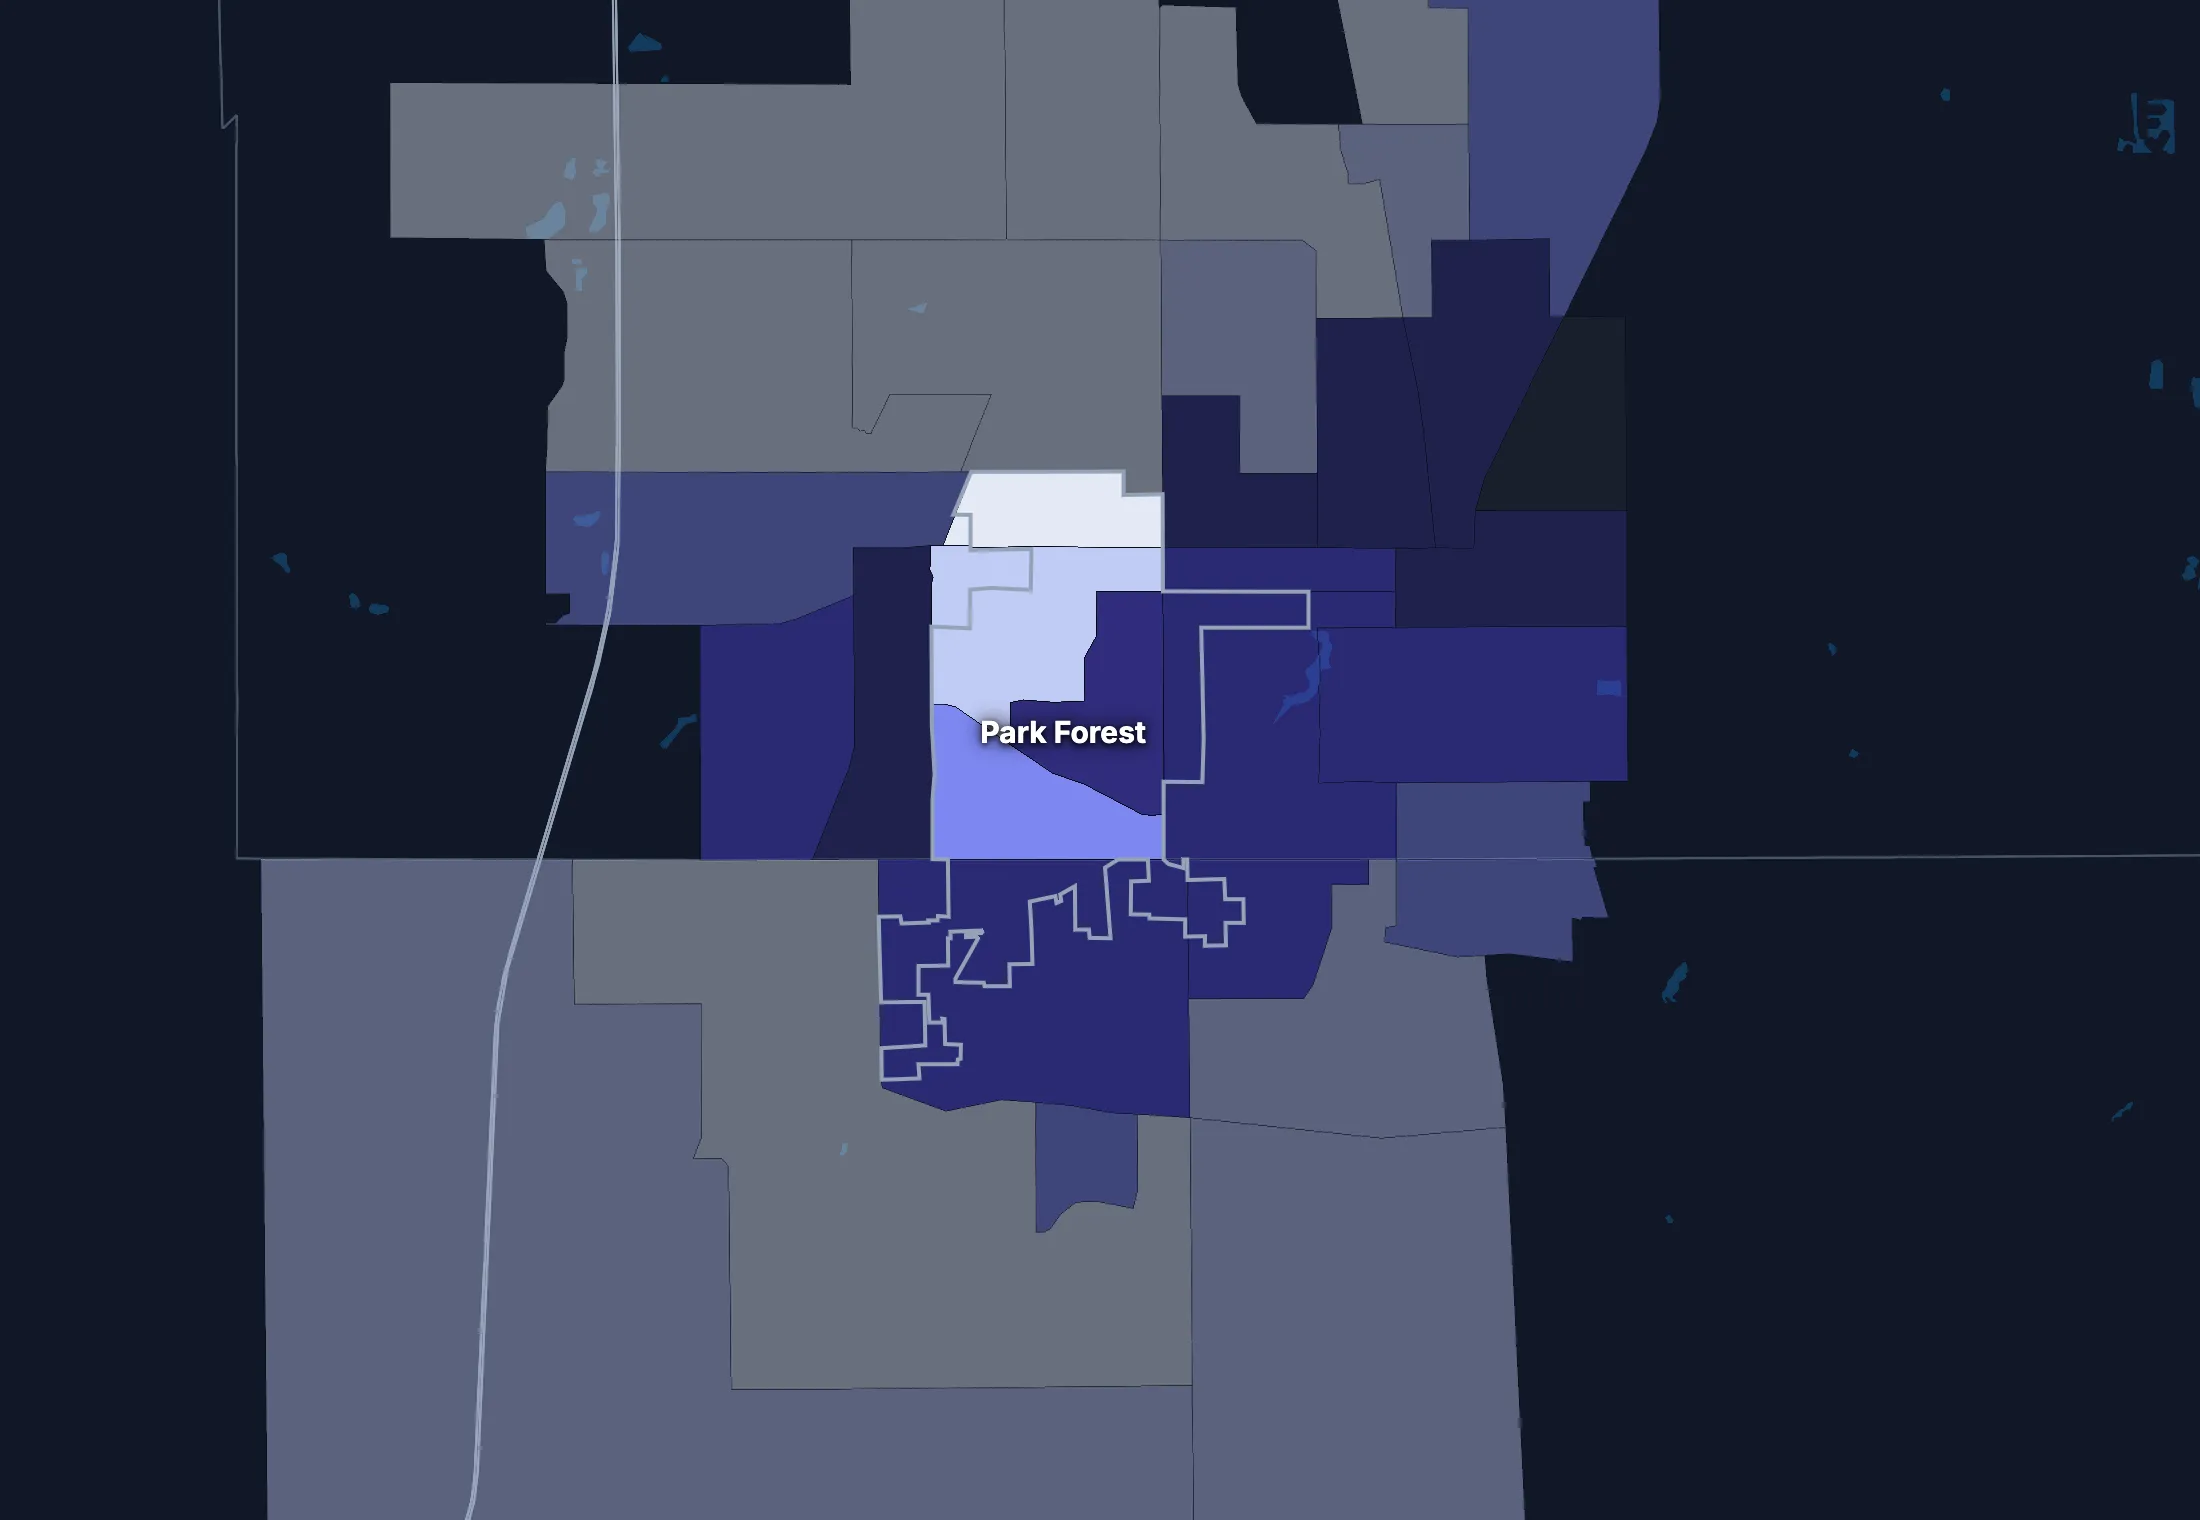
Where the village’s average misleads
Each tick is one census tract, and the dark line marks the village. Hover over a tick or tap it to see the tract.
Poverty
1 of 4 tracts is at least 1.5 times the village’s overall 17.0%, and 2 are at two-thirds of it or less.
Highest: Tract 8302.02, 26.9%. Lowest: Tract 8301, 9.5%.
Renters paying 30% or more of income
0 of 4 tracts are at least 1.5 times the village’s overall 42.5%, and 1 is at two-thirds of it or less.
Lowest: Tract 8301, 18.3%.
Median household income
0 of 4 tracts are at least 1.5 times the typical tract’s $78,882, and 1 is at two-thirds of it or less.
Lowest: Tract 8303, $42,500.
American Community Survey 2020–2024 5-year estimates, by census tract. Income is capped at $250,000+ by the Census Bureau.
People
Who lives in Park Forest
Its median age of 36.9 is about the same as both Illinois (39.0) and the US (38.9). 7.3% of residents were born outside the US, and 11.3% speak a language other than English at home.
Age
Source: ACS 2020–2024 5-year, table A01001.
Show data
| Park Forest | Illinois | United States | |
|---|---|---|---|
| Under 18 | 23.1% ±3.4% , number 4,895 ±739 | 21.8% ±0.1% , number 2,773,339 ±8,114 | 22.0% ±<0.1% , number 73,517,834 ±38,890 |
| 18 to 24 | 9.2% ±2.1% , number 1,952 ±455 | 9.1% ±<0.1% , number 1,154,455 ±6,179 | 9.1% ±<0.1% , number 30,597,362 ±37,780 |
| 25 to 34 | 15.3% ±3.1% , number 3,228 ±653 | 13.6% ±<0.1% , number 1,726,336 ±1,151 | 13.7% ±<0.1% , number 45,806,540 ±10,200 |
| 35 to 44 | 13.3% ±2.2% , number 2,822 ±468 | 13.3% ±0.1% , number 1,687,923 ±7,748 | 13.2% ±<0.1% , number 44,237,292 ±43,510 |
| 45 to 54 | 12.1% ±1.9% , number 2,560 ±407 | 12.4% ±<0.1% , number 1,575,366 ±945 | 12.2% ±<0.1% , number 40,743,799 ±8,564 |
| 55 to 64 | 11.2% ±1.7% , number 2,359 ±375 | 12.8% ±0.1% , number 1,621,165 ±7,543 | 12.7% ±<0.1% , number 42,386,044 ±41,500 |
| 65 to 74 | 11.4% ±1.9% , number 2,409 ±400 | 10.0% ±0.1% , number 1,273,219 ±6,795 | 10.2% ±<0.1% , number 34,092,907 ±38,800 |
| 75 and over | 4.4% ±1.0% , number 931 ±214 | 7.0% ±<0.1% , number 882,995 ±6,136 | 7.0% ±<0.1% , number 23,540,721 ±31,560 |
Embed
Race and ethnicity
Source: ACS 2020–2024 5-year, table A04001.
Show data
| Park Forest | Illinois | United States | |
|---|---|---|---|
| White, not Hispanic | 19.7% ±4.7% , number 4,176 ±1,004 | 58.1% ±<0.1% , number 7,370,665 ±3,871 | 57.4% ±<0.1% , number 192,214,378 ±30,950 |
| Hispanic or Latino | 9.7% ±3.0% , number 2,046 ±645 | 18.8% ±<0.1% , number 2,387,049 ±283 | 19.3% ±<0.1% , number 64,759,370 ±1,547 |
| Black, not Hispanic | 67.4% ±5.4% , number 14,254 ±1,209 | 13.3% ±<0.1% , number 1,693,169 ±5,997 | 11.9% ±<0.1% , number 39,896,127 ±46,710 |
| Asian, not Hispanic | 0.3% ±0.4% , number 73 ±79 | 5.9% ±<0.1% , number 754,004 ±3,408 | 5.9% ±<0.1% , number 19,678,814 ±22,770 |
| Other or multiracial | 2.9% ±1.0% , number 607 ±202 | 3.9% ±0.1% , number 489,911 ±8,034 | 5.5% ±<0.1% , number 18,373,810 ±69,180 |
Embed
Language spoken at home
Source: ACS 2020–2024 5-year, table C16001.
Show data
| Park Forest | Illinois | United States | |
|---|---|---|---|
| English only | 88.7% ±3.0% , number 17,899 ±853 | 76.0% ±0.1% , number 9,117,218 ±15,820 | 77.7% ±0.1% , number 245,767,039 ±221,000 |
| Spanish | 7.6% ±3.1% , number 1,534 ±626 | 14.0% ±0.1% , number 1,681,635 ±8,915 | 13.6% ±<0.1% , number 42,869,908 ±143,800 |
| Other Indo-European | 2.7% ±1.4% , number 552 ±283 | 5.7% ±0.1% , number 686,535 ±10,120 | 3.9% ±<0.1% , number 12,249,474 ±54,760 |
| Asian and Pacific Island | 0.2% ±0.3% , number 49 ±70 | 3.1% ±0.1% , number 373,795 ±7,577 | 3.6% ±<0.1% , number 11,320,253 ±40,030 |
| Arabic and other | 0.7% ±0.6% , number 150 ±113 | 1.2% ±0.1% , number 144,404 ±6,319 | 1.2% ±<0.1% , number 3,935,874 ±33,550 |
Embed
Marital status
Source: ACS 2020–2024 5-year, table A11001.
Show data
| Park Forest | Illinois | United States | |
|---|---|---|---|
| Now married | 29.0% ±2.3% , number 5,009 ±490 | 46.9% ±0.1% , number 4,890,043 ±15,210 | 47.8% ±0.1% , number 131,199,078 ±272,700 |
| Never married | 45.4% ±5.6% , number 7,845 ±1,065 | 36.4% ±0.1% , number 3,799,251 ±11,950 | 34.4% ±0.1% , number 94,480,845 ±211,900 |
| Divorced | 17.1% ±2.6% , number 2,963 ±483 | 9.6% ±0.1% , number 1,003,157 ±7,742 | 10.6% ±<0.1% , number 29,074,059 ±73,390 |
| Widowed | 6.3% ±1.4% , number 1,095 ±256 | 5.6% ±0.1% , number 583,502 ±5,277 | 5.6% ±<0.1% , number 15,250,943 ±26,710 |
| Separated | 2.2% ±1.1% , number 378 ±193 | 1.5% ±<0.1% , number 156,591 ±3,917 | 1.7% ±<0.1% , number 4,592,038 ±29,170 |
Embed
Where people lived a year ago
Source: ACS 2020–2024 5-year, table A08001.
Show data
| Park Forest | Illinois | United States | |
|---|---|---|---|
| Same home | 92.4% ±2.0% , number 19,451 ±677 | 88.9% ±0.1% , number 11,169,427 ±15,330 | 87.7% ±0.1% , number 290,692,803 ±173,800 |
| Same county | 3.8% ±1.4% , number 790 ±289 | 6.4% ±0.1% , number 810,163 ±11,630 | 6.3% ±<0.1% , number 20,792,831 ±117,600 |
| Another county in the state | 3.6% ±1.5% , number 763 ±326 | 2.4% ±<0.1% , number 302,841 ±6,277 | 3.1% ±<0.1% , number 10,316,864 ±51,200 |
| Another state | 0.1% ±0.2% , number 28 ±32 | 1.6% ±<0.1% , number 207,224 ±4,578 | 2.3% ±<0.1% , number 7,577,400 ±40,570 |
| Another country | 0.1% ±0.1% , number 14 ±24 | 0.6% ±<0.1% , number 76,198 ±4,328 | 0.6% ±<0.1% , number 2,060,087 ±23,560 |
Embed
Top countries of birth, among those born abroad
Source: ACS 2020–2024 5-year, table A07001.
Show data
| Park Forest | |
|---|---|
| Mexico | 37.3% , number 572 |
| Bosnia and Herzegovina | 9.1% , number 140 |
| Nigeria | 8.1% , number 125 |
| Middle Africa | 4.5% , number 69 |
| Ghana | 3.7% , number 56 |
| Jamaica | 3.3% , number 50 |
Embed
All the numbers
| Indicator | Park Forest | Illinois | US | Rank in Illinois* | Table |
|---|---|---|---|---|---|
| Population | 21,156 ±577 | 12,694,798 | 334,922,499 | 114th | A00001 |
| People per square mile | 4,264 ±116 | 229 | 95 | 76th | A00002 |
| Land area (square miles) | 5 | – | – | – | A00002 |
| Median age | 36.9 ±3.1 | 39.0 ±0.1 | 38.9 ±0.1 | 535th | A01004 |
| Under 18 | 23.1% ±3.4% , number 4,895 ±739 | 21.8% ±0.1% , number 2,773,339 ±8,114 | 22.0% ±<0.1% , number 73,517,834 ±38,890 | 328th | B02002 |
| 65 and over | 15.8% ±2.1% , number 3,340 ±453 | 17.0% ±0.1% , number 2,156,214 ±9,155 | 17.2% ±<0.1% , number 57,633,628 ±50,010 | 465th | B02002 |
| Born outside the US | 7.3% ±2.0% , number 1,534 ±435 | 14.7% ±0.1% , number 1,872,449 ±12,940 | 14.1% ±<0.1% , number 47,349,078 ±143,600 | 255th | A06001 |
| Speak a language other than English at home | 11.3% ±3.0% , number 2,285 ±700 | 24.0% ±0.1% , number 2,886,369 ±16,710 | 22.3% ±0.1% , number 70,375,509 ±162,500 | 267th | C16001 |
| Veterans (adults) | 4.6% ±1.4% , number 745 ±225 | 4.8% ±<0.1% , number 478,196 ±4,766 | 6.2% ±<0.1% , number 16,185,883 ±45,250 | 467th | A16002 |
| Living with a disability | 15.9% ±2.2% , number 3,345 ±474 | 12.1% ±0.1% , number 1,512,797 ±8,999 | 13.3% ±<0.1% , number 43,869,797 ±68,920 | 211th | B18101 |
| Women 15–50 who had a baby in the past year | 2.4% ±1.2% , number 132 ±68 | 4.9% ±0.1% , number 147,208 ±3,564 | 5.1% ±<0.1% , number 4,009,203 ±20,900 | 566th | B13002 |
| Lived in the same home a year ago | 92.4% ±2.0% , number 19,451 ±677 | 88.9% ±0.1% , number 11,169,427 ±15,330 | 87.7% ±0.1% , number 290,692,803 ±173,800 | 229th | A08001 |
| White, not Hispanic | 19.7% ±4.7% , number 4,176 ±1,004 | 58.1% ±<0.1% , number 7,370,665 ±3,871 | 57.4% ±<0.1% , number 192,214,378 ±30,950 | 659th | A04001 |
| Hispanic or Latino | 9.7% ±3.0% , number 2,046 ±645 | 18.8% ±<0.1% , number 2,387,049 ±283 | 19.3% ±<0.1% , number 64,759,370 ±1,547 | 269th | A04001 |
| Black, not Hispanic | 67.4% ±5.4% , number 14,254 ±1,209 | 13.3% ±<0.1% , number 1,693,169 ±5,997 | 11.9% ±<0.1% , number 39,896,127 ±46,710 | 24th | A04001 |
| Asian, not Hispanic | 0.3%† (too uncertain to lean on) ±0.4% , number 73 ±79 | 5.9% ±<0.1% , number 754,004 ±3,408 | 5.9% ±<0.1% , number 19,678,814 ±22,770 | 463rd | A04001 |
*1 is the highest. Population is ranked among all places, and the rest among those of 1,000 people or more, whose figures can be ranked. Ranks use 5-year estimates, the only ones covering every village, so they can differ slightly from the figures here.
Income and work
Lower incomes than the US
The median household income is $61,072, lower than both Illinois ($83,390) and the US ($80,734). 17.6% of people live in poverty, and 9.0% have no health insurance, about the same as both Illinois (6.9%) and the US (8.4%).
Household income
Source: ACS 2020–2024 5-year, table A14001.
Show data
| Park Forest | Illinois | United States | |
|---|---|---|---|
| Under $25,000 | 16.8% ±4.1% , number 1,365 ±341 | 14.6% ±0.1% , number 734,400 ±7,275 | 14.6% ±<0.1% , number 18,908,588 ±41,540 |
| $25,000 to $49,999 | 26.2% ±4.7% , number 2,127 ±400 | 16.0% ±0.2% , number 806,092 ±8,130 | 16.7% ±<0.1% , number 21,624,902 ±39,130 |
| $50,000 to $74,999 | 18.4% ±3.8% , number 1,499 ±324 | 14.8% ±0.1% , number 747,716 ±6,884 | 15.5% ±<0.1% , number 20,031,683 ±36,850 |
| $75,000 to $99,999 | 10.0% ±2.2% , number 814 ±186 | 12.6% ±0.1% , number 636,158 ±6,285 | 12.6% ±<0.1% , number 16,319,799 ±42,700 |
| $100,000 to $149,999 | 15.1% ±3.2% , number 1,231 ±270 | 18.0% ±0.2% , number 905,194 ±7,905 | 17.5% ±<0.1% , number 22,670,921 ±58,280 |
| $150,000 to $199,999 | 10.6% ±2.9% , number 862 ±240 | 10.1% ±0.1% , number 510,782 ±5,470 | 9.6% ±<0.1% , number 12,405,370 ±57,560 |
| $200,000 or more | 2.8% ±1.3% , number 231 ±104 | 13.8% ±0.1% , number 696,107 ±6,373 | 13.4% ±0.1% , number 17,266,233 ±82,370 |
Embed
What residents do for work
Source: ACS 2020–2024 5-year, table A17004.
Show data
| Park Forest | Illinois | United States | |
|---|---|---|---|
| Education and health care | 27.7% ±4.4% , number 2,650 ±474 | 23.6% ±0.2% , number 1,475,900 ±11,420 | 23.5% ±0.1% , number 37,913,663 ±133,200 |
| Transportation and warehousing | 15.6% ±4.1% , number 1,497 ±410 | 7.0% ±0.1% , number 439,507 ±6,137 | 5.9% ±<0.1% , number 9,568,767 ±29,300 |
| Retail trade | 10.3% ±3.3% , number 981 ±328 | 10.3% ±0.1% , number 648,265 ±6,301 | 10.8% ±<0.1% , number 17,456,908 ±41,100 |
| Manufacturing | 8.3% ±3.2% , number 792 ±311 | 11.5% ±0.1% , number 719,899 ±7,122 | 9.9% ±<0.1% , number 15,940,000 ±38,890 |
| Professional and business services | 7.7% ±2.8% , number 736 ±270 | 12.9% ±0.1% , number 805,057 ±7,244 | 12.6% ±<0.1% , number 20,282,450 ±59,650 |
| Finance, insurance and real estate | 6.4% ±2.9% , number 616 ±285 | 7.4% ±0.1% , number 465,899 ±5,864 | 6.7% ±<0.1% , number 10,783,159 ±41,000 |
| Arts, food and lodging | 6.1% ±1.9% , number 583 ±189 | 8.2% ±0.1% , number 512,046 ±6,344 | 8.7% ±<0.1% , number 13,952,453 ±52,980 |
| Public administration | 5.7% ±2.5% , number 545 ±246 | 3.8% ±0.1% , number 240,751 ±4,865 | 4.7% ±<0.1% , number 7,624,243 ±43,950 |
Embed
Where workers come from and go
Park Forest has 3,633 jobs and 9,417 employed residents. 3,348 people commute in to work and 9,132 commute out, while 285 both live and work here. The most commuters come from Chicago city.
Most commuters come from
- Chicago city: 619
- Chicago Heights city: 128
- Richton Park village: 91
Most residents commute to
- Chicago city: 2,341
- Matteson village: 333
- Chicago Heights city: 270
Show data
| Park Forest | |
|---|---|
| Live and work here | 285 |
| Work here, live elsewhere | 3,348 |
| Live here, work elsewhere | 9,132 |
Embed
All the numbers
| Indicator | Park Forest | Illinois | US | Rank in Illinois* | Table |
|---|---|---|---|---|---|
| Median household income | $61,072 ±$3,921 | $83,390 ±$362 | $80,734 ±$166 | 512th | A14006 |
| Income per person | $30,021 ±$2,342 | $46,406 ±$212 | $44,673 ±$122 | 560th | A14024 |
| Income inequality (Gini index) | 0.410 ±0.021 | 0.481 ±0.002 | 0.483 | 353rd | A14028 |
| Living in poverty | 17.6% ±4.8% , number 3,715 ±1,014 | 11.8% ±0.1% , number 1,464,937 ±18,160 | 12.5% ±0.1% , number 40,735,661 ±275,900 | 125th | A13004 |
| Unemployment rate | 8.7% ±2.8% , number 908 ±298 | 5.8% ±0.1% , number 388,370 ±6,021 | 5.2% ±<0.1% , number 8,902,365 ±38,980 | 86th | A17005 |
| No health insurance | 9.0% ±2.4% , number 1,902 ±500 | 6.9% ±0.1% , number 858,493 ±10,120 | 8.4% ±<0.1% , number 27,734,911 ±158,900 | 100th | A20001 |
*1 is the highest. Population is ranked among all places, and the rest among those of 1,000 people or more, whose figures can be ranked. Ranks use 5-year estimates, the only ones covering every village, so they can differ slightly from the figures here.
Education
Fewer college degrees than the US
24.3% of adults 25 and over have a bachelor’s degree or more, lower than both Illinois (37.8%) and the US (35.7%).
Highest level of education
Source: ACS 2020–2024 5-year, table A12001.
Show data
| Park Forest | Illinois | United States | |
|---|---|---|---|
| Less than high school | 8.4% ±2.6% , number 1,205 ±383 | 9.5% ±0.1% , number 835,754 ±8,648 | 10.4% ±<0.1% , number 23,992,410 ±82,490 |
| High school only | 25.8% ±3.7% , number 3,687 ±559 | 25.1% ±0.2% , number 2,201,051 ±16,270 | 26.0% ±0.1% , number 60,094,716 ±262,500 |
| Some college | 41.5% ±4.4% , number 5,934 ±700 | 27.5% ±0.1% , number 2,412,050 ±12,720 | 27.9% ±0.1% , number 64,356,961 ±143,900 |
| Bachelor’s degree | 15.6% ±2.9% , number 2,226 ±425 | 22.6% ±0.1% , number 1,981,080 ±11,650 | 21.6% ±0.1% , number 49,868,171 ±191,400 |
| Graduate degree | 8.8% ±2.6% , number 1,257 ±376 | 15.3% ±0.1% , number 1,337,069 ±11,130 | 14.1% ±0.1% , number 32,495,045 ±159,600 |
Embed
All the numbers
| Indicator | Park Forest | Illinois | US | Rank in Illinois* | Table |
|---|---|---|---|---|---|
| Bachelor’s degree or more | 24.3% ±3.8% , number 3,483 ±568 | 37.8% ±0.2% , number 3,318,149 ±16,110 | 35.7% ±0.1% , number 82,363,216 ±249,200 | 350th | A12001 |
| High school graduate or more | 91.6% ±5.8% , number 13,104 ±1,061 | 90.5% ±0.3% , number 7,931,250 ±26,200 | 89.6% ±0.2% , number 206,814,893 ±389,500 | 429th | A12001 |
*1 is the highest. Population is ranked among all places, and the rest among those of 1,000 people or more, whose figures can be ranked. Ranks use 5-year estimates, the only ones covering every village, so they can differ slightly from the figures here.
Housing
Home values outran incomes
34.2% of households rent, about the same as both Illinois (32.9%) and the US (34.8%). The median home is worth $115,300 and the median rent is $1,365. After inflation, home values rose 6% from 2010–2014 to 2020–2024, while household income fell 5%.
Housing costs and income, 2010–2014 to 2020–2024, after inflation
Source: ACS 5-year, table A10036, A18009, A14006.
Show data
| Park Forest | Illinois | United States | |
|---|---|---|---|
| Median home value | +5.6% | +12.9% | +42.6% |
| Median rent | +0.5% | +6.3% | +15.6% |
| Median household income | −4.8% | +9.9% | +13.7% |
Embed
Types of homes
Source: ACS 2020–2024 5-year, table A10032.
Show data
| Park Forest | Illinois | United States | |
|---|---|---|---|
| Single-family, detached | 61.7% ±4.6% , number 5,455 ±513 | 58.2% ±0.2% , number 3,178,371 ±8,662 | 61.3% ±0.1% , number 88,075,458 ±149,800 |
| Single-family, attached | 23.6% ±3.7% , number 2,085 ±347 | 6.1% ±0.1% , number 331,177 ±4,178 | 6.2% ±<0.1% , number 8,955,086 ±33,580 |
| 2 to 4 units | 3.5% ±2.1% , number 307 ±190 | 11.6% ±0.1% , number 632,952 ±6,723 | 7.7% ±<0.1% , number 11,031,346 ±42,810 |
| 5 to 19 units | 4.0% ±1.7% , number 353 ±150 | 10.3% ±0.1% , number 559,698 ±7,060 | 8.8% ±<0.1% , number 12,625,154 ±51,990 |
| 20 or more units | 7.2% ±2.1% , number 633 ±188 | 11.5% ±0.1% , number 629,864 ±6,656 | 10.3% ±<0.1% , number 14,859,547 ±31,000 |
| Mobile homes and other | 0.1% ±0.3% , number 8 ±27 | 2.3% ±<0.1% , number 125,390 ±2,657 | 5.7% ±<0.1% , number 8,228,764 ±48,580 |
Embed
When homes were built
Source: ACS 2020–2024 5-year, table A10055.
Show data
| Park Forest | Illinois | United States | |
|---|---|---|---|
| 2010 or later | 0.3% ±0.8% , number 25 ±62 | 5.7% ±0.1% , number 286,796 ±4,640 | 11.6% ±<0.1% , number 14,996,534 ±51,640 |
| 2000 to 2009 | 2.4% ±1.4% , number 195 ±113 | 11.5% ±0.1% , number 576,791 ±6,148 | 13.8% ±<0.1% , number 17,865,859 ±70,250 |
| 1980 to 1999 | 5.4% ±1.9% , number 442 ±158 | 20.0% ±0.1% , number 1,009,515 ±7,281 | 25.3% ±<0.1% , number 32,758,140 ±75,080 |
| 1960 to 1979 | 34.0% ±6.0% , number 2,760 ±515 | 25.8% ±0.2% , number 1,300,551 ±9,469 | 23.9% ±<0.1% , number 30,938,809 ±78,560 |
| Before 1960 | 57.9% ±6.1% , number 4,707 ±576 | 37.0% ±0.2% , number 1,862,796 ±10,730 | 25.3% ±<0.1% , number 32,668,154 ±83,060 |
Embed
All the numbers
| Indicator | Park Forest | Illinois | US | Rank in Illinois* | Table |
|---|---|---|---|---|---|
| Housing units | 8,841 ±510 | – | – | – | A10001 |
| Households | 8,129 ±496 | – | – | – | A10008 |
| People per household | 2.53 ±0.13 | 2.46 ±0.01 | 2.53 ±0.01 | 298th | A10003 |
| Households that rent | 34.2% ±4.8% , number 2,778 ±426 | 32.9% ±0.2% , number 1,657,539 ±10,320 | 34.8% ±0.1% , number 45,017,354 ±163,600 | 155th | A10060 |
| Vacant homes | 8.1% ±2.2% , number 712 ±202 | 7.7% ±0.1% , number 421,003 ±7,877 | 10.1% ±0.1% , number 14,547,859 ±200,400 | 265th | A10047, A10060 |
| Median gross rent | $1,365 ±$100 | $1,274 ±$5 | $1,413 ±$2 | 185th | A18009 |
| Median home value | $115,300 ±$8,619 | $263,300 ±$797 | $332,700 ±$236 | 525th | A10036 |
| Renters paying 30% or more of income | 44.4% ±8.8% , number 1,233 ±310 | 44.5% ±0.4% , number 737,425 ±8,185 | 47.6% ±0.2% , number 21,422,415 ±63,960 | 293rd | A18002 |
| Owners paying 30% or more of income | 25.7% ±4.8% , number 1,374 ±295 | 22.2% ±0.2% , number 748,748 ±6,954 | 22.5% ±0.1% , number 18,961,895 ±39,930 | 142nd | A10040 |
| Homes built before 1960 | 57.9% ±6.1% , number 4,707 ±576 | 37.0% ±0.2% , number 1,862,796 ±10,730 | 25.3% ±<0.1% , number 32,668,154 ±83,060 | 97th | A10055 |
*1 is the highest. Population is ranked among all places, and the rest among those of 1,000 people or more, whose figures can be ranked. Ranks use 5-year estimates, the only ones covering every village, so they can differ slightly from the figures here.
Getting around
A driving village with long commutes
79.0% of workers drive alone and 7.6% work from home. 47.3% of those who travel to work spend 30 minutes or more getting there, and 5.7% of households have no vehicle.
How people get to work
Source: ACS 2020–2024 5-year, table A09005.
Show data
| Park Forest | Illinois | United States | |
|---|---|---|---|
| Drive alone | 79.0% ±3.0% , number 7,235 ±632 | 65.9% ±0.2% , number 4,051,863 ±13,090 | 68.8% ±0.1% , number 109,447,738 ±95,800 |
| Carpool | 4.3% ±1.9% , number 392 ±175 | 7.8% ±0.1% , number 479,801 ±6,518 | 8.5% ±<0.1% , number 13,569,614 ±52,500 |
| Public transit | 6.2% ±2.7% , number 565 ±253 | 6.2% ±0.1% , number 379,709 ±6,008 | 3.5% ±<0.1% , number 5,573,279 ±22,170 |
| Walk | 0.8% ±0.8% , number 77 ±70 | 2.8% ±0.1% , number 169,919 ±3,550 | 2.4% ±<0.1% , number 3,772,609 ±17,080 |
| Work from home | 7.6% ±2.7% , number 700 ±255 | 15.9% ±0.1% , number 975,779 ±7,675 | 15.1% ±<0.1% , number 24,042,489 ±82,860 |
| Other | 2.1% ±1.3% , number 190 ±119 | 1.6% ±<0.1% , number 95,644 ±2,707 | 1.7% ±<0.1% , number 2,708,365 ±17,940 |
Embed
Time spent getting to work
Source: ACS 2020–2024 5-year, table B09001.
Show data
| Park Forest | Illinois | United States | |
|---|---|---|---|
| Under 10 minutes | 7.9% ±2.8% , number 672 ±247 | 12.5% ±0.1% , number 647,504 ±6,747 | 12.7% ±<0.1% , number 17,153,542 ±40,730 |
| 10 to 19 minutes | 27.4% ±5.5% , number 2,321 ±510 | 25.9% ±0.2% , number 1,341,105 ±9,293 | 28.7% ±<0.1% , number 38,741,521 ±54,980 |
| 20 to 29 minutes | 17.3% ±4.6% , number 1,466 ±412 | 19.6% ±0.2% , number 1,014,291 ±9,270 | 21.3% ±<0.1% , number 28,723,420 ±52,330 |
| 30 to 39 minutes | 13.4% ±4.0% , number 1,132 ±351 | 17.6% ±0.2% , number 912,036 ±8,489 | 16.9% ±<0.1% , number 22,853,044 ±46,230 |
| 40 to 59 minutes | 20.2% ±3.9% , number 1,705 ±359 | 14.6% ±0.1% , number 756,339 ±6,490 | 11.9% ±<0.1% , number 16,024,037 ±44,090 |
| 60 minutes or more | 13.7% ±4.1% , number 1,163 ±359 | 9.8% ±0.1% , number 505,661 ±6,311 | 8.6% ±<0.1% , number 11,576,041 ±36,550 |
Embed
Vehicles per household
Source: ACS 2020–2024 5-year, table A10030.
Show data
| Park Forest | Illinois | United States | |
|---|---|---|---|
| None | 5.7% ±2.1% , number 461 ±173 | 11.0% ±0.1% , number 552,555 ±6,471 | 8.4% ±<0.1% , number 10,793,323 ±36,450 |
| One | 48.9% ±6.6% , number 3,972 ±592 | 35.7% ±0.2% , number 1,797,531 ±11,560 | 33.1% ±0.1% , number 42,801,892 ±122,600 |
| Two | 33.4% ±4.6% , number 2,718 ±412 | 35.1% ±0.2% , number 1,766,822 ±12,100 | 36.6% ±0.1% , number 47,334,152 ±191,100 |
| Three or more | 12.0% ±3.4% , number 978 ±282 | 18.3% ±0.1% , number 919,541 ±7,294 | 21.9% ±0.1% , number 28,298,129 ±85,940 |
Embed
All the numbers
| Indicator | Park Forest | Illinois | US | Rank in Illinois* | Table |
|---|---|---|---|---|---|
| Drive to work alone | 79.0% ±3.0% , number 7,235 ±632 | 65.9% ±0.2% , number 4,051,863 ±13,090 | 68.8% ±0.1% , number 109,447,738 ±95,800 | 283rd | A09005 |
| Take public transit | 6.2% ±2.7% , number 565 ±253 | 6.2% ±0.1% , number 379,709 ±6,008 | 3.5% ±<0.1% , number 5,573,279 ±22,170 | 51st | A09005 |
| Work from home | 7.6% ±2.7% , number 700 ±255 | 15.9% ±0.1% , number 975,779 ±7,675 | 15.1% ±<0.1% , number 24,042,489 ±82,860 | 461st | A09005 |
| Commute 30 minutes or more | 47.3% ±6.0% , number 4,000 ±617 | 42.0% ±0.2% , number 2,174,036 ±12,410 | 37.4% ±<0.1% , number 50,453,122 ±73,600 | 172nd | B09001 |
| Households with no vehicle | 5.7% ±1.6% , number 461 ±136 | 11.0% ±0.1% , number 552,555 ±6,335 | 8.4% ±<0.1% , number 10,793,323 ±27,220 | 299th | A10030 |
*1 is the highest. Population is ranked among all places, and the rest among those of 1,000 people or more, whose figures can be ranked. Ranks use 5-year estimates, the only ones covering every village, so they can differ slightly from the figures here.
Places
In and around Park Forest
Population, from the latest estimates available. Figures cover the whole of each place.
Places nearby
- Chicago: 2,731,618
- Joliet: 150,314
- Orland Park: 57,916
- Oak Lawn: 56,861
- Tinley Park: 54,842
- Romeoville: 41,152
- Calumet City: 35,100
- Burbank: 28,739
Its counties
- Cook County: 5,194,625
- Will County: 712,253
Places like this one
- Battle Creek, Michigan: 52,374
- Rock Island, Illinois: 36,151
- Menasha, Wisconsin: 18,273
- Kings Grant, North Carolina: 9,003
Places at least a third this size, with the closest income, education, age, housing and origins.
Turn Park Forest into your planning report.
Social Explorer Studio builds an editable profile of any place, with tables and charts beside the county and state, and exports to Word, PDF and Excel.
Questions about Park Forest
What is the population of Park Forest, Illinois?
21,156 people (±577), according to the ACS 2020–2024 5-year estimates. That’s the 114th largest of 1,445 places in Illinois.
What is the FIPS code for Park Forest, Illinois?
1757732. The first two digits, 17, are Illinois’s state code, and the last five, 57732, identify Park Forest within it. The Census Bureau’s full geographic identifier (GEOID) is 1600000US1757732.
What county is Park Forest in?
Most of Park Forest is in Cook County, and it reaches into Will County.
What is the median household income in Park Forest?
$61,072 (±$3,921), according to the ACS 2020–2024 5-year estimates, lower than both Illinois ($83,390) and the US ($80,734).
What is the median age in Park Forest?
36.9 years (±3.1), according to the ACS 2020–2024 5-year estimates, about the same as both Illinois (39.0) and the US (38.9).
How much does housing cost in Park Forest?
Park Forest’s median home value is $115,300 (±$8,619) and its median gross rent is $1,365 (±$100) a month, according to the ACS 2020–2024 5-year estimates. 44.4% (±8.8%) of its renters pay 30% or more of their income on rent.
Is Park Forest growing?
Park Forest’s population fell 5.9%, from 22,490 in 2010–2014 to 21,156 in 2020–2024, according to the ACS 5-year estimates.
Where do people who work in Park Forest live?
285 of its 3,633 jobs are held by people who live here. Of those who commute in, the most come from Chicago city, Chicago Heights city, Richton Park village.
Where does this census data come from?
The U.S. Census Bureau’s American Community Survey, through Social Explorer’s tables: the latest 1-year estimates where they exist, for the most recent numbers, and 5-year estimates otherwise. Each table lists its code, so you can find it again.
Is this data free to use?
Yes. You can read it, cite it, download the CSV and embed the charts, with no account. To map other variables, compare your own areas or build a report, see Social Explorer’s plans in a live demo.
Sources and how to cite
American Community Survey 2020–2024 5-year estimates, U.S. Census Bureau, from Social Explorer’s tables A00001, A00002, A01004, A04001, A06001, A08001, A09005, A10001, A10003, A10008, A10030, A10036, A10040, A10047, A10055, A10060, A12001, A13004, A14006, A14024, A14028, A16002, A17005, A18002, A18009, A20001, B02002, B09001, B13002, B18101, C16001. Maps by census tract use 2020–2024 5-year estimates, since the 1-year survey doesn’t cover tracts. Commuting: LEHD LODES 2023. These are estimates from a sample, each with its margin of error. Data retrieved November 14, 2026. How these profiles are made.
U.S. Census Bureau, American Community Survey 2020–2024 5-year estimates, via Social Explorer. “Park Forest, Illinois.” https://www.socialexplorer.com/places/illinois/park-forest-village. Accessed November 14, 2026.