

Goodlettsville, Tennessee · population, demographics and census data
Home to 17,597 people, the 35th largest of Tennessee’s 502 places. It grew 6.9% between 2010–2014 and 2020–2024.
- Population
- 17,597 ±42. Rank 35 of 502 in Tennessee
- Median household income
- $70,758 ±$8,023. Tennessee $69,595 · US $80,734
- Median age
- 38.5 ±3.1. Tennessee 38.9 · US 38.9
ACS 2020–2024 5-year estimates, U.S. Census Bureau
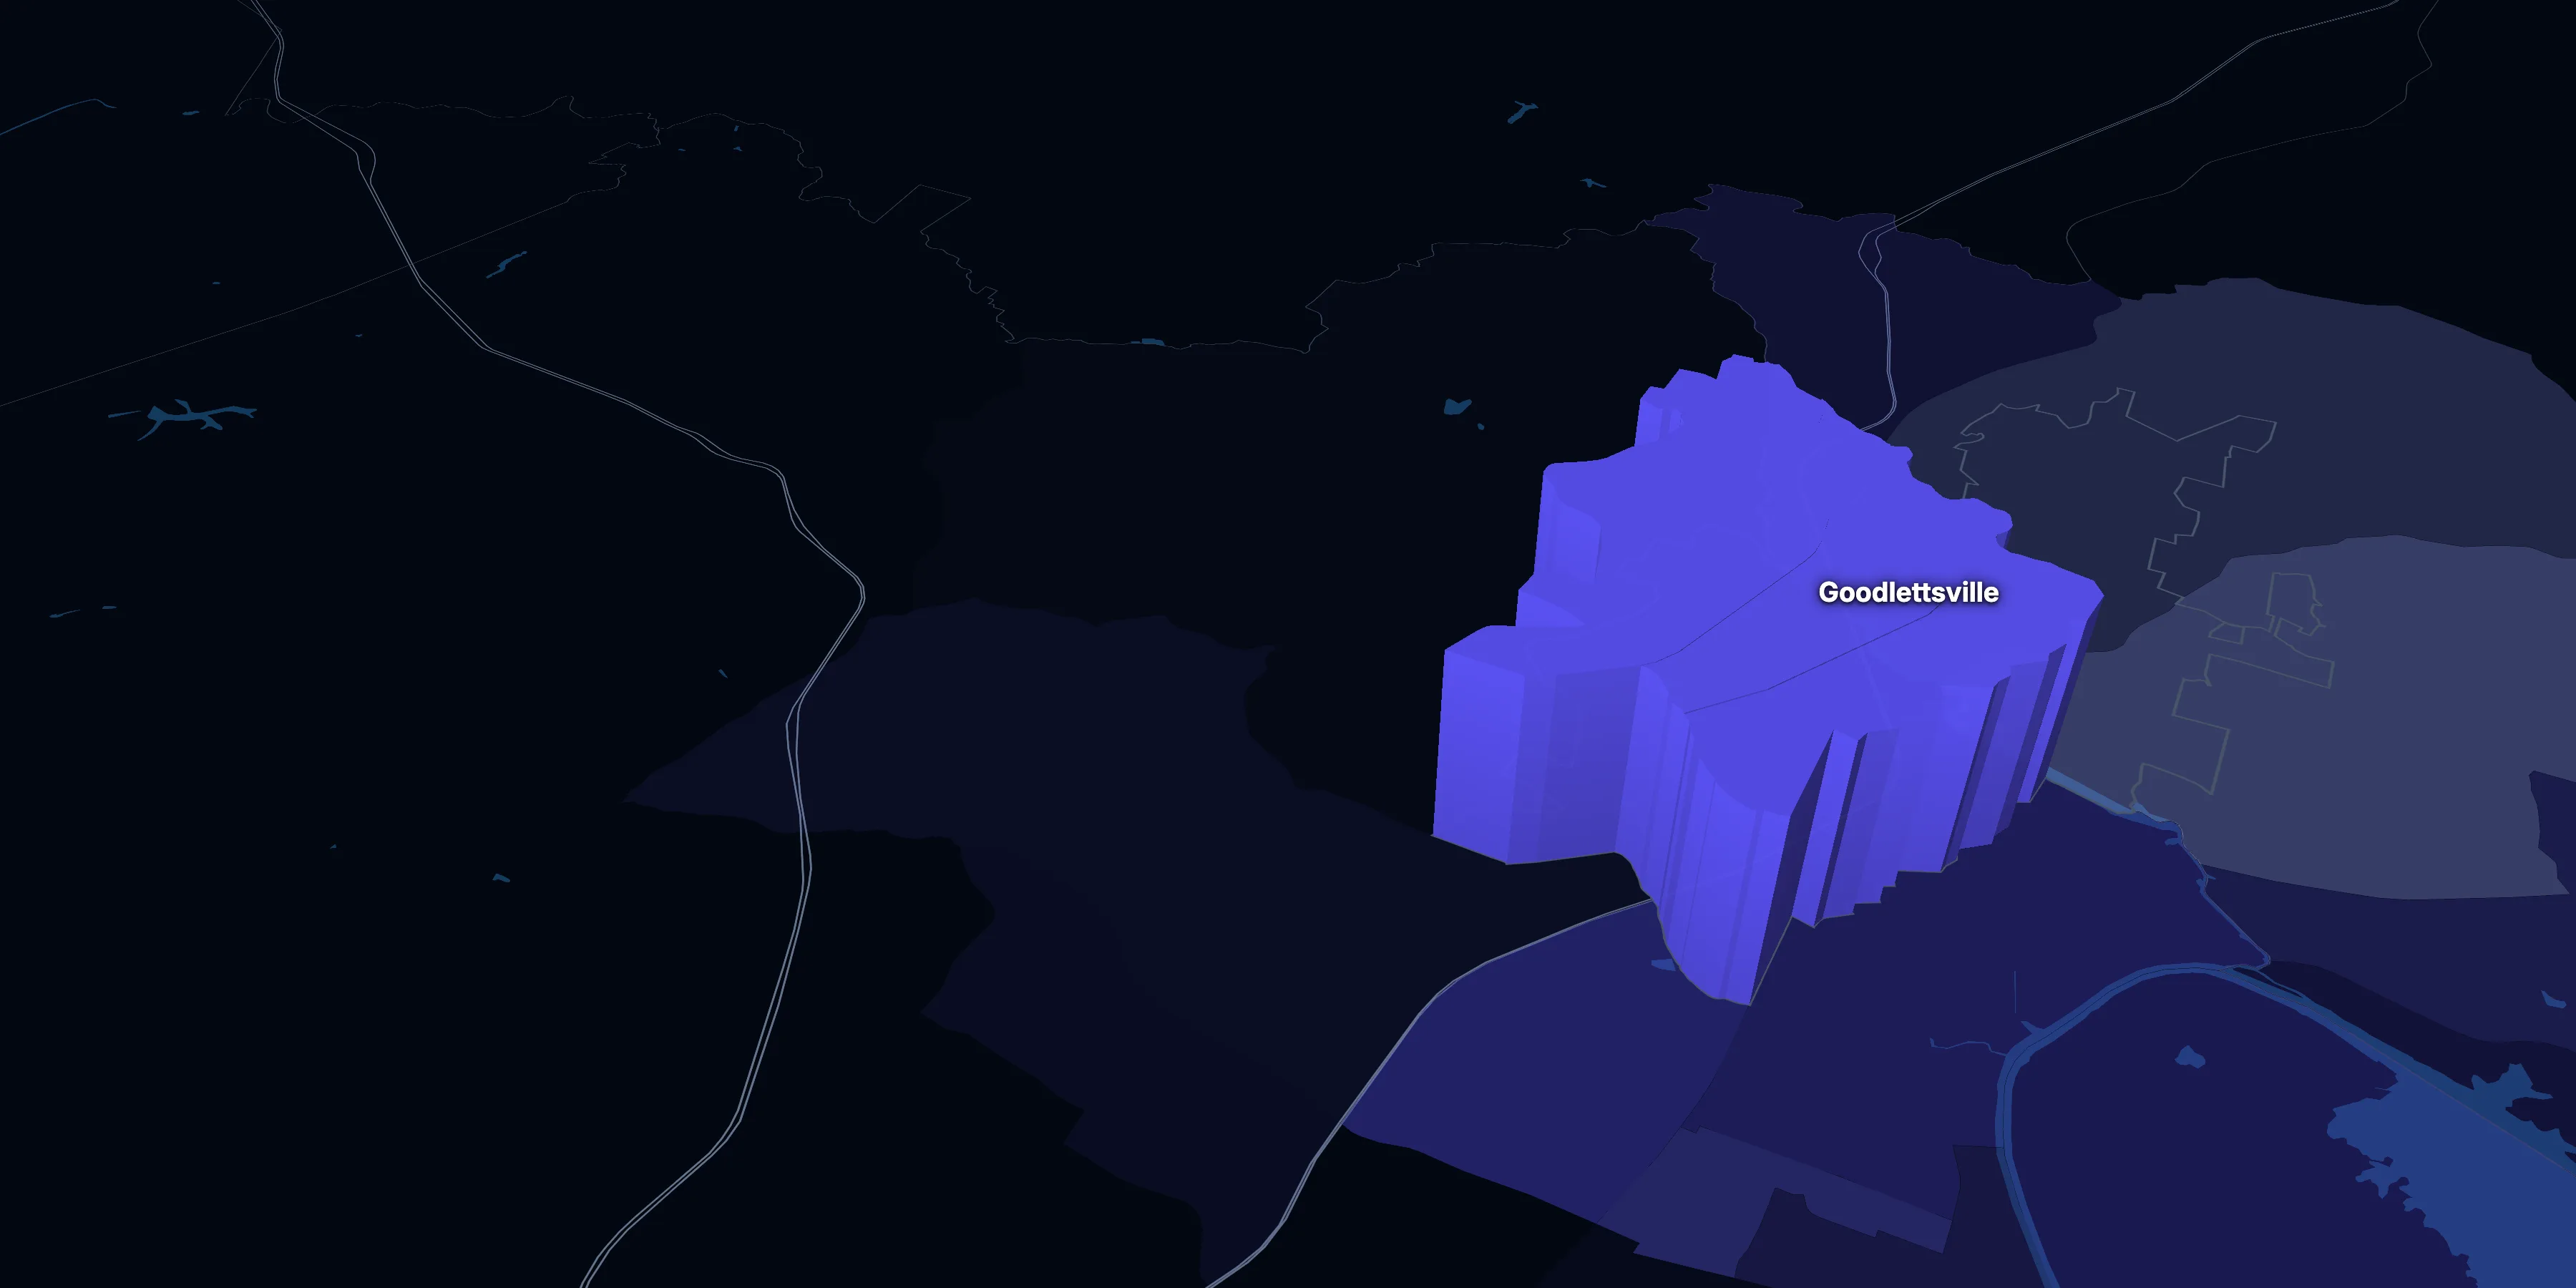
Taller, lighter tracts have higher household incomes
About Goodlettsville
Goodlettsville’s median household income is $70,758 (±$8,023), about the same as Tennessee ($69,595) but lower than the US ($80,734), and its median age is 38.5 (±3.1), according to the ACS 2020–2024 5-year estimates.
± is each figure’s margin of error, at 90% confidence, and † marks one too uncertain to lean on. Under each percentage in the tables is the number it counts. How the margins are worked out.
FIPS code 4729920
Highlights
What stands out in Goodlettsville
The numbers where Goodlettsville sits furthest from Tennessee and the nation, or past a recognized policy benchmark.
Past a policy benchmark
+16 points
HighRent growth ahead of income
After inflation, rent grew 17% from 2010–2014 to 2020–2024, and household income 1%. The dots show rent growth.
4.6%
Tight marketVacant homes
That’s lower than both Tennessee (10.2%) and the US (10.1%). Below 5% vacancy is the usual sign of a tight housing market.
Furthest from the national picture
0.0%
Very lowTake public transit
That’s lower than both Tennessee (0.5%) and the US (3.5%).
5.4%
Very lowBorn outside the US
That’s about the same as Tennessee (6.1%) but lower than the US (14.1%).
25.5%
2× the USBlack, not Hispanic
That’s higher than both Tennessee (15.4%) and the US (11.9%). It’s the 16th highest of 305 Tennessee places.
1.4%
Very lowAsian, not Hispanic
That’s about the same as Tennessee (1.9%) but lower than the US (5.9%).
2010–2014 to 2020–2024
How Goodlettsville changed in ten years
The city added 1,131 people. It got younger, more foreign-born and better educated, and poverty fell 1.5 points.
Population, change since 2010–14
+6.9% in the city, +9.5% in Tennessee and +6.6% in the US.
Source: ACS 5-year, 2010–14 to 2020–24, table A00001.
Show data
| Goodlettsville | Tennessee | United States | |
|---|---|---|---|
| 2010–14 | 0.0% | 0.0% | 0.0% |
| 2011–15 | +1.3% | +0.7% | +0.8% |
| 2012–16 | +2.3% | +1.5% | +1.4% |
| 2013–17 | +2.8% | +2.3% | +2.2% |
| 2014–18 | +2.6% | +3.1% | +2.8% |
| 2015–19 | +2.5% | +4.0% | +3.4% |
| 2016–20 | +2.2% | +5.0% | +4.0% |
| 2017–21 | +6.4% | +6.3% | +5.0% |
| 2018–22 | +6.3% | +7.3% | +5.4% |
| 2019–23 | +6.9% | +8.3% | +5.8% |
| 2020–24 | +6.9% | +9.5% | +6.6% |
Embed
Median household income, in 2024 dollars
+1.2% in the city, +17.5% in Tennessee and +13.7% in the US.
Source: ACS 5-year, 2010–14 to 2020–24, table A14006.
Show data
| Goodlettsville | Tennessee | United States | |
|---|---|---|---|
| 2010–14 | $69,910 | $59,251 | $71,018 |
| 2011–15 | $71,268 | $59,942 | $71,435 |
| 2012–16 | $68,660 | $60,952 | $72,401 |
| 2013–17 | $69,592 | $62,403 | $73,862 |
| 2014–18 | $75,316 | $63,749 | $75,407 |
| 2015–19 | $74,034 | $65,499 | $77,198 |
| 2016–20 | $67,770 | $66,527 | $78,856 |
| 2017–21 | $73,310 | $67,829 | $80,006 |
| 2018–22 | $69,221 | $68,635 | $80,548 |
| 2019–23 | $67,834 | $69,068 | $80,845 |
| 2020–24 | $70,758 | $69,595 | $80,734 |
Embed
Living in poverty
−1.5 points in the city, −4.1 points in Tennessee and −3.1 points in the US.
Source: ACS 5-year, 2010–14 to 2020–24, table A13004.
Show data
| Goodlettsville | Tennessee | United States | |
|---|---|---|---|
| 2010–14 | 11.2% | 17.8% | 15.6% |
| 2011–15 | 11.9% | 17.6% | 15.5% |
| 2012–16 | 12.5% | 17.2% | 15.1% |
| 2013–17 | 12.1% | 16.7% | 14.6% |
| 2014–18 | 14.2% | 16.1% | 14.1% |
| 2015–19 | 10.8% | 15.2% | 13.4% |
| 2016–20 | 12.1% | 14.6% | 12.8% |
| 2017–21 | 10.2% | 14.3% | 12.6% |
| 2018–22 | 11.0% | 14.0% | 12.5% |
| 2019–23 | 9.6% | 13.8% | 12.4% |
| 2020–24 | 9.7% | 13.8% | 12.5% |
Embed
Bachelor’s degree or more
+4.3 points in the city, +6.7 points in Tennessee and +6.4 points in the US.
Source: ACS 5-year, 2010–14 to 2020–24, table A12001.
Show data
| Goodlettsville | Tennessee | United States | |
|---|---|---|---|
| 2010–14 | 28.8% | 24.4% | 29.3% |
| 2011–15 | 27.0% | 24.9% | 29.8% |
| 2012–16 | 28.4% | 25.4% | 30.3% |
| 2013–17 | 29.2% | 26.1% | 30.9% |
| 2014–18 | 32.5% | 26.6% | 31.5% |
| 2015–19 | 33.9% | 27.3% | 32.1% |
| 2016–20 | 33.7% | 28.2% | 32.9% |
| 2017–21 | 33.9% | 29.0% | 33.7% |
| 2018–22 | 34.6% | 29.7% | 34.3% |
| 2019–23 | 32.7% | 30.4% | 35.0% |
| 2020–24 | 33.1% | 31.1% | 35.7% |
Embed
Median gross rent, in 2024 dollars
+17.1% in the city, +18.3% in Tennessee and +15.6% in the US.
Source: ACS 5-year, 2010–14 to 2020–24, table A18009.
Show data
| Goodlettsville | Tennessee | United States | |
|---|---|---|---|
| 2010–14 | $1,183 | $1,005 | $1,222 |
| 2011–15 | $1,216 | $1,013 | $1,230 |
| 2012–16 | $1,228 | $1,023 | $1,242 |
| 2013–17 | $1,243 | $1,035 | $1,258 |
| 2014–18 | $1,313 | $1,052 | $1,279 |
| 2015–19 | $1,340 | $1,067 | $1,305 |
| 2016–20 | $1,412 | $1,088 | $1,330 |
| 2017–21 | $1,382 | $1,102 | $1,348 |
| 2018–22 | $1,439 | $1,122 | $1,359 |
| 2019–23 | $1,410 | $1,155 | $1,388 |
| 2020–24 | $1,385 | $1,189 | $1,413 |
Embed
Median home value, in 2024 dollars
+58.5% in the city, +54.3% in Tennessee and +42.6% in the US.
Source: ACS 5-year, 2010–14 to 2020–24, table A10036.
Show data
| Goodlettsville | Tennessee | United States | |
|---|---|---|---|
| 2010–14 | $241,010 | $185,770 | $233,308 |
| 2011–15 | $233,172 | $188,367 | $236,751 |
| 2012–16 | $232,820 | $191,072 | $241,720 |
| 2013–17 | $251,492 | $194,352 | $247,905 |
| 2014–18 | $259,765 | $198,357 | $256,264 |
| 2015–19 | $268,778 | $205,392 | $267,181 |
| 2016–20 | $294,583 | $215,477 | $278,810 |
| 2017–21 | $304,972 | $224,527 | $283,875 |
| 2018–22 | $334,093 | $248,775 | $302,152 |
| 2019–23 | $365,430 | $264,345 | $312,314 |
| 2020–24 | $381,900 | $286,700 | $332,700 |
Embed
ACS 5-year estimates. Each point is the five years ending then, and neighboring points share years. Dollar values are in 2024 dollars. Cities and towns annex land, so part of a change can be a new boundary rather than new people.
| Indicator | 2010–2014 | 2020–2024 | Change | Tennessee’s change |
|---|---|---|---|---|
| Population | 16,466 | 17,597 | +6.9% | +9.5% |
| Median age | 43.5 | 38.5 | −5.0 years | +0.6 years |
| 65 and over | 15.9% | 17.8% | +1.9 points | +2.8 points |
| Born outside the US | 4.0% | 5.4% | +1.4 points | +1.4 points |
| Hispanic or Latino | 3.9% | 9.0% | +5.2 points | +2.6 points |
| Median household income | $69,910 | $70,758 | +1.2% | +17.5% |
| Living in poverty | 11.2% | 9.7% | −1.5 points | −4.1 points |
| Bachelor’s degree or more | 28.8% | 33.1% | +4.3 points | +6.7 points |
| Households that rent | 42.3% | 39.5% | −2.8 points | +0.2 points |
| Median gross rent | $1,183 | $1,385 | +17.1% | +18.3% |
| Median home value | $241,010 | $381,900 | +58.5% | +54.3% |
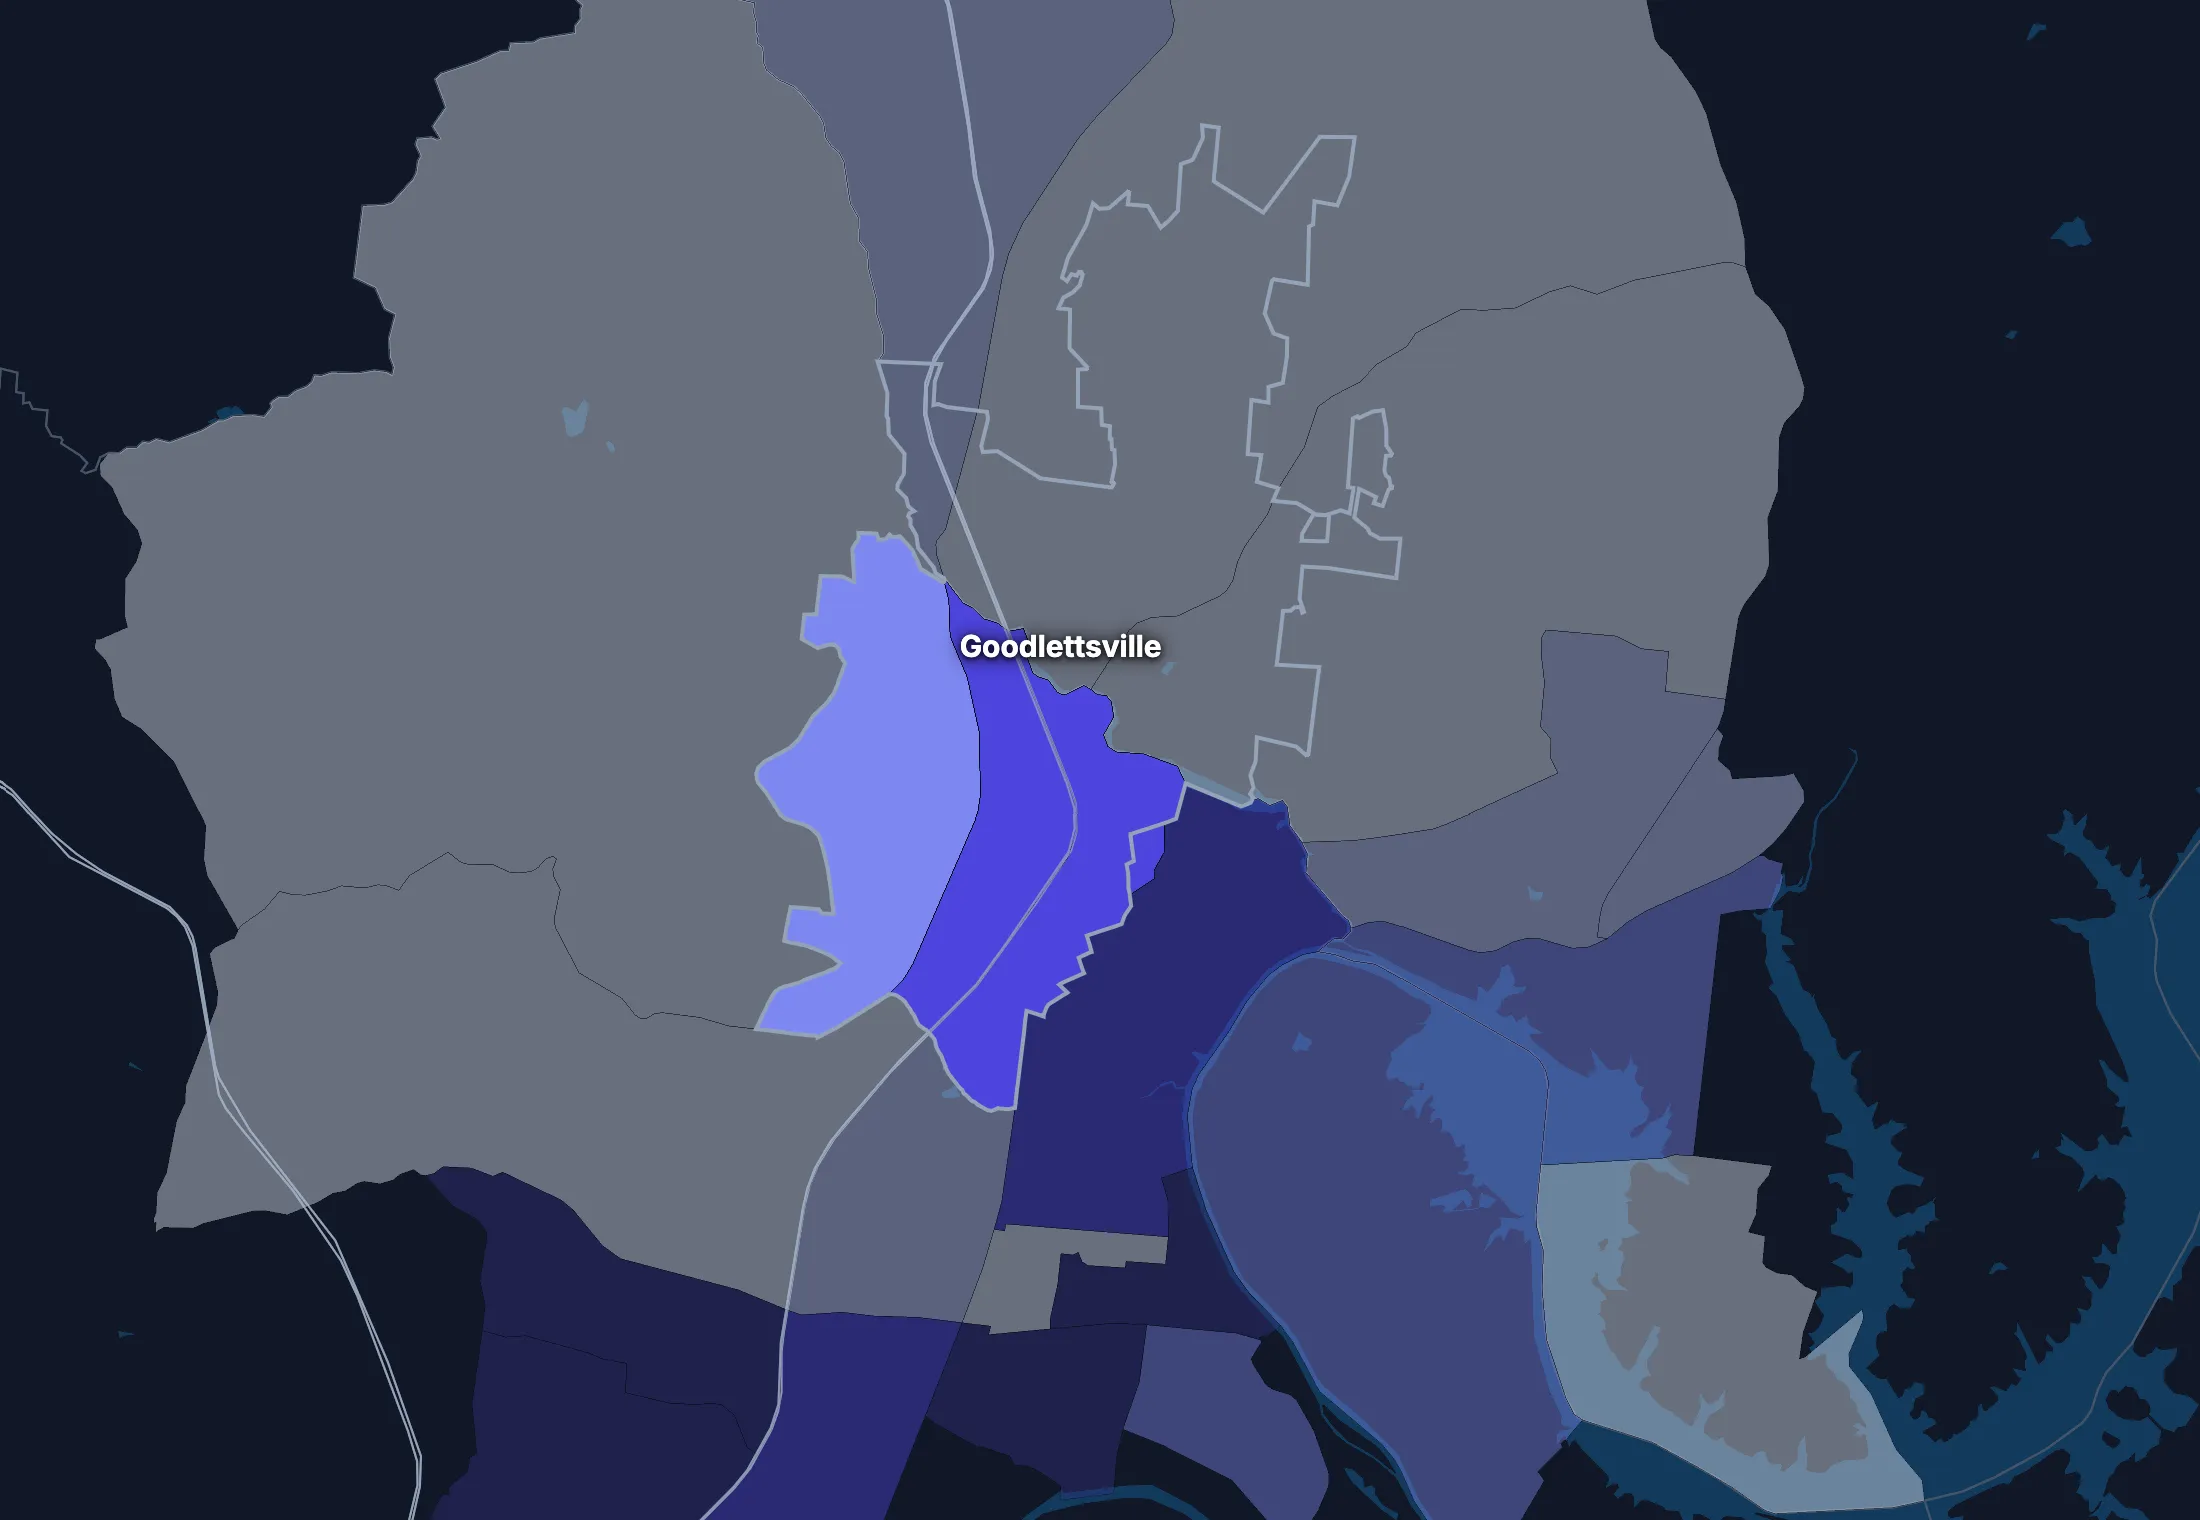
3 census tracts
Goodlettsville, tract by tract
City averages hide a lot. These census tracts are the closest the census comes to neighborhoods.
Where the city’s average misleads
Each tick is one census tract, and the dark line marks the city. Hover over a tick or tap it to see the tract.
Renters paying 30% or more of income
0 of 3 tracts are at least 1.5 times the city’s overall 55.3%, and 1 is at two-thirds of it or less.
Lowest: Tract 103.02, 32.5%.
American Community Survey 2020–2024 5-year estimates, by census tract. Income is capped at $250,000+ by the Census Bureau.
People
Who lives in Goodlettsville
Its median age of 38.5 is about the same as both Tennessee (38.9) and the US (38.9). 5.4% of residents were born outside the US, and 8.0% speak a language other than English at home.
Age
Source: ACS 2020–2024 5-year, table A01001.
Show data
| Goodlettsville | Tennessee | United States | |
|---|---|---|---|
| Under 18 | 20.4% ±3.3% , number 3,588 ±578 | 22.2% ±0.1% , number 1,566,969 ±6,893 | 22.0% ±<0.1% , number 73,517,834 ±38,890 |
| 18 to 24 | 7.8% ±3.4% , number 1,366 ±606 | 8.9% ±0.1% , number 629,084 ±5,212 | 9.1% ±<0.1% , number 30,597,362 ±37,780 |
| 25 to 34 | 15.2% ±2.6% , number 2,672 ±466 | 13.8% ±<0.1% , number 977,398 ±1,698 | 13.7% ±<0.1% , number 45,806,540 ±10,200 |
| 35 to 44 | 15.3% ±2.7% , number 2,684 ±477 | 12.8% ±0.1% , number 906,506 ±6,310 | 13.2% ±<0.1% , number 44,237,292 ±43,510 |
| 45 to 54 | 10.2% ±2.1% , number 1,803 ±373 | 12.4% ±<0.1% , number 873,240 ±1,489 | 12.2% ±<0.1% , number 40,743,799 ±8,564 |
| 55 to 64 | 13.4% ±2.3% , number 2,359 ±398 | 12.8% ±0.1% , number 907,239 ±6,455 | 12.7% ±<0.1% , number 42,386,044 ±41,500 |
| 65 to 74 | 10.4% ±2.6% , number 1,827 ±458 | 10.3% ±0.1% , number 729,187 ±5,684 | 10.2% ±<0.1% , number 34,092,907 ±38,800 |
| 75 and over | 7.4% ±1.7% , number 1,298 ±292 | 6.7% ±0.1% , number 476,760 ±4,024 | 7.0% ±<0.1% , number 23,540,721 ±31,560 |
Embed
Race and ethnicity
Source: ACS 2020–2024 5-year, table A04001.
Show data
| Goodlettsville | Tennessee | United States | |
|---|---|---|---|
| White, not Hispanic | 55.8% ±5.7% , number 9,811 ±995 | 71.0% ±0.1% , number 5,018,980 ±3,671 | 57.4% ±<0.1% , number 192,214,378 ±30,950 |
| Hispanic or Latino | 9.0% ±3.3% , number 1,584 ±583 | 7.4% ±<0.1% , number 523,528 ±277 | 19.3% ±<0.1% , number 64,759,370 ±1,547 |
| Black, not Hispanic | 25.5% ±3.2% , number 4,493 ±569 | 15.4% ±0.1% , number 1,090,494 ±4,152 | 11.9% ±<0.1% , number 39,896,127 ±46,710 |
| Asian, not Hispanic | 1.4% ±0.9% , number 249 ±161 | 1.9% ±<0.1% , number 133,337 ±2,203 | 5.9% ±<0.1% , number 19,678,814 ±22,770 |
| Other or multiracial | 8.3% ±5.2% , number 1,460 ±907 | 4.2% ±0.1% , number 300,044 ±6,483 | 5.5% ±<0.1% , number 18,373,810 ±69,180 |
Embed
Language spoken at home
Source: ACS 2020–2024 5-year, table C16001.
Show data
| Goodlettsville | Tennessee | United States | |
|---|---|---|---|
| English only | 92.0% ±2.6% , number 15,142 ±524 | 91.4% ±0.1% , number 6,081,056 ±8,001 | 77.7% ±0.1% , number 245,767,039 ±221,000 |
| Spanish | 6.5% ±3.0% , number 1,069 ±489 | 5.2% ±0.1% , number 348,679 ±5,025 | 13.6% ±<0.1% , number 42,869,908 ±143,800 |
| Other Indo-European | 0.6% ±0.5% , number 100 ±87 | 1.4% ±0.1% , number 90,984 ±3,987 | 3.9% ±<0.1% , number 12,249,474 ±54,760 |
| Asian and Pacific Island | 0.7% ±0.6% , number 111 ±106 | 1.1% ±<0.1% , number 73,629 ±3,034 | 3.6% ±<0.1% , number 11,320,253 ±40,030 |
| Arabic and other | 0.2% ±0.4% , number 39 ±60 | 0.9% ±0.1% , number 61,111 ±4,507 | 1.2% ±<0.1% , number 3,935,874 ±33,550 |
Embed
Marital status
Source: ACS 2020–2024 5-year, table A11001.
Show data
| Goodlettsville | Tennessee | United States | |
|---|---|---|---|
| Now married | 44.3% ±3.4% , number 6,543 ±544 | 48.8% ±0.2% , number 2,821,518 ±12,780 | 47.8% ±0.1% , number 131,199,078 ±272,700 |
| Never married | 33.6% ±5.2% , number 4,957 ±776 | 31.2% ±0.2% , number 1,800,280 ±9,465 | 34.4% ±0.1% , number 94,480,845 ±211,900 |
| Divorced | 12.9% ±2.8% , number 1,905 ±423 | 11.9% ±0.1% , number 687,609 ±6,979 | 10.6% ±<0.1% , number 29,074,059 ±73,390 |
| Widowed | 8.1% ±2.6% , number 1,189 ±384 | 6.4% ±0.1% , number 367,610 ±4,186 | 5.6% ±<0.1% , number 15,250,943 ±26,710 |
| Separated | 1.1% ±0.7% , number 168 ±97 | 1.7% ±<0.1% , number 100,848 ±2,820 | 1.7% ±<0.1% , number 4,592,038 ±29,170 |
Embed
Where people lived a year ago
Source: ACS 2020–2024 5-year, table A08001.
Show data
| Goodlettsville | Tennessee | United States | |
|---|---|---|---|
| Same home | 86.9% ±3.9% , number 14,997 ±689 | 87.1% ±0.2% , number 6,082,385 ±12,760 | 87.7% ±0.1% , number 290,692,803 ±173,800 |
| Same county | 3.3% ±1.7% , number 565 ±286 | 6.4% ±0.1% , number 445,169 ±9,727 | 6.3% ±<0.1% , number 20,792,831 ±117,600 |
| Another county in the state | 5.3% ±1.7% , number 906 ±297 | 3.1% ±0.1% , number 217,379 ±6,236 | 3.1% ±<0.1% , number 10,316,864 ±51,200 |
| Another state | 3.8% ±3.0% , number 648 ±526 | 3.0% ±0.1% , number 211,490 ±5,979 | 2.3% ±<0.1% , number 7,577,400 ±40,570 |
| Another country | 0.8% ±0.9% , number 140 ±157 | 0.4% ±<0.1% , number 27,326 ±2,647 | 0.6% ±<0.1% , number 2,060,087 ±23,560 |
Embed
Top countries of birth, among those born abroad
Source: ACS 2020–2024 5-year, table A07001.
Show data
| Goodlettsville | |
|---|---|
| Mexico | 48.6% , number 462 |
| El Salvador | 8.5% , number 81 |
| India | 7.5% , number 71 |
| England | 5.7% , number 54 |
| Indonesia | 4.5% , number 43 |
| Laos | 4.1% , number 39 |
Embed
All the numbers
| Indicator | Goodlettsville | Tennessee | US | Rank in Tennessee* | Table |
|---|---|---|---|---|---|
| Population | 17,597 ±42 | 7,066,383 | 334,922,499 | 35th | A00001 |
| People per square mile | 1,219 ±3 | 171 | 95 | 54th | A00002 |
| Land area (square miles) | 14 | – | – | – | A00002 |
| Median age | 38.5 ±3.1 | 38.9 ±0.1 | 38.9 ±0.1 | 188th | A01004 |
| Under 18 | 20.4% ±3.3% , number 3,588 ±578 | 22.2% ±0.1% , number 1,566,969 ±6,893 | 22.0% ±<0.1% , number 73,517,834 ±38,890 | 201st | B02002 |
| 65 and over | 17.8% ±3.1% , number 3,125 ±543 | 17.1% ±0.1% , number 1,205,947 ±6,964 | 17.2% ±<0.1% , number 57,633,628 ±50,010 | 171st | B02002 |
| Born outside the US | 5.4% ±2.2% , number 951 ±383 | 6.1% ±0.1% , number 431,545 ±6,949 | 14.1% ±<0.1% , number 47,349,078 ±143,600 | 52nd | A06001 |
| Speak a language other than English at home | 8.0% ±2.6% , number 1,319 ±512 | 8.6% ±0.1% , number 574,403 ±8,406 | 22.3% ±0.1% , number 70,375,509 ±162,500 | 62nd | C16001 |
| Veterans (adults) | 5.3% ±1.7% , number 748 ±244 | 7.3% ±0.1% , number 399,814 ±5,074 | 6.2% ±<0.1% , number 16,185,883 ±45,250 | 225th | A16002 |
| Living with a disability | 13.8% ±2.7% , number 2,404 ±470 | 14.9% ±0.1% , number 1,041,249 ±7,872 | 13.3% ±<0.1% , number 43,869,797 ±68,920 | 226th | B18101 |
| Women 15–50 who had a baby in the past year | 7.6% ±3.3% , number 362 ±158 | 5.2% ±0.2% , number 86,308 ±2,508 | 5.1% ±<0.1% , number 4,009,203 ±20,900 | 85th | B13002 |
| Lived in the same home a year ago | 86.9% ±3.9% , number 14,997 ±689 | 87.1% ±0.2% , number 6,082,385 ±12,760 | 87.7% ±0.1% , number 290,692,803 ±173,800 | 180th | A08001 |
| White, not Hispanic | 55.8% ±5.7% , number 9,811 ±995 | 71.0% ±0.1% , number 5,018,980 ±3,671 | 57.4% ±<0.1% , number 192,214,378 ±30,950 | 287th | A04001 |
| Hispanic or Latino | 9.0% ±3.3% , number 1,584 ±583 | 7.4% ±<0.1% , number 523,528 ±277 | 19.3% ±<0.1% , number 64,759,370 ±1,547 | 57th | A04001 |
| Black, not Hispanic | 25.5% ±3.2% , number 4,493 ±569 | 15.4% ±0.1% , number 1,090,494 ±4,152 | 11.9% ±<0.1% , number 39,896,127 ±46,710 | 16th | A04001 |
| Asian, not Hispanic | 1.4% ±0.9% , number 249 ±161 | 1.9% ±<0.1% , number 133,337 ±2,203 | 5.9% ±<0.1% , number 19,678,814 ±22,770 | 77th | A04001 |
*1 is the highest. Population is ranked among all places, and the rest among those of 1,000 people or more, whose figures can be ranked. Ranks use 5-year estimates, the only ones covering every city, so they can differ slightly from the figures here.
Income and work
Lower incomes than the US
The median household income is $70,758, about the same as Tennessee ($69,595) but lower than the US ($80,734). 9.7% of people live in poverty, and 7.0% have no health insurance, lower than Tennessee (10.0%) but about the same as the US (8.4%).
Household income
Source: ACS 2020–2024 5-year, table A14001.
Show data
| Goodlettsville | Tennessee | United States | |
|---|---|---|---|
| Under $25,000 | 17.0% ±5.5% , number 1,368 ±451 | 16.6% ±0.2% , number 469,660 ±6,183 | 14.6% ±<0.1% , number 18,908,588 ±41,540 |
| $25,000 to $49,999 | 15.2% ±4.2% , number 1,220 ±346 | 19.4% ±0.2% , number 549,302 ±6,643 | 16.7% ±<0.1% , number 21,624,902 ±39,130 |
| $50,000 to $74,999 | 20.6% ±5.0% , number 1,652 ±414 | 17.3% ±0.2% , number 488,287 ±5,766 | 15.5% ±<0.1% , number 20,031,683 ±36,850 |
| $75,000 to $99,999 | 12.8% ±3.3% , number 1,026 ±272 | 13.2% ±0.2% , number 371,698 ±4,562 | 12.6% ±<0.1% , number 16,319,799 ±42,700 |
| $100,000 to $149,999 | 16.9% ±3.7% , number 1,354 ±311 | 16.8% ±0.2% , number 475,457 ±5,620 | 17.5% ±<0.1% , number 22,670,921 ±58,280 |
| $150,000 to $199,999 | 9.3% ±2.3% , number 744 ±192 | 7.7% ±0.1% , number 216,988 ±3,778 | 9.6% ±<0.1% , number 12,405,370 ±57,560 |
| $200,000 or more | 8.3% ±2.5% , number 667 ±203 | 9.0% ±0.1% , number 252,885 ±3,814 | 13.4% ±0.1% , number 17,266,233 ±82,370 |
Embed
What residents do for work
Source: ACS 2020–2024 5-year, table A17004.
Show data
| Goodlettsville | Tennessee | United States | |
|---|---|---|---|
| Education and health care | 22.7% ±4.0% , number 2,065 ±391 | 22.4% ±0.2% , number 752,213 ±7,199 | 23.5% ±0.1% , number 37,913,663 ±133,200 |
| Retail trade | 15.6% ±4.1% , number 1,419 ±387 | 11.6% ±0.2% , number 388,493 ±5,772 | 10.8% ±<0.1% , number 17,456,908 ±41,100 |
| Professional and business services | 11.6% ±3.1% , number 1,055 ±290 | 10.7% ±0.2% , number 359,446 ±5,407 | 12.6% ±<0.1% , number 20,282,450 ±59,650 |
| Other services | 9.5% ±3.9% , number 869 ±356 | 4.8% ±0.1% , number 161,199 ±4,130 | 4.7% ±<0.1% , number 7,588,496 ±24,900 |
| Construction | 7.9% ±2.9% , number 722 ±266 | 7.1% ±0.2% , number 238,941 ±5,133 | 6.9% ±<0.1% , number 11,167,040 ±57,000 |
| Transportation and warehousing | 7.5% ±2.8% , number 684 ±263 | 7.2% ±0.1% , number 241,760 ±4,520 | 5.9% ±<0.1% , number 9,568,767 ±29,300 |
| Manufacturing | 7.0% ±2.9% , number 642 ±263 | 12.5% ±0.2% , number 420,933 ±5,543 | 9.9% ±<0.1% , number 15,940,000 ±38,890 |
| Arts, food and lodging | 5.1% ±1.9% , number 469 ±173 | 8.9% ±0.2% , number 299,914 ±5,624 | 8.7% ±<0.1% , number 13,952,453 ±52,980 |
Embed
Where workers come from and go
Goodlettsville has 13,151 jobs and 9,148 employed residents. 12,445 people commute in to work and 8,442 commute out, while 706 both live and work here. The most commuters come from Nashville-Davidson metropolitan government (balance).
Most commuters come from
- Nashville-Davidson metropolitan government (balance): 3,903
- Hendersonville city: 1,084
- Gallatin city: 497
Most residents commute to
- Nashville-Davidson metropolitan government (balance): 4,690
- Hendersonville city: 529
- Berry Hill city: 486
Show data
| Goodlettsville | |
|---|---|
| Live and work here | 706 |
| Work here, live elsewhere | 12,445 |
| Live here, work elsewhere | 8,442 |
Embed
All the numbers
| Indicator | Goodlettsville | Tennessee | US | Rank in Tennessee* | Table |
|---|---|---|---|---|---|
| Median household income | $70,758 ±$8,023 | $69,595 ±$429 | $80,734 ±$166 | 94th | A14006 |
| Income per person | $42,275 ±$3,947 | $39,437 ±$230 | $44,673 ±$122 | 55th | A14024 |
| Income inequality (Gini index) | 0.448 ±0.038 | 0.476 ±0.003 | 0.483 | 115th | A14028 |
| Living in poverty | 9.7% ±3.8% , number 1,697 ±660 | 13.8% ±0.2% , number 950,340 ±15,730 | 12.5% ±0.1% , number 40,735,661 ±275,900 | 211th | A13004 |
| Unemployment rate | 6.1% ±2.1% , number 591 ±204 | 4.7% ±0.1% , number 164,955 ±4,178 | 5.2% ±<0.1% , number 8,902,365 ±38,980 | 97th | A17005 |
| No health insurance | 7.0% ±2.3% , number 1,227 ±397 | 10.0% ±0.1% , number 699,452 ±9,602 | 8.4% ±<0.1% , number 27,734,911 ±158,900 | 204th | A20001 |
*1 is the highest. Population is ranked among all places, and the rest among those of 1,000 people or more, whose figures can be ranked. Ranks use 5-year estimates, the only ones covering every city, so they can differ slightly from the figures here.
Education
College degrees close to the US
33.1% of adults 25 and over have a bachelor’s degree or more, about the same as both Tennessee (31.1%) and the US (35.7%).
Highest level of education
Source: ACS 2020–2024 5-year, table A12001.
Show data
| Goodlettsville | Tennessee | United States | |
|---|---|---|---|
| Less than high school | 8.1% ±2.5% , number 1,024 ±318 | 10.0% ±0.1% , number 484,711 ±6,768 | 10.4% ±<0.1% , number 23,992,410 ±82,490 |
| High school only | 30.5% ±5.2% , number 3,859 ±695 | 31.2% ±0.2% , number 1,520,002 ±11,240 | 26.0% ±0.1% , number 60,094,716 ±262,500 |
| Some college | 28.3% ±4.2% , number 3,579 ±569 | 27.8% ±0.2% , number 1,353,016 ±10,950 | 27.9% ±0.1% , number 64,356,961 ±143,900 |
| Bachelor’s degree | 19.4% ±3.5% , number 2,458 ±461 | 19.4% ±0.2% , number 942,539 ±9,432 | 21.6% ±0.1% , number 49,868,171 ±191,400 |
| Graduate degree | 13.6% ±2.7% , number 1,723 ±354 | 11.7% ±0.1% , number 570,062 ±6,479 | 14.1% ±0.1% , number 32,495,045 ±159,600 |
Embed
All the numbers
| Indicator | Goodlettsville | Tennessee | US | Rank in Tennessee* | Table |
|---|---|---|---|---|---|
| Bachelor’s degree or more | 33.1% ±4.2% , number 4,181 ±581 | 31.1% ±0.2% , number 1,512,601 ±11,440 | 35.7% ±0.1% , number 82,363,216 ±249,200 | 62nd | A12001 |
| High school graduate or more | 91.9% ±6.8% , number 11,619 ±1,070 | 90.0% ±0.4% , number 4,385,619 ±19,420 | 89.6% ±0.2% , number 206,814,893 ±389,500 | 92nd | A12001 |
*1 is the highest. Population is ranked among all places, and the rest among those of 1,000 people or more, whose figures can be ranked. Ranks use 5-year estimates, the only ones covering every city, so they can differ slightly from the figures here.
Housing
Home values outran incomes
39.5% of households rent, higher than Tennessee (33.1%) but not statistically different from the US (34.8%). The median home is worth $381,900 and the median rent is $1,385. After inflation, home values rose 58% from 2010–2014 to 2020–2024, while household income rose 1%.
Housing costs and income, 2010–2014 to 2020–2024, after inflation
Source: ACS 5-year, table A10036, A18009, A14006.
Show data
| Goodlettsville | Tennessee | United States | |
|---|---|---|---|
| Median home value | +58.5% | +54.3% | +42.6% |
| Median rent | +17.1% | +18.3% | +15.6% |
| Median household income | +1.2% | +17.5% | +13.7% |
Embed
Types of homes
Source: ACS 2020–2024 5-year, table A10032.
Show data
| Goodlettsville | Tennessee | United States | |
|---|---|---|---|
| Single-family, detached | 55.0% ±5.0% , number 4,634 ±511 | 68.3% ±0.2% , number 2,145,674 ±6,460 | 61.3% ±0.1% , number 88,075,458 ±149,800 |
| Single-family, attached | 10.2% ±3.5% , number 860 ±299 | 3.8% ±0.1% , number 120,244 ±2,813 | 6.2% ±<0.1% , number 8,955,086 ±33,580 |
| 2 to 4 units | 5.5% ±2.2% , number 459 ±184 | 5.6% ±0.1% , number 174,657 ±4,397 | 7.7% ±<0.1% , number 11,031,346 ±42,810 |
| 5 to 19 units | 17.1% ±4.5% , number 1,443 ±391 | 8.1% ±0.1% , number 254,055 ±4,499 | 8.8% ±<0.1% , number 12,625,154 ±51,990 |
| 20 or more units | 9.4% ±3.6% , number 789 ±305 | 6.0% ±0.1% , number 188,684 ±3,624 | 10.3% ±<0.1% , number 14,859,547 ±31,000 |
| Mobile homes and other | 2.8% ±1.8% , number 236 ±154 | 8.3% ±0.1% , number 260,356 ±3,763 | 5.7% ±<0.1% , number 8,228,764 ±48,580 |
Embed
When homes were built
Source: ACS 2020–2024 5-year, table A10055.
Show data
| Goodlettsville | Tennessee | United States | |
|---|---|---|---|
| 2010 or later | 13.7% ±4.1% , number 1,099 ±339 | 15.2% ±0.2% , number 428,681 ±5,487 | 11.6% ±<0.1% , number 14,996,534 ±51,640 |
| 2000 to 2009 | 20.2% ±4.2% , number 1,625 ±357 | 16.0% ±0.2% , number 453,218 ±6,760 | 13.8% ±<0.1% , number 17,865,859 ±70,250 |
| 1980 to 1999 | 30.6% ±5.9% , number 2,460 ±503 | 28.8% ±0.3% , number 813,656 ±7,348 | 25.3% ±<0.1% , number 32,758,140 ±75,080 |
| 1960 to 1979 | 26.0% ±5.1% , number 2,086 ±433 | 23.2% ±0.2% , number 654,167 ±6,570 | 23.9% ±<0.1% , number 30,938,809 ±78,560 |
| Before 1960 | 9.5% ±2.8% , number 761 ±230 | 16.8% ±0.2% , number 474,555 ±5,839 | 25.3% ±<0.1% , number 32,668,154 ±83,060 |
Embed
All the numbers
| Indicator | Goodlettsville | Tennessee | US | Rank in Tennessee* | Table |
|---|---|---|---|---|---|
| Housing units | 8,421 ±529 | – | – | – | A10001 |
| Households | 8,031 ±529 | – | – | – | A10008 |
| People per household | 2.18 ±0.14 | 2.45 ±0.01 | 2.53 ±0.01 | 266th | A10003 |
| Households that rent | 39.5% ±5.2% , number 3,171 ±469 | 33.1% ±0.3% , number 933,708 ±7,883 | 34.8% ±0.1% , number 45,017,354 ±163,600 | 101st | A10060 |
| Vacant homes | 4.6% ±2.5% , number 390 ±211 | 10.2% ±0.2% , number 319,393 ±6,990 | 10.1% ±0.1% , number 14,547,859 ±200,400 | 248th | A10047, A10060 |
| Median gross rent | $1,385 ±$53 | $1,189 ±$7 | $1,413 ±$2 | 40th | A18009 |
| Median home value | $381,900 ±$18,770 | $286,700 ±$1,492 | $332,700 ±$236 | 40th | A10036 |
| Renters paying 30% or more of income | 52.0% ±11.0% , number 1,650 ±425 | 44.3% ±0.6% , number 413,964 ±6,248 | 47.6% ±0.2% , number 21,422,415 ±63,960 | 30th | A18002 |
| Owners paying 30% or more of income | 24.7% ±6.4% , number 1,200 ±344 | 18.4% ±0.3% , number 348,004 ±5,244 | 22.5% ±0.1% , number 18,961,895 ±39,930 | 41st | A10040 |
| Homes built before 1960 | 9.5% ±2.8% , number 761 ±230 | 16.8% ±0.2% , number 474,555 ±5,839 | 25.3% ±<0.1% , number 32,668,154 ±83,060 | 230th | A10055 |
*1 is the highest. Population is ranked among all places, and the rest among those of 1,000 people or more, whose figures can be ranked. Ranks use 5-year estimates, the only ones covering every city, so they can differ slightly from the figures here.
Getting around
A driving city
70.8% of workers drive alone and 18.5% work from home. 44.7% of those who travel to work spend 30 minutes or more getting there, and 4.3% of households have no vehicle.
How people get to work
Source: ACS 2020–2024 5-year, table A09005.
Show data
| Goodlettsville | Tennessee | United States | |
|---|---|---|---|
| Drive alone | 70.8% ±3.3% , number 6,408 ±507 | 75.8% ±0.1% , number 2,512,992 ±9,035 | 68.8% ±0.1% , number 109,447,738 ±95,800 |
| Carpool | 7.8% ±3.2% , number 709 ±291 | 8.4% ±0.2% , number 278,809 ±5,177 | 8.5% ±<0.1% , number 13,569,614 ±52,500 |
| Public transit | 0.0% ±0.3% , number 4 ±23 | 0.5% ±<0.1% , number 17,813 ±1,376 | 3.5% ±<0.1% , number 5,573,279 ±22,170 |
| Walk | 0.7% ±0.6% , number 62 ±57 | 1.2% ±<0.1% , number 39,883 ±1,659 | 2.4% ±<0.1% , number 3,772,609 ±17,080 |
| Work from home | 18.5% ±4.3% , number 1,674 ±400 | 12.9% ±0.2% , number 426,680 ±6,123 | 15.1% ±<0.1% , number 24,042,489 ±82,860 |
| Other | 2.2% ±2.1% , number 198 ±194 | 1.2% ±0.1% , number 38,132 ±1,861 | 1.7% ±<0.1% , number 2,708,365 ±17,940 |
Embed
Time spent getting to work
Source: ACS 2020–2024 5-year, table B09001.
Show data
| Goodlettsville | Tennessee | United States | |
|---|---|---|---|
| Under 10 minutes | 13.2% ±4.0% , number 971 ±304 | 12.0% ±0.2% , number 345,457 ±5,633 | 12.7% ±<0.1% , number 17,153,542 ±40,730 |
| 10 to 19 minutes | 21.3% ±4.4% , number 1,571 ±349 | 28.9% ±0.3% , number 833,865 ±8,436 | 28.7% ±<0.1% , number 38,741,521 ±54,980 |
| 20 to 29 minutes | 20.9% ±5.0% , number 1,541 ±391 | 22.6% ±0.3% , number 652,292 ±8,772 | 21.3% ±<0.1% , number 28,723,420 ±52,330 |
| 30 to 39 minutes | 20.3% ±4.5% , number 1,502 ±354 | 17.7% ±0.2% , number 511,447 ±6,966 | 16.9% ±<0.1% , number 22,853,044 ±46,230 |
| 40 to 59 minutes | 19.1% ±5.7% , number 1,410 ±438 | 11.8% ±0.2% , number 339,400 ±5,168 | 11.9% ±<0.1% , number 16,024,037 ±44,090 |
| 60 minutes or more | 5.2% ±2.9% , number 386 ±218 | 7.1% ±0.2% , number 205,168 ±4,744 | 8.6% ±<0.1% , number 11,576,041 ±36,550 |
Embed
Vehicles per household
Source: ACS 2020–2024 5-year, table A10030.
Show data
| Goodlettsville | Tennessee | United States | |
|---|---|---|---|
| None | 4.3% ±2.5% , number 347 ±203 | 5.2% ±0.1% , number 147,219 ±3,419 | 8.4% ±<0.1% , number 10,793,323 ±36,450 |
| One | 30.7% ±5.4% , number 2,463 ±462 | 30.9% ±0.3% , number 873,114 ±8,060 | 33.1% ±0.1% , number 42,801,892 ±122,600 |
| Two | 40.5% ±6.1% , number 3,249 ±531 | 38.0% ±0.3% , number 1,072,153 ±8,986 | 36.6% ±0.1% , number 47,334,152 ±191,100 |
| Three or more | 24.6% ±4.9% , number 1,972 ±412 | 25.9% ±0.2% , number 731,791 ±6,641 | 21.9% ±0.1% , number 28,298,129 ±85,940 |
Embed
All the numbers
| Indicator | Goodlettsville | Tennessee | US | Rank in Tennessee* | Table |
|---|---|---|---|---|---|
| Drive to work alone | 70.8% ±3.3% , number 6,408 ±507 | 75.8% ±0.1% , number 2,512,992 ±9,035 | 68.8% ±0.1% , number 109,447,738 ±95,800 | 262nd | A09005 |
| Take public transit | 0.0%† (too uncertain to lean on) ±0.3% , number 4 ±23 | 0.5% ±<0.1% , number 17,813 ±1,376 | 3.5% ±<0.1% , number 5,573,279 ±22,170 | 69th | A09005 |
| Work from home | 18.5% ±4.3% , number 1,674 ±400 | 12.9% ±0.2% , number 426,680 ±6,123 | 15.1% ±<0.1% , number 24,042,489 ±82,860 | 38th | A09005 |
| Commute 30 minutes or more | 44.7% ±7.4% , number 3,298 ±604 | 36.6% ±0.3% , number 1,056,015 ±9,886 | 37.4% ±<0.1% , number 50,453,122 ±73,600 | 100th | B09001 |
| Households with no vehicle | 4.3% ±2.5% , number 347 ±205 | 5.2% ±0.1% , number 147,219 ±3,110 | 8.4% ±<0.1% , number 10,793,323 ±27,220 | 160th | A10030 |
*1 is the highest. Population is ranked among all places, and the rest among those of 1,000 people or more, whose figures can be ranked. Ranks use 5-year estimates, the only ones covering every city, so they can differ slightly from the figures here.
Places
In and around Goodlettsville
Population, from the latest estimates available. Figures cover the whole of each place.
Places nearby
- Nashville-Davidson: 721,085
- Hendersonville: 63,091
- Gallatin: 48,532
- Brentwood: 45,556
- Lebanon: 44,788
- Mount Juliet: 42,073
- La Vergne: 40,243
- Springfield: 19,255
Its counties
- Davidson County: 745,904
- Sumner County: 215,538
Places like this one
- Spokane, Washington: 230,293
- Davenport, Iowa: 100,913
- Jasper, Indiana: 15,991
- Somersworth, New Hampshire: 12,111
Places at least a third this size, with the closest income, education, age, housing and origins.
Turn Goodlettsville into your planning report.
Social Explorer Studio builds an editable profile of any place, with tables and charts beside the county and state, and exports to Word, PDF and Excel.
Questions about Goodlettsville
What is the population of Goodlettsville, Tennessee?
17,597 people (±42), according to the ACS 2020–2024 5-year estimates. That’s the 35th largest of 502 places in Tennessee.
What is the FIPS code for Goodlettsville, Tennessee?
4729920. The first two digits, 47, are Tennessee’s state code, and the last five, 29920, identify Goodlettsville within it. The Census Bureau’s full geographic identifier (GEOID) is 1600000US4729920.
What county is Goodlettsville in?
Most of Goodlettsville is in Davidson County, and it reaches into Sumner County.
What is the median household income in Goodlettsville?
$70,758 (±$8,023), according to the ACS 2020–2024 5-year estimates, about the same as Tennessee ($69,595) but lower than the US ($80,734).
What is the median age in Goodlettsville?
38.5 years (±3.1), according to the ACS 2020–2024 5-year estimates, about the same as both Tennessee (38.9) and the US (38.9).
How much does housing cost in Goodlettsville?
Goodlettsville’s median home value is $381,900 (±$18,770) and its median gross rent is $1,385 (±$53) a month, according to the ACS 2020–2024 5-year estimates. 52.0% (±11.0%) of its renters pay 30% or more of their income on rent.
Is Goodlettsville growing?
Goodlettsville’s population grew 6.9%, from 16,466 in 2010–2014 to 17,597 in 2020–2024, according to the ACS 5-year estimates.
Where do people who work in Goodlettsville live?
706 of its 13,151 jobs are held by people who live here. Of those who commute in, the most come from Nashville-Davidson metropolitan government (balance), Hendersonville city, Gallatin city.
Where does this census data come from?
The U.S. Census Bureau’s American Community Survey, through Social Explorer’s tables: the latest 1-year estimates where they exist, for the most recent numbers, and 5-year estimates otherwise. Each table lists its code, so you can find it again.
Is this data free to use?
Yes. You can read it, cite it, download the CSV and embed the charts, with no account. To map other variables, compare your own areas or build a report, see Social Explorer’s plans in a live demo.
Sources and how to cite
American Community Survey 2020–2024 5-year estimates, U.S. Census Bureau, from Social Explorer’s tables A00001, A00002, A01004, A04001, A06001, A08001, A09005, A10001, A10003, A10008, A10030, A10036, A10040, A10047, A10055, A10060, A12001, A13004, A14006, A14024, A14028, A16002, A17005, A18002, A18009, A20001, B02002, B09001, B13002, B18101, C16001. Maps by census tract use 2020–2024 5-year estimates, since the 1-year survey doesn’t cover tracts. Commuting: LEHD LODES 2023. These are estimates from a sample, each with its margin of error. Data retrieved November 14, 2026. How these profiles are made.
U.S. Census Bureau, American Community Survey 2020–2024 5-year estimates, via Social Explorer. “Goodlettsville, Tennessee.” https://www.socialexplorer.com/places/tennessee/goodlettsville-city. Accessed November 14, 2026.