

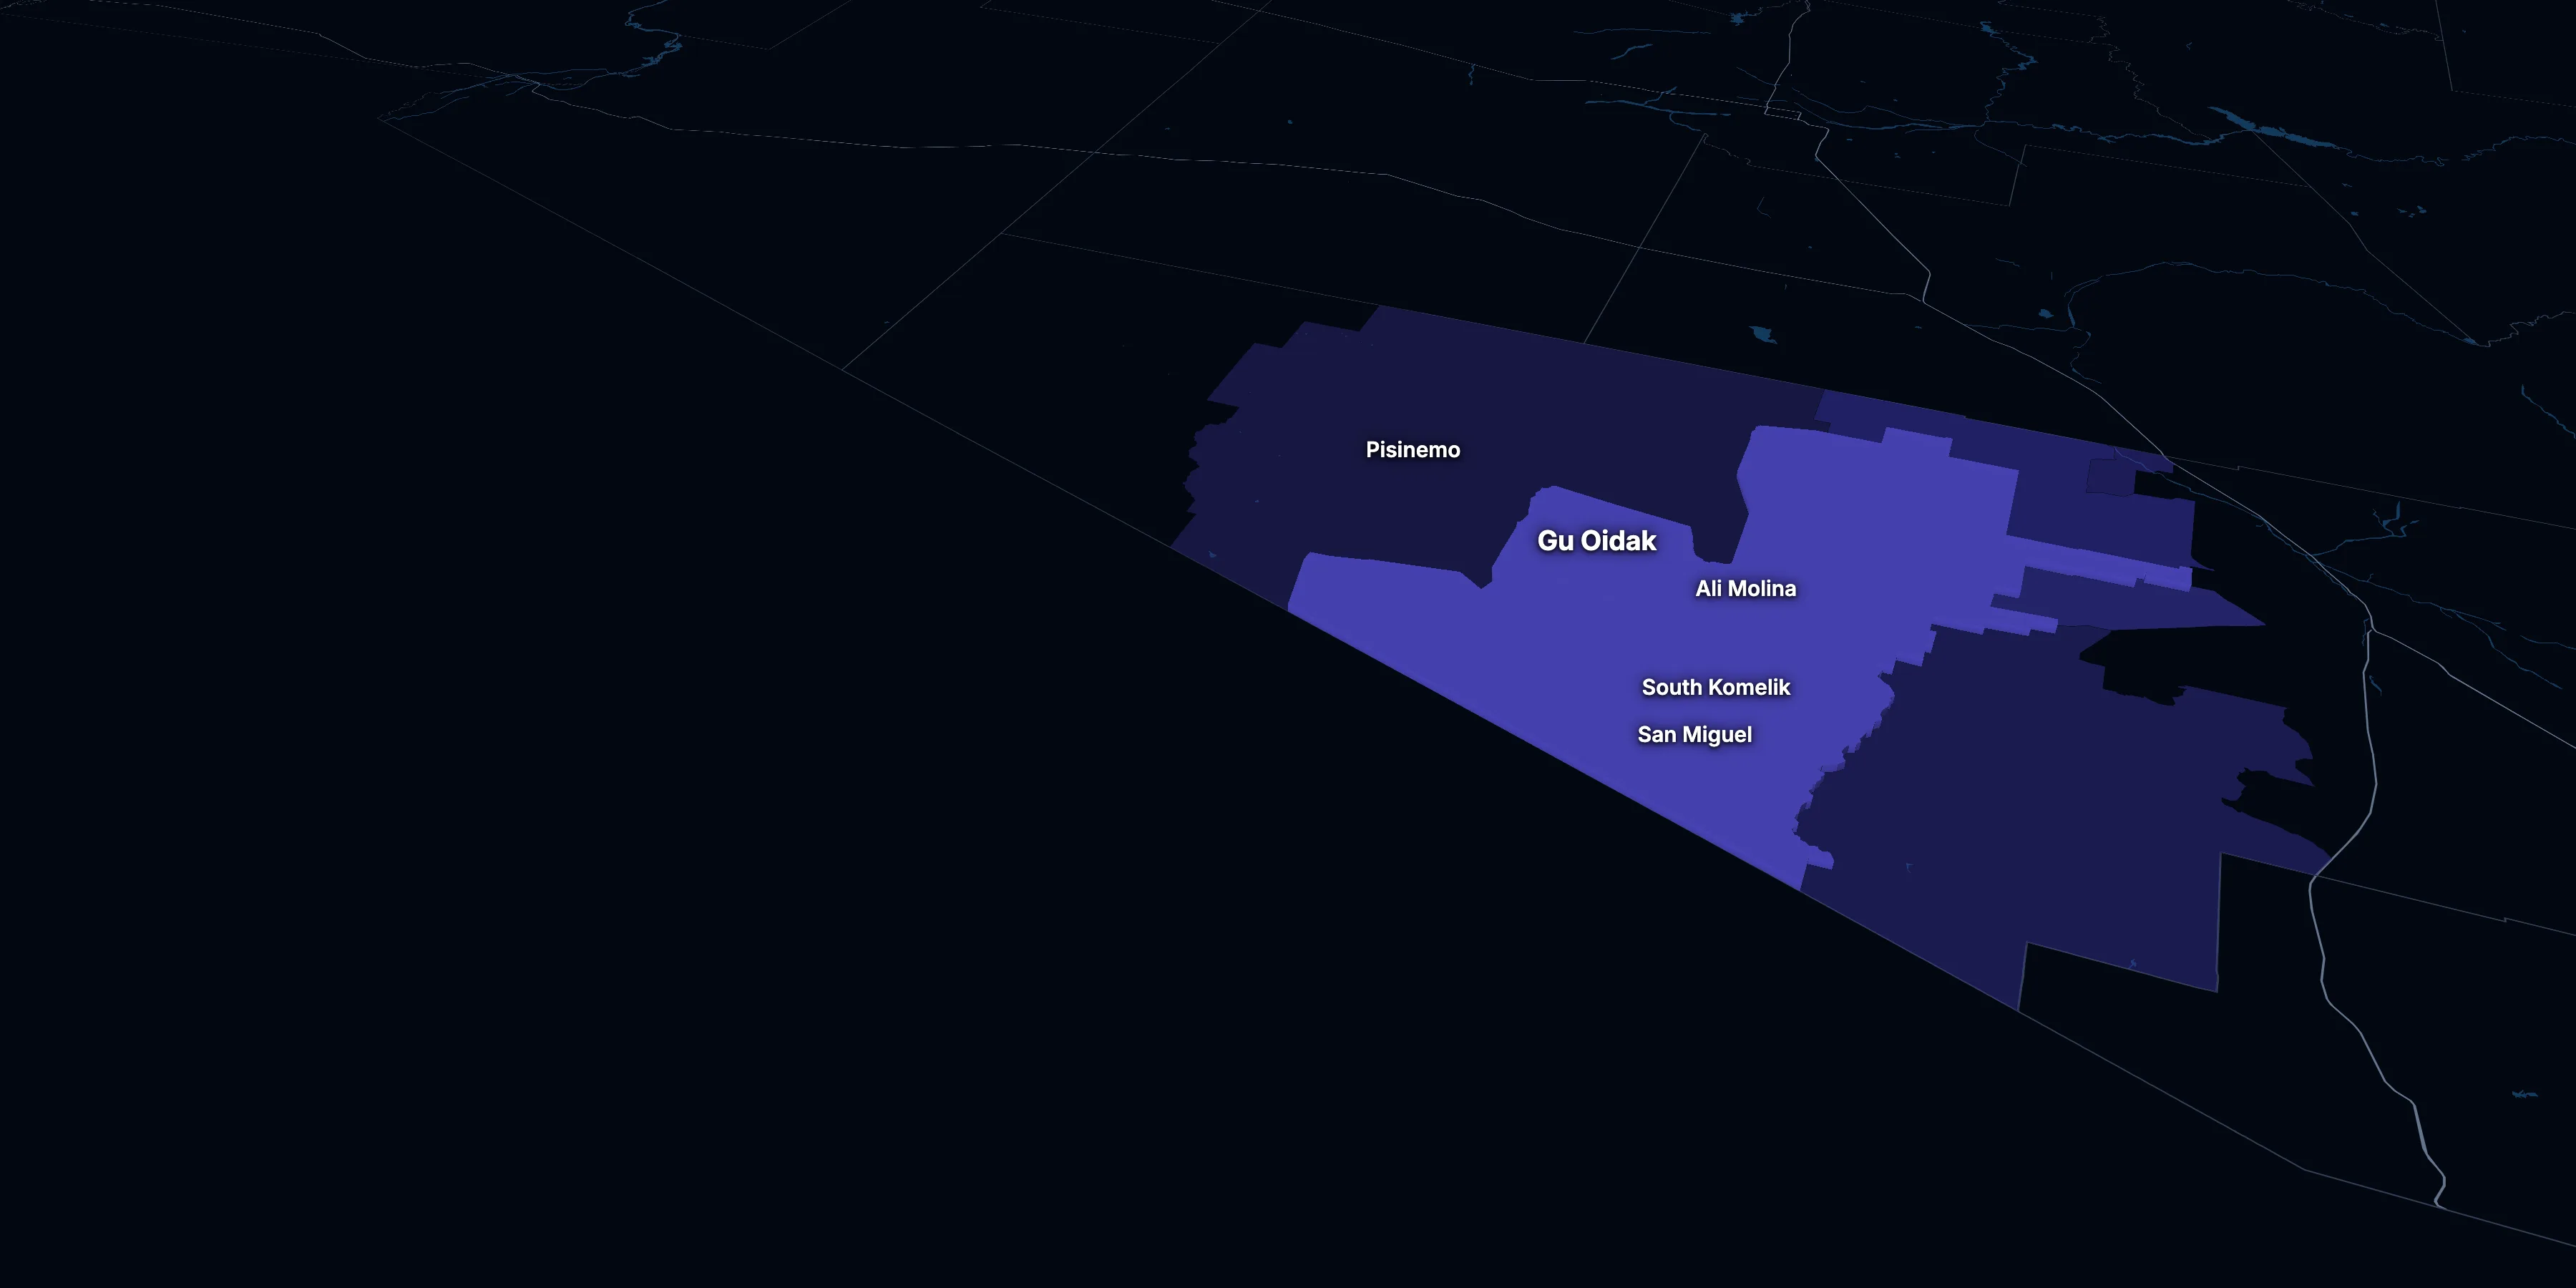
Gu Oidak, Arizona · population, demographics and census data
Home to 192 people, the 356th largest of Arizona’s 441 places.
- Population
- 192 ±154. Rank 356 of 441 in Arizona
- Median age
- 49–59. Likely range
ACS 2020–2024 5-year estimates, U.S. Census Bureau
About Gu Oidak
Gu Oidak is in Pima County.
In a place of 192 residents, the American Community Survey interviews a few dozen households at most, so its figures are rough. This page gives each as the range it likely falls in and compares none of them with Arizona or the nation. It shows no highlights, rankings or change over time. Even a range can miss, and † marks a figure too uncertain to lean on.
± is each figure’s margin of error, at 90% confidence, and † marks one too uncertain to lean on. Under each percentage in the tables is the number it counts. How the margins are worked out.
FIPS code 0430550
Over time
How Gu Oidak has changed
In a place of 192 residents, the survey interviews too few households to measure change over time, so this page doesn’t show it.
1 census tract
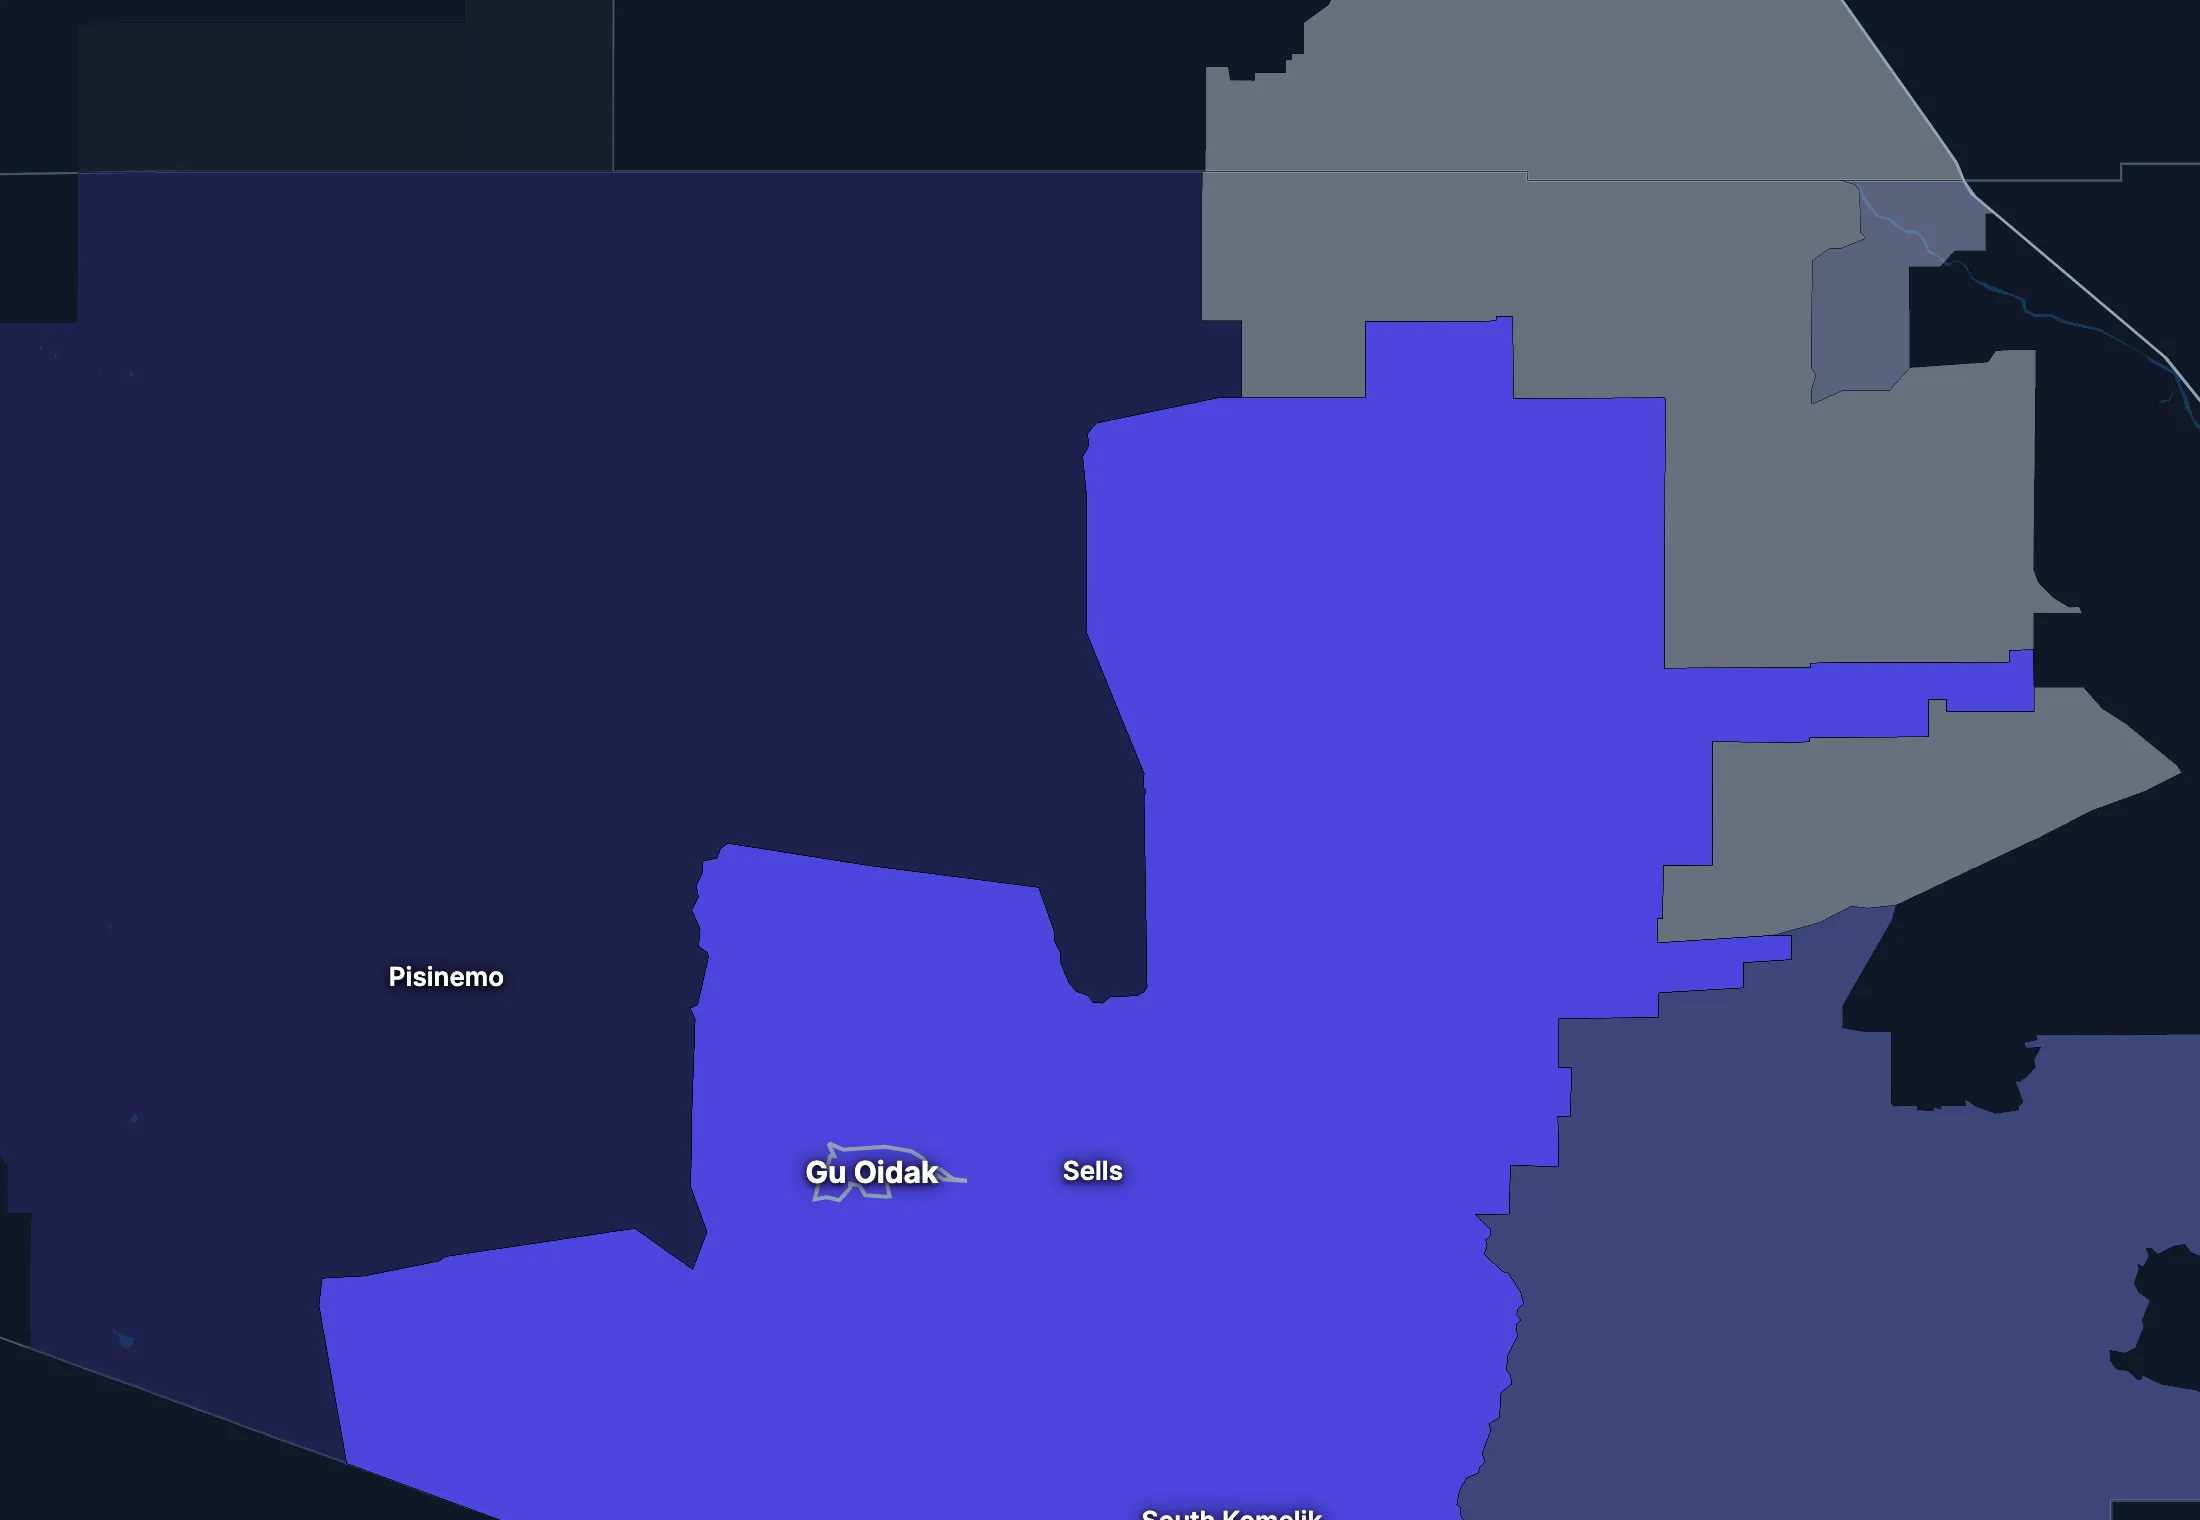
Gu Oidak on the map
Gu Oidak is smaller than a census tract, the smallest area these figures reach, so the map shows the tract it sits in, with the land around it.
People
Who lives in Gu Oidak
Its median age is likely between 49 and 59.
For figures from many more households, see Pima County.
Age
Source: ACS 2020–2024 5-year, table A01001.
Show data
| Gu Oidak | Arizona | United States | |
|---|---|---|---|
| Under 18 | 9.4% ±23.3% , number 18 ±47 | 21.6% ±0.1% , number 1,594,376 ±6,311 | 22.0% ±<0.1% , number 73,517,834 ±38,890 |
| 18 to 24 | 5.7% ±20.9% , number 11 ±41 | 9.4% ±0.1% , number 695,787 ±4,928 | 9.1% ±<0.1% , number 30,597,362 ±37,780 |
| 25 to 34 | 7.8% ±15.1% , number 15 ±31 | 13.8% ±<0.1% , number 1,018,722 ±810 | 13.7% ±<0.1% , number 45,806,540 ±10,200 |
| 35 to 44 | 18.8% ±15.0% , number 36 ±41 | 12.7% ±0.1% , number 933,789 ±6,431 | 13.2% ±<0.1% , number 44,237,292 ±43,510 |
| 45 to 54 | 12.0% ±14.5% , number 23 ±33 | 11.6% ±<0.1% , number 855,798 ±667 | 12.2% ±<0.1% , number 40,743,799 ±8,564 |
| 55 to 64 | 34.4% ±36.2% , number 66 ±45 | 12.0% ±0.1% , number 882,815 ±5,927 | 12.7% ±<0.1% , number 42,386,044 ±41,500 |
| 65 to 74 | 12.0% ±17.5% , number 23 ±38 | 10.8% ±0.1% , number 797,335 ±5,725 | 10.2% ±<0.1% , number 34,092,907 ±38,800 |
| 75 and over | 0.0% ±17.9% , number 0 ±34 | 8.1% ±0.1% , number 600,216 ±5,020 | 7.0% ±<0.1% , number 23,540,721 ±31,560 |
Embed
Race and ethnicity
Source: ACS 2020–2024 5-year, table A04001.
Show data
| Gu Oidak | Arizona | United States | |
|---|---|---|---|
| White, not Hispanic | 0.0% ±7.3% , number 0 ±14 | 52.6% ±<0.1% , number 3,879,594 ±3,371 | 57.4% ±<0.1% , number 192,214,378 ±30,950 |
| Hispanic or Latino | 0.0% ±7.3% , number 0 ±14 | 31.4% , number 2,313,806 | 19.3% ±<0.1% , number 64,759,370 ±1,547 |
| Black, not Hispanic | 0.0% ±7.3% , number 0 ±14 | 4.4% ±0.1% , number 322,321 ±4,034 | 11.9% ±<0.1% , number 39,896,127 ±46,710 |
| Asian, not Hispanic | 0.0% ±7.3% , number 0 ±14 | 3.5% ±<0.1% , number 256,161 ±3,027 | 5.9% ±<0.1% , number 19,678,814 ±22,770 |
| Other or multiracial | 100.0% ±12.6% , number 192 ±156 | 8.2% ±0.1% , number 606,956 ±6,968 | 5.5% ±<0.1% , number 18,373,810 ±69,180 |
Embed
Language spoken at home
Source: ACS 2020–2024 5-year, table C16001.
Show data
| Gu Oidak | Arizona | United States | |
|---|---|---|---|
| English only | 43.2% ±33.8% , number 83 ±93 | 74.3% ±0.2% , number 5,184,054 ±11,540 | 77.7% ±0.1% , number 245,767,039 ±221,000 |
| Spanish | 0.0% ±7.3% , number 0 ±14 | 19.3% ±0.1% , number 1,344,168 ±10,030 | 13.6% ±<0.1% , number 42,869,908 ±143,800 |
| Other Indo-European | 0.0% ±14.6% , number 0 ±28 | 2.0% ±0.1% , number 141,643 ±4,425 | 3.9% ±<0.1% , number 12,249,474 ±54,760 |
| Asian and Pacific Island | 0.0% ±16.3% , number 0 ±31 | 2.2% ±0.1% , number 150,911 ±4,801 | 3.6% ±<0.1% , number 11,320,253 ±40,030 |
| Arabic and other | 56.8% ±49.2% , number 109 ±129 | 2.3% ±0.1% , number 160,544 ±4,349 | 1.2% ±<0.1% , number 3,935,874 ±33,550 |
Embed
Marital status
Source: ACS 2020–2024 5-year, table A11001.
Show data
| Gu Oidak | Arizona | United States | |
|---|---|---|---|
| Now married | 11.5% ±14.7% , number 20 ±30 | 47.4% ±0.2% , number 2,881,611 ±11,290 | 47.8% ±0.1% , number 131,199,078 ±272,700 |
| Never married | 48.9% ±55.2% , number 85 ±68 | 34.1% ±0.2% , number 2,073,291 ±9,591 | 34.4% ±0.1% , number 94,480,845 ±211,900 |
| Divorced | 20.1% ±9.0% , number 35 ±32 | 11.6% ±0.1% , number 706,623 ±6,373 | 10.6% ±<0.1% , number 29,074,059 ±73,390 |
| Widowed | 19.5% ±11.6% , number 34 ±34 | 5.4% ±0.1% , number 328,935 ±4,213 | 5.6% ±<0.1% , number 15,250,943 ±26,710 |
| Separated | 0.0% ±11.4% , number 0 ±20 | 1.4% ±<0.1% , number 86,130 ±2,847 | 1.7% ±<0.1% , number 4,592,038 ±29,170 |
Embed
Where people lived a year ago
Source: ACS 2020–2024 5-year, table A08001.
Show data
| Gu Oidak | Arizona | United States | |
|---|---|---|---|
| Same home | 91.7% ±17.3% , number 176 ±145 | 85.7% ±0.2% , number 6,263,901 ±13,680 | 87.7% ±0.1% , number 290,692,803 ±173,800 |
| Same county | 0.0% ±7.3% , number 0 ±14 | 8.5% ±0.1% , number 618,943 ±9,971 | 6.3% ±<0.1% , number 20,792,831 ±117,600 |
| Another county in the state | 0.0% ±7.3% , number 0 ±14 | 1.6% ±0.1% , number 119,847 ±4,307 | 3.1% ±<0.1% , number 10,316,864 ±51,200 |
| Another state | 8.3% ±8.0% , number 16 ±20 | 3.5% ±0.1% , number 257,199 ±6,136 | 2.3% ±<0.1% , number 7,577,400 ±40,570 |
| Another country | 0.0% ±7.3% , number 0 ±14 | 0.7% ±<0.1% , number 48,538 ±3,136 | 0.6% ±<0.1% , number 2,060,087 ±23,560 |
Embed
All the numbers
| Indicator | Gu Oidak | Arizona | US | Table |
|---|---|---|---|---|
| Population | 192† (too uncertain to lean on) ±154 | 7,378,838 | 334,922,499 | A00001 |
| People per square mile | 27† (too uncertain to lean on) ±22 | 65 | 95 | A00002 |
| Land area (square miles) | 7 | – | – | A00002 |
| Median age | 54.4 ±4.9 | 39.0 ±0.1 | 38.9 ±0.1 | A01004 |
| Under 18 | 9.4%† (too uncertain to lean on) ±23.3% , number 18 ±47 | 21.6% ±0.1% , number 1,594,376 ±6,311 | 22.0% ±<0.1% , number 73,517,834 ±38,890 | B02002 |
| 65 and over | 12.0%† (too uncertain to lean on) ±25.0% , number 23 ±51 | 18.9% ±0.1% , number 1,397,551 ±7,614 | 17.2% ±<0.1% , number 57,633,628 ±50,010 | B02002 |
| Born outside the US | 0.0%† (too uncertain to lean on) ±7.3% , number 0 ±14 | 13.0% ±0.1% , number 957,784 ±9,229 | 14.1% ±<0.1% , number 47,349,078 ±143,600 | A06001 |
| Speak a language other than English at home | 56.8% ±33.8% , number 109 ±136 | 25.7% ±0.2% , number 1,797,266 ±12,730 | 22.3% ±0.1% , number 70,375,509 ±162,500 | C16001 |
| Veterans (adults) | 0.0%† (too uncertain to lean on) ±8.0% , number 0 ±14 | 7.9% ±0.1% , number 452,729 ±5,969 | 6.2% ±<0.1% , number 16,185,883 ±45,250 | A16002 |
| Living with a disability | 16.1%† (too uncertain to lean on) ±24.3% , number 31 ±53 | 13.8% ±0.1% , number 1,001,900 ±7,728 | 13.3% ±<0.1% , number 43,869,797 ±68,920 | B18101 |
| Women 15–50 who had a baby in the past year | 0.0%† (too uncertain to lean on) ±63.6% , number 0 ±14 | 5.1% ±0.2% , number 86,027 ±2,866 | 5.1% ±<0.1% , number 4,009,203 ±20,900 | B13002 |
| Lived in the same home a year ago | 91.7% ±17.3% , number 176 ±145 | 85.7% ±0.2% , number 6,263,901 ±13,680 | 87.7% ±0.1% , number 290,692,803 ±173,800 | A08001 |
| White, not Hispanic | 0.0%† (too uncertain to lean on) ±7.3% , number 0 ±14 | 52.6% ±<0.1% , number 3,879,594 ±3,371 | 57.4% ±<0.1% , number 192,214,378 ±30,950 | A04001 |
| Hispanic or Latino | 0.0%† (too uncertain to lean on) ±7.3% , number 0 ±14 | 31.4% , number 2,313,806 | 19.3% ±<0.1% , number 64,759,370 ±1,547 | A04001 |
| Black, not Hispanic | 0.0%† (too uncertain to lean on) ±7.3% , number 0 ±14 | 4.4% ±0.1% , number 322,321 ±4,034 | 11.9% ±<0.1% , number 39,896,127 ±46,710 | A04001 |
| Asian, not Hispanic | 0.0%† (too uncertain to lean on) ±7.3% , number 0 ±14 | 3.5% ±<0.1% , number 256,161 ±3,027 | 5.9% ±<0.1% , number 19,678,814 ±22,770 | A04001 |
Income and work
Income and work
Too few households are surveyed here to estimate these figures closely. The table gives each with its margin of error.
For figures from many more households, see Pima County.
Household income
Source: ACS 2020–2024 5-year, table A14001.
Show data
| Gu Oidak | Arizona | United States | |
|---|---|---|---|
| Under $25,000 | 51.5% ±43.7% , number 34 ±37 | 13.5% ±0.2% , number 384,330 ±5,159 | 14.6% ±<0.1% , number 18,908,588 ±41,540 |
| $25,000 to $49,999 | 0.0% ±47.4% , number 0 ±31 | 17.1% ±0.2% , number 488,306 ±6,264 | 16.7% ±<0.1% , number 21,624,902 ±39,130 |
| $50,000 to $74,999 | 19.7% ±34.4% , number 13 ±24 | 16.5% ±0.2% , number 472,147 ±6,207 | 15.5% ±<0.1% , number 20,031,683 ±36,850 |
| $75,000 to $99,999 | 0.0% ±21.2% , number 0 ±14 | 13.5% ±0.2% , number 385,994 ±5,916 | 12.6% ±<0.1% , number 16,319,799 ±42,700 |
| $100,000 to $149,999 | 0.0% ±30.0% , number 0 ±20 | 18.4% ±0.2% , number 525,479 ±6,312 | 17.5% ±<0.1% , number 22,670,921 ±58,280 |
| $150,000 to $199,999 | 0.0% ±21.2% , number 0 ±14 | 9.4% ±0.1% , number 269,589 ±4,161 | 9.6% ±<0.1% , number 12,405,370 ±57,560 |
| $200,000 or more | 28.8% ±32.1% , number 19 ±25 | 11.6% ±0.1% , number 330,236 ±4,128 | 13.4% ±0.1% , number 17,266,233 ±82,370 |
Embed
What residents do for work
Source: ACS 2020–2024 5-year, table A17004.
Show data
| Gu Oidak | Arizona | United States | |
|---|---|---|---|
| Education and health care | 54.3% ±38.7% , number 38 ±48 | 22.1% ±0.2% , number 755,669 ±6,962 | 23.5% ±0.1% , number 37,913,663 ±133,200 |
| Construction | 27.1% ±21.8% , number 19 ±25 | 7.8% ±0.1% , number 266,252 ±4,394 | 6.9% ±<0.1% , number 11,167,040 ±57,000 |
| Public administration | 18.6% ±21.0% , number 13 ±20 | 4.8% ±0.1% , number 162,293 ±3,910 | 4.7% ±<0.1% , number 7,624,243 ±43,950 |
| Agriculture and mining | 0.0% ±20.0% , number 0 ±14 | 1.2% ±0.1% , number 42,419 ±2,234 | 1.6% ±<0.1% , number 2,511,442 ±17,160 |
| Manufacturing | 0.0% ±20.0% , number 0 ±14 | 7.6% ±0.1% , number 257,902 ±4,696 | 9.9% ±<0.1% , number 15,940,000 ±38,890 |
| Wholesale trade | 0.0% ±20.0% , number 0 ±14 | 2.0% ±0.1% , number 67,316 ±2,556 | 2.2% ±<0.1% , number 3,507,744 ±16,260 |
| Retail trade | 0.0% ±20.0% , number 0 ±14 | 11.8% ±0.2% , number 403,077 ±6,072 | 10.8% ±<0.1% , number 17,456,908 ±41,100 |
| Transportation and warehousing | 0.0% ±20.0% , number 0 ±14 | 5.8% ±0.1% , number 197,865 ±3,780 | 5.9% ±<0.1% , number 9,568,767 ±29,300 |
Embed
All the numbers
| Indicator | Gu Oidak | Arizona | US | Table |
|---|---|---|---|---|
| Median household income | n/a | $79,964 ±$407 | $80,734 ±$166 | A14006 |
| Income per person | $32,033† (too uncertain to lean on) ±$27,060 | $42,503 ±$233 | $44,673 ±$122 | A14024 |
| Income inequality (Gini index) | 0.615 ±0.284 | 0.464 ±0.002 | 0.483 | A14028 |
| Living in poverty | 52.1%† (too uncertain to lean on) ±49.9% , number 100 ±125 | 12.5% ±0.2% , number 901,451 ±13,960 | 12.5% ±0.1% , number 40,735,661 ±275,900 | A13004 |
| Unemployment rate | 27.8% ±7.9% , number 27 ±27 | 5.1% ±0.1% , number 183,239 ±4,131 | 5.2% ±<0.1% , number 8,902,365 ±38,980 | A17005 |
| No health insurance | 0.0%† (too uncertain to lean on) ±14.6% , number 0 ±28 | 10.5% ±0.1% , number 763,416 ±8,737 | 8.4% ±<0.1% , number 27,734,911 ±158,900 | A20001 |
Education
Education
Too few households are surveyed here to estimate these figures closely. The table gives each with its margin of error.
For figures from many more households, see Pima County.
Highest level of education
Source: ACS 2020–2024 5-year, table A12001.
Show data
| Gu Oidak | Arizona | United States | |
|---|---|---|---|
| Less than high school | 20.9% ±31.4% , number 34 ±58 | 10.6% ±0.2% , number 540,735 ±7,742 | 10.4% ±<0.1% , number 23,992,410 ±82,490 |
| High school only | 27.0% ±25.7% , number 44 ±54 | 23.5% ±0.2% , number 1,194,228 ±9,717 | 26.0% ±0.1% , number 60,094,716 ±262,500 |
| Some college | 33.1% ±3.8% , number 54 ±43 | 32.6% ±0.2% , number 1,657,372 ±11,050 | 27.9% ±0.1% , number 64,356,961 ±143,900 |
| Bachelor’s degree | 19.0% ±18.8% , number 31 ±39 | 20.3% ±0.2% , number 1,035,236 ±9,405 | 21.6% ±0.1% , number 49,868,171 ±191,400 |
| Graduate degree | 0.0% ±14.9% , number 0 ±24 | 13.0% ±0.1% , number 661,104 ±7,060 | 14.1% ±0.1% , number 32,495,045 ±159,600 |
Embed
All the numbers
| Indicator | Gu Oidak | Arizona | US | Table |
|---|---|---|---|---|
| Bachelor’s degree or more | 19.0%† (too uncertain to lean on) ±24.0% , number 31 ±46 | 33.3% ±0.2% , number 1,696,340 ±11,760 | 35.7% ±0.1% , number 82,363,216 ±249,200 | A12001 |
| High school graduate or more | 79.1%† (too uncertain to lean on) ±79.9% , number 129 ±83 | 89.4% ±0.4% , number 4,547,940 ±18,830 | 89.6% ±0.2% , number 206,814,893 ±389,500 | A12001 |
Housing
Homes and what they cost
Too few households are surveyed here to estimate these figures closely. The table gives each with its margin of error.
For figures from many more households, see Pima County.
Types of homes
Source: ACS 2020–2024 5-year, table A10032.
Show data
| Gu Oidak | Arizona | United States | |
|---|---|---|---|
| Single-family, detached | 100.0% , number 75 ±47 | 64.2% ±0.2% , number 2,048,854 ±5,988 | 61.3% ±0.1% , number 88,075,458 ±149,800 |
| Single-family, attached | 0.0% ±18.7% , number 0 ±14 | 5.2% ±0.1% , number 165,025 ±3,278 | 6.2% ±<0.1% , number 8,955,086 ±33,580 |
| 2 to 4 units | 0.0% ±26.4% , number 0 ±20 | 4.6% ±0.1% , number 146,940 ±3,577 | 7.7% ±<0.1% , number 11,031,346 ±42,810 |
| 5 to 19 units | 0.0% ±26.4% , number 0 ±20 | 7.3% ±0.2% , number 232,980 ±5,456 | 8.8% ±<0.1% , number 12,625,154 ±51,990 |
| 20 or more units | 0.0% ±26.4% , number 0 ±20 | 9.1% ±0.2% , number 290,108 ±4,880 | 10.3% ±<0.1% , number 14,859,547 ±31,000 |
| Mobile homes and other | 0.0% ±26.4% , number 0 ±20 | 9.7% ±0.1% , number 308,932 ±3,933 | 5.7% ±<0.1% , number 8,228,764 ±48,580 |
Embed
When homes were built
Source: ACS 2020–2024 5-year, table A10055.
Show data
| Gu Oidak | Arizona | United States | |
|---|---|---|---|
| 2010 or later | 0.0% ±42.4% , number 0 ±28 | 14.5% ±0.2% , number 415,149 ±5,348 | 11.6% ±<0.1% , number 14,996,534 ±51,640 |
| 2000 to 2009 | 0.0% ±30.0% , number 0 ±20 | 22.6% ±0.2% , number 646,794 ±6,322 | 13.8% ±<0.1% , number 17,865,859 ±70,250 |
| 1980 to 1999 | 65.2% ±40.6% , number 43 ±40 | 33.6% ±0.3% , number 959,379 ±8,064 | 25.3% ±<0.1% , number 32,758,140 ±75,080 |
| 1960 to 1979 | 18.2% ±45.9% , number 12 ±31 | 21.4% ±0.2% , number 611,979 ±6,612 | 23.9% ±<0.1% , number 30,938,809 ±78,560 |
| Before 1960 | 16.7% ±53.5% , number 11 ±36 | 7.8% ±0.1% , number 222,780 ±4,070 | 25.3% ±<0.1% , number 32,668,154 ±83,060 |
Embed
All the numbers
| Indicator | Gu Oidak | Arizona | US | Table |
|---|---|---|---|---|
| Housing units | 75 ±47 | – | – | A10001 |
| Households | 66† (too uncertain to lean on) ±46 | – | – | A10008 |
| People per household | 2.91 ±0.97 | 2.53 ±0.01 | 2.53 ±0.01 | A10003 |
| Households that rent | 16.7%† (too uncertain to lean on) ±24.7% , number 11 ±18 | 32.6% ±0.2% , number 931,983 ±7,038 | 34.8% ±0.1% , number 45,017,354 ±163,600 | A10060 |
| Vacant homes | 12.0%† (too uncertain to lean on) ±18.5% , number 9 ±15 | 10.5% ±0.2% , number 336,758 ±6,061 | 10.1% ±0.1% , number 14,547,859 ±200,400 | A10047, A10060 |
| Median gross rent | n/a | $1,543 ±$7 | $1,413 ±$2 | A18009 |
| Median home value | n/a | $394,500 ±$1,474 | $332,700 ±$236 | A10036 |
| Renters paying 30% or more of income | 0.0%† (too uncertain to lean on) ±100.0% , number 0 ±28 | 48.0% ±0.6% , number 447,352 ±6,325 | 47.6% ±0.2% , number 21,422,415 ±63,960 | A18002 |
| Owners paying 30% or more of income | 0.0%† (too uncertain to lean on) ±72.0% , number 0 ±40 | 21.4% ±0.3% , number 412,689 ±5,329 | 22.5% ±0.1% , number 18,961,895 ±39,930 | A10040 |
| Homes built before 1960 | 16.7%† (too uncertain to lean on) ±53.5% , number 11 ±36 | 7.8% ±0.1% , number 222,780 ±4,070 | 25.3% ±<0.1% , number 32,668,154 ±83,060 | A10055 |
Getting around
How people get around
Too few households are surveyed here to estimate these figures closely. The table gives each with its margin of error.
For figures from many more households, see Pima County.
How people get to work
Source: ACS 2020–2024 5-year, table A09005.
Show data
| Gu Oidak | Arizona | United States | |
|---|---|---|---|
| Drive alone | 72.9% ±100.0% , number 51 ±50 | 66.8% ±0.3% , number 2,259,212 ±11,300 | 68.8% ±0.1% , number 109,447,738 ±95,800 |
| Carpool | 27.1% ±21.8% , number 19 ±25 | 9.8% ±0.2% , number 330,476 ±6,077 | 8.5% ±<0.1% , number 13,569,614 ±52,500 |
| Public transit | 0.0% ±28.3% , number 0 ±20 | 1.3% ±0.1% , number 42,879 ±2,298 | 3.5% ±<0.1% , number 5,573,279 ±22,170 |
| Walk | 0.0% ±20.0% , number 0 ±14 | 1.7% ±0.1% , number 55,804 ±2,456 | 2.4% ±<0.1% , number 3,772,609 ±17,080 |
| Work from home | 0.0% ±20.0% , number 0 ±14 | 18.4% ±0.2% , number 620,550 ±7,199 | 15.1% ±<0.1% , number 24,042,489 ±82,860 |
| Other | 0.0% ±34.6% , number 0 ±24 | 2.1% ±0.1% , number 70,833 ±2,872 | 1.7% ±<0.1% , number 2,708,365 ±17,940 |
Embed
Time spent getting to work
Source: ACS 2020–2024 5-year, table B09001.
Show data
| Gu Oidak | Arizona | United States | |
|---|---|---|---|
| Under 10 minutes | 58.6% ±81.3% , number 41 ±38 | 12.2% ±0.2% , number 337,581 ±5,540 | 12.7% ±<0.1% , number 17,153,542 ±40,730 |
| 10 to 19 minutes | 18.6% ±29.0% , number 13 ±24 | 28.3% ±0.3% , number 780,196 ±8,130 | 28.7% ±<0.1% , number 38,741,521 ±54,980 |
| 20 to 29 minutes | 22.9% ±25.5% , number 16 ±24 | 23.3% ±0.2% , number 643,970 ±7,242 | 21.3% ±<0.1% , number 28,723,420 ±52,330 |
| 30 to 39 minutes | 0.0% ±28.3% , number 0 ±20 | 17.9% ±0.2% , number 492,863 ±6,065 | 16.9% ±<0.1% , number 22,853,044 ±46,230 |
| 40 to 59 minutes | 0.0% ±28.3% , number 0 ±20 | 11.8% ±0.2% , number 324,825 ±5,810 | 11.9% ±<0.1% , number 16,024,037 ±44,090 |
| 60 minutes or more | 0.0% ±28.3% , number 0 ±20 | 6.5% ±0.1% , number 179,769 ±3,833 | 8.6% ±<0.1% , number 11,576,041 ±36,550 |
Embed
Vehicles per household
Source: ACS 2020–2024 5-year, table A10030.
Show data
| Gu Oidak | Arizona | United States | |
|---|---|---|---|
| None | 51.5% ±44.2% , number 34 ±38 | 5.4% ±0.1% , number 153,437 ±3,586 | 8.4% ±<0.1% , number 10,793,323 ±36,450 |
| One | 0.0% ±30.0% , number 0 ±20 | 34.4% ±0.3% , number 982,821 ±7,540 | 33.1% ±0.1% , number 42,801,892 ±122,600 |
| Two | 28.8% ±38.5% , number 19 ±29 | 37.6% ±0.3% , number 1,074,985 ±8,176 | 36.6% ±0.1% , number 47,334,152 ±191,100 |
| Three or more | 19.7% ±54.6% , number 13 ±37 | 22.6% ±0.2% , number 644,838 ±6,405 | 21.9% ±0.1% , number 28,298,129 ±85,940 |
Embed
All the numbers
| Indicator | Gu Oidak | Arizona | US | Table |
|---|---|---|---|---|
| Drive to work alone | 72.9%† (too uncertain to lean on) ±100.0% , number 51 ±50 | 66.8% ±0.3% , number 2,259,212 ±11,300 | 68.8% ±0.1% , number 109,447,738 ±95,800 | A09005 |
| Take public transit | 0.0%† (too uncertain to lean on) ±28.3% , number 0 ±20 | 1.3% ±0.1% , number 42,879 ±2,298 | 3.5% ±<0.1% , number 5,573,279 ±22,170 | A09005 |
| Work from home | 0.0%† (too uncertain to lean on) ±20.0% , number 0 ±14 | 18.4% ±0.2% , number 620,550 ±7,199 | 15.1% ±<0.1% , number 24,042,489 ±82,860 | A09005 |
| Commute 30 minutes or more | 0.0%† (too uncertain to lean on) ±49.0% , number 0 ±34 | 36.2% ±0.3% , number 997,457 ±9,232 | 37.4% ±<0.1% , number 50,453,122 ±73,600 | B09001 |
| Households with no vehicle | 51.5%† (too uncertain to lean on) ±41.1% , number 34 ±36 | 5.4% ±0.1% , number 153,437 ±3,603 | 8.4% ±<0.1% , number 10,793,323 ±27,220 | A10030 |
Places
In and around Gu Oidak
Population, from the latest estimates available. Figures cover the whole of each place.
Places nearby
- Sells: 1,935
- Pisinemo: 311
- San Miguel: 237
- South Komelik: 178
- Ali Molina: 171
- Topawa: 166
- Chiawuli Tak: 146
- Haivana Nakya: 96
Its county
- Pima County: 1,074,685
Places like this one
- Center Point, Louisiana: 580
- Rifton, New York: 541
- Evergreen, Louisiana: 297
- Powell, Texas: 104
Places at least a third this size, with the closest income, education, age, housing and origins.
Turn Gu Oidak into your planning report.
Social Explorer Studio builds an editable profile of any place, with tables and charts beside the county and state, and exports to Word, PDF and Excel.
Questions about Gu Oidak
What is the population of Gu Oidak, Arizona?
192 people (±154), according to the ACS 2020–2024 5-year estimates. That’s the 356th largest of 441 places in Arizona.
What is the FIPS code for Gu Oidak, Arizona?
0430550. The first two digits, 04, are Arizona’s state code, and the last five, 30550, identify Gu Oidak within it. The Census Bureau’s full geographic identifier (GEOID) is 1600000US0430550.
What county is Gu Oidak in?
Gu Oidak is in Pima County.
What is the median age in Gu Oidak?
Likely between 49 and 59 years, according to the ACS 2020–2024 5-year estimates. In a place this small they rest on few households, so treat it as a rough range.
Where does this census data come from?
The U.S. Census Bureau’s American Community Survey, through Social Explorer’s tables: the latest 1-year estimates where they exist, for the most recent numbers, and 5-year estimates otherwise. Each table lists its code, so you can find it again.
Is this data free to use?
Yes. You can read it, cite it, download the CSV and embed the charts, with no account. To map other variables, compare your own areas or build a report, see Social Explorer’s plans in a live demo.
Sources and how to cite
American Community Survey 2020–2024 5-year estimates, U.S. Census Bureau, from Social Explorer’s tables A00001, A00002, A01004, A04001, A06001, A08001, A09005, A10001, A10003, A10008, A10030, A10036, A10040, A10047, A10055, A10060, A12001, A13004, A14006, A14024, A14028, A16002, A17005, A18002, A18009, A20001, B02002, B09001, B13002, B18101, C16001. Maps by census tract use 2020–2024 5-year estimates, since the 1-year survey doesn’t cover tracts. These are estimates from a sample, each with its margin of error. Data retrieved November 14, 2026. How these profiles are made.
U.S. Census Bureau, American Community Survey 2020–2024 5-year estimates, via Social Explorer. “Gu Oidak, Arizona.” https://www.socialexplorer.com/places/arizona/gu-oidak-cdp. Accessed November 14, 2026.