

New Mexico: Population, demographics and census data
Home to 2,125,498 people, the 36th largest of the 50 states and DC, anchored by Albuquerque and Las Cruces. It grew 1.9% between 2015 and 2025.
- Population
- 2.13M. Census Bureau estimate · Rank 36 of the 50 states and DC
- Median household income
- $70,342 ±$1,508. US $84,780
- Median age
- 40.6 ±0.3. US 39.5
ACS 2025 1-year estimates, U.S. Census Bureau
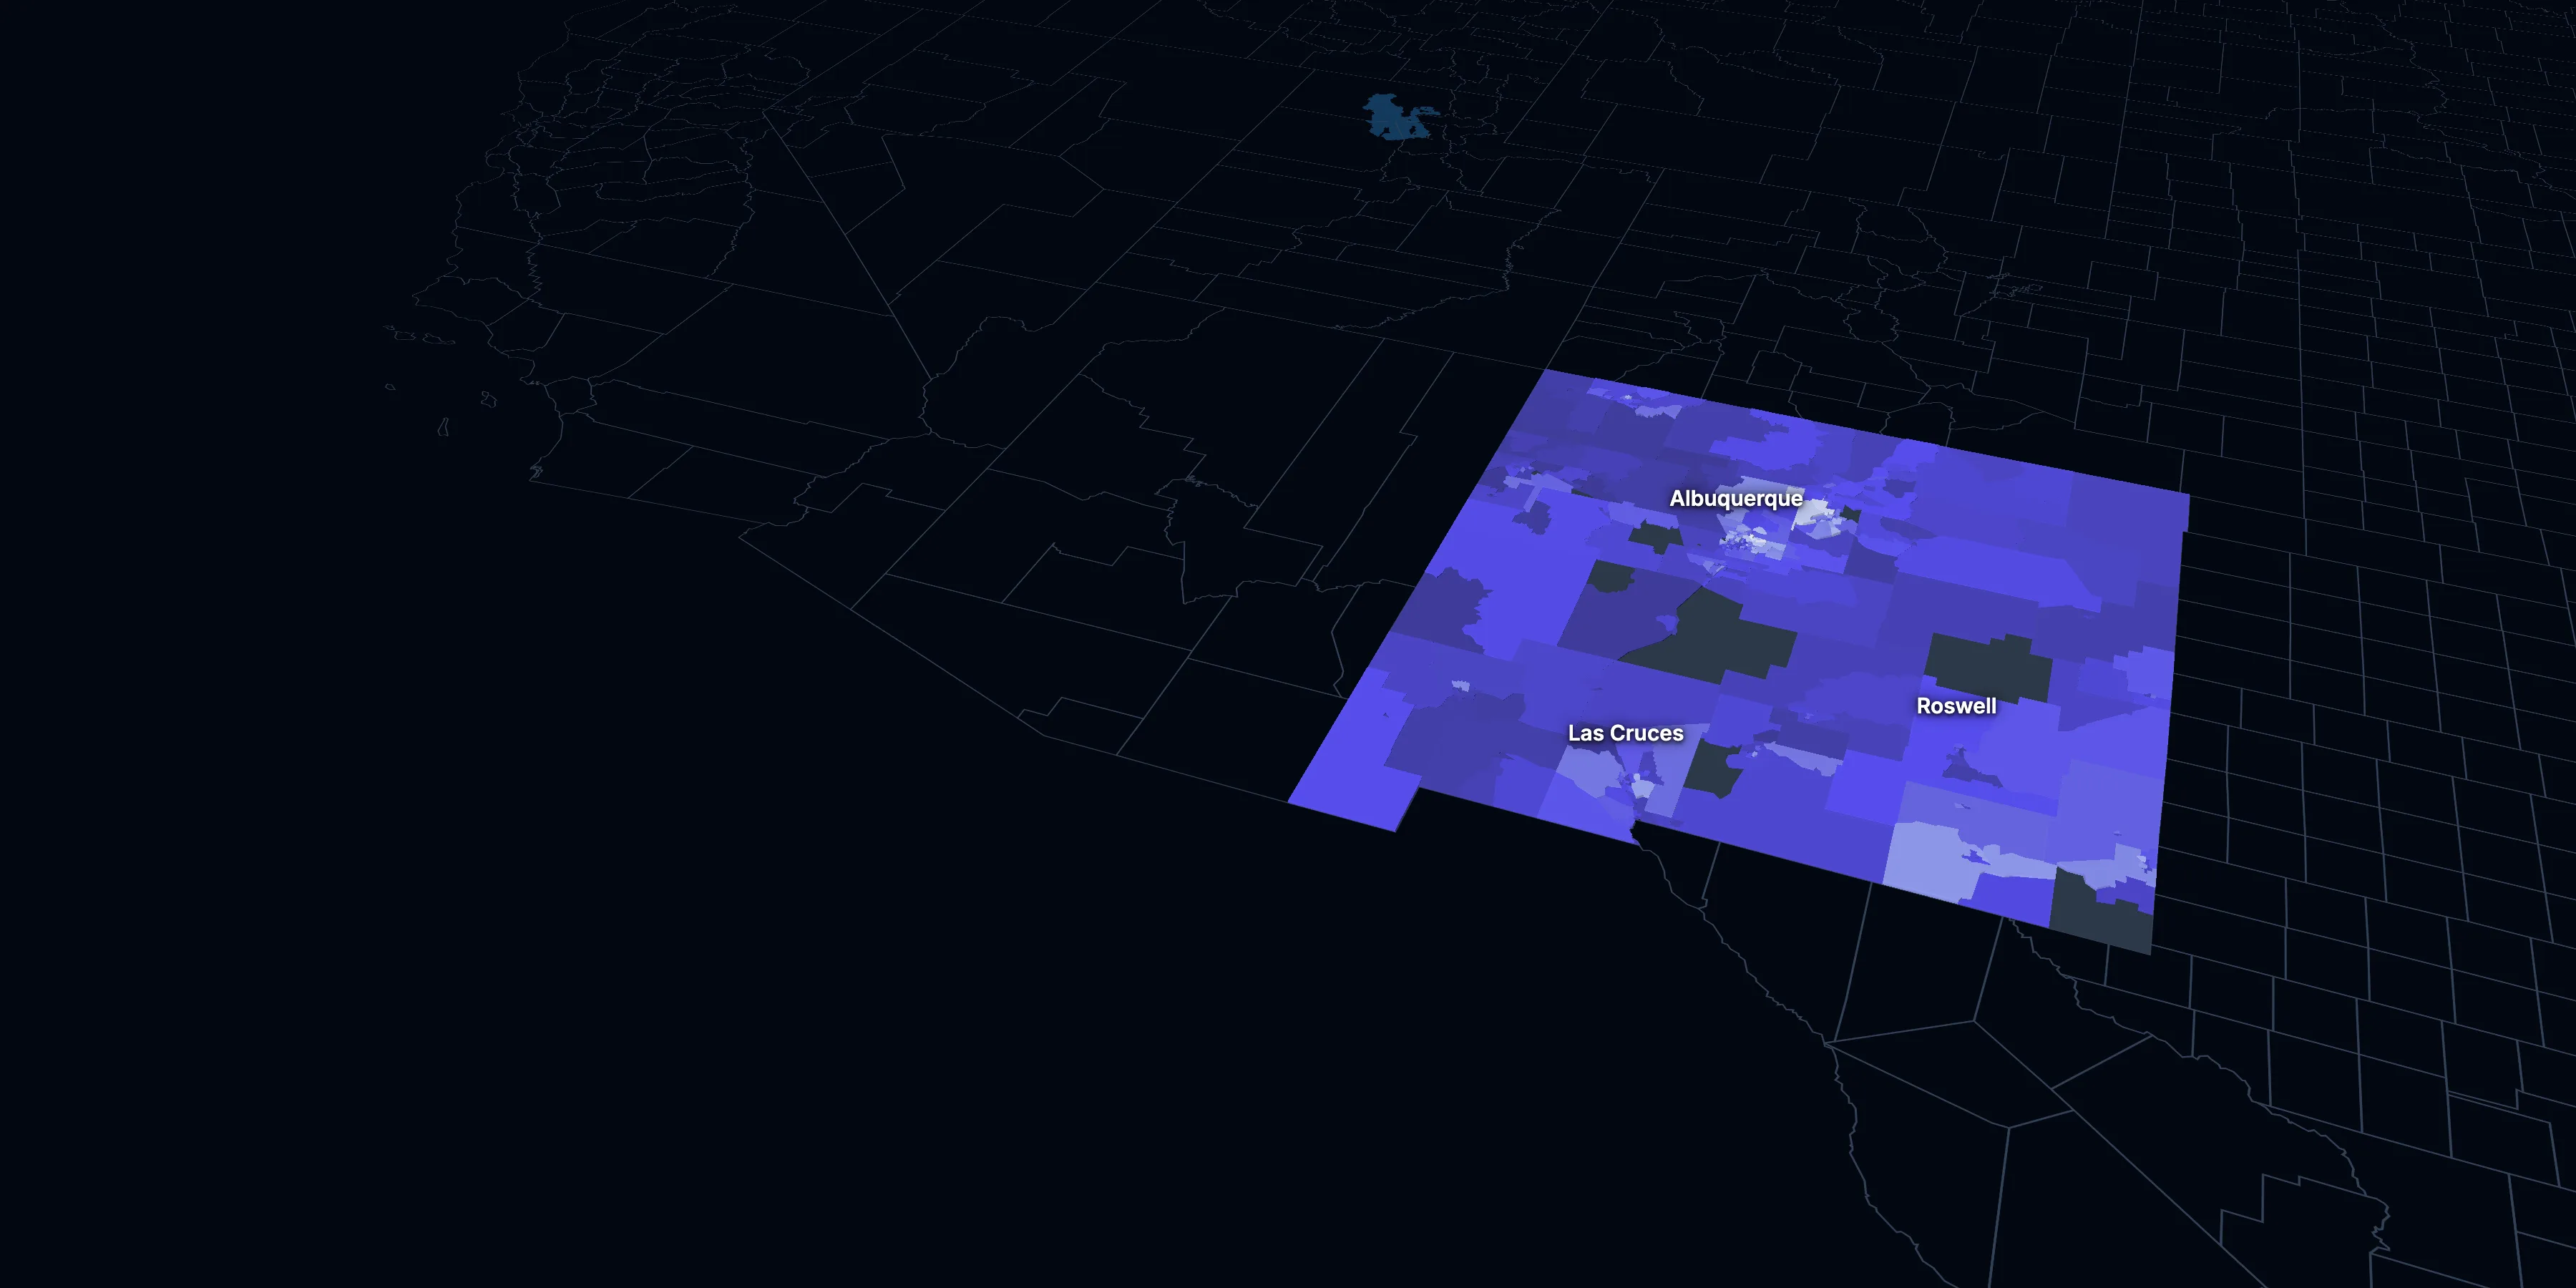
Taller, lighter tracts have higher household incomes
About New Mexico
New Mexico’s median household income is $70,342 (±$1,508), lower than the US ($84,780), and its median age is 40.6 (±0.3), according to the ACS 2025 1-year estimates. Its largest city is Albuquerque.
± is each figure’s margin of error, at 90% confidence, and † marks one too uncertain to lean on. Under each percentage in the tables is the number it counts. How the margins are worked out.
FIPS code 35
Highlights
What stands out in New Mexico
The numbers where New Mexico sits furthest from the nation, or past a recognized policy benchmark.
Past a policy benchmark
15.5%
ElevatedLiving in poverty
That’s higher than the US (11.8%). HUD and the New Markets Tax Credit use 20% poverty to mark low-income areas. It’s the 3rd highest of the 50 states and DC.
Furthest from the national picture
17.6%
Higher than the USLiving with a disability
That’s higher than the US (13.7%). It’s the 6th highest of the 50 states and DC.
$1,145
Lower than the USMedian gross rent
That’s lower than the US ($1,557).
7.8%
Higher than the USVeterans (adults)
That’s higher than the US (5.9%).
21.3%
Higher than the US65 and over
That’s higher than the US (19.0%).
$70,342
Lower than the USMedian household income
That’s lower than the US ($84,780). It’s the 7th lowest of the 50 states and DC.
2015 to 2025
How New Mexico changed in ten years
The state added 40,389 people. It got older and better educated, and poverty fell 4.9 points.
Population, change since 2015
+1.9% in the state and +6.3% in the US.
Source: ACS 1-year, 2015 to 2025, table A00001.
Show data
| New Mexico | United States | |
|---|---|---|
| 2015 | 0.0% | 0.0% |
| 2016 | −0.2% | +0.5% |
| 2017 | +0.1% | +1.3% |
| 2018 | +0.5% | +1.8% |
| 2019 | +0.6% | +2.1% |
| 2021 | +1.5% | +3.3% |
| 2022 | +1.4% | +3.7% |
| 2023 | +1.4% | +4.2% |
| 2024 | +2.2% | +5.8% |
| 2025 | +1.9% | +6.3% |
Embed
Median household income, in 2025 dollars
+13.1% in the state and +10.9% in the US.
Source: ACS 1-year, 2015 to 2025, table A14006.
Show data
| New Mexico | United States | |
|---|---|---|
| 2015 | $62,174 | $76,413 |
| 2016 | $63,230 | $77,931 |
| 2017 | $61,894 | $79,891 |
| 2018 | $60,970 | $80,059 |
| 2019 | $65,949 | $83,427 |
| 2021 | $64,682 | $83,521 |
| 2022 | $66,162 | $82,811 |
| 2023 | $66,246 | $82,683 |
| 2024 | $70,089 | $84,339 |
| 2025 | $70,342 | $84,780 |
Embed
Living in poverty
−4.9 points in the state and −3.0 points in the US.
Source: ACS 1-year, 2015 to 2025, table A13004.
Show data
| New Mexico | United States | |
|---|---|---|
| 2015 | 20.4% | 14.7% |
| 2016 | 19.8% | 14.0% |
| 2017 | 19.7% | 13.4% |
| 2018 | 19.5% | 13.1% |
| 2019 | 18.2% | 12.3% |
| 2021 | 18.4% | 12.8% |
| 2022 | 17.6% | 12.6% |
| 2023 | 17.8% | 12.5% |
| 2024 | 16.4% | 12.1% |
| 2025 | 15.5% | 11.8% |
Embed
Bachelor’s degree or more
+4.9 points in the state and +6.7 points in the US.
Source: ACS 1-year, 2015 to 2025, table A12001.
Show data
| New Mexico | United States | |
|---|---|---|
| 2015 | 26.5% | 30.6% |
| 2016 | 27.2% | 31.3% |
| 2017 | 27.1% | 32.0% |
| 2018 | 27.7% | 32.6% |
| 2019 | 27.7% | 33.1% |
| 2021 | 30.1% | 35.0% |
| 2022 | 30.5% | 35.7% |
| 2023 | 31.6% | 36.2% |
| 2024 | 31.8% | 36.8% |
| 2025 | 31.4% | 37.4% |
Embed
Median gross rent, in 2025 dollars
+6.7% in the state and +18.5% in the US.
Source: ACS 1-year, 2015 to 2025, table A18009.
Show data
| New Mexico | United States | |
|---|---|---|
| 2015 | $1,073 | $1,314 |
| 2016 | $1,087 | $1,327 |
| 2017 | $1,076 | $1,340 |
| 2018 | $1,073 | $1,368 |
| 2019 | $1,075 | $1,393 |
| 2021 | $1,085 | $1,427 |
| 2022 | $1,058 | $1,440 |
| 2023 | $1,153 | $1,496 |
| 2024 | $1,154 | $1,537 |
| 2025 | $1,145 | $1,557 |
Embed
Median home value, in 2025 dollars
+30.5% in the state and +39.3% in the US.
Source: ACS 1-year, 2015 to 2025, table A10036.
Show data
| New Mexico | United States | |
|---|---|---|
| 2015 | $224,820 | $266,469 |
| 2016 | $226,556 | $277,278 |
| 2017 | $226,818 | $288,124 |
| 2018 | $225,816 | $296,908 |
| 2019 | $229,669 | $305,336 |
| 2021 | $256,371 | $337,116 |
| 2022 | $269,297 | $355,481 |
| 2023 | $272,672 | $361,931 |
| 2024 | $289,280 | $372,685 |
| 2025 | $293,400 | $371,100 |
Embed
ACS 1-year estimates. The dotted stretch of each line spans 2020, when the Census Bureau released no standard 1-year estimates. Dollar values are in 2025 dollars.
| Indicator | 2015 | 2025 | Change |
|---|---|---|---|
| Population | 2,085,109 | 2,125,498 | +1.9% |
| Median age | 37.4 | 40.6 | +3.2 years |
| 65 and over | 15.9% | 21.3% | +5.4 points |
| Born outside the US | 9.4% | 9.8% | +0.4 points |
| Hispanic or Latino | 48.0% | 49.4% | +1.4 points |
| Median household income | $62,174 | $70,342 | +13.1% |
| Living in poverty | 20.4% | 15.5% | −4.9 points |
| Bachelor’s degree or more | 26.5% | 31.4% | +4.9 points |
| Households that rent | 32.5% | 30.2% | −2.4 points |
| Median gross rent | $1,073 | $1,145 | +6.7% |
| Median home value | $224,820 | $293,400 | +30.5% |
612 census tracts
New Mexico, tract by tract
State averages hide a lot. These census tracts are the closest the census comes to neighborhoods.
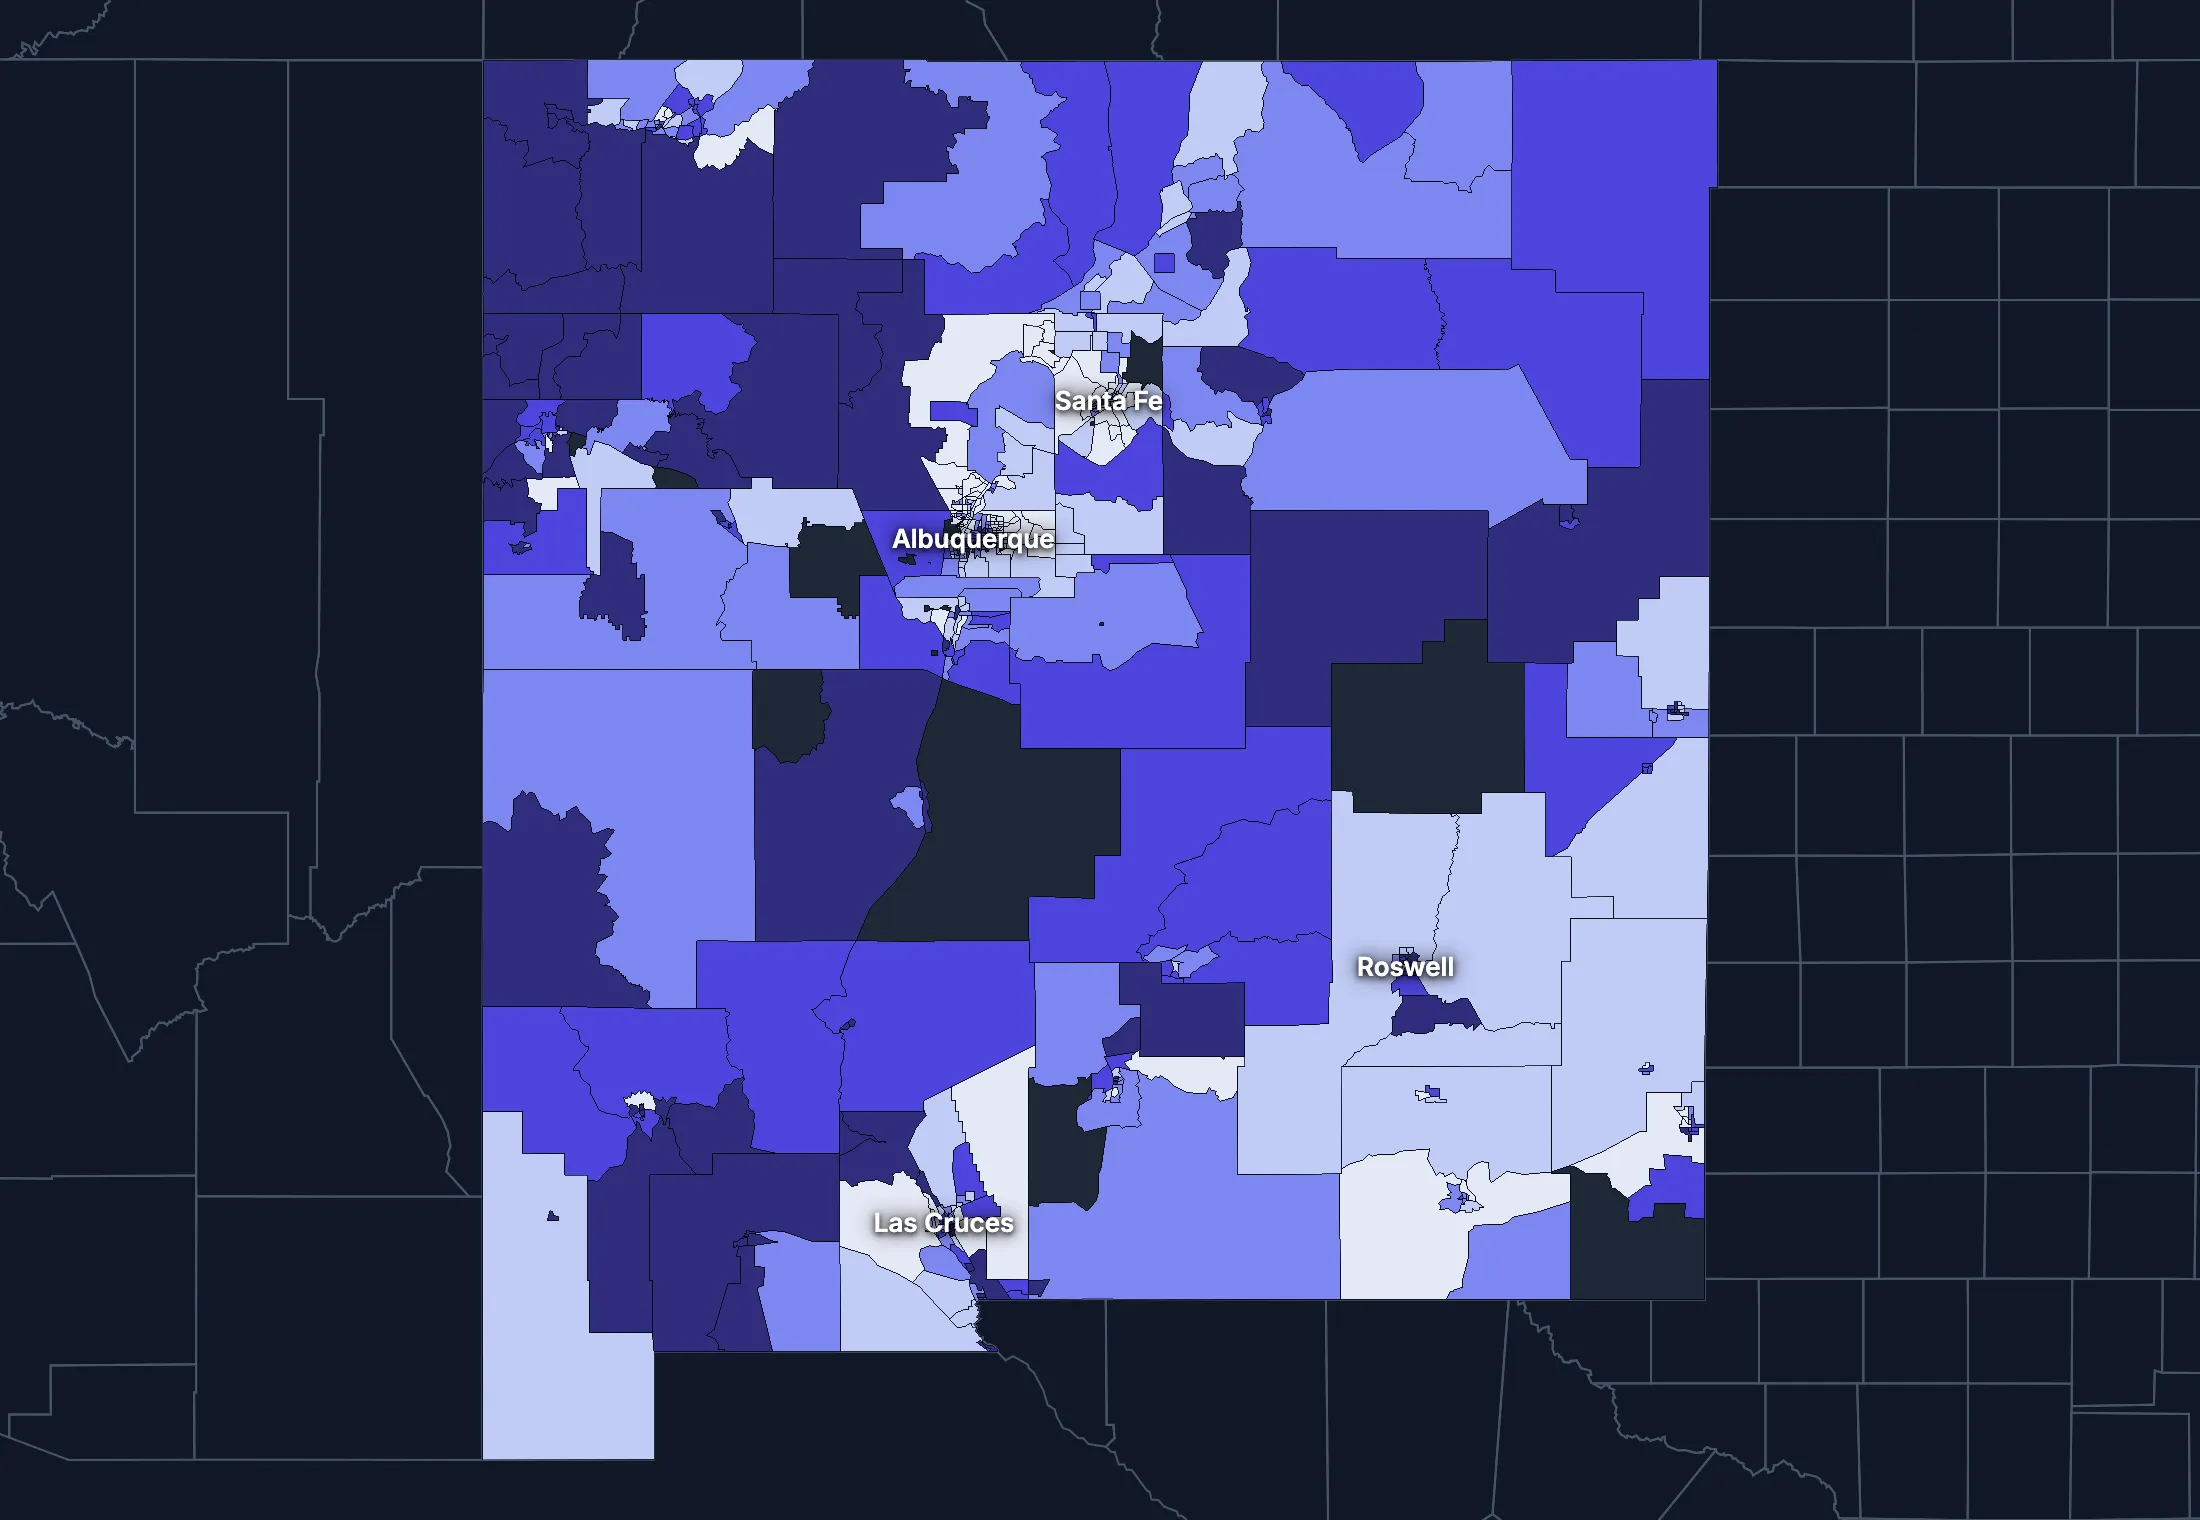
Where the state’s average misleads
Each tick is one census tract, and the dark line marks the state. Hover over a tick or tap it to see the tract.
Poverty
150 of 599 tracts are at least 1.5 times the state’s overall 17.8%, and 205 are at two-thirds of it or less.
Highest: Tract 18.07, 64.1%. Lowest: Tract 103.17, 0.0%.
Renters paying 30% or more of income
47 of 567 tracts are at least 1.5 times the state’s overall 45.0%, and 171 are at two-thirds of it or less.
Highest: Tract 9781, 100.0%. Lowest: Tract 38.03, 0.0%.
Adults with a bachelor’s degree
113 of 603 tracts are at least 1.5 times the state’s overall 31.0%, and 230 are at two-thirds of it or less.
Highest: Tract 37.41, 84.8%. Lowest: Tract 9800, 0.0%.
Median household income
103 of 591 tracts are at least 1.5 times the typical tract’s $60,500, and 93 are at two-thirds of it or less.
Highest: Tract 37.44, $250,000 or more. Lowest: Tract 18.07, $15,951.
American Community Survey 2020–2024 5-year estimates, by census tract. Income is capped at $250,000+ by the Census Bureau.
People
Who lives in New Mexico
Its median age of 40.6 is higher than the US (39.5). 9.8% of residents were born outside the US, and 30.6% speak a language other than English at home.
Age
Source: ACS 2025 1-year, table A01001.
Show data
| New Mexico | United States | |
|---|---|---|
| Under 18 | 20.5% ±0.5% , number 436,412 ±9,699 | 21.0% ±<0.1% , number 71,689,151 ±111,800 |
| 18 to 24 | 9.7% ±0.4% , number 206,809 ±9,003 | 9.3% ±<0.1% , number 31,716,680 ±98,660 |
| 25 to 34 | 12.4% ±0.3% , number 264,054 ±6,056 | 13.6% ±<0.1% , number 46,357,354 ±55,690 |
| 35 to 44 | 13.1% ±0.4% , number 278,382 ±9,038 | 13.4% ±<0.1% , number 45,746,189 ±105,700 |
| 45 to 54 | 11.0% ±0.3% , number 233,936 ±5,720 | 11.8% ±<0.1% , number 40,257,563 ±53,540 |
| 55 to 64 | 11.9% ±0.4% , number 253,488 ±8,399 | 12.1% ±<0.1% , number 41,242,904 ±104,700 |
| 65 to 74 | 12.3% ±0.4% , number 262,398 ±7,893 | 10.8% ±<0.1% , number 36,895,650 ±91,520 |
| 75 and over | 8.9% ±0.3% , number 190,019 ±6,451 | 8.2% ±<0.1% , number 27,879,368 ±78,140 |
Embed
Race and ethnicity
Source: ACS 2025 1-year, table A04001.
Show data
| New Mexico | United States | |
|---|---|---|
| White, not Hispanic | 34.1% ±0.2% , number 723,931 ±4,116 | 55.0% ±<0.1% , number 187,959,031 ±58,340 |
| Hispanic or Latino | 49.4% , number 1,050,500 | 20.5% ±<0.1% , number 69,975,516 ±13,270 |
| Black, not Hispanic | 1.8% ±0.1% , number 39,257 ±2,962 | 11.7% ±<0.1% , number 40,096,453 ±106,200 |
| Asian, not Hispanic | 1.9% ±0.2% , number 40,576 ±3,529 | 6.5% ±<0.1% , number 22,096,709 ±58,340 |
| Other or multiracial | 12.8% ±0.4% , number 271,234 ±8,035 | 6.3% ±<0.1% , number 21,657,150 ±150,100 |
Embed
Language spoken at home
Source: ACS 2025 1-year, table C16001.
Show data
| New Mexico | United States | |
|---|---|---|
| English only | 69.4% ±1.0% , number 1,402,074 ±20,000 | 77.1% ±0.1% , number 249,390,588 ±275,300 |
| Spanish | 24.0% ±0.9% , number 485,249 ±18,330 | 13.9% ±0.1% , number 44,921,985 ±177,800 |
| Other Indo-European | 1.2% ±0.2% , number 24,188 ±4,422 | 4.0% ±<0.1% , number 12,862,980 ±113,500 |
| Asian and Pacific Island | 1.3% ±0.2% , number 25,726 ±4,030 | 3.8% ±<0.1% , number 12,288,841 ±99,740 |
| Arabic and other | 4.2% ±0.2% , number 84,090 ±4,591 | 1.3% ±<0.1% , number 4,116,949 ±71,480 |
Embed
Marital status
Source: ACS 2025 1-year, table A11001.
Show data
| New Mexico | United States | |
|---|---|---|
| Now married | 43.8% ±0.9% , number 776,256 ±15,230 | 47.9% ±0.1% , number 135,567,564 ±223,300 |
| Never married | 35.8% ±0.7% , number 635,385 ±12,490 | 34.8% ±0.1% , number 98,647,238 ±152,600 |
| Divorced | 13.1% ±0.5% , number 231,974 ±9,317 | 10.2% ±<0.1% , number 28,879,967 ±112,900 |
| Widowed | 5.5% ±0.3% , number 98,398 ±6,141 | 5.5% ±<0.1% , number 15,599,094 ±69,430 |
| Separated | 1.8% ±0.2% , number 32,270 ±4,282 | 1.6% ±<0.1% , number 4,441,399 ±49,160 |
Embed
Where people lived a year ago
Source: ACS 2025 1-year, table A08001.
Show data
| New Mexico | United States | |
|---|---|---|
| Same home | 89.9% ±0.7% , number 1,891,769 ±14,520 | 88.4% ±0.1% , number 298,889,697 ±214,800 |
| Same county | 5.3% ±0.5% , number 110,759 ±11,500 | 6.0% ±<0.1% , number 20,202,671 ±166,300 |
| Another county in the state | 2.1% ±0.3% , number 44,144 ±7,223 | 3.0% ±<0.1% , number 10,168,097 ±89,190 |
| Another state | 2.4% ±0.3% , number 50,844 ±6,335 | 2.1% ±<0.1% , number 7,025,589 ±81,660 |
| Another country | 0.4% ±0.1% , number 7,419 ±2,187 | 0.6% ±<0.1% , number 1,984,943 ±47,210 |
Embed
Top countries of birth, among those born abroad
Source: ACS 2020–2024 5-year, table A07001.
Show data
| New Mexico | |
|---|---|
| Mexico | 64.6% , number 128,981 |
| Philippines | 3.7% , number 7,294 |
| Germany | 2.1% , number 4,190 |
| Vietnam | 1.8% , number 3,625 |
| India | 1.8% , number 3,601 |
| Cuba | 1.8% , number 3,594 |
Embed
All the numbers
| Indicator | New Mexico | US | Rank among states* | Table |
|---|---|---|---|---|
| Population | 2,125,498 | 341,784,859 | 36th | A00001 |
| People per square mile | 18 | 97 | 46th | A00002 |
| Land area (square miles) | 121,313 | – | – | A00002 |
| Median age | 40.6 ±0.3 | 39.5 ±0.1 | 20th | A01004 |
| Under 18 | 20.5% ±0.5% , number 436,412 ±9,699 | 21.0% ±<0.1% , number 71,689,151 ±111,800 | 28th | B02002 |
| 65 and over | 21.3% ±0.5% , number 452,417 ±10,190 | 19.0% ±<0.1% , number 64,775,018 ±120,300 | 10th | B02002 |
| Born outside the US | 9.8% ±0.6% , number 208,669 ±12,300 | 14.7% ±0.1% , number 50,409,320 ±204,800 | 21st | A06001 |
| Speak a language other than English at home | 30.6% ±1.0% , number 619,253 ±19,820 | 22.9% ±0.1% , number 74,190,755 ±244,000 | 4th | C16001 |
| Veterans (adults) | 7.8% ±0.4% , number 130,350 ±6,797 | 5.9% ±<0.1% , number 15,746,228 ±85,320 | 9th | A16002 |
| Living with a disability | 17.6% ±0.5% , number 368,574 ±11,090 | 13.7% ±<0.1% , number 46,271,455 ±126,000 | 6th | B18101 |
| Women 15–50 who had a baby in the past year | 5.7% ±0.8% , number 27,552 ±3,788 | 5.0% ±0.1% , number 4,016,759 ±44,040 | 22nd | B13002 |
| Lived in the same home a year ago | 89.9% ±0.7% , number 1,891,769 ±14,520 | 88.4% ±0.1% , number 298,889,697 ±214,800 | 20th | A08001 |
| White, not Hispanic | 34.1% ±0.2% , number 723,931 ±4,116 | 55.0% ±<0.1% , number 187,959,031 ±58,340 | 49th | A04001 |
| Hispanic or Latino | 49.4% , number 1,050,500 | 20.5% ±<0.1% , number 69,975,516 ±13,270 | 1st | A04001 |
| Black, not Hispanic | 1.8% ±0.1% , number 39,257 ±2,962 | 11.7% ±<0.1% , number 40,096,453 ±106,200 | 43rd | A04001 |
| Asian, not Hispanic | 1.9% ±0.2% , number 40,576 ±3,529 | 6.5% ±<0.1% , number 22,096,709 ±58,340 | 41st | A04001 |
*1 is the highest. Population is ranked among all states, and the rest among those of 1,000 people or more, whose figures can be ranked. Ranks use 5-year estimates, the only ones covering every state, so they can differ slightly from the figures here.
Income and work
Lower incomes than the US
The median household income is $70,342, lower than the US ($84,780). 15.5% of people live in poverty, and 10.5% have no health insurance, higher than the US (8.4%).
Household income
Source: ACS 2025 1-year, table A14001.
Show data
| New Mexico | United States | |
|---|---|---|
| Under $25,000 | 18.0% ±0.9% , number 155,628 ±7,471 | 14.0% ±0.1% , number 18,727,548 ±88,990 |
| $25,000 to $49,999 | 18.6% ±0.9% , number 160,375 ±8,235 | 15.4% ±0.1% , number 20,665,585 ±101,400 |
| $50,000 to $74,999 | 16.5% ±0.9% , number 142,609 ±8,166 | 15.3% ±0.1% , number 20,513,565 ±88,500 |
| $75,000 to $99,999 | 12.4% ±0.9% , number 107,220 ±7,504 | 12.5% ±0.1% , number 16,814,245 ±87,520 |
| $100,000 to $149,999 | 16.0% ±0.9% , number 138,031 ±7,783 | 17.9% ±0.1% , number 24,018,984 ±99,670 |
| $150,000 to $199,999 | 8.3% ±0.5% , number 71,203 ±4,489 | 10.1% ±0.1% , number 13,521,827 ±70,660 |
| $200,000 or more | 10.2% ±0.6% , number 87,944 ±5,026 | 14.8% ±0.1% , number 19,801,668 ±84,120 |
Embed
What residents do for work
Source: ACS 2025 1-year, table A17004.
Show data
| New Mexico | United States | |
|---|---|---|
| Education and health care | 26.7% ±0.8% , number 256,930 ±8,220 | 24.4% ±0.1% , number 40,862,193 ±140,800 |
| Professional and business services | 13.5% ±0.8% , number 130,002 ±7,768 | 12.8% ±0.1% , number 21,375,231 ±87,110 |
| Retail trade | 11.1% ±0.7% , number 107,090 ±6,770 | 10.6% ±0.1% , number 17,781,181 ±96,660 |
| Arts, food and lodging | 10.2% ±0.8% , number 98,122 ±7,879 | 8.9% ±0.1% , number 14,811,502 ±87,840 |
| Public administration | 7.5% ±0.6% , number 72,346 ±5,621 | 4.7% ±<0.1% , number 7,944,601 ±69,540 |
| Construction | 6.6% ±0.5% , number 63,180 ±5,267 | 6.7% ±<0.1% , number 11,254,981 ±79,620 |
| Manufacturing | 5.2% ±0.6% , number 49,531 ±5,915 | 9.6% ±0.1% , number 16,064,394 ±91,270 |
| Other services | 4.8% ±0.6% , number 45,940 ±5,790 | 4.8% ±<0.1% , number 7,958,726 ±65,120 |
Embed
Where workers come from and go
New Mexico has 845,081 jobs and 849,487 employed residents. 46,376 people commute in to work and 50,782 commute out, while 798,705 both live and work here. The most commuters come from Texas.
Most commuters come from
- Texas: 25,286
- Arizona: 6,422
- Colorado: 5,567
Most residents commute to
- Texas: 30,685
- Arizona: 6,868
- Colorado: 6,545
Show data
| New Mexico | |
|---|---|
| Live and work here | 798,705 |
| Work here, live elsewhere | 46,376 |
| Live here, work elsewhere | 50,782 |
Embed
All the numbers
| Indicator | New Mexico | US | Rank among states* | Table |
|---|---|---|---|---|
| Median household income | $70,342 ±$1,508 | $84,780 ±$215 | 45th | A14006 |
| Income per person | $39,909 ±$742 | $47,171 ±$115 | 44th | A14024 |
| Income inequality (Gini index) | 0.481 ±0.010 | 0.482 ±0.001 | 15th | A14028 |
| Living in poverty | 15.5% ±0.8% , number 324,248 ±16,170 | 11.8% ±0.1% , number 39,264,183 ±277,400 | 3rd | A13004 |
| Unemployment rate | 4.7% ±0.4% , number 47,692 ±4,368 | 4.9% ±<0.1% , number 8,574,594 ±64,350 | 7th | A17005 |
| No health insurance | 10.5% ±0.5% , number 219,171 ±10,490 | 8.4% ±<0.1% , number 28,323,306 ±152,000 | 13th | A20001 |
*1 is the highest. Population is ranked among all states, and the rest among those of 1,000 people or more, whose figures can be ranked. Ranks use 5-year estimates, the only ones covering every state, so they can differ slightly from the figures here.
Education
Fewer college degrees than the US
31.4% of adults 25 and over have a bachelor’s degree or more, lower than the US (37.4%).
Highest level of education
Source: ACS 2025 1-year, table A12001.
Show data
| New Mexico | United States | |
|---|---|---|
| Less than high school | 11.4% ±0.7% , number 169,335 ±9,654 | 9.4% ±0.1% , number 22,321,002 ±120,500 |
| High school only | 26.3% ±1.0% , number 389,416 ±14,190 | 25.6% ±0.1% , number 61,096,726 ±203,400 |
| Some college | 30.9% ±1.0% , number 458,537 ±14,180 | 27.7% ±0.1% , number 65,920,977 ±173,500 |
| Bachelor’s degree | 17.3% ±0.7% , number 257,037 ±10,020 | 22.3% ±0.1% , number 53,224,312 ±196,700 |
| Graduate degree | 14.0% ±0.6% , number 207,952 ±8,427 | 15.0% ±0.1% , number 35,816,011 ±159,400 |
Embed
All the numbers
| Indicator | New Mexico | US | Rank among states* | Table |
|---|---|---|---|---|
| Bachelor’s degree or more | 31.4% ±0.9% , number 464,989 ±13,100 | 37.4% ±0.1% , number 89,040,323 ±253,200 | 41st | A12001 |
| High school graduate or more | 88.6% ±1.6% , number 1,312,942 ±23,960 | 90.6% ±0.2% , number 216,058,026 ±368,200 | 45th | A12001 |
*1 is the highest. Population is ranked among all states, and the rest among those of 1,000 people or more, whose figures can be ranked. Ranks use 5-year estimates, the only ones covering every state, so they can differ slightly from the figures here.
Housing
Home values outran incomes
30.2% of households rent, lower than the US (34.7%). The median home is worth $293,400 and the median rent is $1,145. After inflation, home values rose 31% from 2015 to 2025, while household income rose 13%.
Housing costs and income, 2015 to 2025, after inflation
Source: ACS 1-year, table A10036, A18009, A14006.
Show data
| New Mexico | United States | |
|---|---|---|
| Median home value | +30.5% | +39.3% |
| Median rent | +6.7% | +18.5% |
| Median household income | +13.1% | +10.9% |
Embed
Types of homes
Source: ACS 2025 1-year, table A10032.
Show data
| New Mexico | United States | |
|---|---|---|
| Single-family, detached | 64.4% ±0.8% , number 632,177 ±8,259 | 60.9% ±0.1% , number 90,335,844 ±173,300 |
| Single-family, attached | 3.8% ±0.4% , number 36,811 ±3,727 | 6.4% ±<0.1% , number 9,527,703 ±51,230 |
| 2 to 4 units | 6.0% ±0.5% , number 59,324 ±5,132 | 7.5% ±0.1% , number 11,109,005 ±75,790 |
| 5 to 19 units | 5.8% ±0.6% , number 57,355 ±5,985 | 8.7% ±0.1% , number 12,829,882 ±97,590 |
| 20 or more units | 4.6% ±0.5% , number 45,190 ±4,936 | 11.1% ±0.1% , number 16,381,450 ±92,310 |
| Mobile homes and other | 15.4% ±0.6% , number 150,741 ±5,728 | 5.4% ±<0.1% , number 8,045,083 ±53,680 |
Embed
When homes were built
Source: ACS 2025 1-year, table A10055.
Show data
| New Mexico | United States | |
|---|---|---|
| 2010 or later | 13.5% ±0.8% , number 116,150 ±6,936 | 15.1% ±0.1% , number 20,257,912 ±101,300 |
| 2000 to 2009 | 15.5% ±0.7% , number 133,516 ±6,486 | 13.8% ±0.1% , number 18,535,840 ±92,260 |
| 1980 to 1999 | 30.1% ±1.1% , number 259,771 ±9,392 | 24.1% ±0.1% , number 32,332,570 ±118,900 |
| 1960 to 1979 | 25.0% ±1.0% , number 216,042 ±9,070 | 22.9% ±0.1% , number 30,726,302 ±110,000 |
| Before 1960 | 15.9% ±0.8% , number 137,531 ±6,934 | 24.0% ±0.1% , number 32,210,798 ±121,500 |
Embed
All the numbers
| Indicator | New Mexico | US | Rank among states* | Table |
|---|---|---|---|---|
| Housing units | 981,598 | – | – | A10001 |
| Households | 863,010 ±7,332 | – | – | A10008 |
| People per household | 2.41 ±0.02 | 2.49 ±0.01 | 19th | A10003 |
| Households that rent | 30.2% ±1.0% , number 260,504 ±8,952 | 34.7% ±0.1% , number 46,551,688 ±193,200 | 36th | A10060 |
| Vacant homes | 12.1% ±0.8% , number 118,588 ±7,369 | 9.6% ±0.1% , number 14,165,545 ±137,100 | 16th | A10047, A10060 |
| Median gross rent | $1,145 ±$30 | $1,557 ±$4 | 36th | A18009 |
| Median home value | $293,400 ±$5,069 | $371,100 ±$646 | 37th | A10036 |
| Renters paying 30% or more of income | 43.4% ±2.4% , number 113,039 ±7,349 | 48.3% ±0.2% , number 22,486,693 ±122,100 | 25th | A18002 |
| Owners paying 30% or more of income | 20.7% ±1.1% , number 124,941 ±7,108 | 24.2% ±0.1% , number 21,201,943 ±93,050 | 26th | A10040 |
| Homes built before 1960 | 15.9% ±0.8% , number 137,531 ±6,934 | 24.0% ±0.1% , number 32,210,798 ±121,500 | 37th | A10055 |
*1 is the highest. Population is ranked among all states, and the rest among those of 1,000 people or more, whose figures can be ranked. Ranks use 5-year estimates, the only ones covering every state, so they can differ slightly from the figures here.
Getting around
A driving state with short commutes
74.4% of workers drive alone and 10.1% work from home. 31.2% of those who travel to work spend 30 minutes or more getting there, and 5.4% of households have no vehicle.
How people get to work
Source: ACS 2025 1-year, table A09005.
Show data
| New Mexico | United States | |
|---|---|---|
| Drive alone | 74.4% ±1.1% , number 711,092 ±13,330 | 69.8% ±0.1% , number 115,297,377 ±192,900 |
| Carpool | 10.7% ±0.8% , number 102,072 ±7,481 | 8.9% ±0.1% , number 14,712,170 ±97,240 |
| Public transit | 0.9% ±0.2% , number 8,273 ±2,170 | 4.3% ±<0.1% , number 7,100,386 ±63,330 |
| Walk | 2.1% ±0.3% , number 20,477 ±3,242 | 2.4% ±<0.1% , number 4,016,469 ±41,070 |
| Work from home | 10.1% ±0.7% , number 96,305 ±7,131 | 12.9% ±0.1% , number 21,288,393 ±105,700 |
| Other | 1.8% ±0.3% , number 17,213 ±2,661 | 1.7% ±<0.1% , number 2,799,658 ±41,510 |
Embed
Time spent getting to work
Source: ACS 2025 1-year, table B09001.
Show data
| New Mexico | United States | |
|---|---|---|
| Under 10 minutes | 15.8% ±0.9% , number 135,995 ±7,888 | 12.0% ±0.1% , number 17,199,225 ±93,440 |
| 10 to 19 minutes | 33.9% ±1.3% , number 291,266 ±11,980 | 27.8% ±0.1% , number 40,059,540 ±137,700 |
| 20 to 29 minutes | 19.0% ±1.0% , number 163,595 ±8,777 | 21.0% ±0.1% , number 30,221,743 ±111,100 |
| 30 to 39 minutes | 14.4% ±0.9% , number 124,106 ±7,713 | 17.1% ±0.1% , number 24,659,138 ±103,800 |
| 40 to 59 minutes | 9.8% ±0.8% , number 83,880 ±6,947 | 12.6% ±0.1% , number 18,104,709 ±97,070 |
| 60 minutes or more | 7.0% ±0.6% , number 60,285 ±5,276 | 9.5% ±0.1% , number 13,681,705 ±84,440 |
Embed
Vehicles per household
Source: ACS 2025 1-year, table A10030.
Show data
| New Mexico | United States | |
|---|---|---|
| None | 5.4% ±0.5% , number 46,271 ±4,677 | 8.8% ±0.1% , number 11,781,997 ±77,240 |
| One | 32.4% ±1.2% , number 279,500 ±10,310 | 33.1% ±0.1% , number 44,424,682 ±160,700 |
| Two | 34.3% ±1.1% , number 295,815 ±10,120 | 36.0% ±0.1% , number 48,200,889 ±176,800 |
| Three or more | 28.0% ±1.1% , number 241,424 ±10,070 | 22.1% ±0.1% , number 29,655,854 ±113,300 |
Embed
All the numbers
| Indicator | New Mexico | US | Rank among states* | Table |
|---|---|---|---|---|
| Drive to work alone | 74.4% ±1.1% , number 711,092 ±13,330 | 69.8% ±0.1% , number 115,297,377 ±192,900 | 21st | A09005 |
| Take public transit | 0.9% ±0.2% , number 8,273 ±2,170 | 4.3% ±<0.1% , number 7,100,386 ±63,330 | 39th | A09005 |
| Work from home | 10.1% ±0.7% , number 96,305 ±7,131 | 12.9% ±0.1% , number 21,288,393 ±105,700 | 33rd | A09005 |
| Commute 30 minutes or more | 31.2% ±1.3% , number 268,271 ±11,640 | 39.2% ±0.1% , number 56,445,552 ±165,300 | 37th | B09001 |
| Households with no vehicle | 5.4% ±0.5% , number 46,271 ±4,491 | 8.8% ±<0.1% , number 11,781,997 ±64,240 | 35th | A10030 |
*1 is the highest. Population is ranked among all states, and the rest among those of 1,000 people or more, whose figures can be ranked. Ranks use 5-year estimates, the only ones covering every state, so they can differ slightly from the figures here.
Places
The largest cities in New Mexico
Population, from the latest estimates available. Figures cover the whole of each place.
Largest cities
- Albuquerque: 556,580
- Las Cruces: 116,970
- Rio Rancho: 114,415
- Santa Fe: 89,833
- Roswell: 47,638
- Farmington: 46,314
- Hobbs: 40,252
- Clovis: 37,942
Every county and place in New Mexico
Find any county, city, town, metro area, ZIP code, school district or district in New Mexico.
Counties
Each of the 33 counties with its population, from ACS 2020–2024 5-year estimates.
- Bernalillo County673,930
- Catron County3,743
- Chaves County64,217
- Cibola County26,845
- Colfax County12,322
- Curry County47,638
- De Baca County1,576
- Doña Ana County224,266
- Eddy County61,105
- Grant County27,775
- Guadalupe County4,381
- Harding County741
- Hidalgo County4,041
- Lea County73,733
- Lincoln County20,224
- Los Alamos County19,435
- Luna County25,611
- McKinley County70,431
- Mora County4,149
- Otero County68,816
- Quay County8,564
- Rio Arriba County40,070
- Roosevelt County18,928
- San Juan County120,942
- San Miguel County26,850
- Sandoval County153,604
- Santa Fe County156,105
- Sierra County11,500
- Socorro County16,200
- Taos County34,543
- Torrance County15,490
- Union County4,013
- Valencia County78,458
Cities, towns and other places
Each of the 495 with its population, from ACS 2020–2024 5-year estimates. Census-designated places are communities without a local government of their own, drawn by the Census Bureau so they can be counted.
- Abiquiu40
- Acomita Lake590
- Adelino686
- Agua Fria2,898
- Alamillo247
- Alamo246
- Alamogordo31,307
- Albuquerque562,218
- Alcalde285
- Algodones1,479
- Alma52
- Angel Fire1,111
- Angustura1,997
- Animas186
- Anthony8,767
- Anton Chico276
- Anzac Village185
- Apache Creek22
- Aragon65
- Arenas Valley1,247
- Arrey491
- Arroyo Hondo (Santa Fe County)135
- Arroyo Hondo (Taos County)74
- Arroyo Seco2,112
- Artesia12,576
- Atoka1,347
- Aztec6,150
- Barton1,302
- Bayard2,057
- Becenti235
- Beclabito212
- Belen7,450
- Bent10
- Berino1,454
- Bernalillo9,086
- Black Hat2
- Black Rock1,125
- Blanco492
- Bloomfield7,395
- Bluewater275
- Bluewater Village133
- Boles Acres1,848
- Borrego Pass129
- Bosque Farms4,071
- Brimhall Nizhoni367
- Broadview296
- Buckhorn76
- Butterfield Park1,119
- Caballo233
- Cañada de los Alamos315
- Candy Kitchen180
- Canjilon185
- Cannon AFB2,405
- Cañon436
- Cañoncito1,253
- Cañones57
- Canova452
- Capitan1,191
- Capulin79
- Carlsbad31,746
- Carnuel877
- Carrizozo854
- Casa Colorada351
- Casas Adobes195
- Catalpa Canyon302
- Causey122
- Cedar Crest886
- Cedar Grove901
- Cedar Hill902
- Cedro372
- Center Point2,286
- Chama776
- Chamberino580
- Chamisal300
- Chamita867
- Chamizal35
- Chaparral18,186
- Chical141
- Chili209
- Chilili46
- Chimayo2,390
- Chupadero334
- Church Rock1,381
- Cimarron701
- Clayton2,753
- Cliff106
- Cloudcroft630
- Clovis37,942
- Cochiti680
- Cochiti Lake476
- Columbus1,196
- Conchas Dam282
- Conejo555
- Continental Divide231
- Cordova389
- Corona168
- Corrales8,555
- Costilla450
- Cotton City286
- Coyote64
- Crestview580
- Crouch Mesa4,812
- Crownpoint2,882
- Cruzville22
- Crystal287
- Cuartelez1,512
- Cuba462
- Cundiyo18
- Cuyamungue509
- Cuyamungue Grant376
- Datil17
- Deer Canyon29
- Deming15,221
- Des Moines174
- Dexter1,128
- Dixon1,623
- Doña Ana868
- Dora44
- Dulce3,218
- Eagle Nest451
- East Pecos643
- Edgewood6,124
- Edith Enclave185
- El Cerro2,923
- El Cerro Mission5,323
- El Duende454
- El Morro Valley53
- El Rancho1,451
- El Rito1,102
- El Valle de Arroyo Seco1,293
- Eldorado at Santa Fe5,619
- Elephant Butte1,790
- Elida165
- Encantado175
- Encino31
- Ensenada225
- Escudilla Bonita48
- Española10,473
- Estancia1,432
- Eunice3,015
- Fairacres616
- Farmington46,314
- Flora Vista2,770
- Floyd134
- Folsom11
- Fort Sumner938
- Fort Wingate726
- Fruitland574
- Galisteo231
- Gallina318
- Gallup21,023
- Gamerco1,176
- Garfield85
- Gila366
- Gila Hot Springs10
- Glen Acres247
- Glenwood160
- Glorieta385
- Golden20
- Golden Acres62
- Grady99
- Grants8,951
- Grenville56
- Hachita14
- Hagerman849
- Hanover263
- Happy Valley845
- Hatch1,588
- Haystack250
- Hernandez769
- High Rolls1,313
- Highland Meadows405
- Hillsboro150
- Hobbs40,252
- Holloman AFB4,433
- Homer C Jones2
- Hope49
- Hot Springs Landing110
- House91
- Hurley1,044
- Hyde Park189
- Indian Hills622
- Isleta1,043
- Iyanbito1,233
- Jacona412
- Jaconita268
- Jal2,364
- Jamestown439
- Jarales2,144
- Jemez Pueblo2,199
- Jemez Springs284
- Keeler Farm1,376
- Kirtland465
- Kirtland AFB3,413
- La Bajada11
- La Boca78
- La Cienega3,543
- La Cueva (Sandoval County)162
- La Cueva (Santa Fe County)778
- La Hacienda640
- La Huerta1,288
- La Jara176
- La Joya159
- La Luz1,797
- La Madera (Rio Arriba County)171
- La Madera (Sandoval County)532
- La Mesa473
- La Mesilla2,697
- La Plata2,233
- La Puebla715
- La Tierra315
- La Union1,071
- La Villita1,534
- Laguna459
- Lake Arthur478
- Lake Sumner86
- Lake Valley83
- Lamy294
- Las Campanas2,119
- Las Cruces114,197
- Las Maravillas1,594
- Las Nutrias64
- Las Palomas304
- Las Tusas999
- Las Vegas13,000
- Lee Acres4,272
- Lemitar316
- Lindrith111
- Little Walnut Village1,445
- Livingston Wheeler460
- Llano del Medio109
- Lobo Canyon492
- Loco Hills72
- Logan740
- Lordsburg2,057
- Los Alamos13,317
- Los Cerrillos241
- Los Chaves4,838
- Los Luceros1,136
- Los Lunas18,618
- Los Ojos23
- Los Ranchos de Albuquerque5,857
- Loving1,357
- Lovington11,498
- Luis Lopez53
- Lumberton130
- Luna72
- Lybrook21
- Madrid292
- Madrone295
- Magdalena976
- Malaga309
- Manuelito27
- Manzano Springs7
- Maxwell331
- Mayhill38
- McCartys Village723
- McIntosh1,943
- Meadow Lake4,259
- Medanales280
- Melrose447
- Mescalero832
- Mesilla1,717
- Mesita514
- Mesquite675
- Middle Frisco70
- Middle Mesa198
- Midway541
- Milan2,327
- Mimbres330
- Mogollon8
- Monterey Park667
- Monument432
- Mora520
- Moriarty2,102
- Morningside103
- Mosquero25
- Mount Taylor335
- Mountain View (Cibola County)48
- Mountainair1,178
- Nadine271
- Nageezi327
- Nakaibito251
- Nambe2,035
- Napi Headquarters717
- Nara Visa151
- Naschitti361
- Navajo2,181
- Navajo Dam269
- Nenahnezad406
- Newcomb415
- Newkirk32
- Nogal80
- North Acomita Village282
- North Hobbs6,034
- North Hurley166
- North Light Plant579
- North San Ysidro210
- North Valley10,455
- Oasis75
- Ohkay Owingeh1,194
- Ojo Amarillo411
- Ojo Encino470
- Ojo Sarco112
- Organ152
- Orogrande9
- Paa-Ko743
- Paguate226
- Pajarito Mesa83
- Paradise Hills4,591
- Paraje1,333
- Pastura2
- Peak Place427
- Pecan Park575
- Pecos1,204
- Peña Blanca568
- Peñasco546
- Peralta3,404
- Picacho Hills2,002
- Picuris Pueblo50
- Pie Town147
- Pinedale575
- Pinehaven8
- Pinehill664
- Pinos Altos113
- Placitas (Doña Ana County)516
- Placitas (Sandoval County)4,223
- Playas16
- Pleasanton259
- Pojoaque2,327
- Polvadera1,033
- Ponderosa289
- Ponderosa Pine1,442
- Portales11,968
- Prewitt1,027
- Pueblito41
- Pueblitos595
- Pueblo86
- Pueblo of Sandia Village416
- Pueblo Pintado187
- Puerto de Luna378
- Pulpotio Bareas221
- Punta de Agua46
- Purty Rock133
- Quemado100
- Questa2,466
- Radium Springs1,908
- Ramah407
- Rancho Grande254
- Ranchos de Taos2,536
- Raton6,026
- Red River450
- Regina31
- Reserve402
- Ribera162
- Rincon271
- Rio Chiquito187
- Rio Communities4,925
- Rio en Medio69
- Rio Lucio485
- Rio Rancho108,515
- Rio Rancho Estates1,571
- Rivers48
- Rock Springs1,013
- Rodeo18
- Rosedale252
- Roswell47,638
- Rowe516
- Roy302
- Ruidoso7,699
- Ruidoso Downs2,655
- Sacramento246
- Sagar197
- Salem916
- San Acacia176
- San Antonio89
- San Antonito (Bernalillo County)688
- San Antonito (Socorro County)142
- San Cristobal203
- San Felipe Pueblo1,119
- San Fidel79
- San Ildefonso Pueblo737
- San Jon102
- San Jose (Rio Arriba County)776
- San Jose (San Miguel County)87
- San Lorenzo219
- San Mateo602
- San Miguel772
- San Pablo696
- San Pedro172
- San Rafael1,039
- San Ysidro CDP2,118
- San Ysidro village146
- Sandia Heights3,160
- Sandia Knolls1,445
- Sandia Park333
- Sanostee214
- Santa Ana Pueblo1,026
- Santa Clara1,809
- Santa Clara Pueblo733
- Santa Cruz228
- Santa Fe89,019
- Santa Fe Foothills779
- Santa Rosa2,462
- Santa Teresa6,041
- Santo Domingo Pueblo2,370
- Sausal602
- Seama538
- Seboyeta517
- Sedillo565
- Sena155
- Seton Village101
- Sheep Springs360
- Shiprock7,610
- Silver City9,536
- Skyline-Ganipa1,226
- Socorro8,481
- Soham60
- Sombrillo168
- South Acomita Village294
- South River1,810
- South Valley37,120
- Spencerville1,264
- Springer1,017
- Stanley185
- Sullivan463
- Sundance585
- Sunland Park17,463
- Sunlit Hills899
- Sunshine524
- Tajique130
- Talpa955
- Tano Road1,586
- Taos6,458
- Taos Pueblo1,129
- Taos Ski Valley65
- Tatum598
- Tecolote126
- Tecolotito465
- Tesuque1,079
- Tesuque Pueblo325
- Texico967
- Thoreau1,973
- Thunder Mountain1,366
- Tierra Amarilla429
- Tijeras524
- Timberlake110
- Timberon479
- Tohatchi750
- Tome1,723
- Torreon (Sandoval County)580
- Torreon (Torrance County)125
- Tortugas381
- Totah Vista235
- Tres Arroyos1,926
- Trout Valley19
- Truchas528
- Truth or Consequences6,019
- Tse Bonito93
- Tucumcari5,160
- Tularosa2,597
- Turley117
- Twin Forks310
- Twin Lakes893
- Tyrone814
- University Park2,782
- Upper Fruitland1,457
- Vadito264
- Vado2,895
- Valencia (Santa Fe County)42
- Valencia (Valencia County)2,406
- Valle Vista729
- Vanderwagen61
- Vaughn493
- Veguita157
- Velarde229
- Ventura603
- Villanueva283
- Virden175
- Wagon Mound557
- Waterflow1,140
- Watrous42
- West Hammond2,236
- White Cliffs581
- White Rock5,716
- White Sands1,609
- White Signal177
- Willard248
- Williams Acres643
- Williamsburg466
- Windmill58
- Yah-ta-hey507
- Youngsville44
- Zia Pueblo770
- Zuni Pueblo5,864
Metro and micro areas
Each of the 17 that reach into New Mexico, with its whole population, from ACS 2020–2024 5-year estimates. Metro and micro areas are counties tied together by commuting, drawn by the Office of Management and Budget.
- Alamogordo, NM Micro Area68,816
- Albuquerque, NM Metro Area921,482
- Carlsbad-Artesia, NM Micro Area61,105
- Clovis, NM Micro Area66,566
- Deming, NM Micro Area25,611
- Española, NM Micro Area40,070
- Farmington, NM Metro Area120,942
- Gallup, NM Micro Area70,431
- Hobbs, NM Micro Area73,733
- Las Cruces, NM Metro Area224,266
- Las Vegas, NM Micro Area30,999
- Los Alamos, NM Micro Area19,435
- Roswell, NM Micro Area64,217
- Ruidoso, NM Micro Area20,224
- Santa Fe, NM Metro Area156,105
- Silver City, NM Micro Area27,775
- Taos, NM Micro Area34,543
ZIP codes
Each of the 356 with people in it, by the town it's centered in, from ACS 2020–2024 5-year estimates. These are the Census Bureau's ZIP Code Tabulation Areas, which follow the Postal Service's ZIP codes as closely as census blocks allow.
- 87001San Felipe Pueblo3,560
- 87002Belen21,265
- 87004Bernalillo11,237
- 87005Bluewater Village133
- 87006Las Nutrias1,313
- 87007Laguna1,871
- 87008Sandia Park2,520
- 87010Madrid1,135
- 8701116
- 87012Coyote321
- 87013Ojo Encino5,251
- 87014Paguate517
- 87015Edgewood14,443
- 87016Estancia2,421
- 87017Gallina350
- 87018Lybrook561
- 87020San Rafael11,966
- 87021Milan2,871
- 87022Isleta818
- 87023Jarales306
- 87024Cañon2,692
- 87025La Cueva1,299
- 87026Highland Meadows1,567
- 87027La Jara237
- 87028La Joya159
- 87029Lindrith237
- 87031El Cerro47,514
- 87032McIntosh73
- 87034Skyline-Ganipa3,507
- 87035Moriarty7,539
- 87036Deer Canyon1,927
- 87037Nageezi1,481
- 87038Laguna127
- 87040Paguate226
- 87041Cochiti691
- 87042Peralta3,410
- 87043Placitas4,223
- 87044Ponderosa289
- 87045Prewitt2,608
- 87046Gallina94
- 87047La Madera5,402
- 87048Corrales9,069
- 87049San Fidel79
- 87051San Rafael374
- 87052Santo Domingo Pueblo3,465
- 87053San Ysidro village916
- 87056Stanley1,084
- 87059Ponderosa Pine10,241
- 87060Tome10
- 87061Torreon291
- 87062Las Nutrias1,922
- 87063Willard265
- 87064Youngsville224
- 87068Chical5,432
- 87072Cochiti789
- 87083Cochiti Lake476
- 87102Albuquerque20,123
- 87104Albuquerque12,853
- 87105South Valley54,367
- 87106Albuquerque26,953
- 87107Albuquerque27,566
- 87108Albuquerque36,331
- 87109Albuquerque39,324
- 87110Albuquerque39,685
- 87111Albuquerque57,085
- 87112Albuquerque44,250
- 87113Albuquerque16,074
- 87114Paradise Hills70,117
- 87116Kirtland AFB3,865
- 87117Kirtland AFB26
- 87120Albuquerque66,097
- 87121Pajarito Mesa75,510
- 87122Sandia Heights18,578
- 87123Carnuel42,252
- 87124Rio Rancho Estates58,499
- 87144Rio Rancho51,837
- 87151Pajarito Mesa1,261
- 87301Gallup21,755
- 87305Pinehaven1,952
- 87310Brimhall Nizhoni977
- 87311Pinedale4,659
- 87312Continental Divide654
- 87313Becenti4,971
- 87315130
- 87316Fort Wingate1,979
- 87317Gamerco1,753
- 87319Purty Rock2,496
- 87320Nakaibito597
- 87321Mountain View2,115
- 87322Sundance545
- 87323Thoreau4,245
- 87325Naschitti2,178
- 87326Sagar2,489
- 87327Black Rock7,144
- 87328Crystal3,043
- 87347Jamestown448
- 87357Pinehill1,818
- 87364Sheep Springs1,632
- 87365Borrego Pass9
- 87375Twin Lakes4,481
- 87401Farmington45,229
- 87402Farmington11,418
- 87410Center Point15,012
- 87412779
- 8741314,296
- 87415Flora Vista2,273
- 87416Ojo Amarillo4,546
- 87417Kirtland6,624
- 87418La Plata686
- 87419Navajo Dam458
- 87420Beclabito10,586
- 87421Waterflow1,468
- 87455Newcomb1,480
- 87461Sanostee1,307
- 87499903
- 87501Hyde Park16,007
- 87505Santa Fe Foothills32,092
- 87506Tesuque Pueblo16,372
- 87507Santa Fe51,386
- 87508Eldorado at Santa Fe18,518
- 87510Canjilon979
- 87511Los Luceros3,108
- 87512372
- 87513Arroyo Hondo811
- 87514Arroyo Seco1,589
- 87515Canjilon333
- 87516Cañones68
- 87517388
- 87519Questa798
- 87520Chama1,148
- 875211,261
- 87522Cundiyo2,595
- 87523Cordova389
- 87524Costilla450
- 87525Taos Ski Valley65
- 87527Ojo Sarco1,534
- 875283,756
- 87529Arroyo Hondo4,538
- 87530El Rito1,102
- 87531Dixon144
- 87532Santa Clara Pueblo18,948
- 87535Glorieta1,467
- 87537Medanales2,038
- 87538North San Ysidro467
- 87539La Madera250
- 87540Galisteo1,117
- 87543Peñasco288
- 87544White Rock13,598
- 87547White Rock5,837
- 87548Medanales1,024
- 87549La Madera933
- 87551Tierra Amarilla219
- 87552East Pecos2,377
- 87553Picuris Pueblo1,260
- 87556Questa3,008
- 87557Talpa4,904
- 87558Red River1,064
- 87560Pueblo1,694
- 87562Rowe569
- 87564San Cristobal203
- 87565North San Ysidro147
- 87566Pueblito2,684
- 87567Cuartelez2,003
- 87569Sena389
- 87571Taos11,531
- 8757318
- 87575Tierra Amarilla938
- 87577711
- 87578Truchas528
- 875791,184
- 87580Arroyo Seco245
- 87582Canova899
- 87583Villanueva308
- 8770117,339
- 87710Angel Fire1,519
- 87711Tecolotito1,033
- 87712397
- 87713158
- 87714Cimarron784
- 87715Mora63
- 87718Eagle Nest542
- 87722742
- 87723Mora224
- 87724Llano del Medio9
- 87728Maxwell414
- 8772996
- 8773060
- 87731355
- 87732Mora1,505
- 87733Mosquero70
- 87734115
- 8773583
- 87736Mora91
- 877407,078
- 87742Mora321
- 87743475
- 877451,553
- 87746134
- 87747Springer1,723
- 87752Wagon Mound642
- 87753Watrous42
- 878019,291
- 87820Aragon135
- 878211,030
- 87823Polvadera441
- 87824Luna152
- 878251,489
- 87827Pie Town147
- 87828Polvadera1,068
- 87829602
- 87830Reserve818
- 87831San Acacia423
- 87832San Antonito265
- 879016,378
- 87930Arrey718
- 87931Oasis703
- 87935Truth or Consequences2,094
- 87936Garfield214
- 87937Placitas2,990
- 87939206
- 87940Rincon393
- 87941Salem988
- 87942Las Palomas1,005
- 87943191
- 88001Las Cruces37,690
- 88002White Sands1,609
- 88003University Park404
- 88004Picacho Hills1,080
- 88005Picacho Hills27,509
- 88007Radium Springs26,254
- 88008Santa Teresa12,623
- 88009Playas16
- 88011Organ33,064
- 8801233,158
- 88020743
- 88021Chamberino16,298
- 88022Arenas Valley1,326
- 88023North Hurley2,057
- 88024Berino431
- 88025Buckhorn92
- 88026Bayard1,604
- 88027Chamberino580
- 88028Buckhorn219
- 88029Columbus1,198
- 88030La Hacienda24,413
- 8803428
- 88038580
- 88039859
- 8804014
- 88041San Lorenzo925
- 88042Hillsboro205
- 88043Hurley1,210
- 880442,618
- 88045Lordsburg3,303
- 88046Mesilla656
- 88047Mesquite1,660
- 88048Vado3,247
- 88049Trout Valley807
- 88051360
- 88052Organ152
- 88053Pinos Altos113
- 88056Rodeo141
- 88061White Signal17,464
- 88063Sunland Park10,881
- 88065Tyrone814
- 88072Vado2,608
- 8808119,663
- 88101Clovis44,846
- 88103Cannon AFB16
- 88112272
- 88113Causey110
- 8811412
- 88115Dora10
- 88116394
- 88118Floyd329
- 881191,444
- 88120Grady267
- 88121House165
- 88124Melrose891
- 881255
- 88126Dora7
- 88130Portales17,842
- 88132Causey221
- 8813457
- 881351,500
- 88136118
- 8820127,524
- 8820328,753
- 8821018,542
- 8822039,828
- 88230Dexter4,336
- 88231Eunice3,255
- 882322,838
- 8824041,557
- 88242North Hobbs8,472
- 88244Hobbs1,105
- 88250153
- 882522,364
- 88253901
- 88255Loco Hills72
- 882561,935
- 88260Lovington15,160
- 8826220
- 88263Malaga309
- 882649
- 88265Monument432
- 88267Tatum1,347
- 88301Carrizozo1,197
- 88310Boles Acres36,983
- 88311Boles Acres493
- 88312Ruidoso3,287
- 88314Bent10
- 883162,194
- 88317Cloudcroft2,077
- 88318Corona321
- 88321Encino373
- 88324Ruidoso Downs18
- 88325High Rolls1,370
- 88330Holloman AFB4,433
- 88336421
- 88337La Luz1,859
- 88338246
- 88339603
- 883403,590
- 88341Nogal653
- 88342Orogrande9
- 88343125
- 8834444
- 88345Ruidoso7,835
- 88346Ruidoso Downs3,191
- 88347Sacramento246
- 88348279
- 88350Timberon479
- 88351159
- 88352Tularosa4,124
- 88353529
- 88354Sacramento29
- 88355Ruidoso293
- 88401Tucumcari6,818
- 8841045
- 8841176
- 88414Capulin137
- 884153,178
- 88416Conchas Dam282
- 88417Newkirk116
- 88418536
- 8841961
- 88422117
- 8842489
- 88426837
- 88427139
- 88430Nara Visa250
- 88431164
- 88434San Jon218
- 88435Santa Rosa3,343
- 8843625
School districts
Each of the 89 with people in it, from ACS 2020–2024 5-year estimates.
- Alamogordo Public Schools45,322
- Albuquerque Public Schools679,278
- Animas Public Schools813
- Artesia Public Schools19,089
- Aztec Municipal Schools16,671
- Belen Consolidated Schools28,976
- Bernalillo Public Schools24,647
- Bloomfield Municipal Schools15,517
- Capitan Municipal Schools4,587
- Carlsbad Municipal Schools40,087
- Carrizozo Municipal Schools1,326
- Central Consolidated Schools29,346
- Chama Valley Independent Schools2,665
- Cimarron Public Schools2,914
- Clayton Public Schools3,272
- Cloudcroft Municipal Schools3,422
- Clovis Municipal Schools44,690
- Cobre Consolidated Schools7,177
- Corona Municipal Schools403
- Cuba Independent Schools4,471
- Deming Public Schools25,611
- Des Moines Municipal Schools741
- Dexter Consolidated Schools3,848
- Dora Consolidated Schools523
- Dulce Independent Schools4,022
- Elida Municipal Schools294
- Española Municipal Schools36,215
- Estancia Municipal Schools3,264
- Eunice Municipal Schools3,255
- Farmington Municipal Schools59,408
- Floyd Municipal Schools664
- Fort Sumner Municipal Schools1,576
- Gadsden Independent Schools68,400
- Gallup-McKinley County Schools63,287
- Grady Municipal Schools468
- Grants-Cibola County Schools26,715
- Hagerman Municipal Schools2,070
- Hatch Valley Municipal Schools4,604
- Hobbs Municipal Schools50,915
- Hondo Valley Public Schools922
- House Municipal Schools337
- Jal Public Schools2,364
- Jemez Mountain Public Schools1,783
- Jemez Valley Public Schools5,614
- Lake Arthur Municipal Schools640
- Las Cruces Public Schools163,785
- Las Vegas City Public Schools11,751
- Logan Municipal Schools1,089
- Lordsburg Municipal Schools3,228
- Los Alamos Public Schools19,435
- Los Lunas Public Schools52,675
- Loving Municipal Schools1,985
- Lovington Public Schools15,690
- Magdalena Municipal Schools1,489
- Maxwell Municipal Schools414
- Melrose Public Schools1,013
- Mesa Vista Consolidated Schools2,694
- Mora Independent Schools3,350
- Moriarty Municipal Schools23,737
- Mosquero Municipal Schools108
- Mountainair Public Schools1,917
- Pecos Independent Schools3,753
- Peñasco Independent Schools3,993
- Pojoaque Valley Public Schools10,142
- Portales Municipal Schools17,327
- Quemado Independent Schools1,902
- Questa Independent Schools5,692
- Raton Public Schools7,051
- Reserve Independent Schools1,971
- Rio Rancho Public Schools110,317
- Roswell Independent Schools57,603
- Roy Municipal Schools573
- Ruidoso Municipal Schools13,061
- San Jon Municipal Schools353
- Santa Fe Public Schools128,841
- Santa Rosa Consolidated Schools4,376
- Silver City Consolidated Schools20,598
- Socorro Consolidated Schools11,469
- Springer Municipal Schools1,943
- Taos Municipal Schools24,051
- Tatum Municipal Schools1,509
- Texico Municipal Schools1,633
- Truth or Consequences Schools11,500
- Tucumcari Public Schools6,799
- Tularosa Municipal Schools7,549
- Vaughn Municipal Schools904
- Wagon Mound Public Schools757
- West Las Vegas Public Schools10,862
- Zuni Public Schools7,144
Congressional districts
As drawn for the 119th Congress (2025–2027).
- Congressional District 1711,799
- Congressional District 2707,320
- Congressional District 3701,127
State senate districts
The upper chamber’s districts, as drawn in 2024.
- State Senate District 146,446
- State Senate District 246,932
- State Senate District 347,153
- State Senate District 447,247
- State Senate District 549,766
- State Senate District 649,952
- State Senate District 750,991
- State Senate District 849,597
- State Senate District 952,466
- State Senate District 1050,680
- State Senate District 1150,272
- State Senate District 1251,696
- State Senate District 1344,948
- State Senate District 1448,056
- State Senate District 1548,753
- State Senate District 1649,141
- State Senate District 1747,898
- State Senate District 1852,326
- State Senate District 1952,129
- State Senate District 2053,236
- State Senate District 2152,186
- State Senate District 2249,987
- State Senate District 2351,549
- State Senate District 2451,188
- State Senate District 2552,987
- State Senate District 2650,852
- State Senate District 2753,572
- State Senate District 2850,827
- State Senate District 2953,337
- State Senate District 3048,419
- State Senate District 3154,452
- State Senate District 3248,270
- State Senate District 3350,936
- State Senate District 3451,691
- State Senate District 3551,521
- State Senate District 3648,908
- State Senate District 3753,721
- State Senate District 3850,496
- State Senate District 3949,323
- State Senate District 4054,368
- State Senate District 4151,322
- State Senate District 4250,649
State house districts
The lower chamber’s districts, as drawn in 2024.
- State House District 129,889
- State House District 227,508
- State House District 327,115
- State House District 427,341
- State House District 527,347
- State House District 628,105
- State House District 731,266
- State House District 831,751
- State House District 927,846
- State House District 1030,318
- State House District 1129,112
- State House District 1231,425
- State House District 1329,348
- State House District 1428,461
- State House District 1530,476
- State House District 1630,964
- State House District 1731,185
- State House District 1829,909
- State House District 1930,345
- State House District 2030,523
- State House District 2130,977
- State House District 2233,448
- State House District 2332,642
- State House District 2431,436
- State House District 2530,505
- State House District 2631,377
- State House District 2731,262
- State House District 2830,358
- State House District 2932,089
- State House District 3030,428
- State House District 3131,405
- State House District 3230,955
- State House District 3335,287
- State House District 3430,788
- State House District 3530,328
- State House District 3630,932
- State House District 3728,899
- State House District 3829,767
- State House District 3929,110
- State House District 4029,126
- State House District 4129,527
- State House District 4231,324
- State House District 4328,796
- State House District 4430,303
- State House District 4531,938
- State House District 4631,273
- State House District 4730,733
- State House District 4829,113
- State House District 4929,624
- State House District 5028,755
- State House District 5131,736
- State House District 5230,021
- State House District 5333,319
- State House District 5430,327
- State House District 5531,209
- State House District 5631,012
- State House District 5734,657
- State House District 5828,111
- State House District 5931,120
- State House District 6029,170
- State House District 6129,192
- State House District 6231,833
- State House District 6331,658
- State House District 6430,203
- State House District 6530,952
- State House District 6628,648
- State House District 6730,393
- State House District 6830,384
- State House District 6925,851
- State House District 7027,711
PUMAs
Public Use Microdata Areas: areas of 100,000 people or more that the state draws from census tracts, for the Census Bureau’s microdata.
- Albuquerque Far NE PUMA101,808
- Albuquerque N Central PUMA99,298
- Albuquerque Near NE PUMA104,431
- Albuquerque NW PUMA130,340
- Albuquerque SE PUMA101,696
- Albuquerque SW PUMA109,539
- Doña Ana County (Outer) PUMA108,928
- Doña Ana County Central–Las Cruces, Mesilla Cities & University Park PUMA115,338
- Eastern New Mexico PUMA162,380
- Lea and Eddy County PUMA134,838
- North Central New Mexico PUMA125,047
- Northwest New Mexico Navajo Nation PUMA117,993
- San Juan County (NE)–Farmington, Bloomfield & Aztec Cities PUMA100,225
- Sandoval County New Mexico PUMA153,604
- Santa Fe County New Mexico PUMA145,485
- Southwest New Mexico PUMA177,910
- Valencia County, Torrance County & East Mountain PUMA131,386
Urban areas
Each that reaches into New Mexico, with its whole population. Urban areas are the densely settled land the Census Bureau draws after each census, whatever the city lines.
- Alamogordo, NM30,985
- Albuquerque, NM769,939
- Artesia, NM14,225
- Aztec, NM7,760
- Bayard, NM4,763
- Bloomfield, NM7,609
- Carlsbad, NM32,523
- Clovis, NM39,091
- Deming, NM15,179
- El Paso, TX–NM866,154
- Española, NM23,908
- Farmington, NM51,746
- Gallup, NM24,090
- Grants, NM9,430
- Hobbs, NM43,308
- Kirtland, NM5,723
- Las Cruces, NM141,131
- Las Vegas, NM13,773
- Los Alamos, NM13,312
- Los Lunas, NM56,935
- Lovington, NM11,555
- Portales, NM12,002
- Raton, NM5,695
- Roswell, NM49,039
- Ruidoso, NM10,962
- Santa Fe, NM94,356
- Shiprock, NM5,913
- Silver City, NM12,137
- Socorro, NM8,084
- Taos, NM14,121
- Truth or Consequences, NM7,774
- Tucumcari, NM5,340
- White Rock, NM5,180
Tribal areas
Each that reaches into New Mexico, with its whole population.
- Acoma Pueblo and Off-Reservation Trust Land, NM3,605
- Isleta Pueblo, NM4,523
- Jemez Pueblo, NM2,220
- Jicarilla Apache Nation Reservation and Off-Reservation Trust Land, NM3,626
- Laguna Pueblo and Off-Reservation Trust Land, NM3,227
- Mescalero Reservation, NM3,590
- Nambe Pueblo and Off-Reservation Trust Land, NM1,944
- Navajo Nation Reservation and Off-Reservation Trust Land, AZ–NM–UT161,008
- Ohkay Owingeh, NM6,434
- Picuris Pueblo, NM1,929
- Pueblo de Cochiti, NM1,704
- Pueblo of Pojoaque and Off-Reservation Trust Land, NM3,760
- San Felipe Pueblo, NM3,518
- San Ildefonso Pueblo and Off-Reservation Trust Land, NM2,165
- Sandia Pueblo and Off-Reservation Trust Land, NM4,847
- Santa Ana Pueblo, NM1,026
- Santa Clara Pueblo and Off-Reservation Trust Land, NM11,709
- Santo Domingo Pueblo, NM3,546
- Taos Pueblo and Off-Reservation Trust Land, NM4,761
- Tesuque Pueblo and Off-Reservation Trust Land, NM1,013
- Ute Mountain Reservation and Off-Reservation Trust Land, CO–NM–UT1,513
- Zia Pueblo and Off-Reservation Trust Land, NM770
- Zuni Reservation and Off-Reservation Trust Land, NM–AZ7,144
Turn New Mexico into your planning report.
Social Explorer Studio builds an editable profile of any place, with tables and charts beside the county and state, and exports to Word, PDF and Excel.
Questions about New Mexico
What is the population of New Mexico?
2,125,498 people, according to the ACS 2025 1-year estimates, which the Census Bureau adjusts to match its own population estimate. That’s the 36th largest of the 50 states and DC.
What is the FIPS code for New Mexico?
35. Every county’s and place’s FIPS code in New Mexico starts with it. The Census Bureau’s full geographic identifier (GEOID) is 0400000US35.
What is the largest city in New Mexico?
Albuquerque, with 556,580 people. Other large cities here include Las Cruces, Rio Rancho and Santa Fe.
What is the median household income in New Mexico?
$70,342 (±$1,508), according to the ACS 2025 1-year estimates, lower than the US ($84,780).
What is the median age in New Mexico?
40.6 years (±0.3), according to the ACS 2025 1-year estimates, higher than the US (39.5).
How much does housing cost in New Mexico?
New Mexico’s median home value is $293,400 (±$5,069) and its median gross rent is $1,145 (±$30) a month, according to the ACS 2025 1-year estimates. 43.4% (±2.4%) of its renters pay 30% or more of their income on rent.
Is New Mexico growing?
New Mexico’s population grew 1.9%, from 2,085,109 in 2015 to 2,125,498 in 2025, according to the ACS 1-year estimates.
Where do people who work in New Mexico live?
798,705 of its 845,081 jobs are held by people who live here. Of those who commute in, the most come from Texas, Arizona, Colorado.
Where does this census data come from?
The U.S. Census Bureau’s American Community Survey, through Social Explorer’s tables: the latest 1-year estimates where they exist, for the most recent numbers, and 5-year estimates otherwise. Each table lists its code, so you can find it again.
Is this data free to use?
Yes. You can read it, cite it, download the CSV and embed the charts, with no account. To map other variables, compare your own areas or build a report, see Social Explorer’s plans in a live demo.
Sources and how to cite
American Community Survey 2025 1-year estimates, or 2020–2024 5-year estimates where noted, U.S. Census Bureau, from Social Explorer’s tables A00001, A00002, A01004, A04001, A06001, A08001, A09005, A10001, A10003, A10008, A10030, A10036, A10040, A10047, A10055, A10060, A12001, A13004, A14006, A14024, A14028, A16002, A17005, A18002, A18009, A20001, B02002, B09001, B13002, B18101, C16001. Maps by census tract use 2020–2024 5-year estimates, since the 1-year survey doesn’t cover tracts. Commuting: LEHD LODES 2023. These are estimates from a sample, each with its margin of error. Data retrieved November 14, 2026. How these profiles are made.
U.S. Census Bureau, American Community Survey 2025 1-year estimates, or 2020–2024 5-year estimates where noted, via Social Explorer. “New Mexico.” https://www.socialexplorer.com/places/new-mexico. Accessed November 14, 2026.