

Idaho: Population, demographics and census data
Home to 2,029,733 people, the 38th largest of the 50 states and DC, anchored by Boise City and Meridian. It grew 22.6% between 2015 and 2025.
- Population
- 2.03M. Census Bureau estimate · Rank 38 of the 50 states and DC
- Median household income
- $84,234 ±$1,941. US $84,780
- Median age
- 37.9 ±0.3. US 39.5
ACS 2025 1-year estimates, U.S. Census Bureau
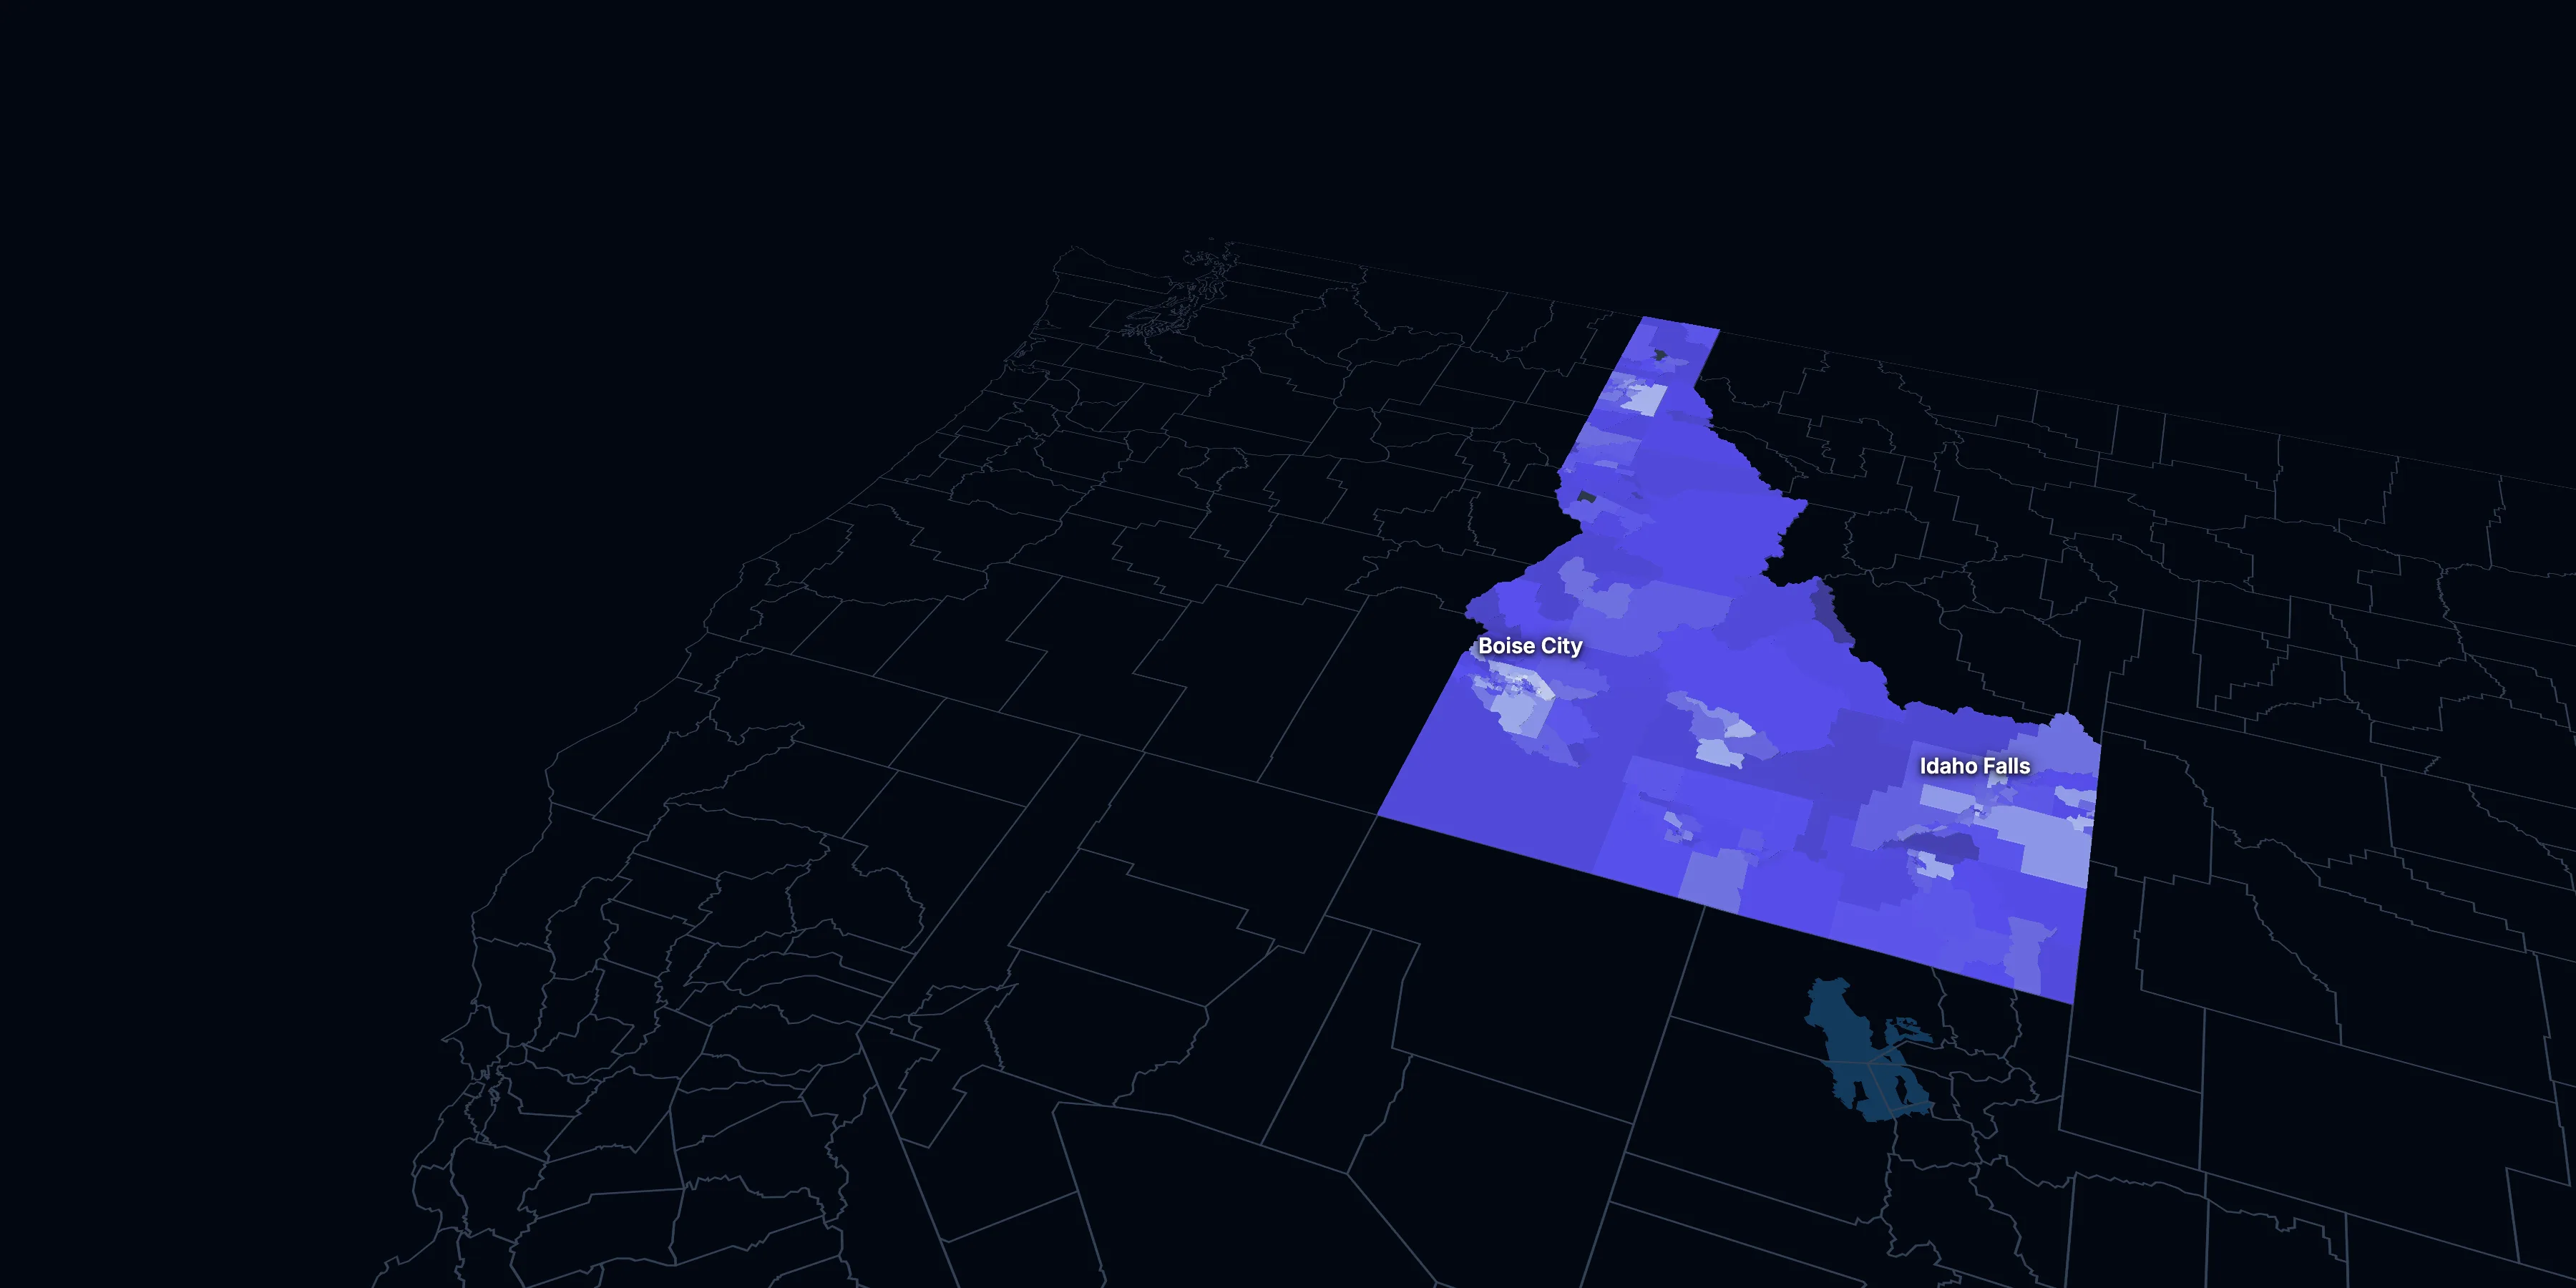
Taller, lighter tracts have higher household incomes
About Idaho
Idaho’s median household income is $84,234 (±$1,941), about the same as the US ($84,780), and its median age is 37.9 (±0.3), according to the ACS 2025 1-year estimates. Its largest city is Boise City.
± is each figure’s margin of error, at 90% confidence, and † marks one too uncertain to lean on. Under each percentage in the tables is the number it counts. How the margins are worked out.
FIPS code 16
Highlights
What stands out in Idaho
The numbers where Idaho sits furthest from the nation, or past a recognized policy benchmark.
Past a policy benchmark
+11 points
HighRent growth ahead of income
After inflation, rent grew 39% from 2015 to 2025, and household income 27%. The dots show rent growth.
Furthest from the national picture
6.0%
Very lowBorn outside the US
That’s lower than the US (14.7%).
10.9%
Very lowSpeak a language other than English at home
That’s lower than the US (22.9%).
29.0%
Lower than the USCommute 30 minutes or more
That’s lower than the US (39.2%).
23.2%
Higher than the USUnder 18
That’s higher than the US (21.0%). It’s the 5th highest of the 50 states and DC.
0.8%
2nd lowest among statesBlack, not Hispanic
That’s lower than the US (11.7%). It’s the 2nd lowest of the 50 states and DC.
2015 to 2025
How Idaho changed in ten years
The state added 374,803 people. It got older and better educated, and poverty fell 5.4 points.
Population, change since 2015
+22.6% in the state and +6.3% in the US.
Source: ACS 1-year, 2015 to 2025, table A00001.
Show data
| Idaho | United States | |
|---|---|---|
| 2015 | 0.0% | 0.0% |
| 2016 | +1.7% | +0.5% |
| 2017 | +3.7% | +1.3% |
| 2018 | +6.0% | +1.8% |
| 2019 | +8.0% | +2.1% |
| 2021 | +14.9% | +3.3% |
| 2022 | +17.2% | +3.7% |
| 2023 | +18.7% | +4.2% |
| 2024 | +20.9% | +5.8% |
| 2025 | +22.6% | +6.3% |
Embed
Median household income, in 2025 dollars
+27.4% in the state and +10.9% in the US.
Source: ACS 1-year, 2015 to 2025, table A14006.
Show data
| Idaho | United States | |
|---|---|---|
| 2015 | $66,138 | $76,413 |
| 2016 | $70,073 | $77,931 |
| 2017 | $69,151 | $79,891 |
| 2018 | $71,846 | $80,059 |
| 2019 | $77,444 | $83,427 |
| 2021 | $79,636 | $83,521 |
| 2022 | $80,629 | $82,811 |
| 2023 | $79,729 | $82,683 |
| 2024 | $83,886 | $84,339 |
| 2025 | $84,234 | $84,780 |
Embed
Living in poverty
−5.4 points in the state and −3.0 points in the US.
Source: ACS 1-year, 2015 to 2025, table A13004.
Show data
| Idaho | United States | |
|---|---|---|
| 2015 | 15.1% | 14.7% |
| 2016 | 14.4% | 14.0% |
| 2017 | 12.8% | 13.4% |
| 2018 | 11.8% | 13.1% |
| 2019 | 11.2% | 12.3% |
| 2021 | 11.0% | 12.8% |
| 2022 | 10.7% | 12.6% |
| 2023 | 10.1% | 12.5% |
| 2024 | 10.5% | 12.1% |
| 2025 | 9.7% | 11.8% |
Embed
Bachelor’s degree or more
+7.2 points in the state and +6.7 points in the US.
Source: ACS 1-year, 2015 to 2025, table A12001.
Show data
| Idaho | United States | |
|---|---|---|
| 2015 | 26.0% | 30.6% |
| 2016 | 27.6% | 31.3% |
| 2017 | 26.8% | 32.0% |
| 2018 | 27.7% | 32.6% |
| 2019 | 28.7% | 33.1% |
| 2021 | 30.7% | 35.0% |
| 2022 | 32.3% | 35.7% |
| 2023 | 32.1% | 36.2% |
| 2024 | 33.0% | 36.8% |
| 2025 | 33.2% | 37.4% |
Embed
Median gross rent, in 2025 dollars
+38.6% in the state and +18.5% in the US.
Source: ACS 1-year, 2015 to 2025, table A18009.
Show data
| Idaho | United States | |
|---|---|---|
| 2015 | $1,055 | $1,314 |
| 2016 | $1,069 | $1,327 |
| 2017 | $1,088 | $1,340 |
| 2018 | $1,096 | $1,368 |
| 2019 | $1,117 | $1,393 |
| 2021 | $1,240 | $1,427 |
| 2022 | $1,261 | $1,440 |
| 2023 | $1,336 | $1,496 |
| 2024 | $1,430 | $1,537 |
| 2025 | $1,462 | $1,557 |
Embed
Median home value, in 2025 dollars
+89.5% in the state and +39.3% in the US.
Source: ACS 1-year, 2015 to 2025, table A10036.
Show data
| Idaho | United States | |
|---|---|---|
| 2015 | $241,535 | $266,469 |
| 2016 | $256,178 | $277,278 |
| 2017 | $274,221 | $288,124 |
| 2018 | $301,303 | $296,908 |
| 2019 | $323,999 | $305,336 |
| 2021 | $442,420 | $337,116 |
| 2022 | $479,108 | $355,481 |
| 2023 | $455,978 | $361,931 |
| 2024 | $461,360 | $372,685 |
| 2025 | $457,800 | $371,100 |
Embed
ACS 1-year estimates. The dotted stretch of each line spans 2020, when the Census Bureau released no standard 1-year estimates. Dollar values are in 2025 dollars.
| Indicator | 2015 | 2025 | Change |
|---|---|---|---|
| Population | 1,654,930 | 2,029,733 | +22.6% |
| Median age | 35.8 | 37.9 | +2.1 years |
| 65 and over | 14.7% | 18.8% | +4.1 points |
| Born outside the US | 5.7% | 6.0% | +0.3 points |
| Hispanic or Latino | 12.1% | 14.6% | +2.5 points |
| Median household income | $66,138 | $84,234 | +27.4% |
| Living in poverty | 15.1% | 9.7% | −5.4 points |
| Bachelor’s degree or more | 26.0% | 33.2% | +7.2 points |
| Households that rent | 31.0% | 28.9% | −2.2 points |
| Median gross rent | $1,055 | $1,462 | +38.6% |
| Median home value | $241,535 | $457,800 | +89.5% |
456 census tracts
Idaho, tract by tract
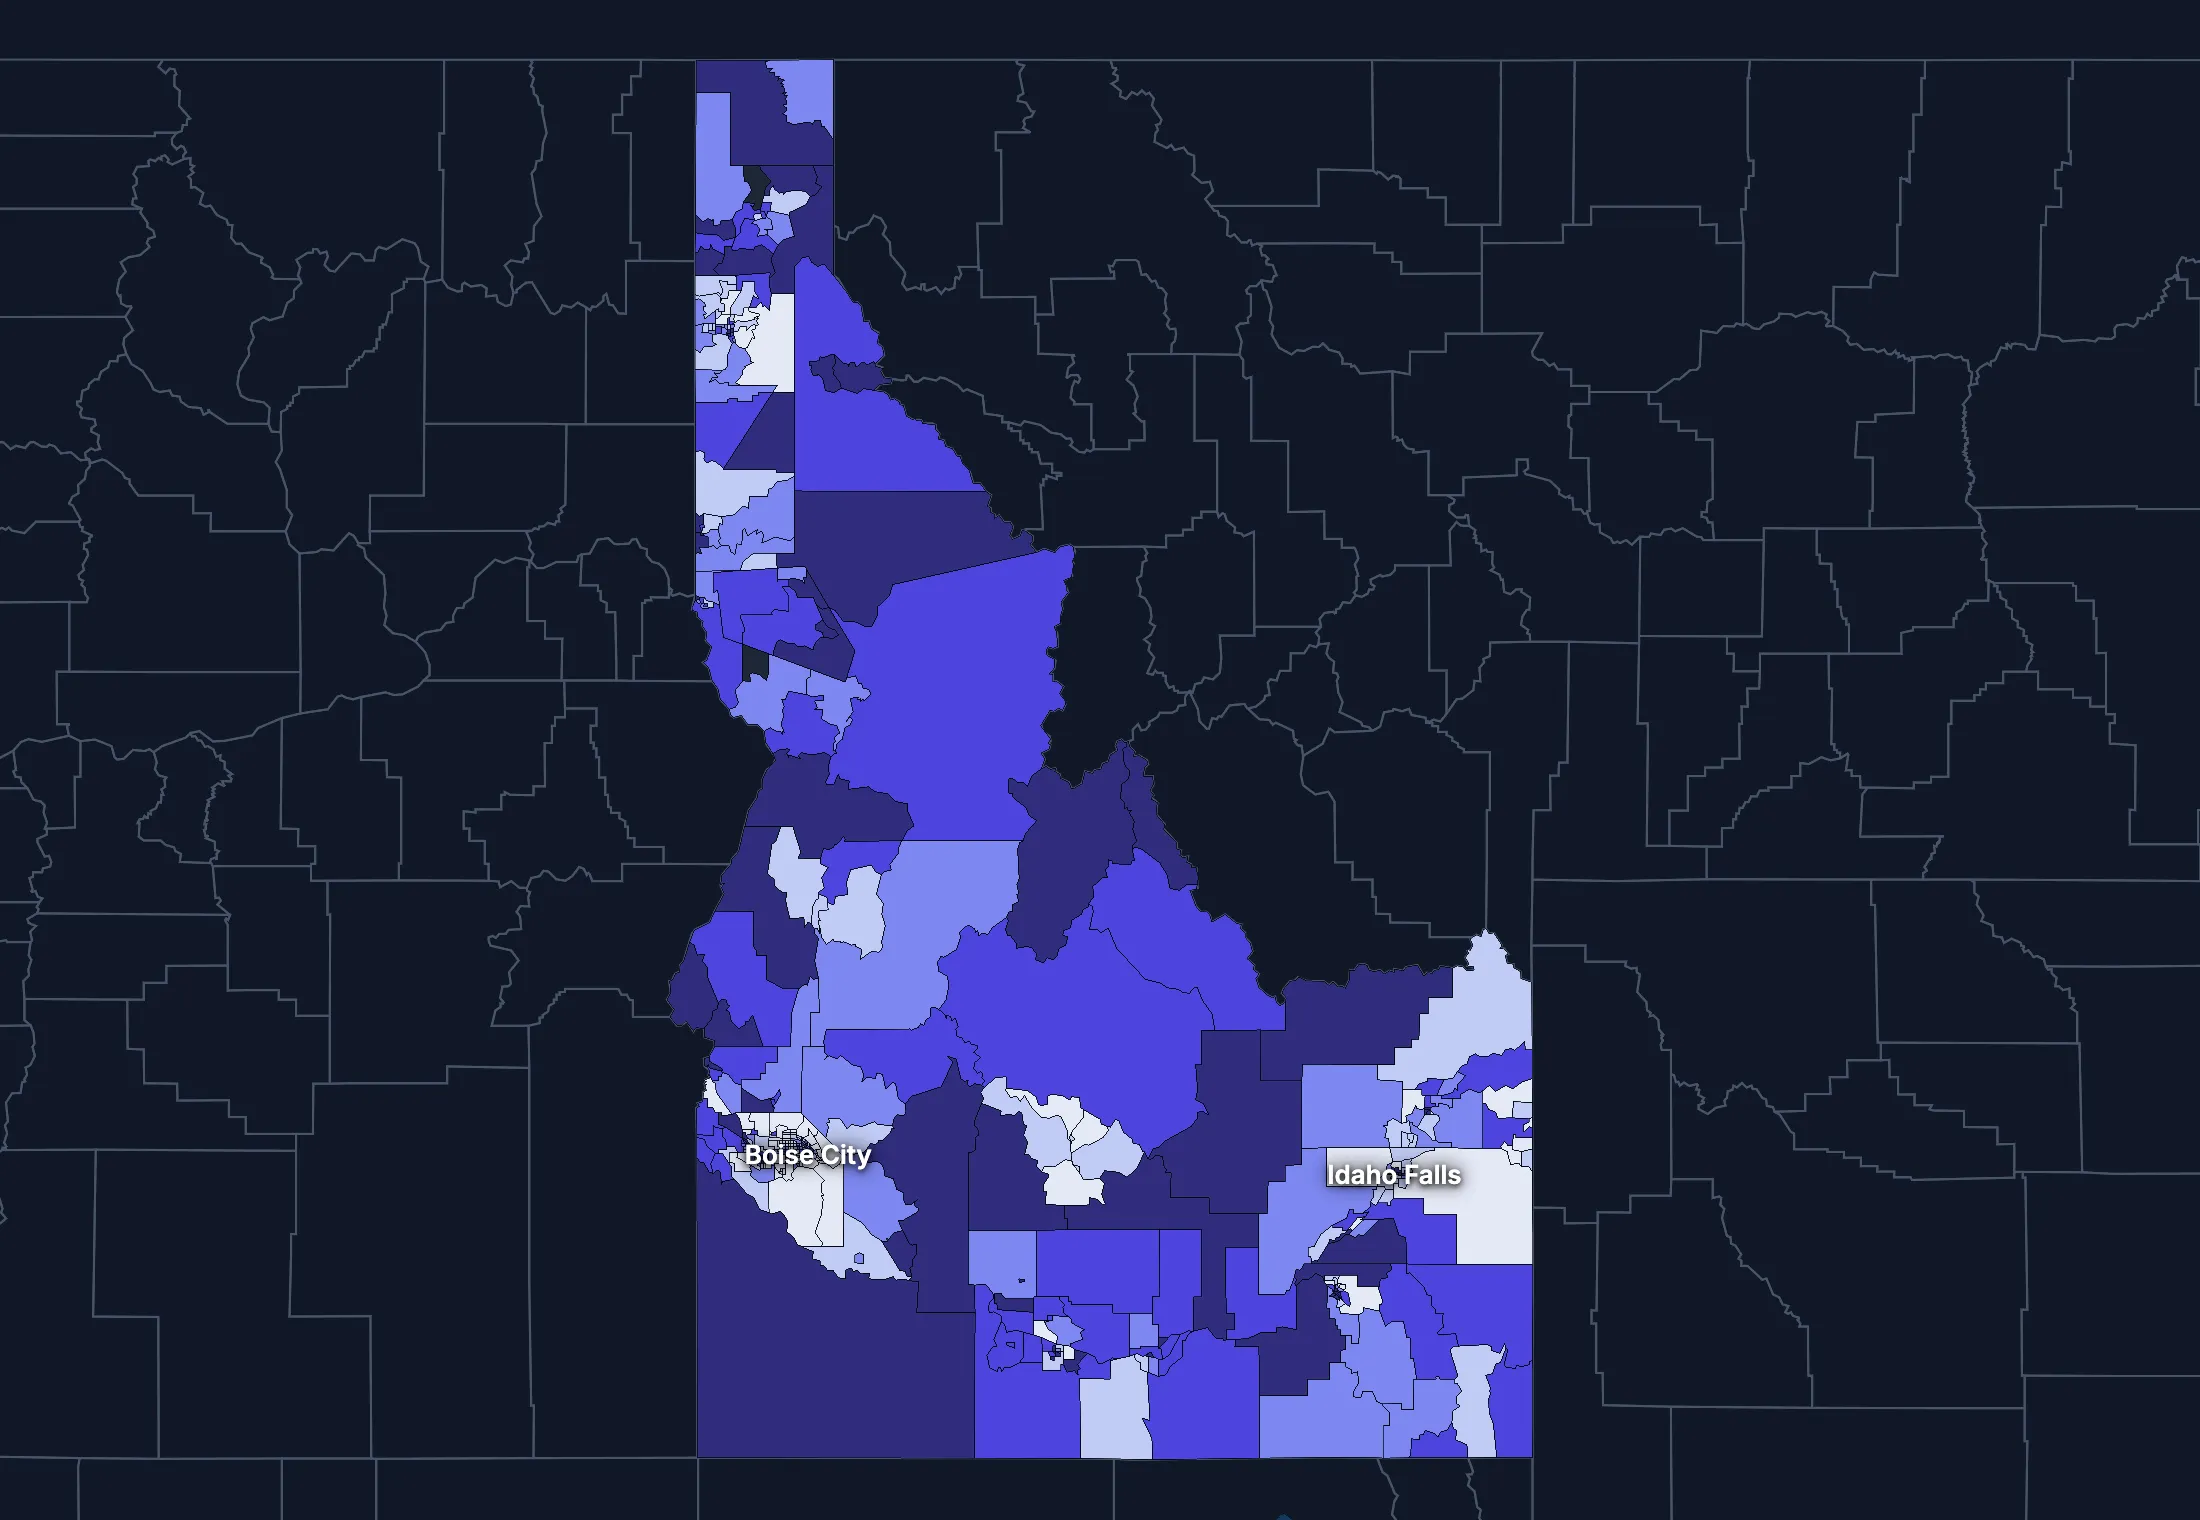
State averages hide a lot. These census tracts are the closest the census comes to neighborhoods.
Where the state’s average misleads
Each tick is one census tract, and the dark line marks the state. Hover over a tick or tap it to see the tract.
Poverty
75 of 455 tracts are at least 1.5 times the state’s overall 10.6%, and 113 are at two-thirds of it or less.
Highest: Tract 10.02, 73.2%. Lowest: Tract 9605.02, 0.0%.
Renters paying 30% or more of income
30 of 436 tracts are at least 1.5 times the state’s overall 43.5%, and 125 are at two-thirds of it or less.
Highest: Tract 219.05, 100.0%. Lowest: Tract 103.55, 0.0%.
Adults with a bachelor’s degree
74 of 455 tracts are at least 1.5 times the state’s overall 31.8%, and 120 are at two-thirds of it or less.
Highest: Tract 7.03, 79.7%. Lowest: Tract 213, 5.2%.
Median household income
43 of 454 tracts are at least 1.5 times the typical tract’s $78,515, and 44 are at two-thirds of it or less.
Highest: Tract 7.03, $200,652. Lowest: Tract 1.01, $22,048.
American Community Survey 2020–2024 5-year estimates, by census tract. Income is capped at $250,000+ by the Census Bureau.
People
Who lives in Idaho
Its median age of 37.9 is lower than the US (39.5). 6.0% of residents were born outside the US, and 10.9% speak a language other than English at home.
Age
Source: ACS 2025 1-year, table A01001.
Show data
| Idaho | United States | |
|---|---|---|
| Under 18 | 23.2% ±0.4% , number 471,848 ±8,469 | 21.0% ±<0.1% , number 71,689,151 ±111,800 |
| 18 to 24 | 9.9% ±0.3% , number 201,559 ±6,979 | 9.3% ±<0.1% , number 31,716,680 ±98,660 |
| 25 to 34 | 13.0% ±0.2% , number 263,102 ±4,509 | 13.6% ±<0.1% , number 46,357,354 ±55,690 |
| 35 to 44 | 12.8% ±0.4% , number 260,236 ±7,875 | 13.4% ±<0.1% , number 45,746,189 ±105,700 |
| 45 to 54 | 11.3% ±0.2% , number 228,891 ±4,139 | 11.8% ±<0.1% , number 40,257,563 ±53,540 |
| 55 to 64 | 10.9% ±0.3% , number 221,556 ±6,548 | 12.1% ±<0.1% , number 41,242,904 ±104,700 |
| 65 to 74 | 10.7% ±0.3% , number 218,078 ±5,894 | 10.8% ±<0.1% , number 36,895,650 ±91,520 |
| 75 and over | 8.1% ±0.3% , number 164,463 ±5,384 | 8.2% ±<0.1% , number 27,879,368 ±78,140 |
Embed
Race and ethnicity
Source: ACS 2025 1-year, table A04001.
Show data
| Idaho | United States | |
|---|---|---|
| White, not Hispanic | 76.0% ±0.3% , number 1,543,463 ±5,964 | 55.0% ±<0.1% , number 187,959,031 ±58,340 |
| Hispanic or Latino | 14.6% ±0.1% , number 296,546 ±1,044 | 20.5% ±<0.1% , number 69,975,516 ±13,270 |
| Black, not Hispanic | 0.8% ±0.1% , number 16,275 ±2,952 | 11.7% ±<0.1% , number 40,096,453 ±106,200 |
| Asian, not Hispanic | 1.6% ±0.2% , number 33,425 ±3,368 | 6.5% ±<0.1% , number 22,096,709 ±58,340 |
| Other or multiracial | 6.9% ±0.4% , number 140,024 ±8,392 | 6.3% ±<0.1% , number 21,657,150 ±150,100 |
Embed
Language spoken at home
Source: ACS 2025 1-year, table C16001.
Show data
| Idaho | United States | |
|---|---|---|
| English only | 89.1% ±0.6% , number 1,707,359 ±11,150 | 77.1% ±0.1% , number 249,390,588 ±275,300 |
| Spanish | 7.9% ±0.5% , number 152,040 ±9,416 | 13.9% ±0.1% , number 44,921,985 ±177,800 |
| Other Indo-European | 1.6% ±0.2% , number 29,855 ±4,243 | 4.0% ±<0.1% , number 12,862,980 ±113,500 |
| Asian and Pacific Island | 1.0% ±0.2% , number 19,133 ±3,113 | 3.8% ±<0.1% , number 12,288,841 ±99,740 |
| Arabic and other | 0.4% ±0.1% , number 7,035 ±1,963 | 1.3% ±<0.1% , number 4,116,949 ±71,480 |
Embed
Marital status
Source: ACS 2025 1-year, table A11001.
Show data
| Idaho | United States | |
|---|---|---|
| Now married | 55.2% ±0.6% , number 909,790 ±10,670 | 47.9% ±0.1% , number 135,567,564 ±223,300 |
| Never married | 27.7% ±0.5% , number 457,113 ±8,831 | 34.8% ±0.1% , number 98,647,238 ±152,600 |
| Divorced | 11.3% ±0.4% , number 186,793 ±6,765 | 10.2% ±<0.1% , number 28,879,967 ±112,900 |
| Widowed | 4.9% ±0.2% , number 80,086 ±3,962 | 5.5% ±<0.1% , number 15,599,094 ±69,430 |
| Separated | 0.9% ±0.1% , number 15,335 ±2,254 | 1.6% ±<0.1% , number 4,441,399 ±49,160 |
Embed
Where people lived a year ago
Source: ACS 2025 1-year, table A08001.
Show data
| Idaho | United States | |
|---|---|---|
| Same home | 86.6% ±0.7% , number 1,735,236 ±13,450 | 88.4% ±0.1% , number 298,889,697 ±214,800 |
| Same county | 6.5% ±0.5% , number 130,294 ±10,610 | 6.0% ±<0.1% , number 20,202,671 ±166,300 |
| Another county in the state | 2.8% ±0.3% , number 55,695 ±5,097 | 3.0% ±<0.1% , number 10,168,097 ±89,190 |
| Another state | 3.6% ±0.4% , number 72,603 ±7,810 | 2.1% ±<0.1% , number 7,025,589 ±81,660 |
| Another country | 0.5% ±0.1% , number 10,110 ±2,484 | 0.6% ±<0.1% , number 1,984,943 ±47,210 |
Embed
Top countries of birth, among those born abroad
Source: ACS 2020–2024 5-year, table A07001.
Show data
| Idaho | |
|---|---|
| Mexico | 47.9% , number 55,033 |
| Canada | 5.3% , number 6,061 |
| Philippines | 2.6% , number 3,018 |
| Germany | 2.5% , number 2,904 |
| Colombia | 2.1% , number 2,433 |
| India | 2.1% , number 2,396 |
Embed
All the numbers
| Indicator | Idaho | US | Rank among states* | Table |
|---|---|---|---|---|
| Population | 2,029,733 | 341,784,859 | 38th | A00001 |
| People per square mile | 25 | 97 | 45th | A00002 |
| Land area (square miles) | 82,645 | – | – | A00002 |
| Median age | 37.9 ±0.3 | 39.5 ±0.1 | 44th | A01004 |
| Under 18 | 23.2% ±0.4% , number 471,848 ±8,469 | 21.0% ±<0.1% , number 71,689,151 ±111,800 | 5th | B02002 |
| 65 and over | 18.8% ±0.4% , number 382,541 ±7,982 | 19.0% ±<0.1% , number 64,775,018 ±120,300 | 33rd | B02002 |
| Born outside the US | 6.0% ±0.4% , number 122,134 ±7,320 | 14.7% ±0.1% , number 50,409,320 ±204,800 | 34th | A06001 |
| Speak a language other than English at home | 10.9% ±0.6% , number 208,063 ±10,960 | 22.9% ±0.1% , number 74,190,755 ±244,000 | 30th | C16001 |
| Veterans (adults) | 7.4% ±0.4% , number 115,297 ±5,503 | 5.9% ±<0.1% , number 15,746,228 ±85,320 | 8th | A16002 |
| Living with a disability | 14.6% ±0.4% , number 292,123 ±8,931 | 13.7% ±<0.1% , number 46,271,455 ±126,000 | 20th | B18101 |
| Women 15–50 who had a baby in the past year | 6.4% ±0.6% , number 29,897 ±2,625 | 5.0% ±0.1% , number 4,016,759 ±44,040 | 29th | B13002 |
| Lived in the same home a year ago | 86.6% ±0.7% , number 1,735,236 ±13,450 | 88.4% ±0.1% , number 298,889,697 ±214,800 | 48th | A08001 |
| White, not Hispanic | 76.0% ±0.3% , number 1,543,463 ±5,964 | 55.0% ±<0.1% , number 187,959,031 ±58,340 | 12th | A04001 |
| Hispanic or Latino | 14.6% ±0.1% , number 296,546 ±1,044 | 20.5% ±<0.1% , number 69,975,516 ±13,270 | 16th | A04001 |
| Black, not Hispanic | 0.8% ±0.1% , number 16,275 ±2,952 | 11.7% ±<0.1% , number 40,096,453 ±106,200 | 50th | A04001 |
| Asian, not Hispanic | 1.6% ±0.2% , number 33,425 ±3,368 | 6.5% ±<0.1% , number 22,096,709 ±58,340 | 46th | A04001 |
*1 is the highest. Population is ranked among all states, and the rest among those of 1,000 people or more, whose figures can be ranked. Ranks use 5-year estimates, the only ones covering every state, so they can differ slightly from the figures here.
Income and work
Incomes close to the US
The median household income is $84,234, about the same as the US ($84,780). 9.7% of people live in poverty, and 9.5% have no health insurance, higher than the US (8.4%).
Household income
Source: ACS 2025 1-year, table A14001.
Show data
| Idaho | United States | |
|---|---|---|
| Under $25,000 | 12.3% ±0.7% , number 94,238 ±5,601 | 14.0% ±0.1% , number 18,727,548 ±88,990 |
| $25,000 to $49,999 | 15.8% ±0.8% , number 121,213 ±6,258 | 15.4% ±0.1% , number 20,665,585 ±101,400 |
| $50,000 to $74,999 | 15.7% ±0.7% , number 120,007 ±5,411 | 15.3% ±0.1% , number 20,513,565 ±88,500 |
| $75,000 to $99,999 | 14.7% ±0.6% , number 112,200 ±4,663 | 12.5% ±0.1% , number 16,814,245 ±87,520 |
| $100,000 to $149,999 | 20.8% ±0.9% , number 159,068 ±6,701 | 17.9% ±0.1% , number 24,018,984 ±99,670 |
| $150,000 to $199,999 | 9.5% ±0.5% , number 72,652 ±3,862 | 10.1% ±0.1% , number 13,521,827 ±70,660 |
| $200,000 or more | 11.2% ±0.6% , number 85,822 ±4,944 | 14.8% ±0.1% , number 19,801,668 ±84,120 |
Embed
What residents do for work
Source: ACS 2025 1-year, table A17004.
Show data
| Idaho | United States | |
|---|---|---|
| Education and health care | 22.4% ±0.8% , number 218,964 ±8,589 | 24.4% ±0.1% , number 40,862,193 ±140,800 |
| Retail trade | 11.8% ±0.8% , number 115,400 ±7,530 | 10.6% ±0.1% , number 17,781,181 ±96,660 |
| Professional and business services | 11.2% ±0.6% , number 109,621 ±5,895 | 12.8% ±0.1% , number 21,375,231 ±87,110 |
| Manufacturing | 9.7% ±0.6% , number 95,150 ±5,523 | 9.6% ±0.1% , number 16,064,394 ±91,270 |
| Construction | 9.7% ±0.6% , number 94,511 ±6,185 | 6.7% ±<0.1% , number 11,254,981 ±79,620 |
| Arts, food and lodging | 8.7% ±0.5% , number 85,424 ±5,246 | 8.9% ±0.1% , number 14,811,502 ±87,840 |
| Finance, insurance and real estate | 5.6% ±0.4% , number 55,215 ±3,941 | 6.6% ±<0.1% , number 11,025,569 ±68,570 |
| Transportation and warehousing | 4.8% ±0.4% , number 47,178 ±4,186 | 5.9% ±<0.1% , number 9,832,211 ±73,020 |
Embed
Where workers come from and go
Idaho has 830,479 jobs and 850,429 employed residents. 45,960 people commute in to work and 65,910 commute out, while 784,519 both live and work here. The most commuters come from Washington.
Most commuters come from
- Washington: 20,377
- Oregon: 5,700
- Utah: 4,928
Most residents commute to
- Washington: 29,561
- Utah: 9,356
- Oregon: 8,742
Show data
| Idaho | |
|---|---|
| Live and work here | 784,519 |
| Work here, live elsewhere | 45,960 |
| Live here, work elsewhere | 65,910 |
Embed
All the numbers
| Indicator | Idaho | US | Rank among states* | Table |
|---|---|---|---|---|
| Median household income | $84,234 ±$1,941 | $84,780 ±$215 | 25th | A14006 |
| Income per person | $41,816 ±$850 | $47,171 ±$115 | 42nd | A14024 |
| Income inequality (Gini index) | 0.443 ±0.008 | 0.482 ±0.001 | 46th | A14028 |
| Living in poverty | 9.7% ±0.7% , number 192,162 ±13,820 | 11.8% ±0.1% , number 39,264,183 ±277,400 | 35th | A13004 |
| Unemployment rate | 3.5% ±0.4% , number 35,000 ±3,608 | 4.9% ±<0.1% , number 8,574,594 ±64,350 | 41st | A17005 |
| No health insurance | 9.5% ±0.4% , number 190,423 ±8,752 | 8.4% ±<0.1% , number 28,323,306 ±152,000 | 15th | A20001 |
*1 is the highest. Population is ranked among all states, and the rest among those of 1,000 people or more, whose figures can be ranked. Ranks use 5-year estimates, the only ones covering every state, so they can differ slightly from the figures here.
Education
Fewer college degrees than the US
33.2% of adults 25 and over have a bachelor’s degree or more, lower than the US (37.4%).
Highest level of education
Source: ACS 2025 1-year, table A12001.
Show data
| Idaho | United States | |
|---|---|---|
| Less than high school | 7.4% ±0.5% , number 99,741 ±6,547 | 9.4% ±0.1% , number 22,321,002 ±120,500 |
| High school only | 26.4% ±0.8% , number 357,839 ±11,260 | 25.6% ±0.1% , number 61,096,726 ±203,400 |
| Some college | 33.1% ±0.8% , number 449,000 ±11,300 | 27.7% ±0.1% , number 65,920,977 ±173,500 |
| Bachelor’s degree | 21.8% ±0.7% , number 296,310 ±10,010 | 22.3% ±0.1% , number 53,224,312 ±196,700 |
| Graduate degree | 11.3% ±0.5% , number 153,436 ±7,234 | 15.0% ±0.1% , number 35,816,011 ±159,400 |
Embed
All the numbers
| Indicator | Idaho | US | Rank among states* | Table |
|---|---|---|---|---|
| Bachelor’s degree or more | 33.2% ±0.9% , number 449,746 ±12,350 | 37.4% ±0.1% , number 89,040,323 ±253,200 | 36th | A12001 |
| High school graduate or more | 92.6% ±1.5% , number 1,256,585 ±20,170 | 90.6% ±0.2% , number 216,058,026 ±368,200 | 21st | A12001 |
*1 is the highest. Population is ranked among all states, and the rest among those of 1,000 people or more, whose figures can be ranked. Ranks use 5-year estimates, the only ones covering every state, so they can differ slightly from the figures here.
Housing
Home values outran incomes
28.9% of households rent, lower than the US (34.7%). The median home is worth $457,800 and the median rent is $1,462. After inflation, home values rose 90% from 2015 to 2025, while household income rose 27%.
Housing costs and income, 2015 to 2025, after inflation
Source: ACS 1-year, table A10036, A18009, A14006.
Show data
| Idaho | United States | |
|---|---|---|
| Median home value | +89.5% | +39.3% |
| Median rent | +38.6% | +18.5% |
| Median household income | +27.4% | +10.9% |
Embed
Types of homes
Source: ACS 2025 1-year, table A10032.
Show data
| Idaho | United States | |
|---|---|---|
| Single-family, detached | 73.1% ±0.7% , number 620,896 ±6,199 | 60.9% ±0.1% , number 90,335,844 ±173,300 |
| Single-family, attached | 4.3% ±0.4% , number 36,342 ±3,352 | 6.4% ±<0.1% , number 9,527,703 ±51,230 |
| 2 to 4 units | 6.6% ±0.6% , number 55,778 ±4,691 | 7.5% ±0.1% , number 11,109,005 ±75,790 |
| 5 to 19 units | 5.0% ±0.5% , number 42,620 ±4,024 | 8.7% ±0.1% , number 12,829,882 ±97,590 |
| 20 or more units | 4.5% ±0.5% , number 38,526 ±3,824 | 11.1% ±0.1% , number 16,381,450 ±92,310 |
| Mobile homes and other | 6.5% ±0.4% , number 55,000 ±3,687 | 5.4% ±<0.1% , number 8,045,083 ±53,680 |
Embed
When homes were built
Source: ACS 2025 1-year, table A10055.
Show data
| Idaho | United States | |
|---|---|---|
| 2010 or later | 24.4% ±1.0% , number 186,461 ±7,909 | 15.1% ±0.1% , number 20,257,912 ±101,300 |
| 2000 to 2009 | 18.5% ±0.8% , number 141,201 ±6,233 | 13.8% ±0.1% , number 18,535,840 ±92,260 |
| 1980 to 1999 | 21.7% ±0.8% , number 166,161 ±6,394 | 24.1% ±0.1% , number 32,332,570 ±118,900 |
| 1960 to 1979 | 20.4% ±0.9% , number 156,470 ±6,952 | 22.9% ±0.1% , number 30,726,302 ±110,000 |
| Before 1960 | 15.0% ±0.7% , number 114,907 ±5,697 | 24.0% ±0.1% , number 32,210,798 ±121,500 |
Embed
All the numbers
| Indicator | Idaho | US | Rank among states* | Table |
|---|---|---|---|---|
| Housing units | 849,162 | – | – | A10001 |
| Households | 765,200 ±5,511 | – | – | A10008 |
| People per household | 2.59 ±0.02 | 2.49 ±0.01 | 5th | A10003 |
| Households that rent | 28.9% ±0.9% , number 220,973 ±6,953 | 34.7% ±0.1% , number 46,551,688 ±193,200 | 44th | A10060 |
| Vacant homes | 9.9% ±0.7% , number 83,962 ±5,546 | 9.6% ±0.1% , number 14,165,545 ±137,100 | 25th | A10047, A10060 |
| Median gross rent | $1,462 ±$31 | $1,557 ±$4 | 25th | A18009 |
| Median home value | $457,800 ±$6,135 | $371,100 ±$646 | 13th | A10036 |
| Renters paying 30% or more of income | 45.7% ±2.4% , number 101,068 ±6,141 | 48.3% ±0.2% , number 22,486,693 ±122,100 | 35th | A18002 |
| Owners paying 30% or more of income | 21.5% ±1.0% , number 117,274 ±5,895 | 24.2% ±0.1% , number 21,201,943 ±93,050 | 24th | A10040 |
| Homes built before 1960 | 15.0% ±0.7% , number 114,907 ±5,697 | 24.0% ±0.1% , number 32,210,798 ±121,500 | 35th | A10055 |
*1 is the highest. Population is ranked among all states, and the rest among those of 1,000 people or more, whose figures can be ranked. Ranks use 5-year estimates, the only ones covering every state, so they can differ slightly from the figures here.
Getting around
A driving state with short commutes
71.8% of workers drive alone and 12.8% work from home. 29.0% of those who travel to work spend 30 minutes or more getting there, and 4.3% of households have no vehicle.
How people get to work
Source: ACS 2025 1-year, table A09005.
Show data
| Idaho | United States | |
|---|---|---|
| Drive alone | 71.8% ±1.0% , number 689,018 ±12,050 | 69.8% ±0.1% , number 115,297,377 ±192,900 |
| Carpool | 10.5% ±0.7% , number 100,636 ±6,913 | 8.9% ±0.1% , number 14,712,170 ±97,240 |
| Public transit | 0.6% ±0.1% , number 5,945 ±1,352 | 4.3% ±<0.1% , number 7,100,386 ±63,330 |
| Walk | 2.2% ±0.3% , number 20,824 ±2,485 | 2.4% ±<0.1% , number 4,016,469 ±41,070 |
| Work from home | 12.8% ±0.6% , number 122,998 ±6,138 | 12.9% ±0.1% , number 21,288,393 ±105,700 |
| Other | 2.0% ±0.3% , number 19,645 ±2,618 | 1.7% ±<0.1% , number 2,799,658 ±41,510 |
Embed
Time spent getting to work
Source: ACS 2025 1-year, table B09001.
Show data
| Idaho | United States | |
|---|---|---|
| Under 10 minutes | 18.4% ±1.0% , number 154,084 ±8,285 | 12.0% ±0.1% , number 17,199,225 ±93,440 |
| 10 to 19 minutes | 34.0% ±1.1% , number 284,430 ±10,260 | 27.8% ±0.1% , number 40,059,540 ±137,700 |
| 20 to 29 minutes | 18.6% ±0.8% , number 155,352 ±7,057 | 21.0% ±0.1% , number 30,221,743 ±111,100 |
| 30 to 39 minutes | 14.7% ±0.8% , number 123,130 ±6,898 | 17.1% ±0.1% , number 24,659,138 ±103,800 |
| 40 to 59 minutes | 8.4% ±0.5% , number 70,419 ±4,426 | 12.6% ±0.1% , number 18,104,709 ±97,070 |
| 60 minutes or more | 5.8% ±0.5% , number 48,653 ±4,464 | 9.5% ±0.1% , number 13,681,705 ±84,440 |
Embed
Vehicles per household
Source: ACS 2025 1-year, table A10030.
Show data
| Idaho | United States | |
|---|---|---|
| None | 4.3% ±0.4% , number 32,975 ±3,276 | 8.8% ±0.1% , number 11,781,997 ±77,240 |
| One | 25.1% ±0.9% , number 191,866 ±7,339 | 33.1% ±0.1% , number 44,424,682 ±160,700 |
| Two | 37.1% ±1.1% , number 283,669 ±8,495 | 36.0% ±0.1% , number 48,200,889 ±176,800 |
| Three or more | 33.5% ±1.0% , number 256,690 ±7,961 | 22.1% ±0.1% , number 29,655,854 ±113,300 |
Embed
All the numbers
| Indicator | Idaho | US | Rank among states* | Table |
|---|---|---|---|---|
| Drive to work alone | 71.8% ±1.0% , number 689,018 ±12,050 | 69.8% ±0.1% , number 115,297,377 ±192,900 | 22nd | A09005 |
| Take public transit | 0.6% ±0.1% , number 5,945 ±1,352 | 4.3% ±<0.1% , number 7,100,386 ±63,330 | 40th | A09005 |
| Work from home | 12.8% ±0.6% , number 122,998 ±6,138 | 12.9% ±0.1% , number 21,288,393 ±105,700 | 26th | A09005 |
| Commute 30 minutes or more | 29.0% ±1.0% , number 242,202 ±9,333 | 39.2% ±0.1% , number 56,445,552 ±165,300 | 43rd | B09001 |
| Households with no vehicle | 4.3% ±0.4% , number 32,975 ±3,451 | 8.8% ±<0.1% , number 11,781,997 ±64,240 | 51st | A10030 |
*1 is the highest. Population is ranked among all states, and the rest among those of 1,000 people or more, whose figures can be ranked. Ranks use 5-year estimates, the only ones covering every state, so they can differ slightly from the figures here.
Places
The largest cities in Idaho
Population, from the latest estimates available. Figures cover the whole of each place.
Largest cities
- Boise City: 238,422
- Meridian: 142,991
- Nampa: 120,405
- Caldwell: 76,621
- Idaho Falls: 71,789
- Pocatello: 57,635
- Coeur d'Alene: 56,447
- Twin Falls: 54,164
Every county and place in Idaho
Find any county, city, town, metro area, ZIP code, school district or district in Idaho.
Counties
Each of the 44 counties with its population, from ACS 2020–2024 5-year estimates.
- Ada County518,935
- Adams County4,744
- Bannock County89,454
- Bear Lake County6,650
- Benewah County10,142
- Bingham County49,664
- Blaine County24,951
- Boise County8,273
- Bonner County51,049
- Bonneville County129,523
- Boundary County13,172
- Butte County2,684
- Camas County1,124
- Canyon County250,790
- Caribou County7,162
- Cassia County25,483
- Clark County849
- Clearwater County9,012
- Custer County4,470
- Elmore County29,321
- Franklin County15,056
- Fremont County13,943
- Gem County20,614
- Gooding County15,931
- Idaho County17,432
- Jefferson County33,154
- Jerome County25,173
- Kootenai County181,996
- Latah County41,049
- Lemhi County8,249
- Lewis County3,682
- Lincoln County5,358
- Madison County54,618
- Minidoka County22,208
- Nez Perce County42,697
- Oneida County4,768
- Owyhee County12,503
- Payette County26,771
- Power County8,133
- Shoshone County13,785
- Teton County12,425
- Twin Falls County93,734
- Valley County12,389
- Washington County11,142
Cities, towns and other places
Each of the 232 with its population, from ACS 2020–2024 5-year estimates. Census-designated places are communities without a local government of their own, drawn by the Census Bureau so they can be counted.
- Aberdeen2,564
- Acequia153
- Albion376
- American Falls4,712
- Ammon19,064
- Arbon Valley562
- Arco850
- Arimo351
- Ashton1,417
- Athol777
- Avimor586
- Bancroft250
- Basalt569
- Bellevue2,588
- Bennington92
- Blackfoot12,782
- Blanchard651
- Bliss229
- Bloomington255
- Boise City237,242
- Bonners Ferry2,669
- Bovill107
- Bruneau82
- Buhl4,673
- Burley11,958
- Butte City95
- Caldwell66,516
- Cambridge324
- Carey1,196
- Cascade1,118
- Castleford183
- Challis854
- Chubbuck16,126
- Clark Fork990
- Clifton788
- Coeur d'Alene56,447
- Conkling Park123
- Coolin24
- Cottonwood1,131
- Council871
- Craigmont509
- Crouch214
- Culdesac411
- Dalton Gardens2,496
- Dayton500
- De Smet135
- Deary458
- Declo477
- Dietrich421
- Donnelly195
- Dover792
- Downey803
- Driggs2,925
- Drummond3
- Dubois585
- Eagle32,855
- East Hope265
- Eden421
- Elk City202
- Elk River124
- Emmett8,275
- Fairfield499
- Ferdinand162
- Fernan Lake Village212
- Filer2,925
- Firth429
- Fort Hall2,654
- Franklin1,034
- Fruitland6,663
- Gannett284
- Garden City12,654
- Garden Valley438
- Genesee1,265
- Georgetown739
- Glenns Ferry1,438
- Gooding3,778
- Grace1,349
- Grand View472
- Grangeville3,515
- Greenleaf1,482
- Groveland1,422
- Hagerman1,276
- Hailey9,665
- Hamer59
- Hammett319
- Hansen1,225
- Harrison190
- Hauser932
- Hayden16,338
- Hayden Lake834
- Hazelton977
- Heyburn3,693
- Hidden Springs3,378
- Hollister347
- Homedale3,069
- Hope112
- Horseshoe Bend758
- Huetter212
- Idaho City581
- Idaho Falls67,725
- Inkom936
- Iona2,984
- Irwin236
- Island Park170
- Jerome12,930
- Juliaetta672
- Kamiah1,084
- Kellogg2,307
- Kendrick327
- Ketchum3,594
- Kimberly5,111
- Kooskia687
- Kootenai1,022
- Kuna27,158
- Laclede406
- Lapwai1,021
- Lava Hot Springs218
- Leadore135
- Letha109
- Lewiston34,651
- Lewisville453
- Lincoln4,002
- Lost River55
- Lowman46
- Mackay602
- Malad City2,601
- Malta346
- Marsing1,306
- McCall3,946
- McCammon909
- Melba617
- Menan876
- Meridian130,138
- Middleton10,649
- Midvale347
- Minidoka179
- Montpelier2,694
- Moore228
- Moreland1,326
- Moscow26,286
- Mountain Home16,493
- Mountain Home AFB3,219
- Moyie Springs1,378
- Mud Lake491
- Mullan890
- Murphy170
- Murtaugh129
- Nampa110,319
- New Meadows411
- New Plymouth1,794
- Newdale525
- Nezperce522
- Notus573
- Oakley830
- Oldtown428
- Onaway263
- Orofino3,260
- Osburn1,620
- Oxford49
- Paris562
- Parker607
- Parkline91
- Parma1,928
- Paul1,586
- Payette8,536
- Peck194
- Pierce360
- Pinehurst2,120
- Placerville30
- Plummer1,162
- Pocatello57,635
- Ponderay1,534
- Post Falls43,391
- Potlatch922
- Preston5,928
- Priest River1,778
- Princeton25
- Rathdrum10,874
- Reubens68
- Rexburg40,543
- Richfield586
- Rigby5,404
- Riggins263
- Ririe1,079
- Riverside867
- Roberts609
- Robie Creek1,213
- Rockford492
- Rockford Bay336
- Rockland228
- Rupert6,190
- Salmon3,203
- Sandpoint9,637
- Shelley5,092
- Shoshone1,911
- Silverton652
- Smelterville668
- Smiths Ferry66
- Soda Springs3,158
- Spencer19
- Spirit Lake1,972
- St. Anthony3,911
- St. Charles145
- St. Maries2,915
- Stanley319
- Star14,745
- State Line9
- Stites165
- Sugar City2,122
- Sun Valley1,460
- Swan Valley281
- Sweetwater163
- Tensed71
- Teton877
- Tetonia426
- Troy960
- Twin Falls54,164
- Tyhee1,568
- Ucon1,606
- Victor3,067
- Viola30
- Wallace1,027
- Wardner281
- Weippe320
- Weiser5,935
- Wendell2,981
- Weston569
- White Bird57
- Wilder2,074
- Winchester302
- Worley230
- Yellow Pine17
Metro and micro areas
Each of the 17 that reach into Idaho, with its whole population, from ACS 2020–2024 5-year estimates. Metro and micro areas are counties tied together by commuting, drawn by the Office of Management and Budget.
- Blackfoot, ID Micro Area49,664
- Boise City, ID Metro Area811,115
- Brigham City, UT-ID Micro Area66,014
- Burley, ID Micro Area47,691
- Coeur d'Alene, ID Metro Area181,996
- Hailey, ID Micro Area31,433
- Idaho Falls, ID Metro Area165,361
- Jackson, WY-ID Micro Area35,821
- Lewiston, ID-WA Metro Area65,164
- Logan, UT-ID Metro Area155,102
- Moscow, ID Micro Area41,049
- Mountain Home, ID Micro Area29,321
- Ontario, OR-ID Micro Area58,725
- Pocatello, ID Metro Area89,454
- Rexburg, ID Micro Area68,561
- Sandpoint, ID Micro Area51,049
- Twin Falls, ID Metro Area118,907
ZIP codes
Each of the 277 with people in it, by the town it's centered in, from ACS 2020–2024 5-year estimates. These are the Census Bureau's ZIP Code Tabulation Areas, which follow the Postal Service's ZIP codes as closely as census blocks allow.
- 83201Chubbuck39,902
- 83202Fort Hall24,513
- 83203Fort Hall38
- 83204Pocatello18,580
- 83209Pocatello937
- 83210Aberdeen3,843
- 832116,743
- 83212388
- 832131,349
- 83214Arimo586
- 8321515
- 83217Bancroft712
- 83218Basalt569
- 83220Bennington138
- 83221Moreland29,081
- 83223Bloomington255
- 832262,100
- 83227200
- 83228Oxford1,134
- 83232Dayton562
- 83233St. Charles147
- 83234Downey1,417
- 832351
- 832361,840
- 83237Franklin1,567
- 83238129
- 83239Georgetown887
- 83241Grace2,488
- 8324349
- 83244386
- 83245Inkom2,321
- 83246Lava Hot Springs821
- 83250McCammon2,179
- 832511,443
- 83252Malad City4,707
- 83253112
- 83254Montpelier3,792
- 83255Moore1,222
- 83261Paris562
- 832621,090
- 83263Preston9,940
- 83271Rockland415
- 83272St. Charles219
- 83274Shelley11,699
- 832764,155
- 83277164
- 83278454
- 83281Oxford148
- 83283185
- 8328580
- 83286Weston1,668
- 83287St. Charles255
- 83301Hollister63,592
- 8330235
- 83311Albion903
- 83312278
- 83313Gannett3,692
- 83314Bliss670
- 83316Buhl10,456
- 83318Burley19,459
- 83320Carey1,600
- 83321482
- 83322Fairfield16
- 83323Albion1,984
- 83324Dietrich851
- 83325Eden944
- 833271,037
- 83328Filer6,320
- 83330Gooding7,347
- 83332Hagerman2,569
- 83333Hailey12,682
- 83334Hansen2,227
- 83335Hazelton2,335
- 83336Burley6,075
- 8333729
- 83338Jerome21,944
- 833405,325
- 83341Kimberly9,531
- 833421,231
- 83344Murtaugh1,234
- 83346Oakley1,451
- 83347Paul3,465
- 83348Gannett124
- 83349Richfield1,211
- 83350Acequia12,671
- 83352Shoshone3,317
- 83353Sun Valley1,450
- 83354Sun Valley10
- 83355Wendell5,469
- 83401Iona47,972
- 83402Idaho Falls29,994
- 83404Ammon27,500
- 83406Ammon19,696
- 83414502
- 83420Drummond2,580
- 83421Ashton220
- 834223,847
- 83423Spencer729
- 83424Tetonia168
- 83425622
- 834272,931
- 83428Irwin576
- 83429Island Park628
- 83431Lewisville1,045
- 83433Island Park36
- 83434Menan1,816
- 83435600
- 83436Newdale778
- 83438Parker327
- 83440Rexburg51,421
- 83442Ririe25,609
- 834431,364
- 83444Roberts1,261
- 83445Parker7,975
- 83446Spencer24
- 83448Sugar City3,365
- 83449Swan Valley273
- 83450Mud Lake1,207
- 83451Newdale993
- 83452Tetonia2,237
- 83454Ucon409
- 83455Victor6,173
- 83460Rexburg56
- 83462Salmon667
- 8346366
- 83464296
- 83465104
- 83466197
- 83467Salmon6,590
- 83468191
- 8346925
- 8350137,520
- 83520Orofino144
- 835222,692
- 83523Craigmont797
- 83524Culdesac1,050
- 83525Elk City296
- 83526Ferdinand242
- 83530Grangeville6,406
- 83533Cottonwood121
- 83535Juliaetta1,143
- 83536Kamiah4,444
- 83537Kendrick1,125
- 835392,427
- 83540Sweetwater2,096
- 83541Peck940
- 83542147
- 83543Nezperce739
- 83544Orofino6,798
- 83545Peck458
- 83546Pierce422
- 83547Riggins241
- 83548Reubens145
- 83549Riggins587
- 83552Stites806
- 83553Weippe1,038
- 83554White Bird350
- 83555493
- 83604583
- 83605Caldwell41,325
- 83607Notus35,491
- 83610992
- 836113,329
- 836122,085
- 83615Donnelly1,452
- 83616Eagle35,413
- 83617Emmett19,058
- 83619Fruitland8,823
- 83622Garden Valley2,132
- 83623Hammett1,521
- 83624Grand View1,349
- 83626Greenleaf1,935
- 83627Hammett575
- 83628Homedale5,006
- 83629Horseshoe Bend1,749
- 83631Idaho City1,916
- 83632704
- 83633Glenns Ferry502
- 83634Kuna36,286
- 83636Letha109
- 83637226
- 836387,750
- 836393,311
- 83641Melba4,061
- 83642Meridian62,279
- 83643Council166
- 83644Middleton16,293
- 83645970
- 83646Meridian76,023
- 8364722,952
- 83648Mountain Home AFB3,219
- 83650464
- 83651Nampa38,121
- 836541,763
- 83655New Plymouth5,748
- 83656Notus560
- 83657156
- 83660Parma6,434
- 8366111,105
- 83666Placerville30
- 83669Star16,827
- 83670Horseshoe Bend752
- 83672Weiser9,176
- 83676Wilder5,105
- 8367717
- 83686Nampa60,993
- 83687Nampa43,135
- 83702Boise City24,163
- 83703Boise City17,583
- 83704Boise City42,719
- 83705Boise City26,830
- 83706Boise City35,524
- 83709Boise City58,928
- 83712Robie Creek9,071
- 83713Boise City31,549
- 83714Hidden Springs27,564
- 8371621,402
- 83801Athol7,553
- 83802124
- 83803650
- 83804Blanchard2,092
- 838059,174
- 83806Bovill172
- 83808132
- 83809393
- 838101,412
- 83811Clark Fork1,997
- 8381211
- 83813Laclede1,249
- 83814Fernan Lake Village26,059
- 83815Coeur d'Alene41,405
- 83821Coolin259
- 83822Oldtown2,442
- 83823Deary1,559
- 83824De Smet452
- 83825Dover226
- 8382663
- 83827Elk River154
- 8383045
- 83832Genesee1,961
- 83833Harrison1,365
- 83834Princeton189
- 83835Hayden Lake24,238
- 83836East Hope980
- 83837Kellogg3,203
- 83839Smelterville1,287
- 83840Kootenai653
- 83841Laclede492
- 83842St. Maries141
- 83843Moscow26,591
- 83844Moscow2,971
- 83845Moyie Springs2,202
- 83846Mullan918
- 838471,714
- 83848315
- 83849Osburn2,086
- 83850Wardner2,704
- 83851Plummer2,113
- 83852Ponderay1,515
- 83854Post Falls54,851
- 83855Onaway2,260
- 838566,885
- 83857Princeton1,074
- 83858Rathdrum20,137
- 83860Dover7,806
- 83861St. Maries7,275
- 83864Kootenai20,514
- 83866352
- 83867Silverton652
- 83868Smelterville906
- 83869Spirit Lake5,504
- 83870De Smet421
- 83871Troy2,240
- 83872Viola818
- 83873Silverton1,569
- 8387476
- 83876Worley1,563
School districts
Each of the 115 with people in it, from ACS 2020–2024 5-year estimates.
- Aberdeen School District 584,039
- American Falls Joint School District 3817,339
- Arbon Elementary School District 383379
- Avery School District 394335
- Basin School District 724,161
- Bear Lake County School District 336,384
- Blackfoot School District 5523,692
- Blaine County School District 6124,951
- Bliss Joint School District 234554
- Boise City Independent School District 1212,323
- Bonneville Joint School District 9363,294
- Boundary County School District 10113,172
- Bruneau-Grand View Joint School District 3652,322
- Buhl Joint School District 4129,483
- Butte County Joint School District 1112,596
- Caldwell School District 13236,871
- Camas County School District 1211,124
- Cambridge Joint School District 4321,674
- Cascade School District 4223,032
- Cassia County Joint School District 15125,243
- Castleford School District 4171,439
- Challis Joint School District 1812,867
- Clark County School District 161849
- Coeur d'Alene School District 27188,435
- Cottonwood Joint School District 2423,041
- Council School District 132,268
- Culdesac Joint School District 342953
- Dietrich School District 314821
- Emmett Independent School District 22120,614
- Filer School District 4137,850
- Firth School District 594,008
- Fremont County Joint School District 21512,641
- Fruitland School District 37310,297
- Garden Valley School District 712,358
- Genesee Joint School District 2822,120
- Glenns Ferry Joint School District 1922,556
- Gooding Joint School District 2317,396
- Grace Joint School District 1482,891
- Hagerman Joint School District 2332,639
- Hansen School District 4152,182
- Highland Joint School District 3051,492
- Homedale Joint School District 3706,166
- Horseshoe Bend School District 731,754
- Idaho Falls School District 9163,688
- Jefferson County Joint School District 25128,220
- Jerome Joint School District 26121,978
- Kamiah Joint School District 3044,128
- Kellogg Joint School District 3919,047
- Kendrick Joint School District 2831,859
- Kimberly School District 4149,263
- Kootenai Joint School District 2742,042
- Kuna Joint School District 338,009
- Lake Pend Oreille School District 8436,467
- Lakeland Joint School District 27236,720
- Lapwai School District 3413,080
- Lewiston Independent School District 34037,403
- Mackay Joint School District 1821,804
- Madison School District 32149,923
- Marsh Valley Joint School District 217,323
- Marsing Joint School District 3635,863
- McCall-Donnelly Joint School District 4219,491
- Meadows Valley School District 111,337
- Melba Joint School District 1363,354
- Meridian Joint School District 2271,490
- Middleton School District 13423,922
- Midvale School District 433998
- Minidoka County Joint School District 33122,816
- Moscow School District 28130,024
- Mountain Home School District 19326,461
- Mountain View School District 24410,563
- Mullan School District 392918
- Murtaugh Joint School District 4181,082
- Nampa School District 131105,058
- New Plymouth School District 3725,327
- Nezperce Joint School District 302972
- North Gem School District 149700
- Notus School District 1352,129
- Oneida County School District 3514,768
- Orofino Joint School District 1719,260
- Parma School District 1375,490
- Payette Joint School District 37111,298
- Pleasant Valley Elementary School District 364130
- Plummer-Worley Joint School District 444,504
- Pocatello School District 2582,117
- Post Falls School District 27352,596
- Potlatch School District 2853,774
- Prairie Elementary School District 19171
- Preston Joint School District 20111,285
- Richfield School District 3161,211
- Ririe Joint School District 2523,230
- Rockland School District 382415
- Salmon River School District 2431,372
- Salmon School District 2917,545
- Shelley Joint School District 6011,201
- Shoshone Joint School District 3123,304
- Snake River School District 527,669
- Soda Springs Joint School District 1504,235
- South Lemhi School District 292591
- St. Maries Joint School District 417,054
- Sugar-Salem Joint School District 3225,997
- Swan Valley Elementary School District 92933
- Teton County School District 40112,425
- Three Creek Joint Elementary School District 41635
- Troy School District 2872,282
- Twin Falls School District 41162,178
- Valley School District 2623,120
- Vallivue School District 13965,429
- Wallace School District 3934,498
- Weiser School District 4319,019
- Wendell School District 2325,316
- West Bonner County School District 8314,356
- West Jefferson School District 2532,360
- West Side Joint School District 2023,394
- Whitepine Joint School District 2881,854
- Wilder School District 1333,882
Congressional districts
As drawn for the 119th Congress (2025–2027).
- Congressional District 1986,280
- Congressional District 2947,982
State senate districts
The upper chamber’s districts, as drawn in 2024.
- State Senate District 157,689
- State Senate District 254,010
- State Senate District 357,874
- State Senate District 453,029
- State Senate District 556,554
- State Senate District 654,932
- State Senate District 754,672
- State Senate District 854,453
- State Senate District 955,838
- State Senate District 1062,855
- State Senate District 1154,142
- State Senate District 1262,089
- State Senate District 1355,824
- State Senate District 1457,512
- State Senate District 1552,678
- State Senate District 1651,835
- State Senate District 1751,492
- State Senate District 1854,113
- State Senate District 1954,013
- State Senate District 2058,913
- State Senate District 2158,054
- State Senate District 2255,496
- State Senate District 2355,901
- State Senate District 2454,714
- State Senate District 2556,075
- State Senate District 2655,482
- State Senate District 2752,459
- State Senate District 2854,037
- State Senate District 2953,734
- State Senate District 3052,348
- State Senate District 3156,195
- State Senate District 3252,644
- State Senate District 3353,689
- State Senate District 3454,618
- State Senate District 3554,299
State house districts
The lower chamber’s districts, as drawn in 2024.
- State House District 157,689
- State House District 254,010
- State House District 357,874
- State House District 453,029
- State House District 556,554
- State House District 654,932
- State House District 754,672
- State House District 854,453
- State House District 955,838
- State House District 1062,855
- State House District 1154,142
- State House District 1262,089
- State House District 1355,824
- State House District 1457,512
- State House District 1552,678
- State House District 1651,835
- State House District 1751,492
- State House District 1854,113
- State House District 1954,013
- State House District 2058,913
- State House District 2158,054
- State House District 2255,496
- State House District 2355,901
- State House District 2454,714
- State House District 2556,075
- State House District 2655,482
- State House District 2752,459
- State House District 2854,037
- State House District 2953,734
- State House District 3052,348
- State House District 3156,195
- State House District 3252,644
- State House District 3353,689
- State House District 3454,618
- State House District 3554,299
PUMAs
Public Use Microdata Areas: areas of 100,000 people or more that the state draws from census tracts, for the Census Bureau’s microdata.
- Ada (North), Payette, Canyon (North), Gem & Washington Counties–Eagle City PUMA146,126
- Ada County (Central)–Meridian (Northeast) & Boise (Far West) Cities PUMA137,854
- Ada County (Northeast)–Boise (North & West) & Garden City Cities PUMA110,897
- Ada County (South)–Boise (South) & Kuna Cities PUMA132,668
- Bingham (Outside Fort Hall AIR), Madison, Jefferson, Fremont & Teton Counties PUMA161,203
- Bonner, Latah, Shoshone, Boundary, Benewah & Kootenai (Southeast) Counties PUMA134,871
- Bonneville County–Idaho Falls City PUMA129,523
- Canyon (East) & Ada (West) Counties–Nampa (Central & East) & Meridian (West) Cities PUMA167,300
- Canyon (South) & Owyhee Counties–Caldwell & Nampa (South & West) Cities PUMA145,910
- Central Idaho–Lewiston City & Nez Perce Reservation PUMA114,481
- Elmore, Jerome, Blaine, Minidoka, Gooding, Lincoln & Camas Counties PUMA124,066
- Kootenai County (Northeast)–Coeur d'Alene, Post Falls & Hayden Cities PUMA176,322
- Southeast Idaho–Pocatello, Chubbuck Cities & Fort Hall Reservation PUMA133,824
- Twin Falls & Cassia Counties–Twin Falls City PUMA119,217
Urban areas
Each that reaches into Idaho, with its whole population. Urban areas are the densely settled land the Census Bureau draws after each census, whatever the city lines.
- Blackfoot, ID14,826
- Boise City, ID444,814
- Burley, ID18,421
- Coeur d'Alene, ID128,587
- Emmett, ID11,479
- Hailey, ID12,594
- Idaho Falls, ID109,051
- Jerome, ID13,402
- Ketchum, ID6,389
- Kuna, ID26,037
- Lewiston, ID–WA55,607
- McCall, ID3,890
- Middleton, ID10,593
- Moscow, ID26,752
- Mountain Home, ID18,181
- Nampa, ID191,125
- Ontario–Payette, OR–ID28,680
- Pocatello, ID74,235
- Rathdrum, ID10,014
- Rexburg, ID42,254
- Rigby, ID10,967
- Rupert, ID6,607
- Sandpoint, ID13,839
- Shelley, ID5,195
- Star, ID12,152
- Twin Falls, ID61,569
- Weiser, ID–OR5,960
Tribal areas
Each that reaches into Idaho, with its whole population.
Turn Idaho into your planning report.
Social Explorer Studio builds an editable profile of any place, with tables and charts beside the county and state, and exports to Word, PDF and Excel.
Questions about Idaho
What is the population of Idaho?
2,029,733 people, according to the ACS 2025 1-year estimates, which the Census Bureau adjusts to match its own population estimate. That’s the 38th largest of the 50 states and DC.
What is the FIPS code for Idaho?
16. Every county’s and place’s FIPS code in Idaho starts with it. The Census Bureau’s full geographic identifier (GEOID) is 0400000US16.
What is the largest city in Idaho?
Boise City, with 238,422 people. Other large cities here include Meridian, Nampa and Caldwell.
What is the median household income in Idaho?
$84,234 (±$1,941), according to the ACS 2025 1-year estimates, about the same as the US ($84,780).
What is the median age in Idaho?
37.9 years (±0.3), according to the ACS 2025 1-year estimates, lower than the US (39.5).
How much does housing cost in Idaho?
Idaho’s median home value is $457,800 (±$6,135) and its median gross rent is $1,462 (±$31) a month, according to the ACS 2025 1-year estimates. 45.7% (±2.4%) of its renters pay 30% or more of their income on rent.
Is Idaho growing?
Idaho’s population grew 22.6%, from 1,654,930 in 2015 to 2,029,733 in 2025, according to the ACS 1-year estimates.
Where do people who work in Idaho live?
784,519 of its 830,479 jobs are held by people who live here. Of those who commute in, the most come from Washington, Oregon, Utah.
Where does this census data come from?
The U.S. Census Bureau’s American Community Survey, through Social Explorer’s tables: the latest 1-year estimates where they exist, for the most recent numbers, and 5-year estimates otherwise. Each table lists its code, so you can find it again.
Is this data free to use?
Yes. You can read it, cite it, download the CSV and embed the charts, with no account. To map other variables, compare your own areas or build a report, see Social Explorer’s plans in a live demo.
Sources and how to cite
American Community Survey 2025 1-year estimates, or 2020–2024 5-year estimates where noted, U.S. Census Bureau, from Social Explorer’s tables A00001, A00002, A01004, A04001, A06001, A08001, A09005, A10001, A10003, A10008, A10030, A10036, A10040, A10047, A10055, A10060, A12001, A13004, A14006, A14024, A14028, A16002, A17005, A18002, A18009, A20001, B02002, B09001, B13002, B18101, C16001. Maps by census tract use 2020–2024 5-year estimates, since the 1-year survey doesn’t cover tracts. Commuting: LEHD LODES 2023. These are estimates from a sample, each with its margin of error. Data retrieved November 14, 2026. How these profiles are made.
U.S. Census Bureau, American Community Survey 2025 1-year estimates, or 2020–2024 5-year estimates where noted, via Social Explorer. “Idaho.” https://www.socialexplorer.com/places/idaho. Accessed November 14, 2026.